

 下载:
下载:


-
Numerous adverse health outcomes, including neonatal deaths, post-neonatal mortality and many adult-onset non-communicable diseases, are reported to be related to birth weight [1]. Epidemiologic studies have proved that multiple factors can affect birth weight, including maternal life-style factors and objective environmental factors [2]. However, the mechanism for effects of abnormal birth weight has not been fully elucidated.
Increasing studies have paid attention to the relationship between birth weight and exposure to environmental conditions during pregnancy, and found that adverse changes in the intrauterine environment, such as air pollution and persistent organic pollutants, can affect birth weight [3, 4]. In recent years, with the rapid climate change, it was reported that the effect of weather changes can increase the risk of low birth weight [5], while low birth weight can cause public health problems, such as the increasing incidence of diabetes [6]. A study surveyed two million people in Taiwan China and found that newborns delivered by women exposed to extreme temperatures had greater risks for low birth weight [7]. Moreover, a study covering two mother-child cohorts suggested that increased humidity was associated with decreased birth weight [8]. These findings indicated that weather conditions may influence birth weight.
G protein-coupled receptor 61 (GPR61) is a member of the G protein-coupled receptor family, which is the largest and most functionally diverse superfamily of cell surface receptors in mammals and plays a critical role in cell signal transduction [9, 10]. The GPR61 gene sequence is highly similar to that of the biogenic amine receptor, which plays an important role in energy absorption and metabolism [11]. Although the function of GPR61 has not been fully elucidated, the relationship between GPR61 and body weight has been studied continuously [11, 12]. Nambu and colleagues found that the risk of obesity in GPR61-deficient mice was higher than that of wild-type mice [11]. Additionally, a meta-analysis including 35,668 children in the discovery phase from 20 studies and 11,873 children in the replication phase of 13 studies showed that childhood body mass index (BMI, kg/m2) was related to mutations in the GPR61 genotype [12]. However, there is no epidemiological evidence for the relationship between birth weight and GPR61. Prenatal weather condition can affect maternal and infant methylation status, which in turn, affects protein expression [13]. Notably, the methylation levels of the GPR61 promoter can be affected by air pollution [14]. However, the association between weather and GPR61 methylation remains unclear. Here, we speculated that GPR61 methylation may be involved in the changes in birth weight related to weather conditions during pregnancy. A retrospective pilot study based on Houzhai Center Hospital data during 2010–2012 was conducted in Zhengzhou to evaluate the relationships among weather, GPR61 methylation levels, and birth weight.
-
Houzhai town (size = 83 square kilometers) is located in the south of Zhengzhou city [the coordinate of latitude and longitude: (113.59, 34.67)] and has 55,000 residents. We recruited pregnant women who delivered from January 2010 to January 2012 in the Houzhai Center Hospital by cluster sampling. Houzhai Center Hospital is a government hospital in Houzhai town and serves most local residents [15]. Basic maternal information including maternal age, height, education background, disease history during pregnancy, folic acid intake from three months before pregnancy to delivery, active and passive smoking status during pregnancy and pre-pregnancy weight were collected by trained investigators through face-to-face interviews within one week after delivery. Maternal pregestational BMI was calculated by dividing maternal pre-pregnancy weight by the square of the height, and maternal net weight gain during pregnancy was calculated by the difference between maternal pre-pregnancy and delivery weight. Information including the sex of the newborn, neonatal weight, height, and gestational week at birth was obtained from the medical record.
The inclusion and exclusion criteria were described previously [15]. Briefly, we recruited Han minorities, being > 16 years of age, living in the locality during pregnancy, and excluded women who were exposed to occupational toxic substances (such as heavy metals, organic compounds, acids and alkaline chemicals) during pregnancy, actively smoked during pregnancy (smoking refers to at least once a day for a month), abused drugs, had hepatitis B infection, hypertension or diabetes during pregnancy. Women with multiple births, stillbirths and births at gestational weeks of < 28 or > 44 weeks were excluded [16]. A total of 582 mothers met the inclusion criteria in this study. Fifteen participants who had incomplete information, lacked blood samples, or had no neonatal weight data were excluded. Finally, 567 (97.42%) mothers were enrolled. All subjects provided written informed consent in accordance with the requirements of the Institutional Review Board at Zhengzhou University.
-
Meteorological data on daily mean temperature (degrees Celsius, °C), atmospheric pressure (hPa) and relative humidity (%), 1-h maximum temperature (°C), 1-h minimum temperature (°C), daily sunlight duration (h), and 24-h precipitation (mm) from one monitoring station located in Zhengzhou city were obtained from the China Meteorological Data Sharing Service System (
http://data.cma.cn/ ). We calculated the daily temperature range with maximum and minimum temperatures (maximum temperature − minimum temperature) [17]. The monitoring station data represents the exposure level in Zhengzhou city. The participants’ residences were an average of 35 km from the meteorological monitoring station. In addition, ambient air pollutants data were obtained from the Environmental Science Research Institute in Zhengzhou University and the Environmental Monitoring Center Station in Zhengzhou, which collected 24-h average concentrations for particulate matter 10 (PM10), sulfur dioxide (SO2), and nitrogen dioxide (NO2) through an automated data reporting system during the study period from two stations located in Houzhai town. The exposure levels of air pollution for each individual were represented by the nearest monitoring station data. The permanent residences of the participants were an average of 2.9 km from the nearest air pollution monitoring station. No exposure data were missing. After confirming the pregnancy status using results from an ultrasonic examination performed during the first trimester of pregnancy, the conception date was determined according to the last menstrual period. We estimated the exposure level for each individual during the entire pregnancy by averaging the daily meteorology and air pollutant data. Then, the average daily mean temperature (T), atmospheric pressure (AP), and relative humidity (RH); daily sunlight duration (SSD); daily temperature range (DTR); 24-h precipitation, and PM10 were estimated to explore the effect of weather fluctuation. Additionally, we stratified the pregnancies into three trimesters, including trimester 1 (< 13 gestational weeks), trimester 2 (13–27 gestational weeks), and trimester 3 (≥ 28 gestational weeks), and the exposure levels during each trimester were also estimated. -
Maternal fasting peripheral blood (5 mL) and umbilical cord blood (5 mL) were collected immediately by a professional nurse when the mothers gave birth. No blood samples were collected before delivery. The details were described previously [15]. The blood samples were collected into vacuum anticoagulant tubes at 4 °C, then transported to the laboratory. The white blood cells were separated from whole blood after centrifugation for subsequent analysis.
-
DNA samples was extracted from the white blood cells with a genomic DNA extraction kit (Bioteke Corporation, Beijing China). A Nanodrop ND-1000 spectrophotometer (Thermo, Waltham, MA, USA) was used to measure the concentrations of the DNA samples. We treated the DNA with sodium bisulfite using an EZ DNA Methylation Kit (Zymo Research, CA, USA). The GPR61 gene sequence was obtained using UCSC/Ensembl (
http://genome.ucsc.edu/ ), and the GPR61 promoter sequence was predicted according to a previous study [18]. The methylation levels of the GPR61 promoter were determined by quantitative methylation-specific polymerase chain reaction (QMSP). The specific QMSP primers used in the current study were designed using online MethPrimer software (http://www.urogene.org/cgibin/methprimer/methprimer.cgi ), and the primer sequences are shown in Supplementary Table S1, available in www.besjournal.com. QMSP was carried out in a 15 μL reaction mixture, containing 2×SYBR Green Mixtrue (7.5 μL), 1.25 μmol/L primer (2 μL), DNA template (60 ng), and ddH2O water. The cycling parameters for PCR were as follows: denaturation at 95 °C for 10 min, followed by 40 cycles of 95 °C for 15 s, 56 °C for 30 s, and 72 °C for 30 s. Melting curve analysis was performed at the end of each run to confirm amplification specificity and the absence of primer dimers. The methylation levels were calculated according to formula 1/[1 + 2^(Ctmethylated − Ctunmethylated)] × 100% [19], where Ct is the number of PCR cycle whose fluorescent signal increases to the threshold.Table S1. Primers for GPR61 gene for QMSP
Primers Sequences (5’–3’) Tm (°C) Lengths of PCR products (bp) MF TGTGTTAGGTTATTGGAGAGGTTAC 53 166 MR CCCTATTTTATAAATAAAAAACCGAA UF TTGTGTTAGGTTATTGGAGAGGTTAT 53 167 UR CCCTATTTTATAAATAAAAAACCAAA Note. M: Methylation; U: Unmethylation; F: Forward; R: Reverse. -
A multiple linear regression model was used to assess the associations among birth weight, GPR61 methylation in maternal and cord blood at birth, and weather conditions during different exposure windows, and each exposure window was determined in a separate model. The median of each methylation level quartile was treated as a continuous independent variable to determine linear trends across increasing quartiles of the methylation levels and birth weight as dependent variables [20]. Furthermore, we classified methylation levels into a binary variable according to the median of the methylation levels. Then the effects modification of GPR61 methylation on the associations between weather and birth weight were explored with an interactive term [21]. If there were significant pairwise correlations among weather conditions, GPR61 methylation levels, and birth weight, a mediation analysis would be performed using an SAS macro described in a previous study [22] to quantitatively evaluate the role of the GPR61 promoter methylation levels in the association between weather conditions and birth weight. Briefly, two models were required. The first model estimated the association (the total effect) between exposure and the outcome without adjusting for the mediator, and the second model estimated the association (the direct effect) between exposure and the outcome with adjusting for the mediator. The mediation effect was obtained by the following formula: (total effect – direct effect) / (total effect) × 100%.
Based on previous reports, gestational age, the sex of the newborn, maternal age, maternal education, family income, pregestational BMI, passive smoking, and birth season were adjusted in the models [8, 23]. Additionally, if the change in the estimated effect exposure was over 10% after adjusting for a single covariate in the primary analysis, we further adjusted for the covariate in the final models [24]. Furthermore, we did not find significant collinearity in the models. Hence, each model in the current study followed a basic covariate adjustment, including sex of the newborn, maternal age, gestational age, maternal education attained, family income, pregestational BMI, maternal net weight gain, smoking status, folic acid intake, and birth season (October–March defined as the cold season, April–September defined as the warm season). Furthermore, previous studies reported the necessity of mutually adjusting for precipitation and RH when evaluating the health effects of precipitation and RH [25], hence, we adjusted them for each other in the relevant models when we analyzed their relationship with GPR61 methylation and birth weight. We did not adjust for other weather levels in one model. To comprehensively reveal the health risk of weather and avoid significant collinearity interference among the above air pollutants, we further analyzed the health risks of weather after adjusting for PM10.
All analyses were performed with SAS software (version 9.4, SAS Institute Inc., Cary, NC, USA) and all P values were two-sided with a significant level of 0.05.
-
Of the mothers, the mean age, pregestational weight, and net weight gain were 26.55 years, 54.46 kg, and 14.72 kg, respectively. Of the newborns, the mean birth weight was 3262.32 ± 428.72 g. The methylation levels of the GPR61 promoter in maternal and cord blood were 71.55% ± 11.19% and 73.93% ± 11.94%, respectively (Table 1), and no significant difference of methylation level was found between different sexs (Supplementary Table S2, available in www.besjournal.com).
Table 1. Characteristics of study population (n = 567)
Characteristics Mean ± SD or n (%) Maternal Age (year) 26.55 ± 5.28 Height (cm) 160.74 ± 4.52 Pregestational weight (kg) 54.46 ± 7.88 Net weight gain (kg) 14.72 ± 5.37 Pregestational BMI (kg/m2) < 18.5 92 (16.82) 18.5–24.0 367 (67.09) ≥ 24.0 88 (16.09) Folic acid intake Yesa 46 (8.73) No 481 (91.27) Passive smoking Yesb 131 (23.10) No 436 (76.90) Family income (RMB/capita) < 1,000 348 (69.60) 1,000–2,000 130 (26.00) > 2,000 22 (4.40) Education attainment Middle school and below 402 (73.76) High school 111 (20.37) Junior college and above 32 (5.87) Maternal GPR61 promoter methylation (%) 71.55 ± 11.19 Newborns Birth weight (g) 3262.32 ± 428.72 Gestational age (week) < 37 5 (0.88) 37–40 495 (87.30) > 40 67 (11.82) Sex Boys 320 (56.44) Girls 247 (43.56) Birth seasonc Cold season 268 (47.27) Warm season 299 (52.73) Neonatal GPR61 promoter methylation (%) 73.93 ± 11.94 Note. aFolic acid intake was defined as the intake of folic acid and its derivatives (such as tetrahydrofolate and 5-methyl-tetrahydrofolate) at least once a day, for more than 30 days from 3 months before pregnancy to delivery. bPassive smoke exposure was defined as exposure to a smoking environment for at least 15 min a day, for more than a month. cOctober to March and April to September were defined as the cold and warm season, respectively. Abbreviations: RMB, China Yuan. The characteristics and correlation of weather and air pollutants during each exposure window are summarized in Supplementary Tables S3–S5, available in www.besjournal.com, respectively. We observed significant seasonal trends of AP, SSD, RH and T (Supplementary Figure S1, available in www.besjournal.com). The level of AP peaked in cold season, and the level of SSD, RH, and T peaked in warm season. As shown in Figure 1, increased birth weight was observed with a decrease in RH or an increase in DTR during the entire pregnancy (the exposures in first and second trimesters showed the greater differences) (all P < 0.05). Near-null associations were observed between other weather conditions and birth weight (P > 0.05).

Figure 1. Association between weather and birth weight. The Y-axis represents the change of birth weight with 1 unit (mm for precipitation, hPa for AP, h for SSD, % for RH and °C for T and DTR) increment of weather conditions. (A) Adjustments: RH, gestational age, sex of the newborn, maternal age, maternal education, family income, pregestational BMI, net weight gain, passive smoking, folic acid intake and birth season. (B, C, E, F) Adjustments: gestational age, sex of the newborn, maternal age, maternal education, family income, pregestational BMI, net weight gain, passive smoking, folic acid intake and birth season. (D) Adjustments: precipitation, gestational age, sex of the newborn, maternal age, maternal education, family income, pregestational BMI, net weight gain, passive smoking, folic acid intake and birth season. Abbreviations: AP, atmospheric pressure (hPa); SSD, sunshine duration (h); RH, relative humidity (%); T, average daily mean temperature (°C); DTR, daily temperature range (°C).
Table S3. Characteristics of weather conditions and air pollutants
Weather conditions Entire pregnancy
(mean ± SD)Trimester 1
(mean ± SD)Trimester 2
(mean ± SD)Trimester 3
(mean ± SD)Precipitation (mm) 278.81 ± 40.90 283.78 ± 129.74 257.85 ± 95.88 294.81 ± 103.75 AP (hPa) 1003.53 ± 1.99 1004.20 ± 6.85 1003.73 ± 6.99 1002.66 ± 6.78 SSD (h) 4.81 ± 0.34 4.89 ± 0.87 4.87 ± 0.74 4.67 ± 1.02 RH (%) 55.83 ± 5.14 56.29 ± 10.51 54.76 ± 9.46 56.44 ± 10.48 T (°C) 15.24 ± 2.58 14.44 ± 8.72 14.83 ± 8.75 16.44 ± 8.49 DTR (°C) 9.78 ± 0.58 9.84 ± 1.11 9.86 ± 0.95 9.64 ± 1.26 PM10 (μg/m3) 106.72 ± 5.50 105.49 ± 15.64 107.43 ± 10.23 107.04 ± 10.96 SO2 (μg/m3) 50.15 ± 7.28 51.96 ± 20.39 51.24 ± 19.74 47.22 ± 18.97 NO2 (μg/m3) 44.21 ± 2.77 44.64 ± 8.16 44.60 ± 7.53 43.36 ± 7.22 Note. Abbreviations: AP, atmospheric pressure (hPa); SSD, sunshine duration (h); RH, relative humidity (%); T, average daily mean temperature (°C); DTR, daily temperature range (°C); PM10, particular matter 10; SO2, sulfur dioxide; NO2, nitrogen dioxide. Table S5. Spearman correlation of trimesters of pregnancy exposures to weather conditions and air pollutants
Meteorological conditions Trimester 1 vs. trimester 2 Trimester 1 vs. trimester 3 Trimester 2 vs. trimester 3 Precipitation –0.35 –0.28 –0.25 AP –0.10 –0.95 –0.08 SSD –0.52 0.08 –0.47 RH 0.15 –0.57 0.08 T –0.10 –0.97 –0.03 DTR –0.24 0.11 –0.15 PM10 –0.06 –0.48 –0.10 SO2 –0.12 –0.90 –0.01 NO2 –0.10 –0.83 –0.04 Note. All P < 0.05. Abbreviations: AP, atmospheric pressure (hPa); SSD, sunshine duration (h); RH, relative humidity (%); T, average daily mean temperature (°C); DTR, daily temperature range (°C); PM10, particular matter 10; SO2, sulfur dioxide; NO2, nitrogen dioxide. 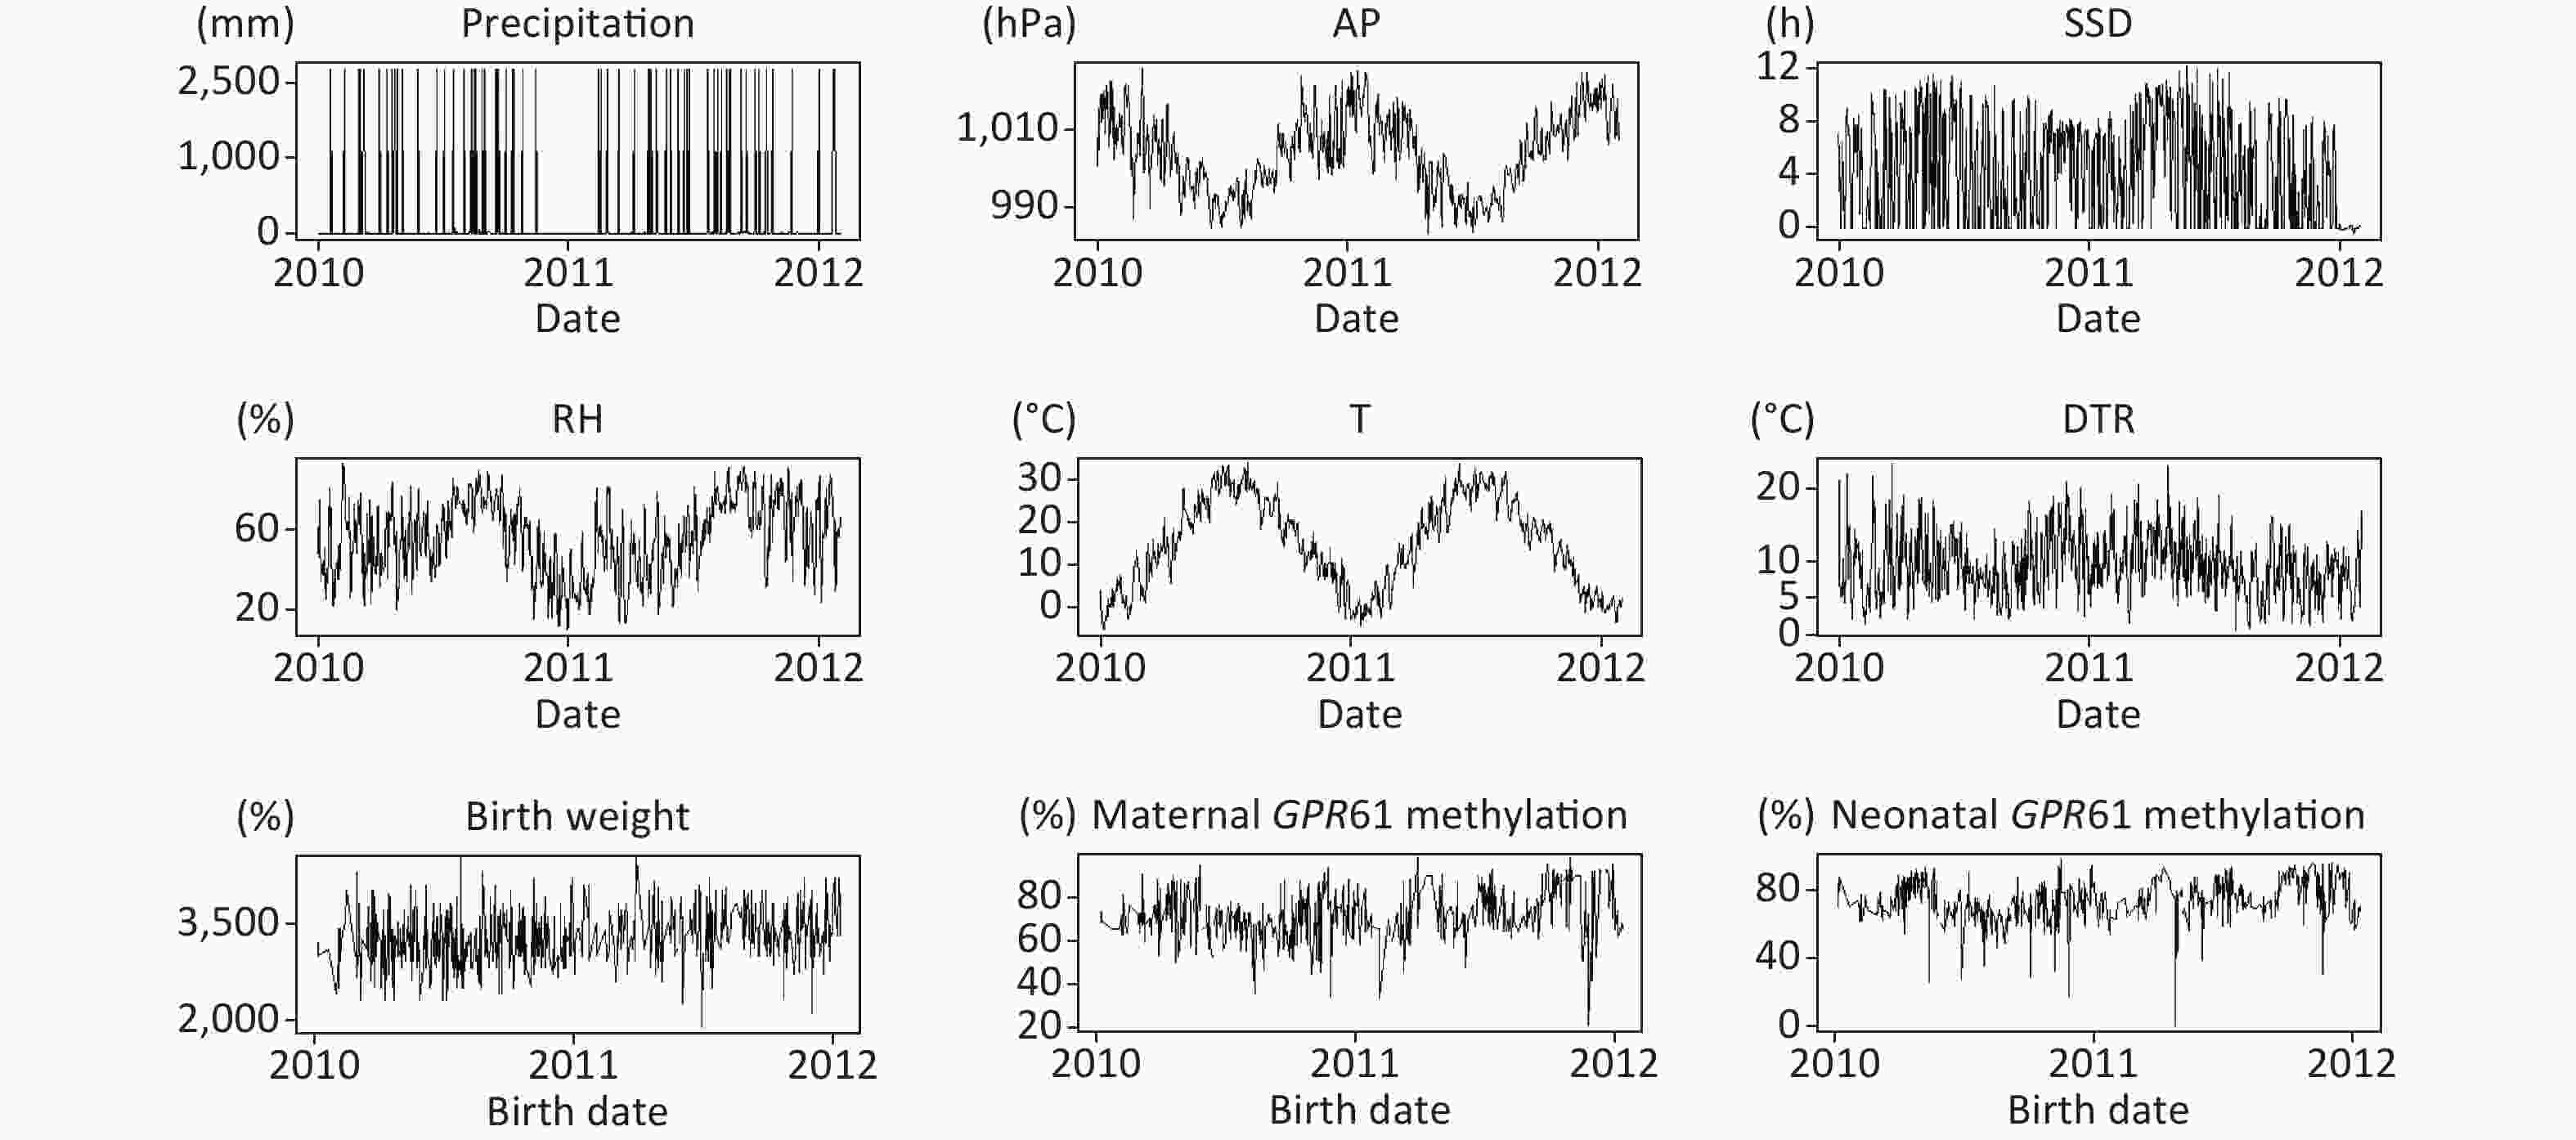
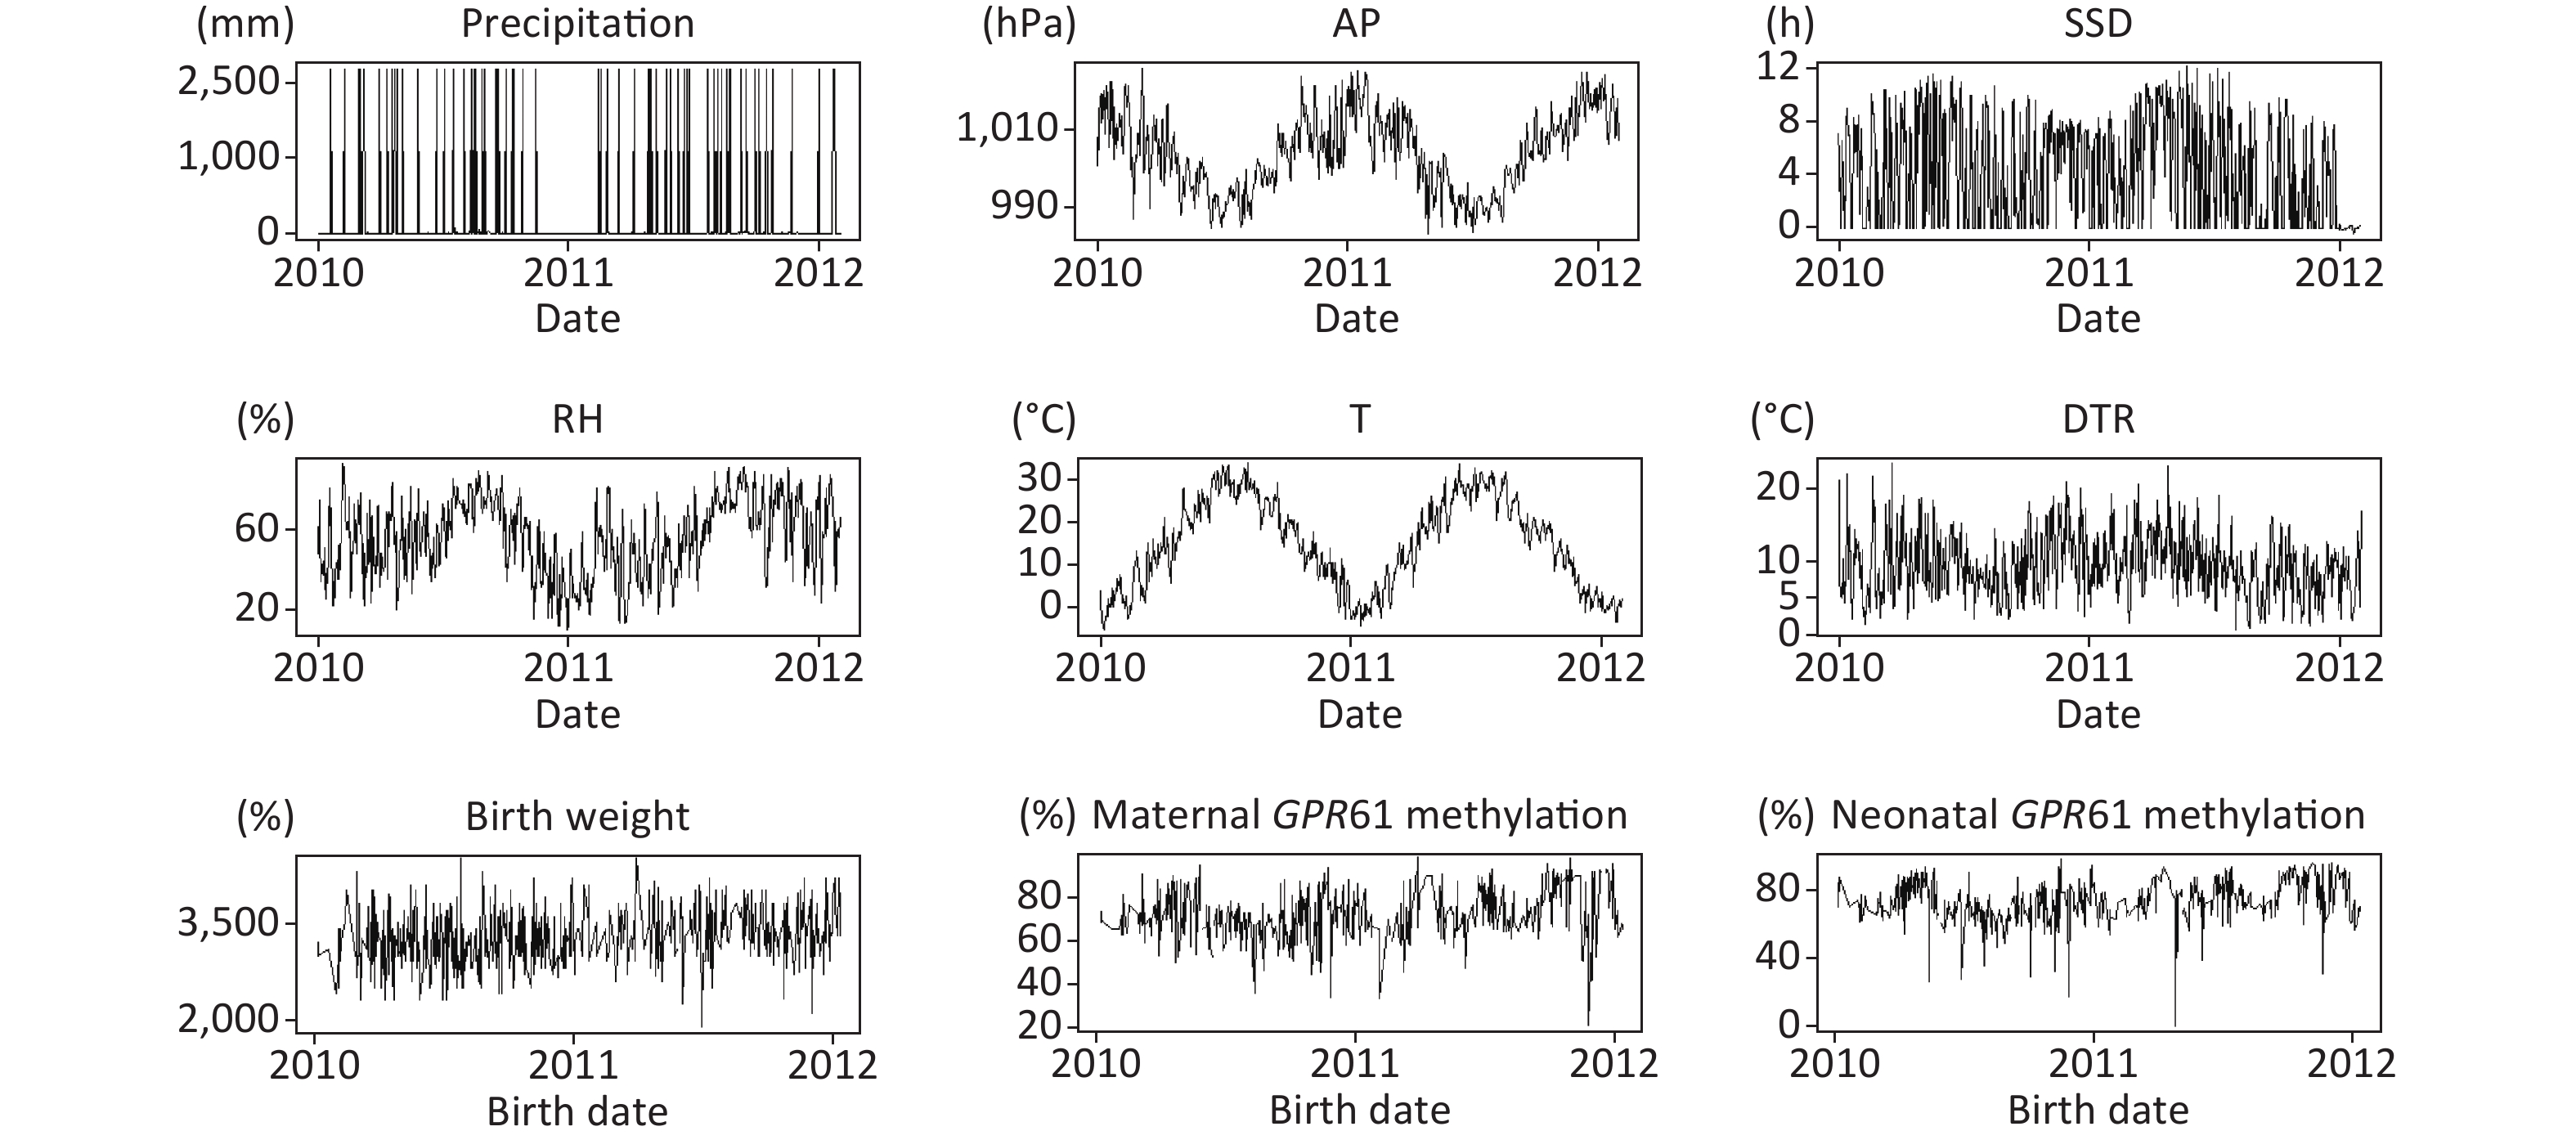
Figure S1. Distribution of weather conditions during study period, birth weight, maternal and neonatal GPR61 methylation levels. Abbreviations: AP, atmospheric pressure (hPa); SSD, sunshine duration (h); RH, relative humidity (%); T, average daily mean temperature (°C); DTR, daily temperature range (°C).
In addition, a positive linear correlation between maternal and neonatal GPR61 methylation levels was revealed (Table 2). Neonatal GPR61 methylation showed an upward trend with increases in maternal methylation. Multiple linear regression analysis suggested that neonatal GPR61 methylation increased by 0.55% (95% CI: 0.44–0.65) with each 1% increase in maternal methylation (P < 0.001).
Table 2. Association between maternal and neonatal GPR61 promoter methylation levelsa
Maternal methylation (%) n Neonatal methylation (%) β (95% CI) P Quartile 1 145 Reference − Quartile 2 141 2.08 (–0.90, 5.06) 0.172 Quartile 3 140 4.58 (1.92, 7.23) < 0.001 Quartile 4 141 16.05 (13.20, 18.90) < 0.001 Trend test < 0.001 Continuous 567 0.55 (0.44, 0.65) < 0.001 Note. aAdjustments: gestational age, sex of the newborn, maternal age, maternal education, family income, pregestational BMI, net weight gain, passive smoking, folic acid intake and birth season. Then, we analyzed the relationships between weather and GPR61 methylation (Table 3) and observed positive associations between precipitation (during the entire pregnancy and the first and third trimesters) and GPR61 methylation in maternal and cord blood, and between DTR (during the entire pregnancy and the second trimester) and GPR61 methylation in maternal and cord blood. We also observed the negative effects of RH on maternal and neonatal GPR61 methylation (during the entire pregnancy and the second and third trimesters). A near null association was observed between other weather conditions during the entire pregnancy and GPR61 methylation levels in maternal and cord blood (Table 3).
Table 3. Association between weather and maternal/neonatal GPR61 promoter methylation levelsa
Meteorological conditions n Entire pregnancy Trimester 1 Trimester 2 Trimester 3 β (95% CI) P β (95% CI) P β (95% CI) P β (95% CI) P Maternal methylation Precipitation (mm)b 567 0.07
(0.04, 0.11)< 0.001 0.02
(0.00, 0.03)0.010 –0.01
(–0.03, 0.01)0.085 0.03
(0.01, 0.04)< 0.001 AP (hPa)c 567 0.95
(0.20, 1.71)0.014 –0.12
(–0.29, 0.04)0.151 0.21
(–0.03, 0.46)0.091 0.15
(–0.01, 0.31)0.074 SSD (h)c 567 0.07
(–2.75, 2.89)0.962 –1.31
(–2.66, 0.05)0.059 1.14
(–0.48, 2.77)0.168 0.30
(–1.07, 1.68)0.665 RH (%)d 567 –0.64
(–0.88, –0.40)< 0.001 –0.15
(–0.32, 0.03)0.105 –0.22
(–0.40, –0.04)0.016 –0.29
(–0.43, –0.14)< 0.001 T (°C)c 567 –0.45
(–1.13, 0.23)0.197 0.12
(0.00, 0.25)0.046 –0.17
(–0.38, 0.05)0.136 –0.12
(–0.25, 0.01)0.053 DTR (°C)c 567 2.89
(1.19, 4.59)0.001 0.23
(–0.74, 1.21)0.640 2.10
(0.96, 3.24)< 0.001 0.65
(–0.27, 1.56)0.165 Neonatal methylation Precipitation (mm)b 567 0.11
(0.08, 0.15)< 0.001 0.03
(0.01, 0.04)< 0.001 –0.01
(–0.02, 0.01)0.295 0.03
(0.02, 0.04)< 0.001 AP (hPa)c 567 0.79
(–0.01, 1.59)0.054 –0.17
(–0.35, 0.01)0.067 0.22
(–0.01, 0.38)0.065 0.18
(–0.01, 0.38)0.066 SSD (h)c 567 –1.29
(–4.23, 1.67)0.394 –1.24
(–2.56, 0.08)0.065 1.84
(0.09, 3.60)0.040 –1.04
(–2.54, 0.44)0.169 RH (%)d 567 –0.82
(–1.07, –0.56)< 0.001 –0.27
(–0.43, –0.10)0.002 –0.24
(–0.42, –0.06)0.009 –0.29
(–0.44, –0.14)< 0.001 T (°C)c 567 –0.33
(–1.01, 0.35)0.334 0.16
(0.02, 0.29)0.023 –0.13
(–0.34, 0.08)0.232 –0.16
(–0.30, –0.02)0.023 DTR (°C)c 567 2.36
(0.48, 4.25)0.014 0.01
(–0.97, 0.98)0.990 2.81
(1.67, 3.96)< 0.001 0.12
(–0.87, 1.10)0.817 Note. aThe assessments of β and the 95% CI were for 1 unit (mm for precipitation, hPa for AP, h for SSD, % for RH and °C for T and DTR) increment in weather conditions. bAdjustments: RH, gestational age, sex of the newborn, maternal age, maternal education, family income, pregestational BMI, net weight gain, passive smoking, folic acid intake and birth season. cAdjustments: gestational age, sex of the newborn, maternal age, maternal education, family income, pregestational BMI, net weight gain, passive smoking, folic acid intake and birth season. dAdjustments: precipitation, gestational age, sex of the newborn, maternal age, maternal education, family income, pregestational BMI, net weight gain, passive smoking, folic acid intake and birth season. Abbreviations: AP, atmospheric pressure (hPa); SSD, sunshine duration (h); RH, relative humidity (%); T, average daily mean temperature (°C); DTR, daily temperature range (°C). Next, we observed a significant correlation between birth weight and neonatal GPR61 methylation (P < 0.05 for trend over quartiles), and a linear association that an elevation of 4.01 g of birth weight was observed with each 1% increase in the levels of neonatal GPR61 methylation after adjusting for potential confounding factors (Table 4).
Table 4. Associations between birth weight and GPR61 promoter methylation levels in maternal and cord blooda
GPR61 methylation n Birth weight (g) β (95% CI) P Maternal Quartile 1 145 Reference − Quartile 2 141 21.05 (–75.43, 117.54) 0.669 Quartile 3 140 –2.58 (–99.17, 94.02) 0.958 Quartile 4 141 37.32 (–65.10, 139.74) 0.475 Trend test 0.495 Continuous 567 1.61 (–1.68, 4.91) 0.338 Neonatal Quartile 1 142 Reference − Quartile 2 142 84.71 (–17.18, 186.60) 0.103 Quartile 3 140 153.92 (58.10, 249.74) 0.002 Quartile 4 143 135.47 (31.19, 239.75) 0.011 Trend test 0.002 Continuous 567 4.01 (0.60, 7.42) 0.021 Note. aAdjustments: gestational age, sex of the newborn, maternal age, maternal education, family income, pregestational BMI, net weight gain, passive smoking, folic acid intake and birth season. We further estimated the effects modification of maternal/neonatal GPR61 methylation on the association between weather and birth weight. We found that there were marginally significant effects modification of maternal GPR61 methylation on the associations between almost all meteorological conditions (except for DTR) and birth weight (0.05 < P for interaction < 0.10) (Table 5), but no effects modification of neonatal methylation (Table 6).
Table 5. Effect modification of maternal GPR61 methylation on the associations between weather and birth weight
Maternal methylation Effect modification Meteorological conditions Low-level (n = 286) High-level (n = 281) β (95% CI) P β (95% CI) P β (95% CI) Pinteraction Precipitation
(mm)aEntire pregnancy 0.79 (–0.92, 2.49) 0.364 –1.04 (–3.02, 0.945) 0.305 –1.51 (–3.25, 0.23) 0.089 Trimester 1 0.46 (–0.14, 1.07) 0.130 –0.41 (–1.14, 0.31) 0.266 –0.14 (–0.71, 0.42) 0.615 Trimester 2 0.74 (0.09, 1.38) 0.026 0.02 (–0.74, 0.77) 0.964 –0.55 (–1.31, 0.21) 0.155 Trimester 3 –0.22 (–0.86, 0.43) 0.507 0.49 (–0.25, 1.22) 0.194 0.01 (–0.70, 0.72) 0.984 AP (hPa)b Entire pregnancy –47.90 (–85.85, –9.95) 0.013 34.77 (–10.60, 80.14) 0.133 43.37 (6.35, 80.39) 0.022 Trimester 1 3.64 (–4.72, 11.99) 0.394 2.03 (–6.20, 10.27) 0.628 2.87 (–8.06, 13.80) 0.606 Trimester 2 –10.33 (–22.03, 1.38) 0.084 5.78 (–6.78, 18.33) 0.367 10.27 (–0.72, 21.26) 0.067 Trimester 3 –5.66 (–14.34, 3.01) 0.201 –1.27 (–10.09, 7.55) 0.778 –1.74 (–12.80, 9.32) 0.758 SSD (h)b Entire pregnancy 46.16 (–117.54, 209.86) 0.581 –44.42 (–178.49, 89.65) 0.516 –107.93 (–314.66, 98.80) 0.306 Trimester 1 16.70 (–52.10, 85.49) 0.634 –41.49 (–115.04, 32.06) 0.269 –92.36 (–183.94, –0.79) 0.048 Trimester 2 101.04 (20.88, 181.19) 0.014 –29.08 (–101.95, 43.78) 0.434 –96.55 (–204.62, 11.52) 0.080 Trimester 3 –68.50 (–138.67, 1.68) 0.056 21.41 (–39.87, 82.68) 0.494 63.97 (–10.76, 138.70) 0.093 RH (%)c Entire pregnancy –23.544 (–38.10.–8.98) 0.002 –13.47 (–26.69, –0.25) 0.046 –1.69 (–15.56, 12.18) 0.811 Trimester 1 –14.45 (–22.40, –6.50) < 0.001 1.62 (–7.42, 10.66) 0.725 7.08 (–0.20, 14.37) 0.057 Trimester 2 –12.06 (–20.94, –3.18) 0.008 –10.61 (–18.17, –3.06) 0.006 –4.71 (–12.53, 3.11) 0.238 Trimester 3 2.35 (–4.68, 9.37) 0.513 –8.08 (–15.68, –0.49) 0.037 –4.65 (–12.00, 2.69) 0.214 T (°C)b Entire pregnancy 41.00 (7.31, 74.69) 0.017 –15.72 (–53.87, 22.43) 0.419 –30.37 (–59.40, –1.33) 0.040 Trimester 1 –3.50 (–9.55, 2.55) 0.257 0.13 (–6.28, 6.54) 0.968 0.54 (–8.12, 9.20) 0.902 Trimester 2 12.42 (1.86, 22.98) 0.021 –7.52 (–18.87, 3.82) 0.194 –9.23 (–17.79, –0.66) 0.035 Trimester 3 3.79 (–2.61, 10.19) 0.246 0.97 (–5.61, 7.55) 0.772 0.69 (–8.04, 9.41) 0.878 DTR (°C)b Entire pregnancy 91.01 (–5.05, 187.08) 0.063 107.06 (17.17, 196.95) 0.020 12.57 (–109.46, 134.59) 0.840 Trimester 1 45.15 (–5.08, 95.38) 0.078 23.59 (–20.67, 67.85) 0.296 –35.27 (–102.07, 31.54) 0.301 Trimester 2 80.08 (20.96, 139.20) 0.008 45.63 (–15.95, 107.22) 0.146 1.76 (–77.89, 81.41) 0.965 Trimester 3 –22.16 (–67.46, 23.13) 0.338 28.38 (–15.15, 71.91) 0.201 37.15 (–23.85, 98.15) 0.233 Note. aAdjustments: RH, gestational age, sex of the newborn, maternal age, maternal education, family income, pregestational BMI, net weight gain, passive smoking, folic acid intake and birth season. bAdjustments: gestational age, sex of the newborn, maternal age, maternal education, family income, pregestational BMI, net weight gain, passive smoking, folic acid intake and birth season. cAdjustments: precipitation, gestational age, sex of the newborn, maternal age, maternal education, family income, pregestational BMI, net weight gain, passive smoking, folic acid intake and birth season. Abbreviations: AP, atmospheric pressure (hPa); SSD, sunshine duration (h); RH, relative humidity (%); T, average daily mean temperature (°C); DTR, daily temperature range (°C). Table 6. Effect modification of neonatal GPR61 methylation on the associations between weather and birth weight
Neonatal methylation Effect modification Meteorological conditions Low-level (n = 284) High-level (n = 283) β (95% CI) P β (95% CI) P β (95% CI) Pinteraction Precipitation
(mm)aEntire pregnancy –0.10 (–1.92, 1.71) 0.910 –1.54 (–3.50, 0.43) 0.125 –1.31 (–3.07, 0.45) 0.145 Trimester 1 –0.01 (–0.65, 0.62) 0.966 –0.40 (–1.15, 0.36) 0.305 0.01 (–0.57, 0.59) 0.967 Trimester 2 0.61 (–0.06, 1.28) 0.073 0.58 (–0.16, 1.33) 0.125 –0.28 (–1.04, 0.48) 0.475 Trimester 3 –0.04 (–0.68, 0.61) 0.911 –0.29 (–1.05, 0.48) 0.459 –0.45 (–1.15, 0.24) 0.203 AP (hPa)b Entire pregnancy –35.67 (–73.93, 2.58) 0.068 11.17 (–33.60, 55.94) 0.625 26.77 (–9.71, 63.25) 0.150 Trimester 1 3.07 (–5.69, 11.84) 0.492 4.22 (–3.53, 11.96) 0.286 1.97 (–8.99, 12.92) 0.725 Trimester 2 –6.04 (–17.74, 5.65) 0.311 0.45 (–11.97, 12.87) 0.944 4.91 (–5.92, 15.73) 0.374 Trimester 3 –5.78 (–14.97, 3.41) 0.218 –3.75 (–11.91, 4.41) 0.368 0.36 (–10.68, 11.40) 0.950 SSD (h)b Entire pregnancy –3.05 (–171.93, 165.84) 0.972 19.16 (–110.57, 148.88) 0.772 33.50 (–172.58, 239.57) 0.750 Trimester 1 26.18 (–46.31, 98.67) 0.479 –32.98 (–102.50, 36.55) 0.353 –52.33 (–143.77, 39.11) 0.262 Trimester 2 56.47 (–26.13, 139.06) 0.180 4.44 (–65.61, 74.49) 0.901 –65.84 (–173.51, 41.83) 0.231 Trimester 3 –67.97 (–138.38, 2.44) 0.059 33.74 (–26.31, 93.78) 0.271 78.66 (4.89, 152.42) 0.037 RH (%)c Entire pregnancy –15.23 (–30.17, –0.29) 0.046 –13.66 (–27.35, 0.02) 0.050 –6.12 (–19.84, 7.61) 0.382 Trimester 1 –8.52 (–16.65, –0.38) 0.040 –0.66 (–9.81, 8.49) 0.887 4.48 (–2.79, 11.74) 0.228 Trimester 2 –8.28 (–18.19, 1.63) 0.102 –12.97 (–19.82, –6.12) < 0.001 –4.25 (–12.09, 3.59) 0.288 Trimester 3 0.55 (–6.47, 7.56) 0.879 –1.67 (–9.57, 6.24) 0.680 –5.29 (–12.46, 1.89) 0.149 T (°C)b Entire pregnancy 30.04 (–4.84, 64.92) 0.091 –4.09 (–40.31, 32.12) 0.825 –17.29 (–46.13, 11.55) 0.240 Trimester 1 –2.58 (–8.77, 3.61) 0.415 –2.52 (–8.60, 3.56) 0.416 –0.18 (–8.75, 8.40) 0.968 Trimester 2 7.11 (–3.27, 17.49) 0.179 –1.77 (–13.27, 9.73) 0.763 –4.28 (–12.75, 4.19) 0.322 Trimester 3 3.29 (–3.33, 9.91) 0.330 2.78 (–3.42, 8.98) 0.380 0.00 (–8.67, 8.68) 0.999 DTR (°C)b Entire pregnancy 63.23 (–35.80, 162.26) 0.211 127.54 (40.24, 214.84) 0.004 69.64 (–51.18, 190.46) 0.259 Trimester 1 52.74 (–1.60, 107.08) 0.057 27.17 (–14.57, 68.92) 0.202 –22.22 (–90.11, 45.66) 0.521 Trimester 2 40.52 (–23.07, 104.10) 0.212 79.07 (20.09, 138.06) 0.009 32.54 (–47.54, 112.62) 0.426 Trimester 3 –18.36 (–65.24, 28.51) 0.443 18.47 (–22.69, 59.63) 0.379 45.79 (–14.32, 105.91) 0.135 Note. aAdjustments: RH, gestational age, sex of the newborn, maternal age, maternal education, family income, pregestational BMI, net weight gain, passive smoking, folic acid intake and birth season. bAdjustments: gestational age, sex of the newborn, maternal age, maternal education, family income, pregestational BMI, net weight gain, passive smoking, folic acid intake and birth season. cAdjustments: precipitation, gestational age, sex of the newborn, maternal age, maternal education, family income, pregestational BMI, net weight gain, passive smoking, folic acid intake and birth season. Abbreviations: AP, atmospheric pressure (hPa); SSD, sunshine duration (h); RH, relative humidity (%); T, average daily mean temperature (°C); DTR, daily temperature range (°C); PM10, particular matter 10; SO2, sulfur dioxide; NO2, nitrogen dioxide. Mediation analysis showed that the association between birth weight and RH during the entire pregnancy (the exposures in first trimester showed the greatest difference) and between birth weight and DTR during the entire pregnancy (the exposures in second trimester showed the greatest difference) were partially mediated by alterations in neonatal GPR61 methylation (P < 0.05) (Table 7).
Table 7. Mediation analysis for the role of neonatal GPR61 methylation in the effects of RH and DTR on birth weight
Meteorological conditions n Total effect, Direct effect, Proportion mediated by methylation
(95% CI)P β (95% CI) β (95% CI) RH (%)a Entire pregnancy 567 –19.34 (–20.04, –9.64) –15.59 (–26.04, –5.14) 19.4 (6.1, 47.0) 0.014 Trimester 1 567 –7.51 (–13.53, –1.49) –5.35 (–11.05, 0.95) 28.8 (8.0, 65.3) 0.003 Trimester 2 567 –11.80 (–17.47, –6.13) –10.57 (–16.66, –4.83) 8.9 (1.7, 35.9) 0.097 DTR (°C)b Entire pregnancy 567 108.67 (42.40, 174.94) 93.57 (26.20, 160, 94) 13.9 (3.7, 40.7) 0.041 Trimester 2 567 71.28 (27.14, 115.42) 58.15 (11.60, 104.69) 18.4 (4.7, 50.9) 0.033 Note. aAdjustments: precipitation, gestational age, sex of the newborn, maternal age, maternal education, family income, pregestational BMI, net weight gain, passive smoking, folic acid intake, birth season. bAdjustments: gestational age, sex of the newborn, maternal age, maternal education, family income, pregestational BMI, net weight gain, passive smoking, folic acid intake, birth season. Abbreviations: RH, relative humidity (%); DTR, daily temperature range (°C). No significant change in the relationship between weather and GPR61 methylation (Supplementary Table S6, available in www.besjournal.com), and between weather and birth weight (Supplementary Table S7, available in www.besjournal.com) was observed after further adjusting for PM10, suggesting that GPR61 methylation and birth weight were still closely related to weather after eliminating the effects of air pollutants.
Table S6. Analysis of the relationship between weather conditions and maternal/neonatal GPR61 promoter methylation levels after adjusting PM10a
Meteorological factors n Entire pregnancy Trimester 1 Trimester 2 Trimester 3 β (95% CI) P β (95% CI) P β (95% CI) P β (95% CI) P Maternal methylation Precipitation (mm)b 567 0.07 (0.02, 0.11) 0.003 0.02 (0.00, 0.03) 0.024 –0.02 (–0.03, –0.00) 0.033 0.03 (0.01, 0.04) < 0.001 AP (hPa)c 567 0.78 (0.08, 1.47) 0.030 –0.16 (–0.47, 0.15) 0.315 0.28 (0.03, 0.59) 0.031 0.27 (–0.05, 0.58) 0.093 SSD (h)c 567 1.37 (–2.13, 4.87) 0.443 –1.41 (–2.80, –0.01) 0.049 1.18 (–0.48, 2.84) 0.164 0.45 (–1.00, 1.90) 0.539 RH (%)d 567 –0.67 (–0.94, –0.40) < 0.001 –0.17 (–0.35, 0.02) 0.075 –0.28 (–0.47, –0.08) 0.005 –0.31 (–0.45, –0.16) < 0.001 T (°C)c 567 –0.34 (–0.96, 0.29) 0.294 0.20 (–0.01, 0.40) 0.059 –0.23 (–0.46, –0.01) 0.043 –0.19 (–0.38, –0.00) 0.047 DTR (°C)c 567 4.08 (2.23, 5.93) < 0.001 0.66 (–0.39, 1.71) 0.219 2.59 (1.41, 3.77) < 0.001 0.68 (–0.29, 1.66) 0.170 Neonatal methylation Precipitation (mm)b 567 0.11 (0.07, 0.15) < 0.001 0.02 (0.01, 0.04) 0.003 –0.01 (–0.03, 0.01) 0.197 0.03 (0.02, 0.04) < 0.001 AP (hPa)c 567 0.57 (–0.11, 1.24) 0.102 –0.06 (–0.40, 0.30) 0.762 0.27 (0.03, 0.51) 0.026 0.46 (0.19, 0.73) < 0.001 SSD (h)c 567 –0.62 (–4.08, 2.84) 0.727 –1.45 (–2.79, –0.12) 0.033 1.85 (0.14, 3.56) 0.034 –0.78 (–2.37, 0.80) 0.332 RH (%)d 567 –0.87 (–1.12, –0.62) < 0.001 –0.35 (–0.52, –0.17) < 0.001 –0.29 (–0.48, –0.11) 0.002 –0.32 (–0.47, –0.17) < 0.001 T (°C)c 567 –0.11 (–0.67, 0.45) 0.697 0.13 (–0.12, 0.37) 0.305 –0.19 (–0.41, 0.03) 0.087 –0.34 (–0.52, –0.15) < 0.001 DTR (°C)c 567 3.85 (1.85, 5.85) < 0.001 0.75 (–0.33, 1.84) 0.174 3.29 (2.10, 4.48) < 0.001 0.15 (–0.92, 1.23) 0.783 Note. aThe assessments of β and the 95% CI were for 1 unit (mm for precipitation, hPa for AP, h for SSD, % for RH and °C for T and DTR) increment of weather conditions. bAdjustments: RH, gestational age, sex of the newborn, maternal age, maternal education, family income, pregestational BMI, net weight gain, passive smoking, folic acid intake, birth season and PM10. cAdjustments: gestational age, sex of the newborn, maternal age, maternal education, family income, pregestational BMI, net weight gain, passive smoking, folic acid intake, birth season and PM10. dAdjustments: precipitation, gestational age, sex of the newborn, maternal age, maternal education, family income, pregestational BMI, net weight gain, passive smoking, folic acid intake, birth season and PM10. Abbreviations: AP, atmospheric pressure (hPa); SSD, sunshine duration (h); RH, relative humidity (%); T, average daily mean temperature (°C); DTR, daily temperature range (°C); PM10, particular matter 10; SO2, sulfur dioxide; NO2, nitrogen dioxide. Table S7. Analysis of the relationship between weather conditions and birth weight after adjusting PM10a
Meteorological factors n Entire pregnancy Trimester 1 Trimester 2 Trimester 3 β (95% CI) P β (95% CI) P β (95% CI) P β (95% CI) P Precipitation (mm)b 567 –0.40
(–1.77, 0.97)0.567 0.04
(–0.44, 0.51)0.883 0.43
(–0.05, 0.90)0.077 0.14
(–0.13, 0.60)0.536 AP (hPa)c 567 –3.49
(–30.49, 23.51)0.800 –4.50
(–13.67, 4.67)0.336 –1.69
(–10.44, 7.06)0.705 7.60
(–1.93, 17.14)0.118 SSD (h)c 567 40.67
(–93.78, 175.12)0.553 –5.89
(–60.60, 48.83)0.833 30.11
(–26.09, 86.31)0.294 2.46
(–51.85, 56.78)0.929 RH (%)d 567 –19.21
(–29.20, –9.21)< 0.001 –8.18
(–15.24, –1.12)0.023 –11.25
(–17.21, –5.30)< 0.001 –7.70
(–13.44, –1.96)0.009 T (°C)c 567 3.90
(–18.96, 26.76)0.738 3.73
(–3.01, 10.47)0.278 2.30
(–6.04, 10.64)0.589 –5.14
(–11.37, 1.09)0.106 DTR (°C)c 567 121.93
(50.30, 193.56)< 0.001 28.40
(–11.12, 67.91)0.159 67.28
(19.66, 114.91)0.006 28.57
(–9.95, 67.09)0.146 Note. aThe assessments of β and the 95% CI were for 1 unit (mm for precipitation, hPa for AP, h for SSD, % for RH and °C for T and DTR) increment of weather conditions. bAdjustments: RH, gestational age, sex of the newborn, maternal age, maternal education, family income, pregestational BMI, net weight gain, passive smoking, folic acid intake, birth season and PM10. cAdjustments: gestational age, sex of the newborn, maternal age, maternal education, family income, pregestational BMI, net weight gain, passive smoking, folic acid intake, birth season and PM10. dAdjustments: precipitation, gestational age, sex of the newborn, maternal age, maternal education, family income, pregestational BMI, net weight gain, passive smoking, folic acid intake, birth season and PM10. Abbreviations: AP, atmospheric pressure (hPa); SSD, sunshine duration (h); RH, relative humidity (%); T, average daily mean temperature (°C); DTR, daily temperature range (°C); PM10, particular matter 10; SO2, sulfur dioxide; NO2, nitrogen dioxide. -
In this study, we found significant associations among weather conditions (especially RH and DTR), GPR61 methylation, and birth weight. Neonatal GPR61 methylation could mediate the effect of RH (during the entire pregnancy, especially the first trimester) and DTR (during the entire pregnancy, especially the second trimester) on birth weight. Maternal GPR61 methylation seemed to modify the effect of weather on birth weight. This suggests that DNA methylation may play an important role in the effect of weather fluctuation on humans, especially newborns.
During the past few years, increasing attention has been paid to the relationship between weather and birth weight [26]. In this study, we observed negative associations between birth weight and RH. The effect of high-level humidity on heat stress causes extra energy consumption [27], which means a decrease in the energy used for fetal development. In addition, high-level humidity can increase the deposition of air pollutants [28] and induce psychological and physical discomfort [29], causing many adverse health outcomes including low birth weight [30]. Similar reasons may be responsible for our findings. We additionally found that birth weight was positively correlated with DTR. A previous study found that in a high latitude area with a large DTR, birth weight was higher than that in the low latitude area [31]. This finding supports our results to some extent. In addition, it was reported that high ambient temperature could increase the risk of low birth weight via disturbing endocrine system [32]. We speculated that high-level of DTR will produce a compensation response for fetal development when the mother enters the low temperature environment from the high temperature environment. This compensation mechanism makes the embryo shows a “catch-up” situation and accelerate the development in the low temperature environment to make up for the adverse effects of the ambient high temperature [33]. Interestingly, we observed that birth weight was mainly affected by the exposure to RH and DTR during the first and second trimesters of pregnancy, but not the third trimester of pregnancy. A lag effect has been observed in the relationship between environmental conditions and birth weight [34], and it is well-known that fetal weight increases mainly in the second trimester [35]. These factors may make the fetal birth weight more susceptible to weather in the first and second trimesters of pregnancy. Additionally, we further analyzed the effect of RH and DTR on birth weight after adjusting for exposures during all trimesters of pregnancy. We observed consistent results for RH and DTR with the results without adjusting for exposure during all trimesters of pregnancy (Figure 1 and Supplementary Table S8, available in www.besjournal.com), further indicating the susceptibility of fetal development to RH and DTR during the first and second trimesters of pregnancy.
Table S8. Association between weather conditions and birth weight with further adjusting exposures during all trimesters of pregnancy
Weather conditions n Birth weight β (95% CI) P RHa Trimester 1 567 –6.26 (–12.17, –0.36) 0.038 Trimester 2 567 –8.86 (–16.40, –1.32) 0.021 Trimester 3 567 –2.99 (–7.87, 1.89) 0.230 DTRb Trimester 1 567 49.27 (15.74, 82.76) 0.004 Trimester 2 567 92.09 (45.70, 138.49) < 0.001 Trimester 3 567 14.86 (–20.11, 49.83) 0.405 Note. aAdjustments: precipitation, gestational age, sex of the newborn, maternal age, maternal education, family income, pregestational BMI, net weight gain, passive smoking, folic acid intake and birth season. bAdjustments: gestational age, sex of the newborn, maternal age, maternal education, family income, pregestational BMI, net weight gain, passive smoking, folic acid intake and birth season. Abbreviations: RH, relative humidity (%); DTR, daily temperature range (°C). In this study, positive associations between precipitation/DTR and GPR61 methylation, and negative associations between RH and GPR61 methylation, were observed. There are few studies on the potential mechanism of gene methylation induced by meteorological factors. Previous research indicated that DNA methyltransferase which is responsible for methylation could be affected by meteorological factors [36]. Hence, we speculate that weather fluctuations interfere with DNA methyltransferase enzymes, resulting in methylation changes in GPR61 promoter. In addition, we found that weather conditions showed a consistent effect on GPR61 methylation in maternal and cord blood, and this effect occurred at almost all stages of pregnancy. Similar results have been reported in previous studies [13]. We speculated that the complex physiological changes during pregnancy and the increased sensitivity of mothers and newborns to the external environment, resulting that weather fluctuation during almost all stages of pregnancy could affect methylation levels. Given that DNA methylation is closely related to gene expression [37], the change in GPR61 methylation may be an important reason for the close association between weather and birth weight.
Here, we found a positive association between GPR61 methylation in maternal and cord blood. DNA methylation is heritable [38], and some environmental substance can pass through the placental barrier, simultaneously affecting the level of maternal and infant methylation [13]. These may be responsible for the close relationship between GPR61 methylation in maternal and cord blood.
Given the complex associations among weather, GPR61 methylation, and birth weight in this study, we used interactive analysis and mediated analysis to assess the role of GPR61 methylation in the association between weather and birth weight. After comprehensive analyses, we found the effect modification of maternal GPR61 methylation on the association between birth weight and weather during almost all stages of pregnancy, which may result from the susceptibility of methylation change during pregnancy. In addition, the mediation analysis showed that the effects of RH (during the entire pregnancy and the first trimester) and DTR (during the entire pregnancy and the second trimester) on birth weight were partially mediated by alterations in neonatal GPR61 methylation. These findings suggest that GPR61 methylation in maternal and cord blood may play different roles in the birth weight changes caused by weather. Maternal GPR61 methylation changes are more likely to affect the susceptibility of birth weight to weather, whereas neonatal GPR61 methylation changes are the bridge between weather conditions and birth weight. A previous study indicated that maternal and neonatal methylation could affect birth weight independently [39]. Considering that GPR61 was reported to be related to a variety of physiological and biochemical processes, such as energy metabolism [11], we speculated that GPR61 methylation changes induced by weather influenced maternal and neonatal energy metabolism. The changes in maternal GPR61 methylation directly influence maternal energy metabolism, and indirectly influence the nutrition supply to embryo. This maternal change may modify the vulnerability of neonatal development to weather fluctuation [40]. Accordingly, neonatal methylation change directly affects neonatal energy metabolism and neonatal growth.
Attention has been directed at the effect of climate and hereditary changes on human health [41], especially birth outcomes. In the current study, we observed a significant relationship between weather fluctuation and birth weight, in which GPR61 methylation in maternal and cord blood played important roles. Maternal GPR61 methylation seemed to modify the susceptibility of weather fluctuation on birth weight, whereas neonatal GPR61 methylation may be a bridge between weather fluctuation and birth weight. According to our findings, further studies should notice the difference in health effect caused by maternal and neonatal genetic change, and it is best to use high-throughput methods to verify such associations more comprehensively, which is of great significance for the prevention of adverse birth outcomes. DNA methylation was an important mechanism for stable gene repression [42]. High-level methylation could reduce expression of critical proteins, further affect normal physiological functions and result adverse health outcomes. In the current study, high level GPR61 methylation was associated with increased birth weight, this finding provides a new sight for prevention of abnormal birth weight and targeted therapy for specific gene methylation [43].
Our study still had two limitations. Firstly, due to the retrospective study design, our research may have recall bias in the professional interviews, although we checked and obtained consistent results between the questionnaires and hospital records. Meanwhile, due to the inherent weakness of retrospective study and the small sample size of this study, our findings should be cautious to generalize for more vulnerable infants. Hence, prospective studies with large sample population should be done in future. Secondly, we conducted this study in Houzhai Center Hospital in Houzhai town, and observed a low preterm birth rate. Houzhai Center Hospital is a primary hospital with low-level medical services. Therefore, parents with poor health in the area usually do not give birth in this hospital. This may be the reason for the relatively low preterm birth rate in our current study.
-
Birth weight was associated with weather, especially RH and DTR. Maternal and neonatal GPR61 methylation appear to have different roles in the associations between weather and birth weight. Maternal GPR61 methylation seems to modify the susceptibility of birth weight to weather. Changes in neonatal GPR61 methylation can mediate the effect of RH and DTR on birth weight. Our findings provide epidemiological evidence for the cause of birth weight changes and provide a preliminary basis for preventing adverse health outcomes.
-
The authors declare that they have no known competing financial interests or personal relationships that could have appeared to influence the work reported in this paper.
-
We sincerely appreciate the staffs of Houzhai Center Hospital for their effort in this study. We also want to give sincere thanks to all of the subjects enrolled in this study and their families for their supports for this research.
Table S2. The distribution of methylation levels by sex of the newborn
Boys Girls t P Maternal GPR61 promoter methylation (%) 71.98 ± 11.11 70.99 ± 11.29 1.052 0.293 Neonatal GPR61 promoter methylation (%) 73.94 ± 12.24 73.93 ± 11.58 0.009 0.993 Table S4. Spearman correlation of weather conditions and air pollutants
Precipitation AP SSD RH T DTR PM10 SO2 NO2 Entire pregnancy Precipitation 1.00 –0.52 –0.47 0.74 0.52 –0.60 –0.58 –0.51 –0.58 AP 1.00 0.18 –0.29 –0.97 0.29 0.42 0.84 0.85 SSD 1.00 –0.48 –0.19 0.71 0.17 0.19 0.41 RH 1.00 0.24 –0.80 –0.52 –0.01 –0.38 T 1.00 –0.21 –0.41 –0.86 –0.83 DTR 1.00 0.44 0.06 0.46 PM10 1.00 0.19 0.26 SO2 1.00 0.76 NO2 1.00 Trimester 1 Precipitation 1.00 –0.82 –0.02 –0.69 0.79 –0.52 –0.59 –0.83 –0.82 AP 1.00 –0.32 –0.61 –0.98 0.31 0.65 0.93 0.95 SSD 1.00 –0.24 0.29 0.64 0.00 –0.14 –0.16 RH 1.00 0.67 –0.66 –0.66 –0.58 –0.56 T 1.00 –0.28 –0.68 –0.93 –0.90 DTR 1.00 0.45 0.36 0.41 PM10 1.00 0.65 0.60 SO2 1.00 0.93 NO2 1.00 Trimester 2 Precipitation 1.00 –0.76 –0.06 0.53 0.72 –0.43 –0.50 –0.73 –0.73 AP 1.00 –0.23 –0.51 –0.97 0.33 0.67 0.91 0.91 SSD 1.00 –0.39 0.21 0.67 0.01 –0.10 –0.10 RH 1.00 0.59 –0.73 –0.60 –0.47 –0.47 T 1.00 –0.32 –0.72 –0.90 –0.90 DTR 1.00 0.40 0.41 0.41 PM10 1.00 0.68 0.57 SO2 1.00 0.93 NO2 1.00 Trimester 3 Precipitation 1.00 –0.76 –0.06 0.53 0.72 –0.43 –0.50 –0.74 –0.73 AP 1.00 –0.23 –0.51 –0.97 0.33 0.67 0.94 0.91 SSD 1.00 –0.39 0.21 0.67 0.01 –0.20 –0.10 RH 1.00 0.59 –0.73 –0.60 –0.42 –0.47 T 1.00 –0.32 –0.72 –0.94 –0.90 DTR 1.00 0.40 0.29 0.41 PM10 1.00 0.68 0.57 SO2 1.00 0.93 NO2 1.00 Note. All P < 0.05. Abbreviations: AP, atmospheric pressure (hPa); SSD, sunshine duration (h); RH, relative humidity (%); T, average daily mean temperature (°C); DTR, daily temperature range (°C); PM10, particular matter 10; SO2, sulfur dioxide; NO2, nitrogen dioxide.
doi: 10.3967/bes2022.027
Weather and Birth Weight: Different Roles of Maternal and Neonatal GPR61 Promoter Methylation
-
Abstract:
Objectives It is unclear whether G protein-coupled receptor 61 (GPR61) affecting body weight, plays a role in the association between birth weight and weather. This study aimed to assess the effects of prenatal weather and GPR61 on birth weight. Methods A total of 567 mother-newborn pairs were recruited in Houzhai Center Hospital during 2011–2012. We detected the maternal and neonatal GPR61 promoter methylation levels, and obtained meteorological and air pollution data. Results A positive association was observed between maternal and neonatal GPR61 methylation levels, and both of them were affected by precipitation, relative humidity (RH) and daily temperature range (DTR). Birth weight was associated negatively with RH and positively with DTR (P < 0.05). A significant association was observed between birth weight and neonatal GPR61 methylation. We observed that maternal GPR61 methylation seemed to modify associations between weather and birth weight (Pinteraction < 0.10), while neonatal GPR61 methylation mediated the effects of RH and DTR on birth weight (P < 0.05). Conclusions Our findings revealed the significant associations among prenatal weather, GPR61 methylation and birth weight. Maternal GPR61 methylation may modify the susceptibility of birth weight to prenatal weather conditions, while neonatal GPR61 methylation may be a bridge of the effects of prenatal RH and DTR on birth weight. -
Key words:
- Pregnancy /
- Weather /
- Birth weight /
- GPR61 gene /
- DNA methylation /
- Mother-newborns
-
Figure 1. Association between weather and birth weight. The Y-axis represents the change of birth weight with 1 unit (mm for precipitation, hPa for AP, h for SSD, % for RH and °C for T and DTR) increment of weather conditions. (A) Adjustments: RH, gestational age, sex of the newborn, maternal age, maternal education, family income, pregestational BMI, net weight gain, passive smoking, folic acid intake and birth season. (B, C, E, F) Adjustments: gestational age, sex of the newborn, maternal age, maternal education, family income, pregestational BMI, net weight gain, passive smoking, folic acid intake and birth season. (D) Adjustments: precipitation, gestational age, sex of the newborn, maternal age, maternal education, family income, pregestational BMI, net weight gain, passive smoking, folic acid intake and birth season. Abbreviations: AP, atmospheric pressure (hPa); SSD, sunshine duration (h); RH, relative humidity (%); T, average daily mean temperature (°C); DTR, daily temperature range (°C).
S1. Distribution of weather conditions during study period, birth weight, maternal and neonatal GPR61 methylation levels. Abbreviations: AP, atmospheric pressure (hPa); SSD, sunshine duration (h); RH, relative humidity (%); T, average daily mean temperature (°C); DTR, daily temperature range (°C).
S1. Primers for GPR61 gene for QMSP
Primers Sequences (5’–3’) Tm (°C) Lengths of PCR products (bp) MF TGTGTTAGGTTATTGGAGAGGTTAC 53 166 MR CCCTATTTTATAAATAAAAAACCGAA UF TTGTGTTAGGTTATTGGAGAGGTTAT 53 167 UR CCCTATTTTATAAATAAAAAACCAAA Note. M: Methylation; U: Unmethylation; F: Forward; R: Reverse.  下载: 导出CSV
Table 1. Characteristics of study population (n = 567)
Characteristics Mean ± SD or n (%) Maternal Age (year) 26.55 ± 5.28 Height (cm) 160.74 ± 4.52 Pregestational weight (kg) 54.46 ± 7.88 Net weight gain (kg) 14.72 ± 5.37 Pregestational BMI (kg/m2) < 18.5 92 (16.82) 18.5–24.0 367 (67.09) ≥ 24.0 88 (16.09) Folic acid intake Yesa 46 (8.73) No 481 (91.27) Passive smoking Yesb 131 (23.10) No 436 (76.90) Family income (RMB/capita) < 1,000 348 (69.60) 1,000–2,000 130 (26.00) > 2,000 22 (4.40) Education attainment Middle school and below 402 (73.76) High school 111 (20.37) Junior college and above 32 (5.87) Maternal GPR61 promoter methylation (%) 71.55 ± 11.19 Newborns Birth weight (g) 3262.32 ± 428.72 Gestational age (week) < 37 5 (0.88) 37–40 495 (87.30) > 40 67 (11.82) Sex Boys 320 (56.44) Girls 247 (43.56) Birth seasonc Cold season 268 (47.27) Warm season 299 (52.73) Neonatal GPR61 promoter methylation (%) 73.93 ± 11.94 Note. aFolic acid intake was defined as the intake of folic acid and its derivatives (such as tetrahydrofolate and 5-methyl-tetrahydrofolate) at least once a day, for more than 30 days from 3 months before pregnancy to delivery. bPassive smoke exposure was defined as exposure to a smoking environment for at least 15 min a day, for more than a month. cOctober to March and April to September were defined as the cold and warm season, respectively. Abbreviations: RMB, China Yuan.
下载: 导出CSV
S3. Characteristics of weather conditions and air pollutants
Weather conditions Entire pregnancy
(mean ± SD)Trimester 1
(mean ± SD)Trimester 2
(mean ± SD)Trimester 3
(mean ± SD)Precipitation (mm) 278.81 ± 40.90 283.78 ± 129.74 257.85 ± 95.88 294.81 ± 103.75 AP (hPa) 1003.53 ± 1.99 1004.20 ± 6.85 1003.73 ± 6.99 1002.66 ± 6.78 SSD (h) 4.81 ± 0.34 4.89 ± 0.87 4.87 ± 0.74 4.67 ± 1.02 RH (%) 55.83 ± 5.14 56.29 ± 10.51 54.76 ± 9.46 56.44 ± 10.48 T (°C) 15.24 ± 2.58 14.44 ± 8.72 14.83 ± 8.75 16.44 ± 8.49 DTR (°C) 9.78 ± 0.58 9.84 ± 1.11 9.86 ± 0.95 9.64 ± 1.26 PM10 (μg/m3) 106.72 ± 5.50 105.49 ± 15.64 107.43 ± 10.23 107.04 ± 10.96 SO2 (μg/m3) 50.15 ± 7.28 51.96 ± 20.39 51.24 ± 19.74 47.22 ± 18.97 NO2 (μg/m3) 44.21 ± 2.77 44.64 ± 8.16 44.60 ± 7.53 43.36 ± 7.22 Note. Abbreviations: AP, atmospheric pressure (hPa); SSD, sunshine duration (h); RH, relative humidity (%); T, average daily mean temperature (°C); DTR, daily temperature range (°C); PM10, particular matter 10; SO2, sulfur dioxide; NO2, nitrogen dioxide.
下载: 导出CSV
S5. Spearman correlation of trimesters of pregnancy exposures to weather conditions and air pollutants
Meteorological conditions Trimester 1 vs. trimester 2 Trimester 1 vs. trimester 3 Trimester 2 vs. trimester 3 Precipitation –0.35 –0.28 –0.25 AP –0.10 –0.95 –0.08 SSD –0.52 0.08 –0.47 RH 0.15 –0.57 0.08 T –0.10 –0.97 –0.03 DTR –0.24 0.11 –0.15 PM10 –0.06 –0.48 –0.10 SO2 –0.12 –0.90 –0.01 NO2 –0.10 –0.83 –0.04 Note. All P < 0.05. Abbreviations: AP, atmospheric pressure (hPa); SSD, sunshine duration (h); RH, relative humidity (%); T, average daily mean temperature (°C); DTR, daily temperature range (°C); PM10, particular matter 10; SO2, sulfur dioxide; NO2, nitrogen dioxide.
下载: 导出CSV
Table 2. Association between maternal and neonatal GPR61 promoter methylation levelsa
Maternal methylation (%) n Neonatal methylation (%) β (95% CI) P Quartile 1 145 Reference − Quartile 2 141 2.08 (–0.90, 5.06) 0.172 Quartile 3 140 4.58 (1.92, 7.23) < 0.001 Quartile 4 141 16.05 (13.20, 18.90) < 0.001 Trend test < 0.001 Continuous 567 0.55 (0.44, 0.65) < 0.001 Note. aAdjustments: gestational age, sex of the newborn, maternal age, maternal education, family income, pregestational BMI, net weight gain, passive smoking, folic acid intake and birth season.
下载: 导出CSV
Table 3. Association between weather and maternal/neonatal GPR61 promoter methylation levelsa
Meteorological conditions n Entire pregnancy Trimester 1 Trimester 2 Trimester 3 β (95% CI) P β (95% CI) P β (95% CI) P β (95% CI) P Maternal methylation Precipitation (mm)b 567 0.07
(0.04, 0.11)< 0.001 0.02
(0.00, 0.03)0.010 –0.01
(–0.03, 0.01)0.085 0.03
(0.01, 0.04)< 0.001 AP (hPa)c 567 0.95
(0.20, 1.71)0.014 –0.12
(–0.29, 0.04)0.151 0.21
(–0.03, 0.46)0.091 0.15
(–0.01, 0.31)0.074 SSD (h)c 567 0.07
(–2.75, 2.89)0.962 –1.31
(–2.66, 0.05)0.059 1.14
(–0.48, 2.77)0.168 0.30
(–1.07, 1.68)0.665 RH (%)d 567 –0.64
(–0.88, –0.40)< 0.001 –0.15
(–0.32, 0.03)0.105 –0.22
(–0.40, –0.04)0.016 –0.29
(–0.43, –0.14)< 0.001 T (°C)c 567 –0.45
(–1.13, 0.23)0.197 0.12
(0.00, 0.25)0.046 –0.17
(–0.38, 0.05)0.136 –0.12
(–0.25, 0.01)0.053 DTR (°C)c 567 2.89
(1.19, 4.59)0.001 0.23
(–0.74, 1.21)0.640 2.10
(0.96, 3.24)< 0.001 0.65
(–0.27, 1.56)0.165 Neonatal methylation Precipitation (mm)b 567 0.11
(0.08, 0.15)< 0.001 0.03
(0.01, 0.04)< 0.001 –0.01
(–0.02, 0.01)0.295 0.03
(0.02, 0.04)< 0.001 AP (hPa)c 567 0.79
(–0.01, 1.59)0.054 –0.17
(–0.35, 0.01)0.067 0.22
(–0.01, 0.38)0.065 0.18
(–0.01, 0.38)0.066 SSD (h)c 567 –1.29
(–4.23, 1.67)0.394 –1.24
(–2.56, 0.08)0.065 1.84
(0.09, 3.60)0.040 –1.04
(–2.54, 0.44)0.169 RH (%)d 567 –0.82
(–1.07, –0.56)< 0.001 –0.27
(–0.43, –0.10)0.002 –0.24
(–0.42, –0.06)0.009 –0.29
(–0.44, –0.14)< 0.001 T (°C)c 567 –0.33
(–1.01, 0.35)0.334 0.16
(0.02, 0.29)0.023 –0.13
(–0.34, 0.08)0.232 –0.16
(–0.30, –0.02)0.023 DTR (°C)c 567 2.36
(0.48, 4.25)0.014 0.01
(–0.97, 0.98)0.990 2.81
(1.67, 3.96)< 0.001 0.12
(–0.87, 1.10)0.817 Note. aThe assessments of β and the 95% CI were for 1 unit (mm for precipitation, hPa for AP, h for SSD, % for RH and °C for T and DTR) increment in weather conditions. bAdjustments: RH, gestational age, sex of the newborn, maternal age, maternal education, family income, pregestational BMI, net weight gain, passive smoking, folic acid intake and birth season. cAdjustments: gestational age, sex of the newborn, maternal age, maternal education, family income, pregestational BMI, net weight gain, passive smoking, folic acid intake and birth season. dAdjustments: precipitation, gestational age, sex of the newborn, maternal age, maternal education, family income, pregestational BMI, net weight gain, passive smoking, folic acid intake and birth season. Abbreviations: AP, atmospheric pressure (hPa); SSD, sunshine duration (h); RH, relative humidity (%); T, average daily mean temperature (°C); DTR, daily temperature range (°C).
下载: 导出CSV
Table 4. Associations between birth weight and GPR61 promoter methylation levels in maternal and cord blooda
GPR61 methylation n Birth weight (g) β (95% CI) P Maternal Quartile 1 145 Reference − Quartile 2 141 21.05 (–75.43, 117.54) 0.669 Quartile 3 140 –2.58 (–99.17, 94.02) 0.958 Quartile 4 141 37.32 (–65.10, 139.74) 0.475 Trend test 0.495 Continuous 567 1.61 (–1.68, 4.91) 0.338 Neonatal Quartile 1 142 Reference − Quartile 2 142 84.71 (–17.18, 186.60) 0.103 Quartile 3 140 153.92 (58.10, 249.74) 0.002 Quartile 4 143 135.47 (31.19, 239.75) 0.011 Trend test 0.002 Continuous 567 4.01 (0.60, 7.42) 0.021 Note. aAdjustments: gestational age, sex of the newborn, maternal age, maternal education, family income, pregestational BMI, net weight gain, passive smoking, folic acid intake and birth season.
下载: 导出CSV
Table 5. Effect modification of maternal GPR61 methylation on the associations between weather and birth weight
Maternal methylation Effect modification Meteorological conditions Low-level (n = 286) High-level (n = 281) β (95% CI) P β (95% CI) P β (95% CI) Pinteraction Precipitation
(mm)aEntire pregnancy 0.79 (–0.92, 2.49) 0.364 –1.04 (–3.02, 0.945) 0.305 –1.51 (–3.25, 0.23) 0.089 Trimester 1 0.46 (–0.14, 1.07) 0.130 –0.41 (–1.14, 0.31) 0.266 –0.14 (–0.71, 0.42) 0.615 Trimester 2 0.74 (0.09, 1.38) 0.026 0.02 (–0.74, 0.77) 0.964 –0.55 (–1.31, 0.21) 0.155 Trimester 3 –0.22 (–0.86, 0.43) 0.507 0.49 (–0.25, 1.22) 0.194 0.01 (–0.70, 0.72) 0.984 AP (hPa)b Entire pregnancy –47.90 (–85.85, –9.95) 0.013 34.77 (–10.60, 80.14) 0.133 43.37 (6.35, 80.39) 0.022 Trimester 1 3.64 (–4.72, 11.99) 0.394 2.03 (–6.20, 10.27) 0.628 2.87 (–8.06, 13.80) 0.606 Trimester 2 –10.33 (–22.03, 1.38) 0.084 5.78 (–6.78, 18.33) 0.367 10.27 (–0.72, 21.26) 0.067 Trimester 3 –5.66 (–14.34, 3.01) 0.201 –1.27 (–10.09, 7.55) 0.778 –1.74 (–12.80, 9.32) 0.758 SSD (h)b Entire pregnancy 46.16 (–117.54, 209.86) 0.581 –44.42 (–178.49, 89.65) 0.516 –107.93 (–314.66, 98.80) 0.306 Trimester 1 16.70 (–52.10, 85.49) 0.634 –41.49 (–115.04, 32.06) 0.269 –92.36 (–183.94, –0.79) 0.048 Trimester 2 101.04 (20.88, 181.19) 0.014 –29.08 (–101.95, 43.78) 0.434 –96.55 (–204.62, 11.52) 0.080 Trimester 3 –68.50 (–138.67, 1.68) 0.056 21.41 (–39.87, 82.68) 0.494 63.97 (–10.76, 138.70) 0.093 RH (%)c Entire pregnancy –23.544 (–38.10.–8.98) 0.002 –13.47 (–26.69, –0.25) 0.046 –1.69 (–15.56, 12.18) 0.811 Trimester 1 –14.45 (–22.40, –6.50) < 0.001 1.62 (–7.42, 10.66) 0.725 7.08 (–0.20, 14.37) 0.057 Trimester 2 –12.06 (–20.94, –3.18) 0.008 –10.61 (–18.17, –3.06) 0.006 –4.71 (–12.53, 3.11) 0.238 Trimester 3 2.35 (–4.68, 9.37) 0.513 –8.08 (–15.68, –0.49) 0.037 –4.65 (–12.00, 2.69) 0.214 T (°C)b Entire pregnancy 41.00 (7.31, 74.69) 0.017 –15.72 (–53.87, 22.43) 0.419 –30.37 (–59.40, –1.33) 0.040 Trimester 1 –3.50 (–9.55, 2.55) 0.257 0.13 (–6.28, 6.54) 0.968 0.54 (–8.12, 9.20) 0.902 Trimester 2 12.42 (1.86, 22.98) 0.021 –7.52 (–18.87, 3.82) 0.194 –9.23 (–17.79, –0.66) 0.035 Trimester 3 3.79 (–2.61, 10.19) 0.246 0.97 (–5.61, 7.55) 0.772 0.69 (–8.04, 9.41) 0.878 DTR (°C)b Entire pregnancy 91.01 (–5.05, 187.08) 0.063 107.06 (17.17, 196.95) 0.020 12.57 (–109.46, 134.59) 0.840 Trimester 1 45.15 (–5.08, 95.38) 0.078 23.59 (–20.67, 67.85) 0.296 –35.27 (–102.07, 31.54) 0.301 Trimester 2 80.08 (20.96, 139.20) 0.008 45.63 (–15.95, 107.22) 0.146 1.76 (–77.89, 81.41) 0.965 Trimester 3 –22.16 (–67.46, 23.13) 0.338 28.38 (–15.15, 71.91) 0.201 37.15 (–23.85, 98.15) 0.233 Note. aAdjustments: RH, gestational age, sex of the newborn, maternal age, maternal education, family income, pregestational BMI, net weight gain, passive smoking, folic acid intake and birth season. bAdjustments: gestational age, sex of the newborn, maternal age, maternal education, family income, pregestational BMI, net weight gain, passive smoking, folic acid intake and birth season. cAdjustments: precipitation, gestational age, sex of the newborn, maternal age, maternal education, family income, pregestational BMI, net weight gain, passive smoking, folic acid intake and birth season. Abbreviations: AP, atmospheric pressure (hPa); SSD, sunshine duration (h); RH, relative humidity (%); T, average daily mean temperature (°C); DTR, daily temperature range (°C).
下载: 导出CSV
Table 6. Effect modification of neonatal GPR61 methylation on the associations between weather and birth weight
Neonatal methylation Effect modification Meteorological conditions Low-level (n = 284) High-level (n = 283) β (95% CI) P β (95% CI) P β (95% CI) Pinteraction Precipitation
(mm)aEntire pregnancy –0.10 (–1.92, 1.71) 0.910 –1.54 (–3.50, 0.43) 0.125 –1.31 (–3.07, 0.45) 0.145 Trimester 1 –0.01 (–0.65, 0.62) 0.966 –0.40 (–1.15, 0.36) 0.305 0.01 (–0.57, 0.59) 0.967 Trimester 2 0.61 (–0.06, 1.28) 0.073 0.58 (–0.16, 1.33) 0.125 –0.28 (–1.04, 0.48) 0.475 Trimester 3 –0.04 (–0.68, 0.61) 0.911 –0.29 (–1.05, 0.48) 0.459 –0.45 (–1.15, 0.24) 0.203 AP (hPa)b Entire pregnancy –35.67 (–73.93, 2.58) 0.068 11.17 (–33.60, 55.94) 0.625 26.77 (–9.71, 63.25) 0.150 Trimester 1 3.07 (–5.69, 11.84) 0.492 4.22 (–3.53, 11.96) 0.286 1.97 (–8.99, 12.92) 0.725 Trimester 2 –6.04 (–17.74, 5.65) 0.311 0.45 (–11.97, 12.87) 0.944 4.91 (–5.92, 15.73) 0.374 Trimester 3 –5.78 (–14.97, 3.41) 0.218 –3.75 (–11.91, 4.41) 0.368 0.36 (–10.68, 11.40) 0.950 SSD (h)b Entire pregnancy –3.05 (–171.93, 165.84) 0.972 19.16 (–110.57, 148.88) 0.772 33.50 (–172.58, 239.57) 0.750 Trimester 1 26.18 (–46.31, 98.67) 0.479 –32.98 (–102.50, 36.55) 0.353 –52.33 (–143.77, 39.11) 0.262 Trimester 2 56.47 (–26.13, 139.06) 0.180 4.44 (–65.61, 74.49) 0.901 –65.84 (–173.51, 41.83) 0.231 Trimester 3 –67.97 (–138.38, 2.44) 0.059 33.74 (–26.31, 93.78) 0.271 78.66 (4.89, 152.42) 0.037 RH (%)c Entire pregnancy –15.23 (–30.17, –0.29) 0.046 –13.66 (–27.35, 0.02) 0.050 –6.12 (–19.84, 7.61) 0.382 Trimester 1 –8.52 (–16.65, –0.38) 0.040 –0.66 (–9.81, 8.49) 0.887 4.48 (–2.79, 11.74) 0.228 Trimester 2 –8.28 (–18.19, 1.63) 0.102 –12.97 (–19.82, –6.12) < 0.001 –4.25 (–12.09, 3.59) 0.288 Trimester 3 0.55 (–6.47, 7.56) 0.879 –1.67 (–9.57, 6.24) 0.680 –5.29 (–12.46, 1.89) 0.149 T (°C)b Entire pregnancy 30.04 (–4.84, 64.92) 0.091 –4.09 (–40.31, 32.12) 0.825 –17.29 (–46.13, 11.55) 0.240 Trimester 1 –2.58 (–8.77, 3.61) 0.415 –2.52 (–8.60, 3.56) 0.416 –0.18 (–8.75, 8.40) 0.968 Trimester 2 7.11 (–3.27, 17.49) 0.179 –1.77 (–13.27, 9.73) 0.763 –4.28 (–12.75, 4.19) 0.322 Trimester 3 3.29 (–3.33, 9.91) 0.330 2.78 (–3.42, 8.98) 0.380 0.00 (–8.67, 8.68) 0.999 DTR (°C)b Entire pregnancy 63.23 (–35.80, 162.26) 0.211 127.54 (40.24, 214.84) 0.004 69.64 (–51.18, 190.46) 0.259 Trimester 1 52.74 (–1.60, 107.08) 0.057 27.17 (–14.57, 68.92) 0.202 –22.22 (–90.11, 45.66) 0.521 Trimester 2 40.52 (–23.07, 104.10) 0.212 79.07 (20.09, 138.06) 0.009 32.54 (–47.54, 112.62) 0.426 Trimester 3 –18.36 (–65.24, 28.51) 0.443 18.47 (–22.69, 59.63) 0.379 45.79 (–14.32, 105.91) 0.135 Note. aAdjustments: RH, gestational age, sex of the newborn, maternal age, maternal education, family income, pregestational BMI, net weight gain, passive smoking, folic acid intake and birth season. bAdjustments: gestational age, sex of the newborn, maternal age, maternal education, family income, pregestational BMI, net weight gain, passive smoking, folic acid intake and birth season. cAdjustments: precipitation, gestational age, sex of the newborn, maternal age, maternal education, family income, pregestational BMI, net weight gain, passive smoking, folic acid intake and birth season. Abbreviations: AP, atmospheric pressure (hPa); SSD, sunshine duration (h); RH, relative humidity (%); T, average daily mean temperature (°C); DTR, daily temperature range (°C); PM10, particular matter 10; SO2, sulfur dioxide; NO2, nitrogen dioxide.
下载: 导出CSV
Table 7. Mediation analysis for the role of neonatal GPR61 methylation in the effects of RH and DTR on birth weight
Meteorological conditions n Total effect, Direct effect, Proportion mediated by methylation
(95% CI)P β (95% CI) β (95% CI) RH (%)a Entire pregnancy 567 –19.34 (–20.04, –9.64) –15.59 (–26.04, –5.14) 19.4 (6.1, 47.0) 0.014 Trimester 1 567 –7.51 (–13.53, –1.49) –5.35 (–11.05, 0.95) 28.8 (8.0, 65.3) 0.003 Trimester 2 567 –11.80 (–17.47, –6.13) –10.57 (–16.66, –4.83) 8.9 (1.7, 35.9) 0.097 DTR (°C)b Entire pregnancy 567 108.67 (42.40, 174.94) 93.57 (26.20, 160, 94) 13.9 (3.7, 40.7) 0.041 Trimester 2 567 71.28 (27.14, 115.42) 58.15 (11.60, 104.69) 18.4 (4.7, 50.9) 0.033 Note. aAdjustments: precipitation, gestational age, sex of the newborn, maternal age, maternal education, family income, pregestational BMI, net weight gain, passive smoking, folic acid intake, birth season. bAdjustments: gestational age, sex of the newborn, maternal age, maternal education, family income, pregestational BMI, net weight gain, passive smoking, folic acid intake, birth season. Abbreviations: RH, relative humidity (%); DTR, daily temperature range (°C).
下载: 导出CSV
S6. Analysis of the relationship between weather conditions and maternal/neonatal GPR61 promoter methylation levels after adjusting PM10a
Meteorological factors n Entire pregnancy Trimester 1 Trimester 2 Trimester 3 β (95% CI) P β (95% CI) P β (95% CI) P β (95% CI) P Maternal methylation Precipitation (mm)b 567 0.07 (0.02, 0.11) 0.003 0.02 (0.00, 0.03) 0.024 –0.02 (–0.03, –0.00) 0.033 0.03 (0.01, 0.04) < 0.001 AP (hPa)c 567 0.78 (0.08, 1.47) 0.030 –0.16 (–0.47, 0.15) 0.315 0.28 (0.03, 0.59) 0.031 0.27 (–0.05, 0.58) 0.093 SSD (h)c 567 1.37 (–2.13, 4.87) 0.443 –1.41 (–2.80, –0.01) 0.049 1.18 (–0.48, 2.84) 0.164 0.45 (–1.00, 1.90) 0.539 RH (%)d 567 –0.67 (–0.94, –0.40) < 0.001 –0.17 (–0.35, 0.02) 0.075 –0.28 (–0.47, –0.08) 0.005 –0.31 (–0.45, –0.16) < 0.001 T (°C)c 567 –0.34 (–0.96, 0.29) 0.294 0.20 (–0.01, 0.40) 0.059 –0.23 (–0.46, –0.01) 0.043 –0.19 (–0.38, –0.00) 0.047 DTR (°C)c 567 4.08 (2.23, 5.93) < 0.001 0.66 (–0.39, 1.71) 0.219 2.59 (1.41, 3.77) < 0.001 0.68 (–0.29, 1.66) 0.170 Neonatal methylation Precipitation (mm)b 567 0.11 (0.07, 0.15) < 0.001 0.02 (0.01, 0.04) 0.003 –0.01 (–0.03, 0.01) 0.197 0.03 (0.02, 0.04) < 0.001 AP (hPa)c 567 0.57 (–0.11, 1.24) 0.102 –0.06 (–0.40, 0.30) 0.762 0.27 (0.03, 0.51) 0.026 0.46 (0.19, 0.73) < 0.001 SSD (h)c 567 –0.62 (–4.08, 2.84) 0.727 –1.45 (–2.79, –0.12) 0.033 1.85 (0.14, 3.56) 0.034 –0.78 (–2.37, 0.80) 0.332 RH (%)d 567 –0.87 (–1.12, –0.62) < 0.001 –0.35 (–0.52, –0.17) < 0.001 –0.29 (–0.48, –0.11) 0.002 –0.32 (–0.47, –0.17) < 0.001 T (°C)c 567 –0.11 (–0.67, 0.45) 0.697 0.13 (–0.12, 0.37) 0.305 –0.19 (–0.41, 0.03) 0.087 –0.34 (–0.52, –0.15) < 0.001 DTR (°C)c 567 3.85 (1.85, 5.85) < 0.001 0.75 (–0.33, 1.84) 0.174 3.29 (2.10, 4.48) < 0.001 0.15 (–0.92, 1.23) 0.783 Note. aThe assessments of β and the 95% CI were for 1 unit (mm for precipitation, hPa for AP, h for SSD, % for RH and °C for T and DTR) increment of weather conditions. bAdjustments: RH, gestational age, sex of the newborn, maternal age, maternal education, family income, pregestational BMI, net weight gain, passive smoking, folic acid intake, birth season and PM10. cAdjustments: gestational age, sex of the newborn, maternal age, maternal education, family income, pregestational BMI, net weight gain, passive smoking, folic acid intake, birth season and PM10. dAdjustments: precipitation, gestational age, sex of the newborn, maternal age, maternal education, family income, pregestational BMI, net weight gain, passive smoking, folic acid intake, birth season and PM10. Abbreviations: AP, atmospheric pressure (hPa); SSD, sunshine duration (h); RH, relative humidity (%); T, average daily mean temperature (°C); DTR, daily temperature range (°C); PM10, particular matter 10; SO2, sulfur dioxide; NO2, nitrogen dioxide.
下载: 导出CSV
S7. Analysis of the relationship between weather conditions and birth weight after adjusting PM10a
Meteorological factors n Entire pregnancy Trimester 1 Trimester 2 Trimester 3 β (95% CI) P β (95% CI) P β (95% CI) P β (95% CI) P Precipitation (mm)b 567 –0.40
(–1.77, 0.97)0.567 0.04
(–0.44, 0.51)0.883 0.43
(–0.05, 0.90)0.077 0.14
(–0.13, 0.60)0.536 AP (hPa)c 567 –3.49
(–30.49, 23.51)0.800 –4.50
(–13.67, 4.67)0.336 –1.69
(–10.44, 7.06)0.705 7.60
(–1.93, 17.14)0.118 SSD (h)c 567 40.67
(–93.78, 175.12)0.553 –5.89
(–60.60, 48.83)0.833 30.11
(–26.09, 86.31)0.294 2.46
(–51.85, 56.78)0.929 RH (%)d 567 –19.21
(–29.20, –9.21)< 0.001 –8.18
(–15.24, –1.12)0.023 –11.25
(–17.21, –5.30)< 0.001 –7.70
(–13.44, –1.96)0.009 T (°C)c 567 3.90
(–18.96, 26.76)0.738 3.73
(–3.01, 10.47)0.278 2.30
(–6.04, 10.64)0.589 –5.14
(–11.37, 1.09)0.106 DTR (°C)c 567 121.93
(50.30, 193.56)< 0.001 28.40
(–11.12, 67.91)0.159 67.28
(19.66, 114.91)0.006 28.57
(–9.95, 67.09)0.146 Note. aThe assessments of β and the 95% CI were for 1 unit (mm for precipitation, hPa for AP, h for SSD, % for RH and °C for T and DTR) increment of weather conditions. bAdjustments: RH, gestational age, sex of the newborn, maternal age, maternal education, family income, pregestational BMI, net weight gain, passive smoking, folic acid intake, birth season and PM10. cAdjustments: gestational age, sex of the newborn, maternal age, maternal education, family income, pregestational BMI, net weight gain, passive smoking, folic acid intake, birth season and PM10. dAdjustments: precipitation, gestational age, sex of the newborn, maternal age, maternal education, family income, pregestational BMI, net weight gain, passive smoking, folic acid intake, birth season and PM10. Abbreviations: AP, atmospheric pressure (hPa); SSD, sunshine duration (h); RH, relative humidity (%); T, average daily mean temperature (°C); DTR, daily temperature range (°C); PM10, particular matter 10; SO2, sulfur dioxide; NO2, nitrogen dioxide.
下载: 导出CSV
S8. Association between weather conditions and birth weight with further adjusting exposures during all trimesters of pregnancy
Weather conditions n Birth weight β (95% CI) P RHa Trimester 1 567 –6.26 (–12.17, –0.36) 0.038 Trimester 2 567 –8.86 (–16.40, –1.32) 0.021 Trimester 3 567 –2.99 (–7.87, 1.89) 0.230 DTRb Trimester 1 567 49.27 (15.74, 82.76) 0.004 Trimester 2 567 92.09 (45.70, 138.49) < 0.001 Trimester 3 567 14.86 (–20.11, 49.83) 0.405 Note. aAdjustments: precipitation, gestational age, sex of the newborn, maternal age, maternal education, family income, pregestational BMI, net weight gain, passive smoking, folic acid intake and birth season. bAdjustments: gestational age, sex of the newborn, maternal age, maternal education, family income, pregestational BMI, net weight gain, passive smoking, folic acid intake and birth season. Abbreviations: RH, relative humidity (%); DTR, daily temperature range (°C).
下载: 导出CSV
S2. The distribution of methylation levels by sex of the newborn
Boys Girls t P Maternal GPR61 promoter methylation (%) 71.98 ± 11.11 70.99 ± 11.29 1.052 0.293 Neonatal GPR61 promoter methylation (%) 73.94 ± 12.24 73.93 ± 11.58 0.009 0.993
下载: 导出CSV
S4. Spearman correlation of weather conditions and air pollutants
Precipitation AP SSD RH T DTR PM10 SO2 NO2 Entire pregnancy Precipitation 1.00 –0.52 –0.47 0.74 0.52 –0.60 –0.58 –0.51 –0.58 AP 1.00 0.18 –0.29 –0.97 0.29 0.42 0.84 0.85 SSD 1.00 –0.48 –0.19 0.71 0.17 0.19 0.41 RH 1.00 0.24 –0.80 –0.52 –0.01 –0.38 T 1.00 –0.21 –0.41 –0.86 –0.83 DTR 1.00 0.44 0.06 0.46 PM10 1.00 0.19 0.26 SO2 1.00 0.76 NO2 1.00 Trimester 1 Precipitation 1.00 –0.82 –0.02 –0.69 0.79 –0.52 –0.59 –0.83 –0.82 AP 1.00 –0.32 –0.61 –0.98 0.31 0.65 0.93 0.95 SSD 1.00 –0.24 0.29 0.64 0.00 –0.14 –0.16 RH 1.00 0.67 –0.66 –0.66 –0.58 –0.56 T 1.00 –0.28 –0.68 –0.93 –0.90 DTR 1.00 0.45 0.36 0.41 PM10 1.00 0.65 0.60 SO2 1.00 0.93 NO2 1.00 Trimester 2 Precipitation 1.00 –0.76 –0.06 0.53 0.72 –0.43 –0.50 –0.73 –0.73 AP 1.00 –0.23 –0.51 –0.97 0.33 0.67 0.91 0.91 SSD 1.00 –0.39 0.21 0.67 0.01 –0.10 –0.10 RH 1.00 0.59 –0.73 –0.60 –0.47 –0.47 T 1.00 –0.32 –0.72 –0.90 –0.90 DTR 1.00 0.40 0.41 0.41 PM10 1.00 0.68 0.57 SO2 1.00 0.93 NO2 1.00 Trimester 3 Precipitation 1.00 –0.76 –0.06 0.53 0.72 –0.43 –0.50 –0.74 –0.73 AP 1.00 –0.23 –0.51 –0.97 0.33 0.67 0.94 0.91 SSD 1.00 –0.39 0.21 0.67 0.01 –0.20 –0.10 RH 1.00 0.59 –0.73 –0.60 –0.42 –0.47 T 1.00 –0.32 –0.72 –0.94 –0.90 DTR 1.00 0.40 0.29 0.41 PM10 1.00 0.68 0.57 SO2 1.00 0.93 NO2 1.00 Note. All P < 0.05. Abbreviations: AP, atmospheric pressure (hPa); SSD, sunshine duration (h); RH, relative humidity (%); T, average daily mean temperature (°C); DTR, daily temperature range (°C); PM10, particular matter 10; SO2, sulfur dioxide; NO2, nitrogen dioxide.
下载: 导出CSV
-
[1] Lawn JE, Blencowe H, Oza S, et al. Every Newborn: progress, priorities, and potential beyond survival. Lancet, 2014; 384, 189−205. doi: 10.1016/S0140-6736(14)60496-7 [2] Cardenas A, Lutz SM, Everson TM, et al. Mediation by placental DNA methylation of the association of prenatal maternal smoking and birth weight. Am J Epidemiol, 2019; 188, 1878−86. doi: 10.1093/aje/kwz184 [3] Bell GA, Perkins N, Louis GMB, et al. Exposure to persistent organic pollutants and birth characteristics: the upstate KIDS study. Epidemiology, 2019; 30 Suppl 2, S94-100. [4] Olsson D, Johansson C, Forsberg B. Associations between vehicle exhaust particles and ozone at home address and birth weight. Int J Environ Res Public Health, 2020; 17, 3836. doi: 10.3390/ijerph17113836 [5] Basagaña X, Michael Y, Lensky IM, et al. Low and high ambient temperatures during pregnancy and birth weight among 624, 940 singleton term births In israel (2010-2014): an investigation of potential windows of susceptibility. Environ Health Perspect, 2021; 129, 107001. doi: 10.1289/EHP8117 [6] Wang WX, Lv J, Yu CQ, et al. Lifestyle factors and fetal and childhood origins of type 2 diabetes: A prospective study of Chinese and European adults. Am J Clin Nutr, 2021; nqab359. doi: 10.1093/ajcn/nqab359 [7] Weng YH, Yang CY, Chiu YW. Adverse neonatal outcomes in relation to ambient temperatures at birth: A nationwide survey in Taiwan. Arch Environ Occup Health, 2018; 73, 48−55. doi: 10.1080/19338244.2017.1299084 [8] Jakpor O, Chevrier C, Kloog I, et al. Term birthweight and critical windows of prenatal exposure to average meteorological conditions and meteorological variability. Environ Int, 2020; 142, 105847. doi: 10.1016/j.envint.2020.105847 [9] Roth S, Kholodenko BN, Smit MJ, et al. G protein-coupled receptor signaling networks from a systems perspective. Mol Pharmacol, 2015; 88, 604−16. doi: 10.1124/mol.115.100057 [10] Bockaert J, Pin JP. Molecular tinkering of G protein-coupled receptors: an evolutionary success. EMBO J, 1999; 18, 1723−9. doi: 10.1093/emboj/18.7.1723 [11] Nambu H, Fukushima M, Hikichi H, et al. Characterization of metabolic phenotypes of mice lacking GPR61, an orphan G-protein coupled receptor. Life Sci, 2011; 89, 765−72. doi: 10.1016/j.lfs.2011.09.002 [12] Felix JF, Bradfield JP, Monnereau C, et al. Genome-wide association analysis identifies three new susceptibility loci for childhood body mass index. Hum Mol Genet, 2016; 25, 389−403. doi: 10.1093/hmg/ddv472 [13] Abraham E, Rousseaux S, Agier L, et al. Pregnancy exposure to atmospheric pollution and meteorological conditions and placental DNA methylation. Environ Int, 2018; 118, 334−47. doi: 10.1016/j.envint.2018.05.007 [14] Feng FF, Huang L, Zhou GY, et al. GPR61 methylation in cord blood: a potential target of prenatal exposure to air pollutants. Int J Environ Health Res, 2020; 1−10. [15] Zhou GY, He TK, Huang H, et al. Prenatal ambient air pollution exposure and SOD2 promoter methylation in maternal and cord blood. Ecotoxicol Environ Saf, 2019; 181, 428−34. doi: 10.1016/j.ecoenv.2019.06.039 [16] Moutquin JM. Classification and heterogeneity of preterm birth. BJOG, 2003; 110, 30−3. doi: 10.1016/S1470-0328(03)00021-1 [17] Wu MY, Song LL, Zheng XX, et al. Prenatal exposure of diurnal temperature range and preterm birth: Findings from a birth cohort study in China. Sci Total Environ, 2019; 656, 1102−7. doi: 10.1016/j.scitotenv.2018.11.305 [18] Yu ZZ, Armant O, Fischer R. Fungi use the SakA (HogA) pathway for phytochrome-dependent light signalling. Nat Microbiol, 2016; 1, 16019. doi: 10.1038/nmicrobiol.2016.19 [19] Lo YMD, Wong IHN, Zhang J, et al. Quantitative analysis of aberrant p16 methylation using real-time quantitative methylation-specific polymerase chain reaction. Cancer Res, 1999; 59, 3899−903. [20] Lee DH, Keum N, Hu FB, et al. Predicted lean body mass, fat mass, and all cause and cause specific mortality in men: prospective US cohort study. BMJ, 2018; 362, k2575. [21] Bellinger DC. Effect modification in epidemiologic studies of low-level neurotoxicant exposures and health outcomes. Neurotoxicol Teratol, 2000; 22, 133−40. doi: 10.1016/S0892-0362(99)00053-7 [22] Lin DY, Fleming TR, De Gruttola V. Estimating the proportion of treatment effect explained by a surrogate marker. Statist Med, 1997; 16, 1515−27. doi: 10.1002/(SICI)1097-0258(19970715)16:13<1515::AID-SIM572>3.0.CO;2-1 [23] Cai J, Zhao Y, Liu PC, et al. Exposure to particulate air pollution during early pregnancy is associated with placental DNA methylation. Sci Total Environ, 2017; 607−608,1103-8. [24] Greenland S. Modeling and variable selection in epidemiologic analysis. Am J Public Health, 1989; 79, 340−9. doi: 10.2105/AJPH.79.3.340 [25] Yang YW, You EQ, Wu JJ, et al. Effects of relative humidity on childhood hand, foot, and mouth disease reinfection in Hefei, China. Sci Total Environ, 2018; 630, 820−6. doi: 10.1016/j.scitotenv.2018.02.262 [26] Kloog I, Novack L, Erez O, et al. Associations between ambient air temperature, low birth weight and small for gestational age in term neonates in southern Israel. Environ Health, 2018; 17, 76. doi: 10.1186/s12940-018-0420-z [27] Chen X, Li N, Liu JW, et al. Global heat wave hazard considering humidity effects during the 21st century. Int J Environ Res Public Health, 2019; 16, 1513. doi: 10.3390/ijerph16091513 [28] Lou CR, Liu HY, Li YF, et al. Relationships of relative humidity with PM2.55. and PM10 in the Yangtze River Delta, China. Environ Monit Assess, 2017; 189, 582. doi: 10.1007/s10661-017-6281-z [29] Davis RE, McGregor GR, Enfield KB. Humidity: a review and primer on atmospheric moisture and human health. Environ Res, 2016; 144, 106−16. doi: 10.1016/j.envres.2015.10.014 [30] Siniarska A, Kozieł S. Association of birth weight and length with air temperature, sunlight, humidity and rainfall in the city of Warsaw, Poland. HOMO, 2010; 61, 373−80. doi: 10.1016/j.jchb.2010.07.001 [31] Talmage CA, Frederick C. Quality of life, multimodality, and the demise of the autocentric metropolis: a multivariate analysis of 148 mid-size U. S. cities. Soc Indic Res, 2019; 141, 365−90. doi: 10.1007/s11205-017-1829-4 [32] Sun SZ, Spangler KR, Weinberger KR, et al. Ambient temperature and markers of fetal growth: a retrospective observational study of 29 million U. S. singleton births. Environ Health Perspect, 2019; 127, 067005. doi: 10.1289/EHP4648 [33] Gong YH, Ji CY, Shan JP. A longitudinal study on the catch-up growth of preterm and term infants of low, appropriate, and high birth weight. Asia Pac J Public Health, 2015; 27, NP1421−31. doi: 10.1177/1010539513489129 [34] Díaz J, Arroyo V, Ortiz C, et al. Effect of environmental factors on low weight in non-premature births: a time series analysis. PLoS One, 2016; 11, e0164741. doi: 10.1371/journal.pone.0164741 [35] Grantz KL, Kim S, Grobman WA, et al. Fetal growth velocity: the NICHD fetal growth studies. Am J Obstet Gynecol, 2018; 219, 285.e1−36. doi: 10.1016/j.ajog.2018.05.016 [36] Min L, Li YY, Hu Q, et al. Sugar and auxin signaling pathways respond to high-temperature stress during anther development as revealed by transcript profiling analysis in cotton. Plant Physiol, 2014; 164, 1293−308. doi: 10.1104/pp.113.232314 [37] Fransquet PD, Lacaze P, Saffery R, et al. Blood DNA methylation as a potential biomarker of dementia: a systematic review. Alzheimers Dement, 2018; 14, 81−103. doi: 10.1016/j.jalz.2017.10.002 [38] Joo JE, Dowty JG, Milne RL, et al. Heritable DNA methylation marks associated with susceptibility to breast cancer. Nat Commun, 2018; 9, 867. doi: 10.1038/s41467-018-03058-6 [39] Tian FY, Hivert MF, Wen XZ, et al. Tissue differences in DNA methylation changes at AHRR in full term low birth weight in maternal blood, placenta and cord blood in Chinese. Placenta, 2017; 52, 49−57. doi: 10.1016/j.placenta.2017.02.017 [40] Simons MJP, Reimert I, Van Der Vinne V, et al. Ambient temperature shapes reproductive output during pregnancy and lactation in the common vole (Microtus arvalis): a test of the heat dissipation limit theory. J Exp Biol, 2011; 214, 38−49. doi: 10.1242/jeb.044230 [41] Tong SL, Olsen J, Kinney PL. Climate change and temperature-related mortality: implications for health-related climate policy. Biomed Environ Sci, 2021; 34, 379−86. [42] Almouzni G, Cedar H. Maintenance of epigenetic information. Cold Spring Harb Perspect Biol, 2016; 8, a019372. doi: 10.1101/cshperspect.a019372 [43] Li B, Zhao J, Ma JX, et al. Overexpression of DNMT1 leads to hypermethylation of H19 promoter and inhibition of Erk signaling pathway in disuse osteoporosis. Bone, 2018; 111, 82−91. doi: 10.1016/j.bone.2018.03.017 -
 21255Supplementary Materials.pdf

-

 点击查看大图
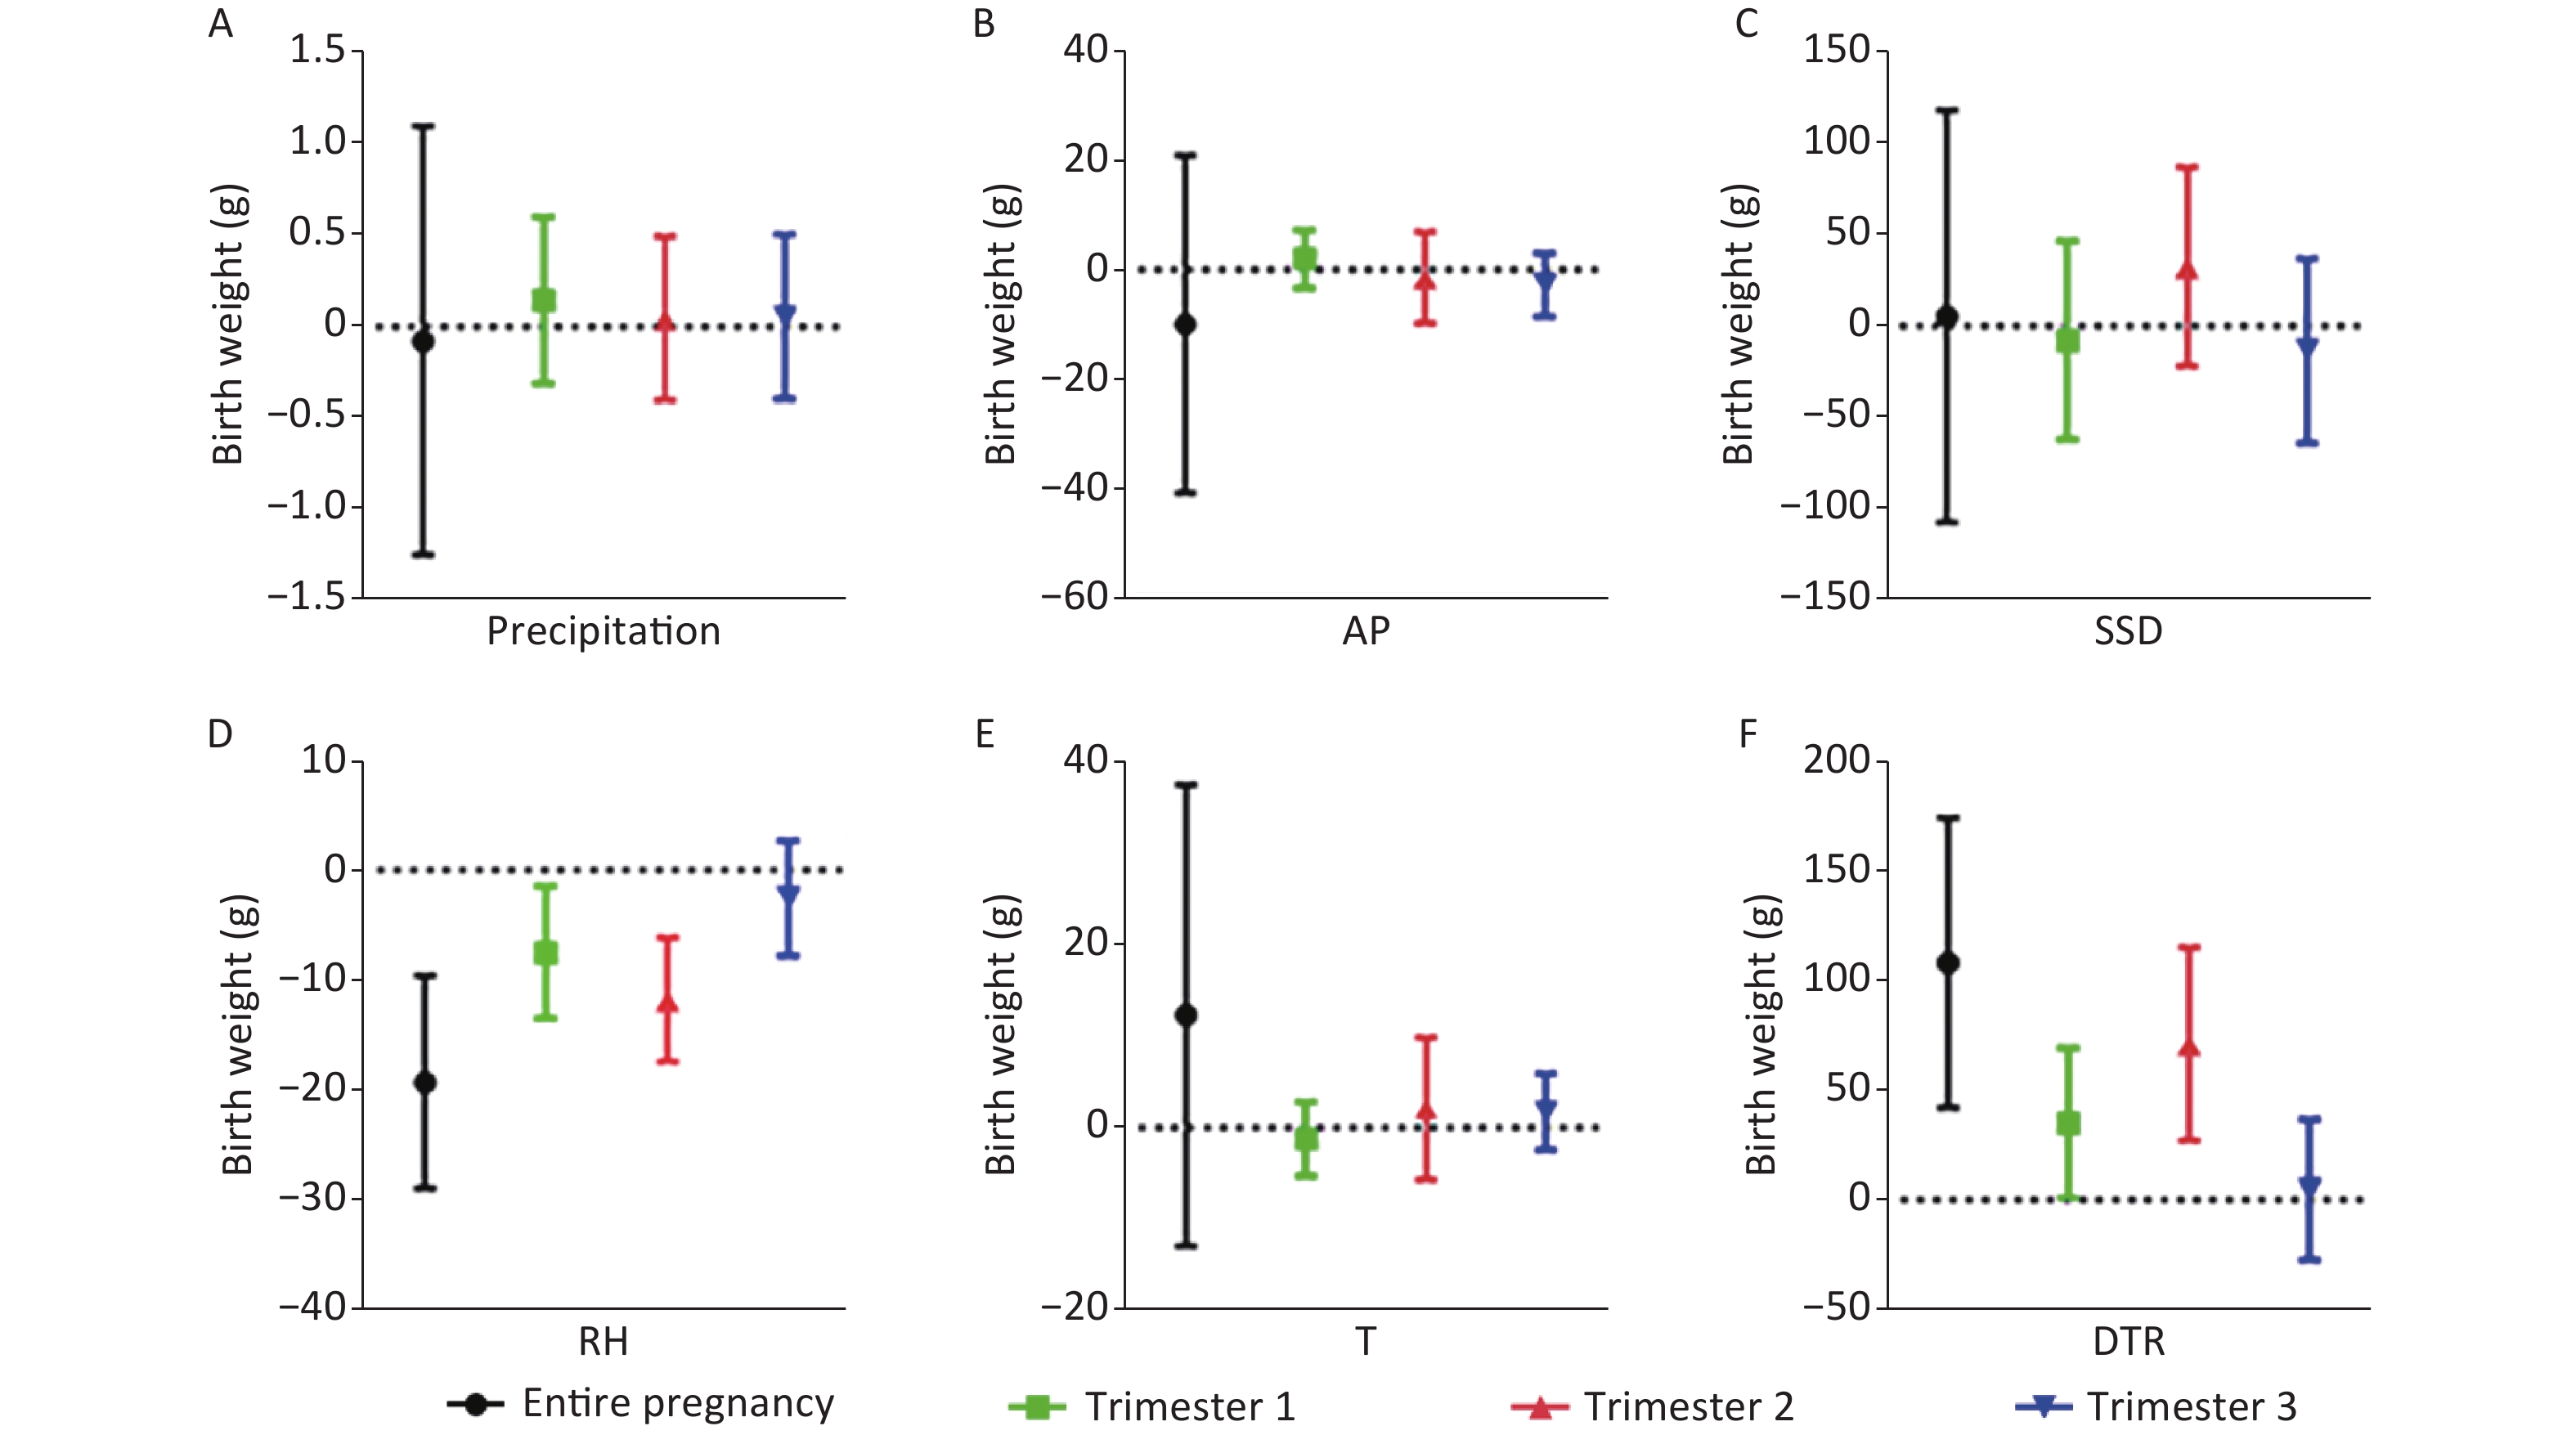
计量
- 文章访问数: 896
- HTML全文浏览量: 396
- PDF下载量: 80
- 被引次数: 0

 Quick Links