

 下载:
下载:


-
Obesity and T2DM have now become serious epidemics in public health issues worldwide. T2DM is considered a multifactorial disease, which is promoted by genetic and environmental factors and characterized by chronic hyperglycemia and insulin resistance (IR) [1]. According to the report of the World Health Organization, overweight and obesity account for 44% of diabetes cases in most European countries; overweight and obesity are also responsible for about 80% of T2DM cases [2], suggesting that obesity is deeply involved in T2DM development. Being overweight itself increases the risk of the same complications as obesity. The risk is particularly high when excess adipose tissue is distributed intra-abdominally [as characterized by a high waist circumference (WC)] [1]. Obese T2DM patients not only have worse metabolic control than normal-weight T2DM patients but also are at an extremely high risk of future diabetes-related cardiovascular–renal complications, which may, in turn, increase the mortality risk of individuals seven-fold.
Vitamin D deficiency is a common health problem in China that is typically defined as serum 25-hydroxyvitamin D [25(OH)D] < 20 ng/mL [3]. Vitamin D status is negatively associated with insulin sensitivity and T2DM. Importantly, compared with the general obesity rate, the prevalence of abdominal obesity in the Chinese population is higher. The measurement of abdominal obesity is strongly and positively associated with the all-cause independence of general obesity; it may be a better predictor of the risk of T2DM than others [4]. Therefore, preventing the co-occurrence of obesity and T2DM is critically significant. This study aimed to investigate the association of vitamin D with obesity and T2DM comorbidity and explore the role of WC in this association.
In July 2013, the participants were enrolled in rural Henan by cluster sampling in Jiaozuo and Zhengzhou. Participants aged 18–80 years with a body mass index (BMI) ≥ 24 kg/m2 were included, and individuals lacking the clinical parameter of 25(OH)D and receiving medications known to affect vitamin D metabolism (including vitamin/mineral supplements) for three months were excluded. Finally, 901 participants were involved. This study was approved by the Zhengzhou University Life Science Ethics Committee. All participants signed written informed consents.
Obesity with T2DM was defined as having T2DM and overweight/obesity. Fasting plasma glucose (FPG) ≥ 7.0 mmol/L or subjects who had a history of T2DM or undergoing hypoglycemic therapy was considered T2DM. We classified participants into BMI categories on the basis of Chinese guidelines: overweight (BMI 24.0–27.9 kg/m2) and obesity (BMI ≥ 28 kg/m2). According to the “Consensus Statement for Metabolic Syndrome from the International Diabetes Federation,” Chinese abdominal obesity was defined as a WC ≥ 90 cm in men and ≥ 80 cm in women.
The data collected mainly included questionnaire surveys and anthropometric measurements. The evaluated questionnaires were used to collect demographic characteristics, lifestyle information, and illness histories obtained by uniformly trained investigators through face-to-face interviews. Moreover, physical examinations included height, weight, WC, hip circumference, arm circumference, skinfold thickness, and blood pressure measurements [Systolic blood pressure (SBP), Diastolic blood pressure (DBP) and Pulase pressure (PP)] .
$$ {\rm{BMI}}={\rm{weight}}\left({\rm{kg}}\right)/{\rm{h}\rm{e}\rm{i}\rm{g}\rm{h}\rm{t}}^{2}\left({\rm{m}}^{2}\right) $$ (1) $$\begin{split} &{\rm{pulse}}\; {\rm{pressure}} \;({\rm{PP}}, {\rm{mmHg}}) =\\ &{\rm{systolic}}\; {\rm{blood}}\; {\rm{pressure}}\; ({\rm{SBP}}, {\rm{mmHg}})\; - \\ &{\rm{diastolic}}\; {\rm{blood}}\; {\rm{pressure}}\; ({\rm{DBP}},{\rm{mmHg}}) \end{split} $$ (2) FPG levels were measured using the glucose oxidase method. The serum concentration of 25(OH)D (ng/mL) was measured by enzyme-linked immunosorbent assay (ELISA, Sangon Biotech Co. Ltd; Shanghai, China). In addition, the concentration of serum fasting insulin (FIns) was measured by radioimmunoassay. Homeostasis Model Assessment Insulin Resistance (HOMA-IR) was used to estimate IR. Formulas were as follows:
$$ \rm{H}\rm{O}\rm{M}\rm{A}{\text{-}} \rm{I}\rm{R}=\rm{F}\rm{P}\rm{G}\;(\rm{m}\rm{m}\rm{o}\rm{l}/\rm{L})\times \rm{F}\rm{I}\rm{n}\rm{s}\;(\rm{m}\rm{I}\rm{U}/\rm{L})/22.5 $$ (3) For statistical analysis, baseline characteristics were calculated using the means and standard deviations for the continuities, frequencies, and percentages of categorical variables. Logistic regression and linear regression models were used to explore the relationships between 25(OH)D and obesity with T2DM. 25(OH)D levels were grouped into three categories (< 20 ng/mL, 20–30 ng/mL, > 30 ng/mL) [3]. Interaction analysis was conducted to explore the role of the association between WC and vitamin D status on obesity with T2DM. Statistical analyses were performed using SPSS software, version 22.0 (SPSS Inc., Chicago) and R language, version 1.1.463 (Rstudio Inc.,). All the analyses were tested two-sided, and P < 0.05 was considered significant.
In the study, a total of 901 rural Chinese adults (438 males and 463 females) were included. The characteristics of all participants are presented in Supplementary Table S1 (available in www.besjournal.com). The mean ages of the comorbidity and non-comorbidity group subjects were 50.01 ± 14.57 and 58.00 ± 11.38 years, respectively. The co-prevalence of obesity and T2DM was 22.97% among the rural residents in Henan, which might be related to the demographic characteristics of patients. Patients with comorbidities were likely old, female, and less educated. They were also characterized by a high proportion of farmers, high vegetable and fruit intake, and mild physical activities but low proportions of smoking, alcohol consumption, and high-fat diets (P < 0.05 for each). Compared with the non-comorbidity group, the comorbidity group displayed significantly higher levels of FPG, FIns, HOMA-IR, BMI, WC, SBP, and PP (P < 0.05 for each). Patients with 25(OH)D deficiency were accounted for 57.97% in the comorbidity group, significantly higher than that in the non-comorbidity group (46.69%) (P: 0.001), suggesting that obesity with T2DM may be related to vitamin D deficiency. Therefore, we consider that increased vitamin D may well decelerate or inhibit IR, visceral obesity, and T2DM [5].
Table S1. Characteristics of obese participants with and without T2DM
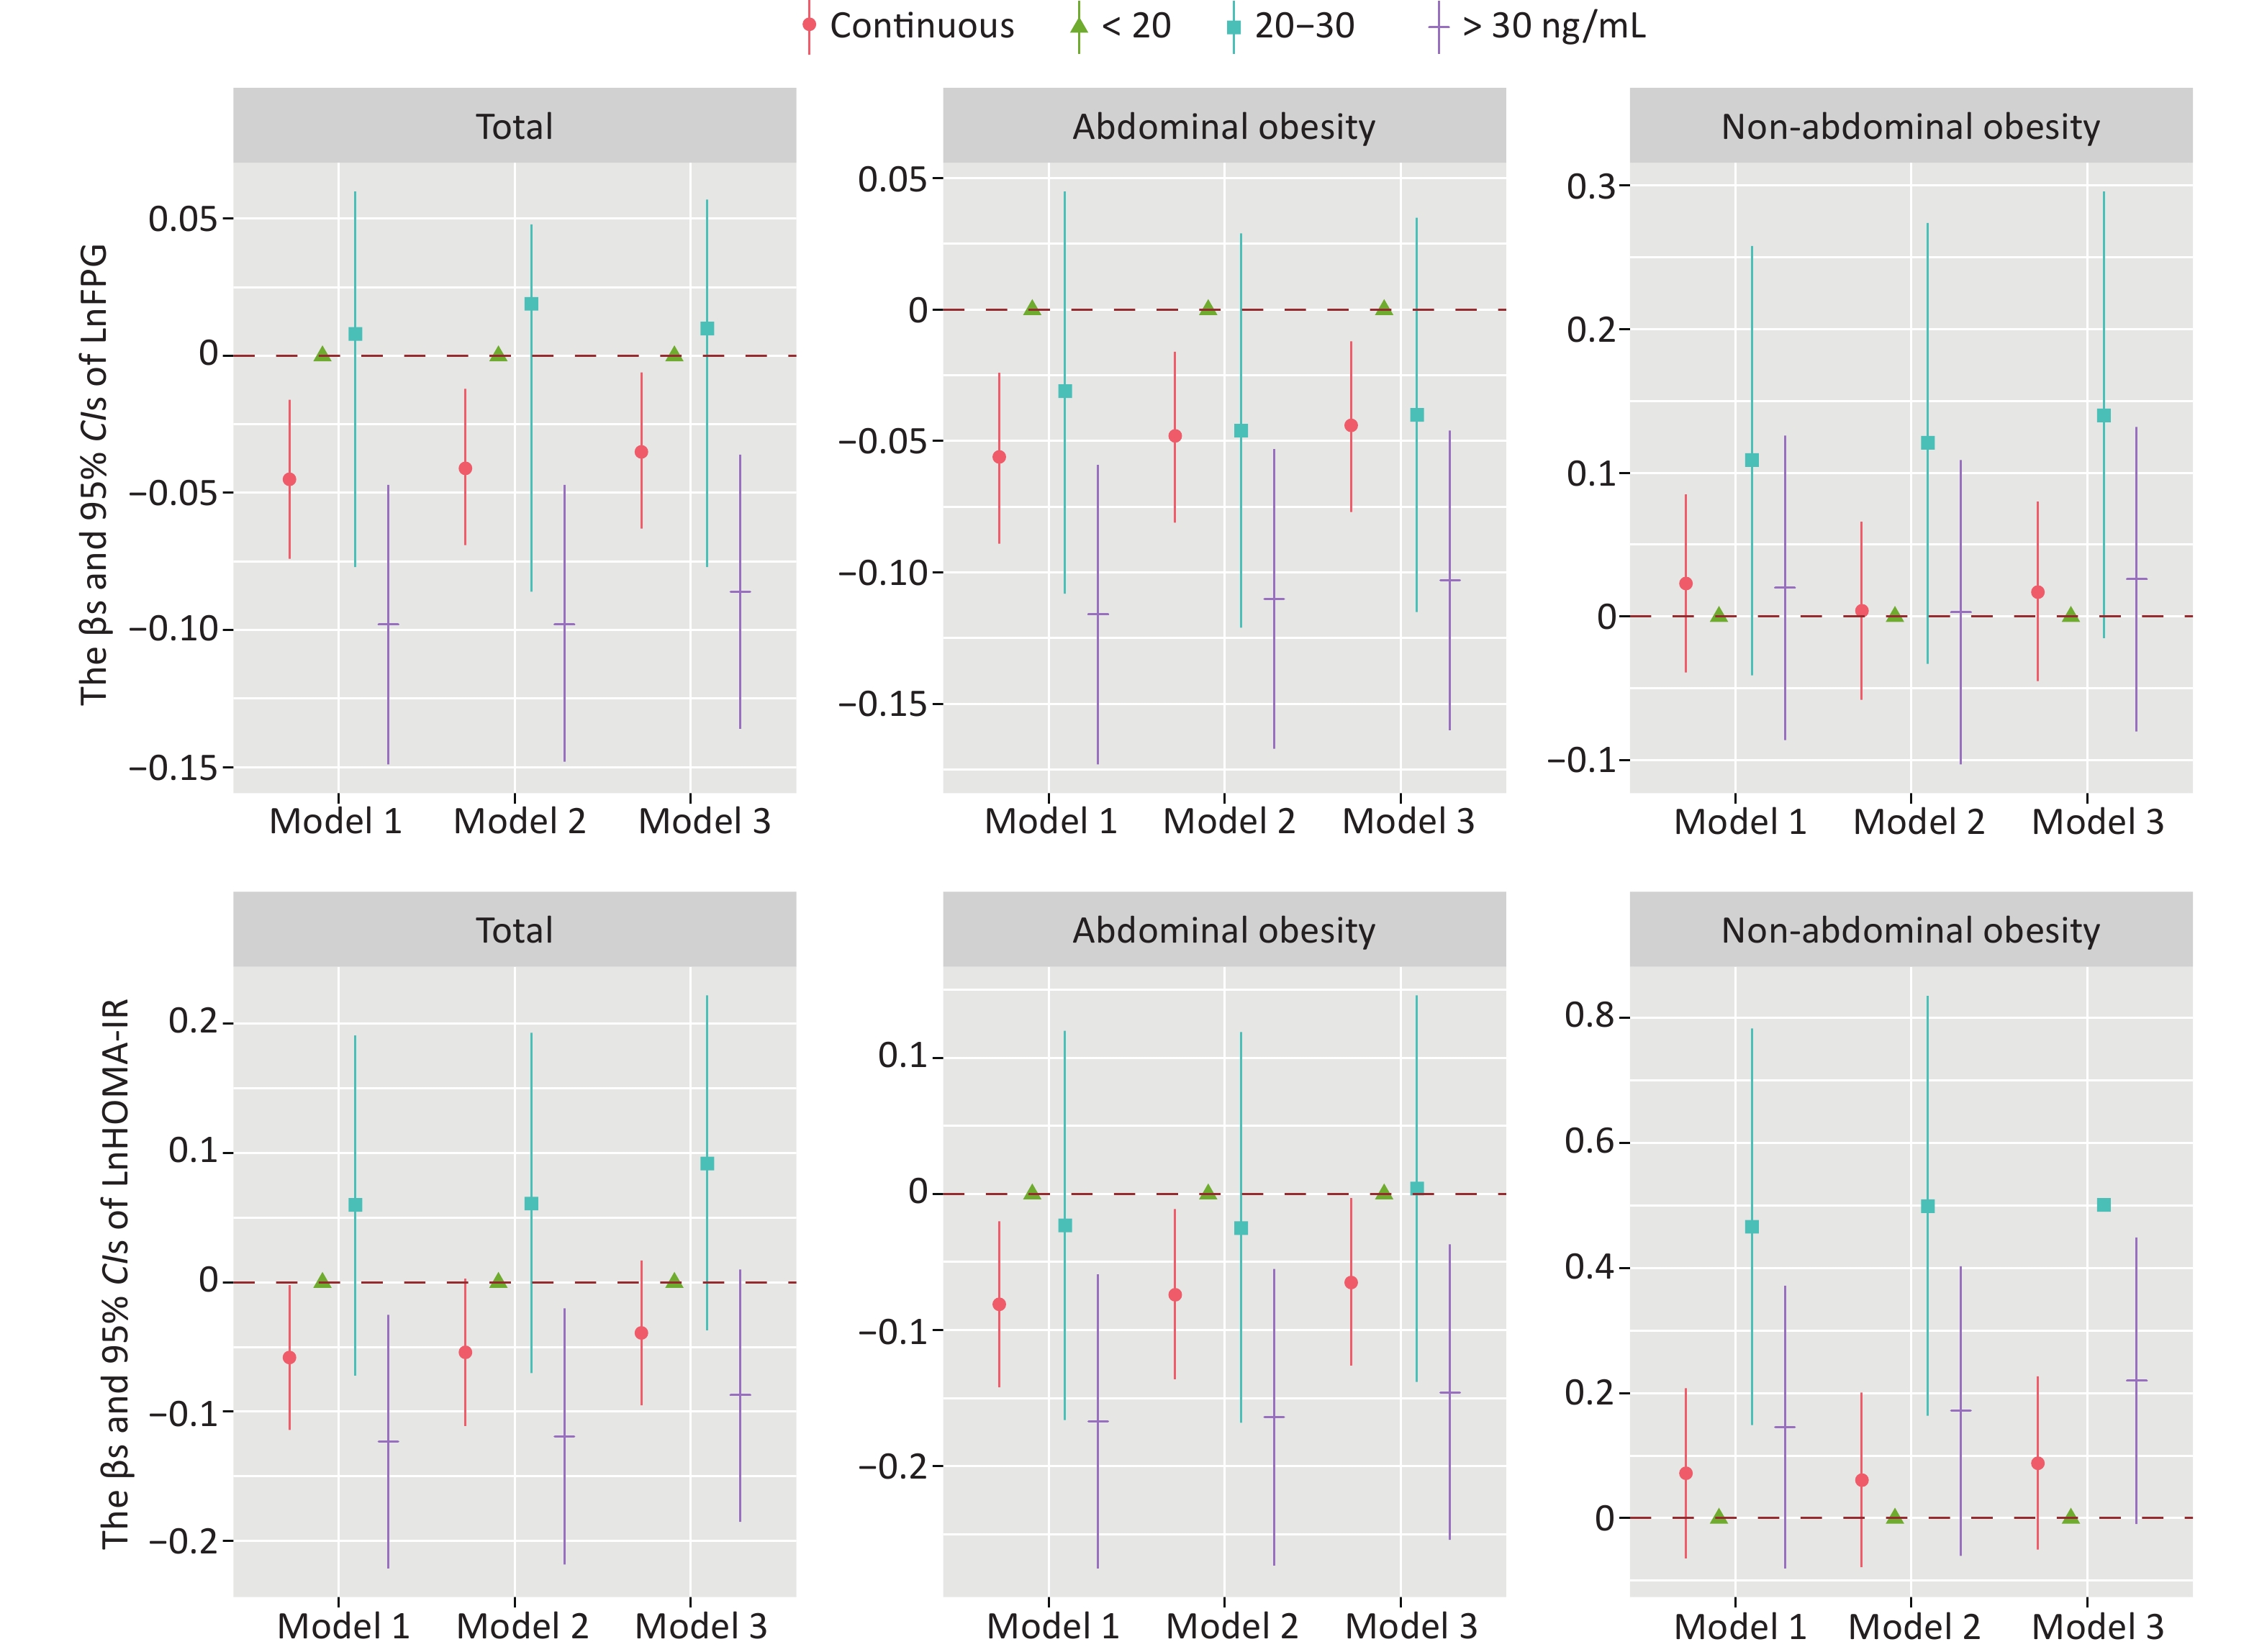
Variables Total Non-T2DM T2DM P (n = 901) (n = 694) (n = 207) Sex, n (%) Male 438 (48.61) 356 (52.82) 82 (39.61) 0.003 Female 463 (51.39) 318 (47.18) 125 (60.39) Age (year) 51.85 ± 14.29 50.01 ± 14.57 58.00 ± 11.38 < 0.001 Education, n (%) No education 160 (17.82) 105 (15.20) 55 (26.57) < 0.001 Primary or Middle school 698 (77.73) 548 (79.31) 150 (72.46) High school or more 40 (4.45) 38 (5.50) 2 (0.97) Occupation, n (%) Migrant workers 127 (14.11) 107(15.44) 20 (9.66) 0.002 Farmers 684 (76.00) 508 (73.30) 176 (85.02) Office workers 89 (9.89) 78 (11.26) 11 (5.31) Income, n (%) < 1,000 CNY 826 (91.68) 631 (90.92) 195 (94.20) 0.134 ≥ 1,000 CNY 75 (8.32) 63 (9.08) 12 (5.80) Drinking, n (%) Yes 205 (22.91) 174 (25.25) 31 (15.05) 0.002 No 690 (77.09) 515 (74.75) 175 (84.95) Smoking, n (%) Yes 241 (26.75) 205 (29.54) 36 (17.39) 0.002 No 660 (73.25) 489 (70.46) 171 (82.61) High-fat diet, n (%) Yes 180 (19.98) 153 (22.05) 27 (13.04) 0.004 No 721 (80.11) 541 (77.95) 180 (86.96) Vegetables and fruit intake, n (%) A little or no 640 (71.03) 480 (69.16) 160 (77.29) 0.024 More 261 (28.97) 214 (30.84) 47 (22.71) Salt intake, n (%) A little or no 840 (93.23) 644 (92.80) 196 (94.69) 0.342 More 61 (6.77) 50 (7.20) 11 (5.31) Physical activity, n (%) Mild 329 (36.51) 237 (34.15) 92 (44.44) 0.009 Moderate 190 (21.09) 145 (20.89) 45 (21.73) Severe 382 (42.40) 312 (44.96) 70 (33.82) BMI (kg/m2) 27.39 ± 1.09 27.39 ± 1.09 27.94 ± 1.09 0.013 WC (cm) 92.89 ± 8.66 92.27 ± 8.66 94.97 ± 8.37 < 0.001 FPG (mmol/L) 5.26 ± 1.43 3.16 ± 1.20 8.58 ± 1.43 < 0.001 FIns (mIU/L) 12.06 ± 1.68 11.47 ± 1.67 14.01 ± 1.72 < 0.001 HOMA-IR 2.80 ± 1.97 2.32 ± 1.73 5.31 ± 1.93 < 0.001 DBP (mmHg) 84.05 ± 10.28 83.93 ± 10.53 84.46 ± 9.38 0.485 SBP (mmHg) 130.63 ± 17.98 128.82 ± 17.72 136.67 ± 17.56 < 0.001 PP (mmHg) 46.57 ± 14.05 44.89 ± 13.51 52.20 ± 14.36 < 0.001 25(OH)D (ng/mL) 27.11 ± 2.22 28.50 ± 2.27 23.81 ± 2.05 0.003 25(OH)D category, n (%) < 20 ng/mL 444 (49.28) 324 (46.69) 120 (57.97) 0.001 20−30 ng/mL 134 (14.87) 99 (14.27) 35 (16.91) > 30 ng/mL 323 (35.85) 271 (39.05) 52 (25.12) Note. Data weregiven as the mean ± SD or n (%). Smoking was defined as at least 1 cigarette per day for more than 6 months; drinking was defined as more than 12 times in the past 12 months; more vegetable and fruit intake was defined as ≥ 500 g/d; meat ≥ 75 g/d was high-fat diet. The clinical cut points obtained were as follows: < 20 ng/mL (deficiency); 20−30 ng/mL (insufficiency); and > 30 ng/mL (sufficiency). FPG, fasting plasma glucose; FIns, fasting insulin; HOMA-IR, Homeostasis model assessment insulin resistance; BMI, body mass index; WC, waist circumference; DBP, diastolic blood pressure; SBP, systolic blood pressure; PP, pulse pressure; Ln, natural log-transformed. The association between 25(OH)D level and glycometabolism is presented in Figure 1 and Supplementary Figure S1 (available in www.besjournal.com). After adjusting Model 3, high 25(OH)D levels (especially vitamin D sufficiency) wcere associated with gradually low FPG levels in overweight/obese participants (Figure 1), as demonstrated by vitamin D supplementation in overweight/obese nondiabetic Asian–Australian adults with low vitamin D concentrations[6]. After being stratified by WC category, a negative association between natural log-transformed (Ln) 25(OH)D and LnFPG/LnHOMA-IR was only found in abdominally obese participants, and this relationship was particularly significant at 25(OH)D levels > 30 ng/mL (Supplementary Table S2, available in www.besjournal.com). Therefore, we further investigated the interaction effect between WC and vitamin D status (Supplementary Figure S2 and Supplementary Table S3 available in www.esjournal.com), and a significant difference in LnHOMA-IR (Pinteraction: 0.004) was observed, consistent with the study of Kabadi et al. [7], which showed a strong additive interaction between abdominal obesity and insufficient 25(OH)D {(Relative excess risk due to interaction = 6.45 [95% confidence interval (CI) 1.03–11.52]} on IR. Two differences were found; the first is that the interaction between 25(OH)D and WC was established in the overweight/obese population in our study, the second is that we took the effect of abdominal obesity and sufficient 25(OH)D as a protective factor for IR. Therefore, we assumed that vitamin D may reduce the risk of obesity with T2DM.
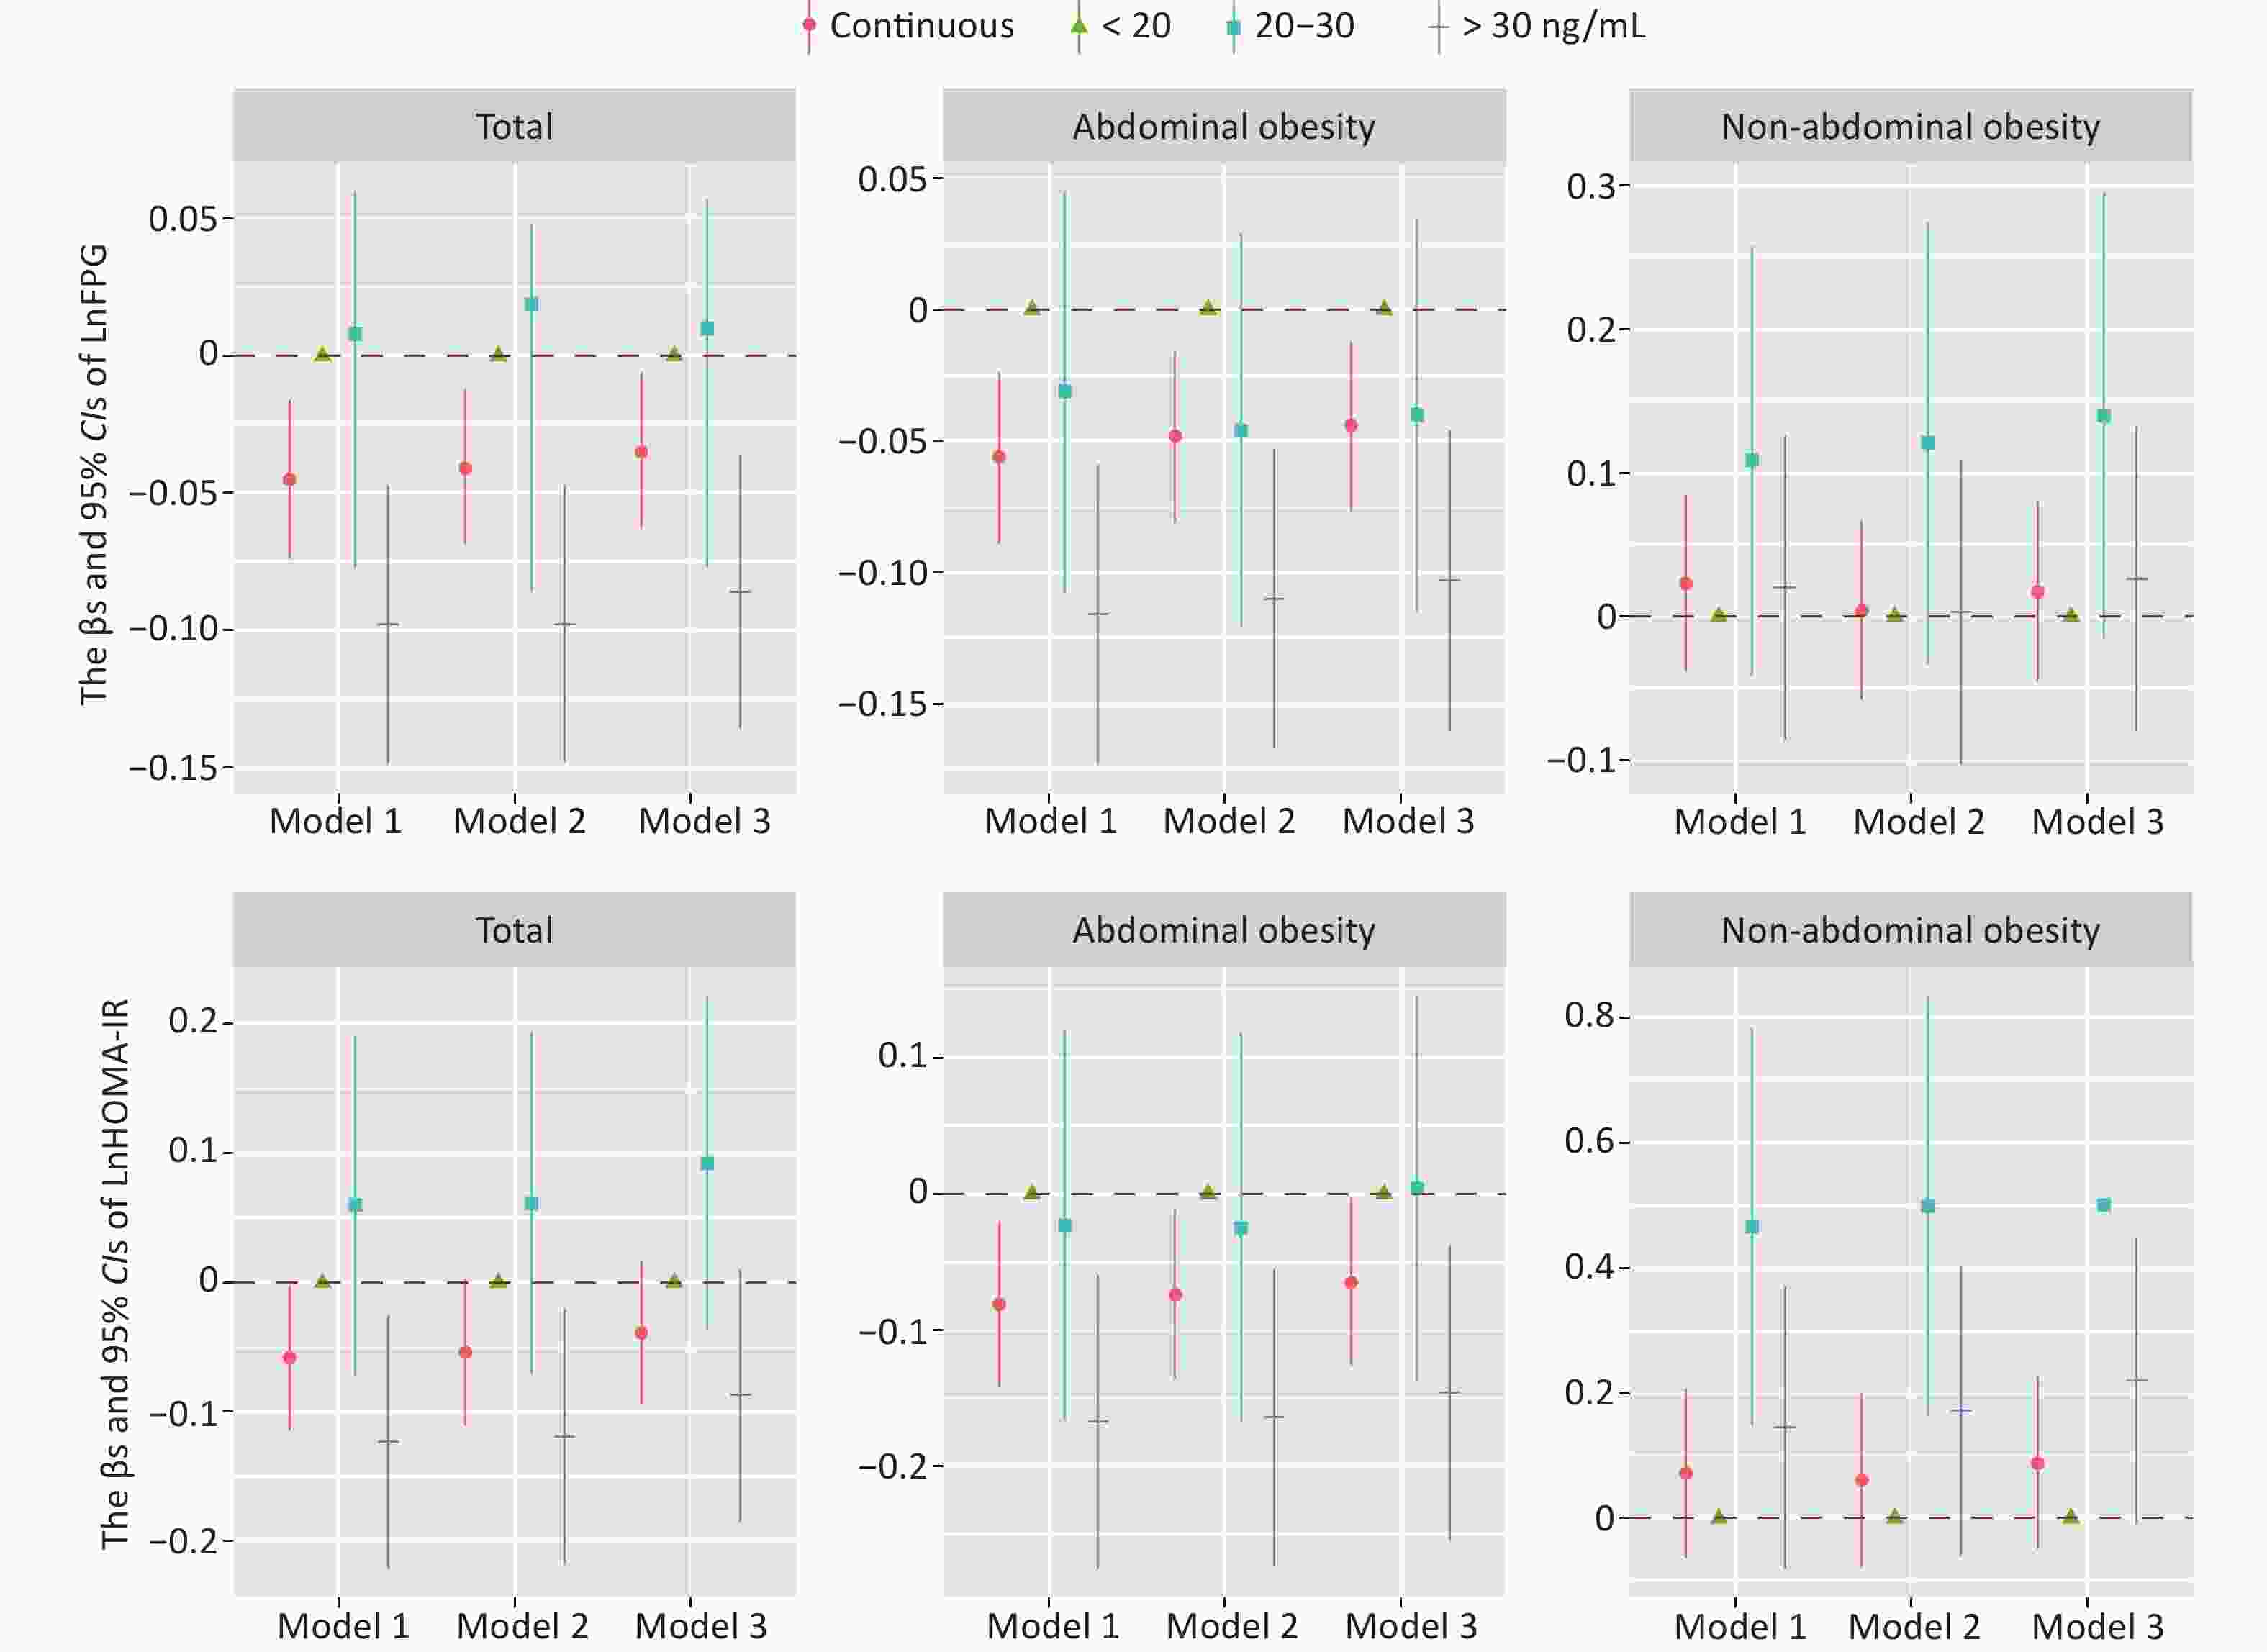
Figure 1. Associations of serum 25(OH)D level with glucose metabolism in the total obese participants and stratified by WC category. The clinical cut points of serum 25(OH)D levels obtained were as follows: < 20 ng/mL (deficiency), 20–30 ng/mL (insufficiency), and > 30 ng/mL (sufficiency). Core, β-coefficient; line, 95% CI; red, continuous 25(OH)D; green, < 20 ng/mL; blue, 20–30 ng/mL; purple, > 30 ng/mL. FPG, fasting plasm glucose; HOMA-IR, Homeostasis model assessment insulin resistance; 95% CI, 95% confidence interval; Ln, natural log‐transformed. Model 1: no adjustment. Model 2: adjusted for age, sex, marital status, education level, monthly income, smoking, drinking, high-fat diet, vegetable intake, physical activity, and family history of T2DM. Model 3: further adjusted for BMI, body mass index; SBP, systolic blood pressure; and PP, pulse pressure.
Serum vitamin D sufficiency is known to be linked with a decreased risk of T2DM. For patients with prediabetes, moderate or high doses of (≥ 1,000 IU/day) vitamin D treatments can significantly reduce the risk of T2DM [8]. The overall analysis and analysis of participants stratified by WC are shown in Table 1; vitamin D sufficiency was found to correlate with a low prevalence of T2DM in patients with overweight/obesity, especially in the case of abdominal obesity. To explore the effect between WC and vitamin D status on obesity with T2DM, we conducted an interaction analysis (Table 2), which suggested that the combination of vitamin D sufficiency and abdominal obesity had a synergistic effect on the comorbidity (Pinteraction: 0.038) compared with abdominally obese participants having 25(OH)D levels < 20 ng/mL; abdominally obese participants with 25(OH)D > 30 ng/mL had a fully adjusted OR and 95% CI of 0.563 (0.372, 0.852) for comorbidity, inconsistent with the finding of Leung et al. [9] who argued that no significant interaction existed between serum 25(OH)D and BMI category (Pinteraction: 0.564) on the risk of incident diabetes (based on the Hong Kong Osteoporosis Study cohort). However, Leung et al.’s study is not totally comparable to ours, as they did not categorize serum vitamin D by clinical cut points, and only BMI was used to operationalize obesity, which is less correlated to the metabolically active visceral adipose tissue [4]. Vitamin D is a fat-soluble vitamin that is stored in adipose tissue and released in small amounts from this tissue, depending on the stored quantity [10]. Vitamin D supplementation can increase the bioavailability of vitamin D and alleviate its blocked metabolic cycle, which may increase the circulation of vitamin D levels and induce the expression and activation of different variations of vitamin D receptors that trigger the anti-inflammatory effects of genes on adipose tissue. In turn, visceral adiposity may be reduced, and IR and even diabetes may be improved.
Table 1. Association between serum 25(OH)D level and obesity with T2DM in the total sample and stratified by WC category
Measurement N ORs (95% CIs) Model 1 Model 2 Model 3 Total 25(OH)D category, ng/mL < 20 444 1 (ref.) 1 (ref.) 1 (ref.) 20–30 134 0.955 (0.616, 1.480) 0.879 (0.553, 1.398) 0.959 (0.597, 1.539) > 30 323 0.518 (0.360, 0.745)*** 0.466 (0.318, 0.683)*** 0.530 (0.358, 0.783)** Ptrend < 0.001 < 0.001 0.002 Abdominal obesity 25(OH)D category, ng/mL < 20 372 1 (ref.) 1 (ref.) 1 (ref.) 20–30 110 0.803 (0.495, 1.302) 0.686 (0.409, 1.152) 0.750 (0.444, 1.267) > 30 255 0.464 (0.311, 0.691)*** 0.433 (0.282, 0.664)*** 0.471 (0.305, 0.726)** Ptrend < 0.001 < 0.001 0.001 Non-abdominal obesity 25(OH)D category, ng/mL < 20 72 1 (ref.) 1 (ref.) 1 (ref.) 20–30 23 3.062 (0.989, 9.480) 4.371 (1.062, 17.993)* 4.533 (1.014, 20.260)* > 30 67 1.228 (0.466, 3.237) 1.038 (0.339, 3.183) 1.192 (0.373, 3.8044) Ptrend 0.677 0.906 0.714 Note. The clinical cut points of serum 25(OH)D levels obtained were as follows: < 20 ng/mL (deficiency), 20–30 ng/mL (insufficiency), and > 30 ng/mL (sufficiency). WC, waist circumference; OR, odds ratio; 95% CI, 95% confidence interval. *: P < 0.05, **: P < 0.01, ***: P < 0.001. Model 1: no adjustment. Model 2: adjusted for age, sex, marital status, education level, monthly income, smoking, drinking, high-fat diet, vegetable intake, physical activity, and family history of T2DM. Model 3: further adjusted for BMI, body mass index; SBP, systolic blood pressure; and PP, pulse pressure. Table 2. Interaction effect of serum vitamin D level and WC category on obesity with T2DM
Measurement 25(OH)D category, ng/mL < 20 20–30 > 30 P WC category Multivariate-adjusted 0.038a Abdominal obesity 1 (ref.) 0.756 (0.447, 1.281) 0.465 (0.302, 0.717)** 0.001b Non-abdominal obesity 0.561 (0.251, 1.257) 2.421 (0.853, 6.870) 0.598 (0.265, 1.348) 0.780b Note. Adjusted ORs and 95% CIs for the 25(OH)D categories from the interaction models (all models adjusted for age, sex, marital status, education level, monthly income, smoking, drinking, high-fat diet, vegetable intake, physical activity, family history of T2DM, BMI, SBP, and PP). The clinical cut points obtained were as follows: < 20 ng/mL (deficiency), 20–30 ng/mL (insufficiency), and > 30 ng/mL (sufficiency). WC, waist circumference; BMI, body mass index; SBP, systolic blood pressure; and PP, pulse pressure. aP for values are Pinteraction, bP for values are Ptrend. *: P < 0.05, **: P < 0.01, ***: P < 0.001. This study focused on the rural Chinese population, which accounts for a large percentage, especially in Henan, the most populous province in China. Therefore, the population sample is representative, and our results can be generalized to other regions in China. The research was conducted in July 2013 when the sun was abundant, so no effect of insufficient sunshine on vitamin D production was observed. The major strength of this study is that, to our knowledge, it is the first to assess the relationship between vitamin D and abdominal obesity on obesity and T2DM comorbidity. However, several limitations should be considered. First, it is only cross-sectional, so the causal association was not revealed. Second, postprandial glucose was not measured. We only collected dietary information through a food frequency questionnaire, and specific intakes of individual foods were not obtained. As a result, data on how much vitamin D was consumed through food were unavailable.
In conclusion, serum vitamin D sufficiency is associated with low FPG levels and T2DM prevalence in overweight/obese participants. Moreover, sufficient vitamin D is a protective factor for IR and obesity with T2DM in the population with abdominal obesity, suggesting that appropriate vitamin D supplementation in general obese patients with abdominal obesity may delay or prevent obesity and T2DM occurrence. This study provides a direction for the prevention of obesity with T2DM.
No potential conflicts of interest were disclosed.
The authors would like to thank Dr. Xue Yuan (Department of Nutrition and Food Hygiene, College of Public Health, Zhengzhou University, Zhengzhou, Henan, China) and Prof. Li Xing (Department of Nutrition and Food Hygiene, College of Public Health, Zhengzhou University, Zhengzhou, Henan, China) for their kind assistance in proofreading the manuscript and discussion.
LI Xing and LI Wen Jie conceived and designed the study. FU Rong Kun, ZHANG Yu Jing, ZHANG Dong Dong, LIU Ya Ping, and XU Ze performed the investigation. GAO Jiao Jiao analyzed the data and wrote the manuscript draft. LI Xing and XUE Yuan contributed to supervision, review writing, and editing. All authors read and approved the final manuscript.
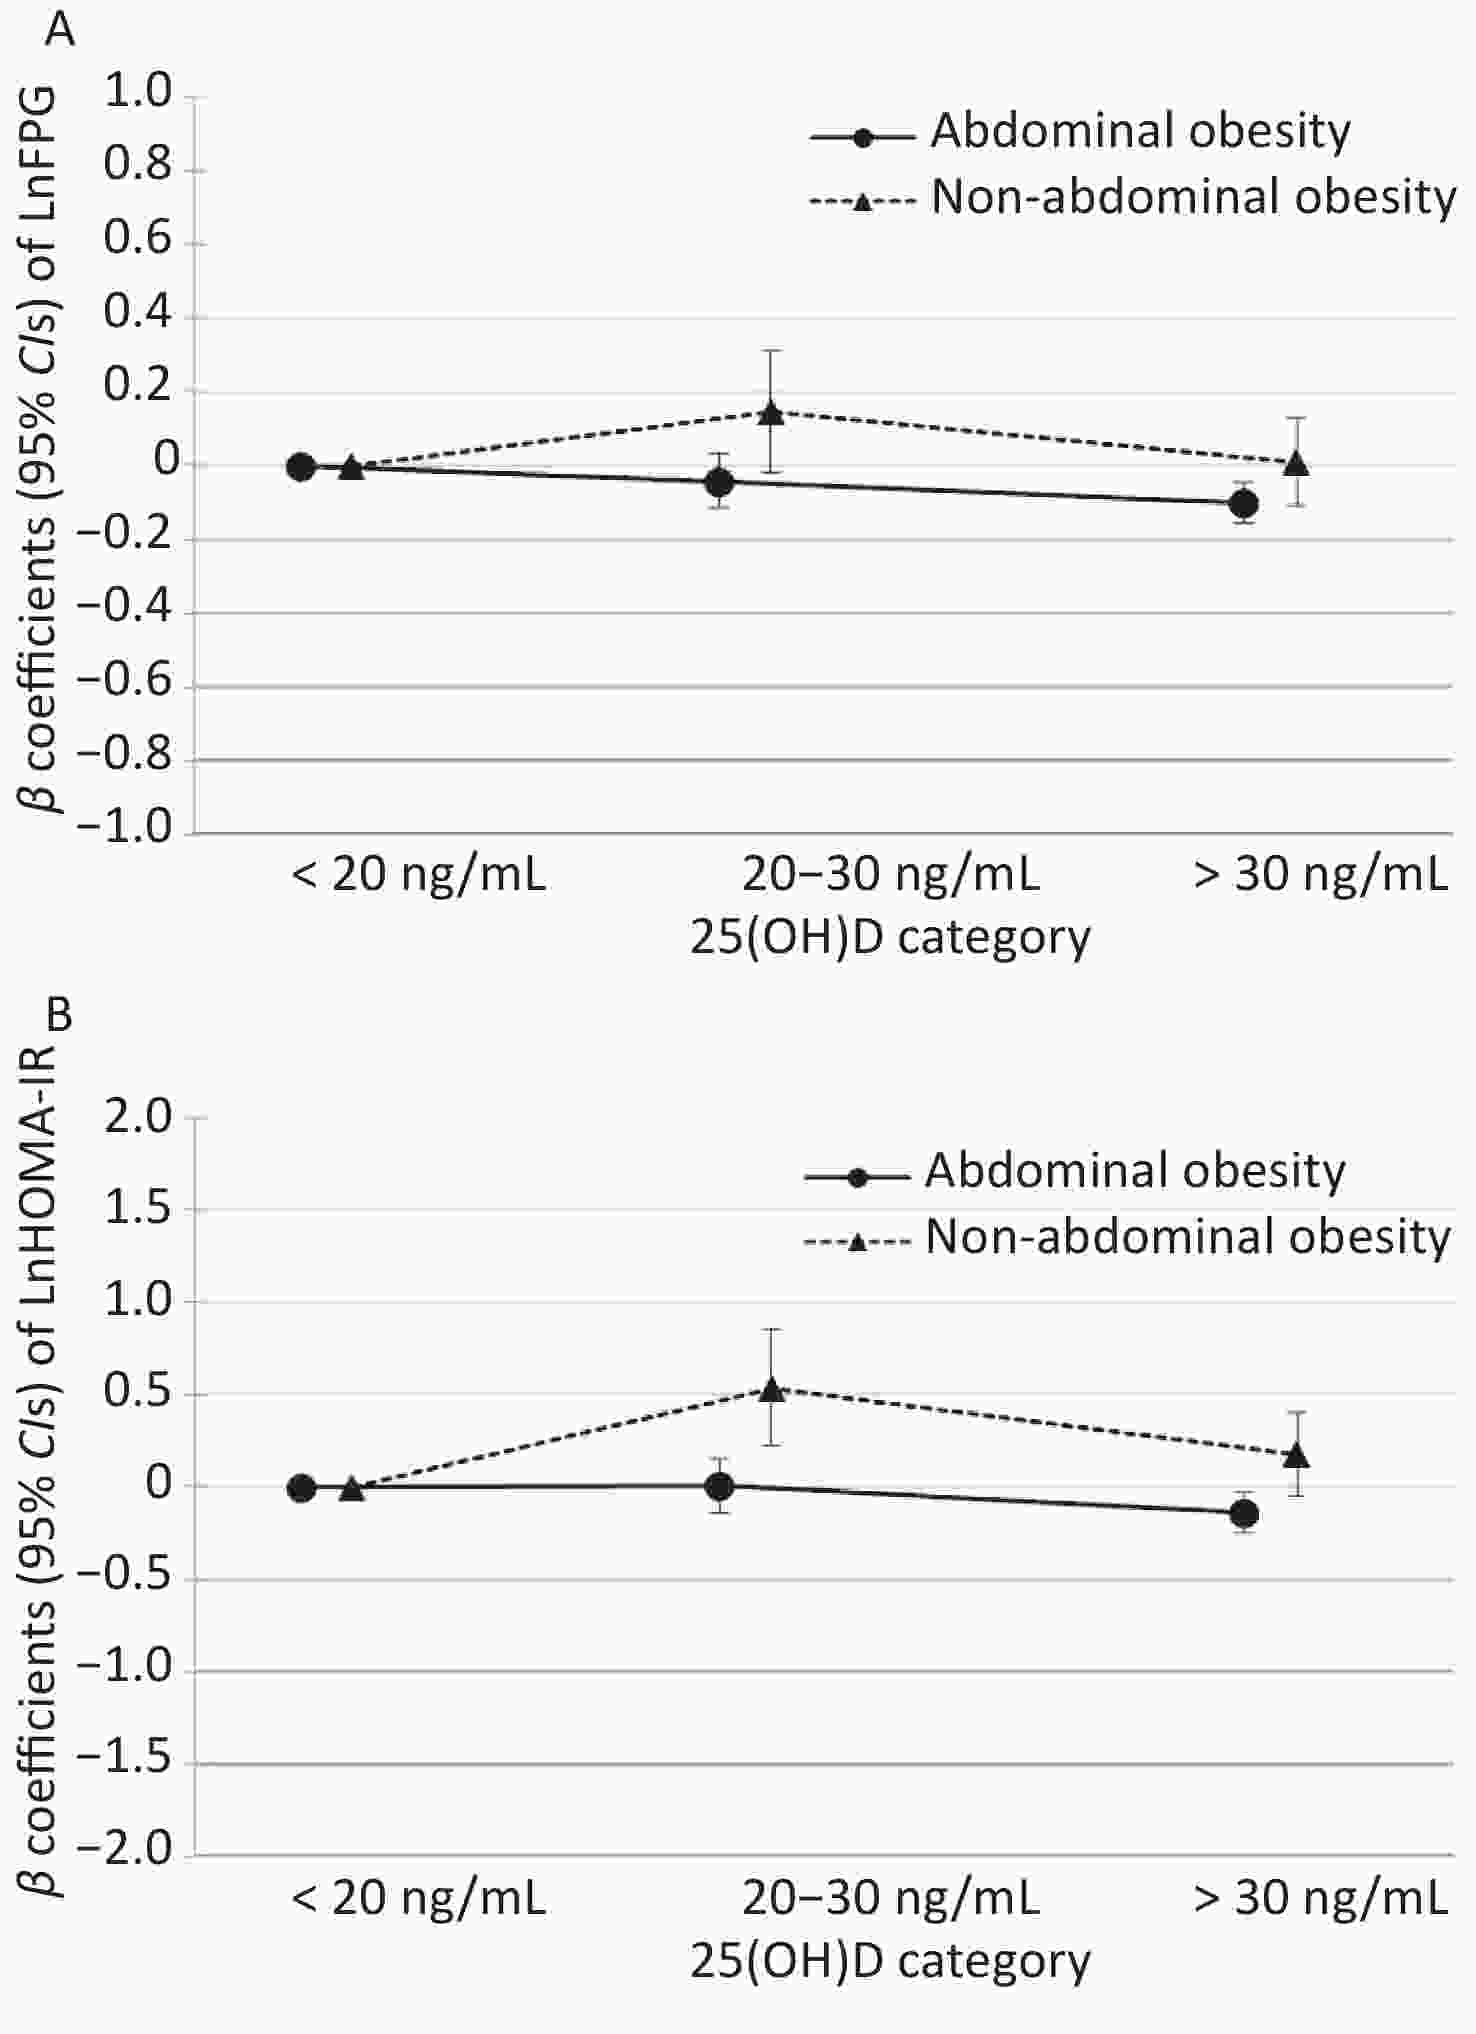
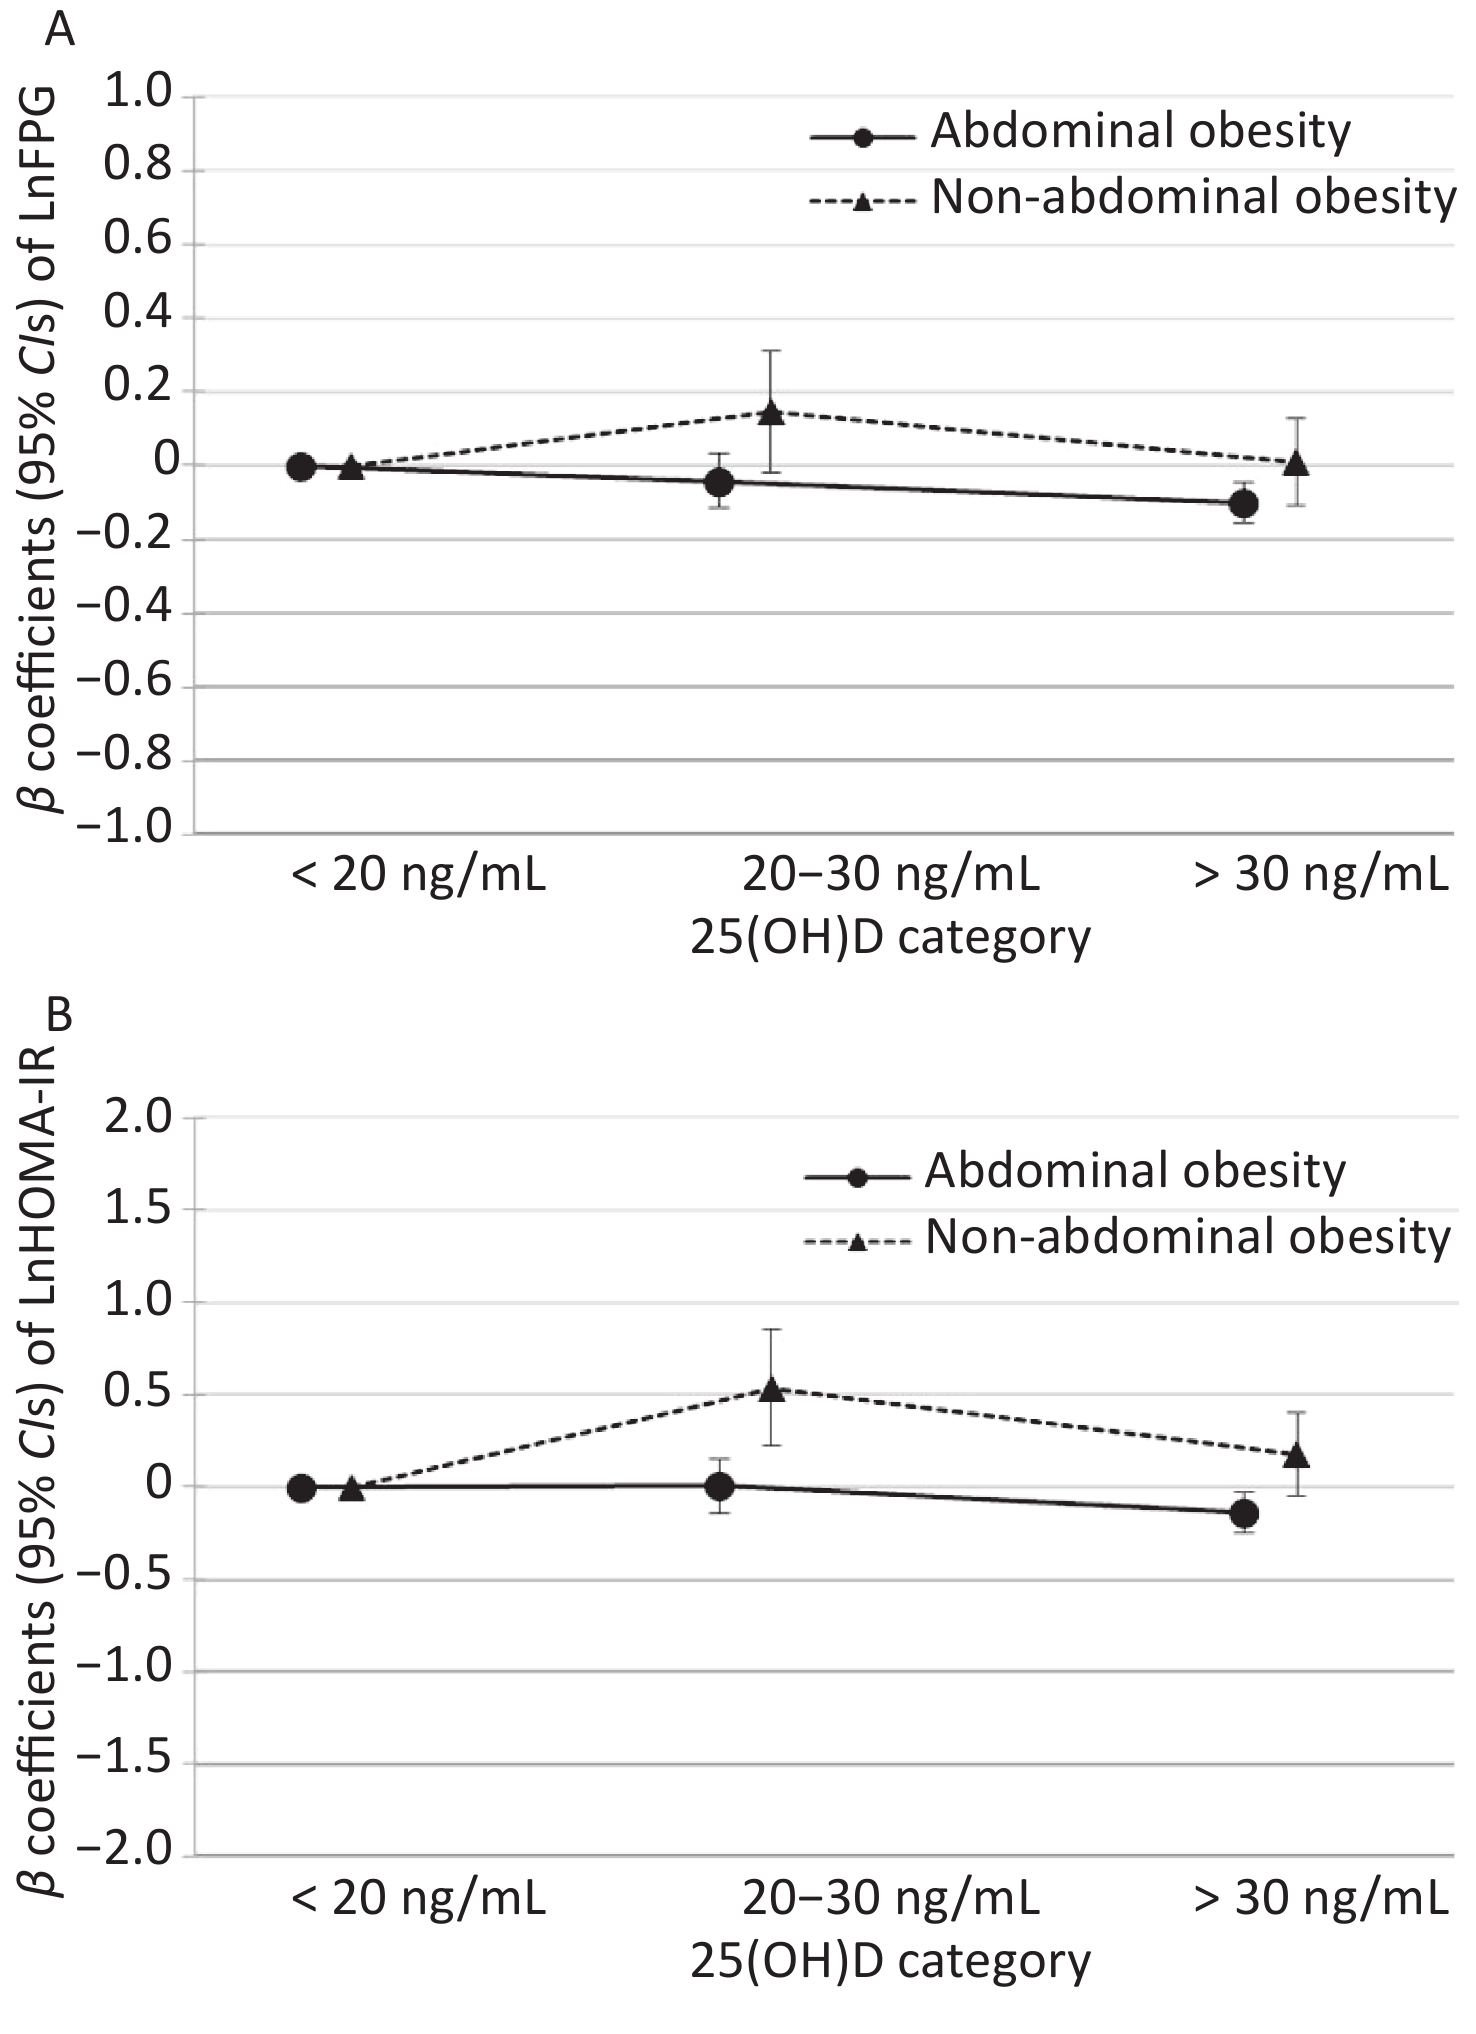
Figure S1. Interaction effect of vitamin D levels and WC category on glucose metabolism. Adjusted β-coefficients and 95% confidence intervals for the 25(OH)D categories from the interaction models (all models adjusted for age, sex, marital status, education level, monthly income, smoking, drinking, high-fat diet, vegetable intake, and physical activity, family history of T2DM, BMI, SBP and PP). The clinical cut points obtained were as follows: < 20 ng/mL (deficiency); 20–30 ng/mL (insufficiency); and > 30 ng/mL (sufficiency). WC, waist circumference; β-coefficients, beta-coefficients; BMI, body mass index; SBP, systolic blood pressure; and PP, pulse pressure;FPG, fasting plasma glucose; FIns, fasting insulin; HOMA-IR, Homeostasis model assessment insulin resistance; 95% CI , 95% confidence interval; Ln, natural log-transforme. Reference category: 25(OH)D < 20 ng/mL

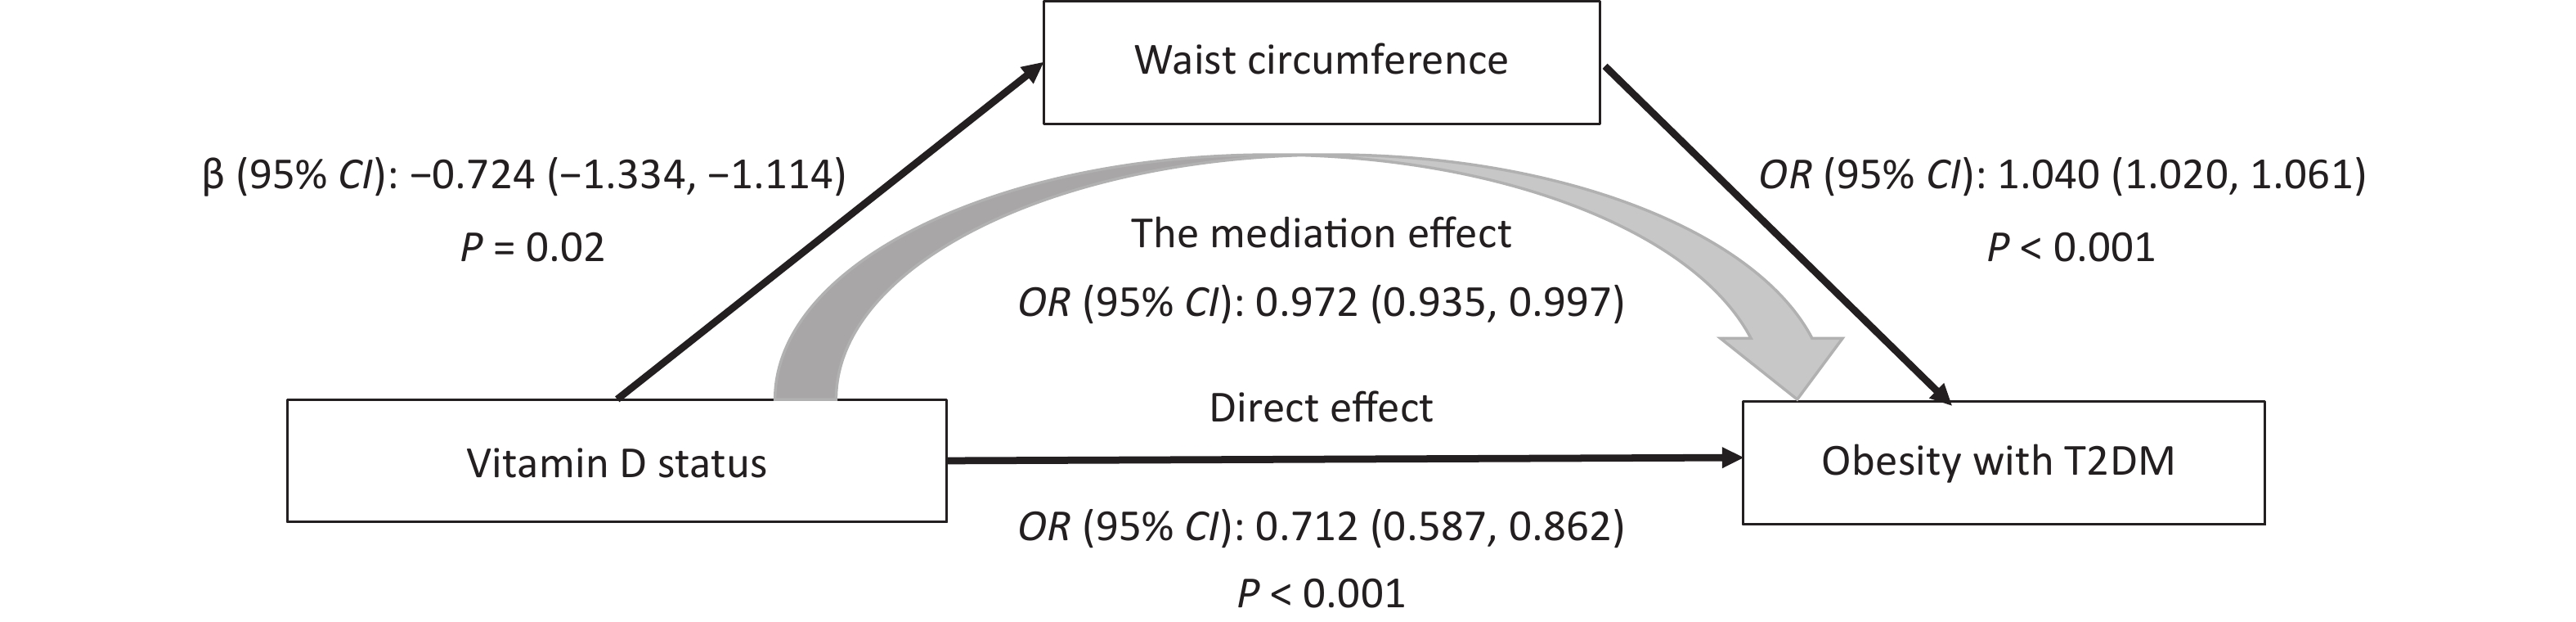
Figure S2. Mediation analysis to examine the association between vitamin D status and obesity with T2DM through WC (unit, cm). The analyses controlled for age, sex, marital status, education level, monthly income, smoking, drinking, high-fat diet, vegetable intake, and physical activity, family history of T2DM. OR, odds ratio; 95% CI, 95% confidence interval.
Table S2. The adjusted β coefficients (95% CIs) in markers of glucose metabolism associated with Ln25(OH)D in the total obese sample and stratified by WC category
Variables β coefficients (95% CIs) N Model 1 Model 2 Model 3 LnFPG Ln25(OH)D Total continuous −0.045 (−0.074, −0.016) −0.041 (−0.069, −0.012) −0.035 (−0.063, −0.006) < 20 ng/mL 444 Ref. Ref. Ref. 20−30 ng/mL 134 0.008 (−0.077, 0.060) 0.019 (−0.086, 0.048) 0.010 (−0.077, 0.057) > 30 ng/mL 323 −0.098 (−0.149, −0.047) −0.098 (−0.148, −0.047) −0.086 (−0.136, −0.036) Abdominal obesity continuous −0.056 (−0.089, −0.024) −0.048 (−0.081, −0.016) −0.044 (−0.077, −0.012) < 20 ng/mL 372 Ref. Ref. Ref. 20−30 ng/mL 110 −0.031 (−0.108, 0.045) −0.046 (−0.121, 0.029) −0.004 (−0.115, 0.035) > 30 ng/mL 255 −0.116 (−0.173, −0.059) −0.11 (−0.167, −0.053) −0.103 (−0.160, −0.046) Non-abdominal obesity continuous 0.023 (−0.039, 0.085) 0.004 (−0.058, 0.066) 0.017 (−0.045, 0.08) < 20 ng/mL 72 Ref. Ref. Ref. 20−30 ng/mL 23 0.109 (−0.041, 0.258) 0.121 (−0.033, 0.274) 0.14 (−0.015, 0.296) > 30 ng/mL 67 0.02 (−0.086, 0.126) 0.003 (−0.103, 0.109) 0.026 (−0.08, 0.132) LnHOMA-IR Ln25(OH)D Total continuous −0.058 (−0.114, −0.002) −0.054 (−0.111, 0.003) −0.039 (−0.095, 0.017) < 20 ng/mL 444 Ref. Ref. Ref. 20−30 ng/mL 134 0.06 (−0.072, 0.191) 0.061 (−0.070, 0.193) 0.092 (−0.037, 0.222) > 30 ng/mL 323 −0.123 (−0.221, −0.025) −0.119 (−0.218, −0.020) −0.0877 (−0.185, 0.010) Abdominal obesity continuous −0.081 (−0.142, −0.020) −0.074 (−0.136, −0.011) −0.065 (−0.126, −0.003) < 20 ng/mL 372 Ref. Ref. Ref. 20−30 ng/mL 110 −0.023 (−0.166, 0.012) −0.025 (−0.168, 0.119) 0.004 (−0.138, 0.146) > 30 ng/mL 255 −0.167 (−0.275, −0.059) −0.164 (−0.273, −0.055) −0.146 (−0.254, −0.037) Non-abdominal obesity continuous 0.072 (−0.064, 0.208) 0.061 (−0.078, 0.201) 0.088 (−0.050, 0.227) < 20 ng/mL 72 Ref. Ref. Ref. 20−30 ng/mL 23 0.466 (0.149, 0.783) 0.499 (0.164, 0.835) 0.501 (0.167, 0.836) > 30 ng/mL 67 0.146 (−0.080, 0.372) 0.172 (−0.060, 0.403) 0.220 (−0.009, 0.449) Note. The Clinical cut points obtained were as follows: < 20 ng/mL (deficiency); 20−30 ng/mL (insufficiency); and > 30 ng/mL (sufficiency). FPG, fasting plasm glucose; FIns, fasting insulin; HOMA-IR, Homeostasis model assessment insulin resistance; 95% CI: 95% confidence interval; Tertile 1, the first/ lowest tertile; Tertile 2, the second tertile; Tertile 3, the third tertile; Model 1: no adjustment. Model 2: adjusted for age, sex, marital status, education level, monthly income, smoking, drinking, high-fat diet, vegetables and fruit intake, and physical activity, family history of T2DM. Model 3: further adjusted for BMI, body mass index; SBP, systolic blood pressure; and PP, pulse pressure; 95% CI, 95% confidence interval; Ln, natural log-transformed. Table S3. Interaction effect of 25(OH)D levels and WC category on glucose metabolism
Variables 25(OH)D category, ng/mL < 20 20−30 > 30 Pinteraction LnFPG WC category Abdominal obesity ref. −0.041 (−0.114, 0.032) −0.102 (−0.157, −0.047) 0.071 Non-abdominal obesity ref. 0.147 (−0.018, 0.312) 0.010 (−0.106, 0.126) LnHOMA-IR WC category Abdominal obesity ref. 0.004 (−0.138, 0.146) −0.139 (−0.247, −0.031) 0.004 Non-abdominal obesity ref. 0.538 (0.220, 0.856) 0.175 (−0.050, 0.400) Note. Adjusted β-coefficients and 95% confidence intervals for the 25(OH)D categories from the interaction models (all models adjusted for age, sex, marital status, education level, monthly income, smoking, drinking, high-fat diet, vegetables and fruit intake, and physical activity, family history of T2DM, BMI, SBP and PP). The Clinical cut points obtained were as follows: < 20 ng/mL (deficiency); 20−30 ng/mL (insufficiency); and > 30 ng/mL (sufficiency). WC, waist circumference; FPG, fasting plasm glucose; HOMA-IR, Homeostasis model assessment insulin resistance; 95% CI: 95% confidence interval; Ln, natural log‐transformed.
doi: 10.3967/bes2022.063
Association of Serum Vitamin D Status and Waist Circumference on Obesity with Type 2 Diabetes: A Cross-sectional Study in Rural Adults of Henan
-
-
Figure 1. Associations of serum 25(OH)D level with glucose metabolism in the total obese participants and stratified by WC category. The clinical cut points of serum 25(OH)D levels obtained were as follows: < 20 ng/mL (deficiency), 20–30 ng/mL (insufficiency), and > 30 ng/mL (sufficiency). Core, β-coefficient; line, 95% CI; red, continuous 25(OH)D; green, < 20 ng/mL; blue, 20–30 ng/mL; purple, > 30 ng/mL. FPG, fasting plasm glucose; HOMA-IR, Homeostasis model assessment insulin resistance; 95% CI, 95% confidence interval; Ln, natural log‐transformed. Model 1: no adjustment. Model 2: adjusted for age, sex, marital status, education level, monthly income, smoking, drinking, high-fat diet, vegetable intake, physical activity, and family history of T2DM. Model 3: further adjusted for BMI, body mass index; SBP, systolic blood pressure; and PP, pulse pressure.
S1. Interaction effect of vitamin D levels and WC category on glucose metabolism. Adjusted β-coefficients and 95% confidence intervals for the 25(OH)D categories from the interaction models (all models adjusted for age, sex, marital status, education level, monthly income, smoking, drinking, high-fat diet, vegetable intake, and physical activity, family history of T2DM, BMI, SBP and PP). The clinical cut points obtained were as follows: < 20 ng/mL (deficiency); 20–30 ng/mL (insufficiency); and > 30 ng/mL (sufficiency). WC, waist circumference; β-coefficients, beta-coefficients; BMI, body mass index; SBP, systolic blood pressure; and PP, pulse pressure;FPG, fasting plasma glucose; FIns, fasting insulin; HOMA-IR, Homeostasis model assessment insulin resistance; 95% CI , 95% confidence interval; Ln, natural log-transforme. Reference category: 25(OH)D < 20 ng/mL
S2. Mediation analysis to examine the association between vitamin D status and obesity with T2DM through WC (unit, cm). The analyses controlled for age, sex, marital status, education level, monthly income, smoking, drinking, high-fat diet, vegetable intake, and physical activity, family history of T2DM. OR, odds ratio; 95% CI, 95% confidence interval.
S1. Characteristics of obese participants with and without T2DM
Variables Total Non-T2DM T2DM P (n = 901) (n = 694) (n = 207) Sex, n (%) Male 438 (48.61) 356 (52.82) 82 (39.61) 0.003 Female 463 (51.39) 318 (47.18) 125 (60.39) Age (year) 51.85 ± 14.29 50.01 ± 14.57 58.00 ± 11.38 < 0.001 Education, n (%) No education 160 (17.82) 105 (15.20) 55 (26.57) < 0.001 Primary or Middle school 698 (77.73) 548 (79.31) 150 (72.46) High school or more 40 (4.45) 38 (5.50) 2 (0.97) Occupation, n (%) Migrant workers 127 (14.11) 107(15.44) 20 (9.66) 0.002 Farmers 684 (76.00) 508 (73.30) 176 (85.02) Office workers 89 (9.89) 78 (11.26) 11 (5.31) Income, n (%) < 1,000 CNY 826 (91.68) 631 (90.92) 195 (94.20) 0.134 ≥ 1,000 CNY 75 (8.32) 63 (9.08) 12 (5.80) Drinking, n (%) Yes 205 (22.91) 174 (25.25) 31 (15.05) 0.002 No 690 (77.09) 515 (74.75) 175 (84.95) Smoking, n (%) Yes 241 (26.75) 205 (29.54) 36 (17.39) 0.002 No 660 (73.25) 489 (70.46) 171 (82.61) High-fat diet, n (%) Yes 180 (19.98) 153 (22.05) 27 (13.04) 0.004 No 721 (80.11) 541 (77.95) 180 (86.96) Vegetables and fruit intake, n (%) A little or no 640 (71.03) 480 (69.16) 160 (77.29) 0.024 More 261 (28.97) 214 (30.84) 47 (22.71) Salt intake, n (%) A little or no 840 (93.23) 644 (92.80) 196 (94.69) 0.342 More 61 (6.77) 50 (7.20) 11 (5.31) Physical activity, n (%) Mild 329 (36.51) 237 (34.15) 92 (44.44) 0.009 Moderate 190 (21.09) 145 (20.89) 45 (21.73) Severe 382 (42.40) 312 (44.96) 70 (33.82) BMI (kg/m2) 27.39 ± 1.09 27.39 ± 1.09 27.94 ± 1.09 0.013 WC (cm) 92.89 ± 8.66 92.27 ± 8.66 94.97 ± 8.37 < 0.001 FPG (mmol/L) 5.26 ± 1.43 3.16 ± 1.20 8.58 ± 1.43 < 0.001 FIns (mIU/L) 12.06 ± 1.68 11.47 ± 1.67 14.01 ± 1.72 < 0.001 HOMA-IR 2.80 ± 1.97 2.32 ± 1.73 5.31 ± 1.93 < 0.001 DBP (mmHg) 84.05 ± 10.28 83.93 ± 10.53 84.46 ± 9.38 0.485 SBP (mmHg) 130.63 ± 17.98 128.82 ± 17.72 136.67 ± 17.56 < 0.001 PP (mmHg) 46.57 ± 14.05 44.89 ± 13.51 52.20 ± 14.36 < 0.001 25(OH)D (ng/mL) 27.11 ± 2.22 28.50 ± 2.27 23.81 ± 2.05 0.003 25(OH)D category, n (%) < 20 ng/mL 444 (49.28) 324 (46.69) 120 (57.97) 0.001 20−30 ng/mL 134 (14.87) 99 (14.27) 35 (16.91) > 30 ng/mL 323 (35.85) 271 (39.05) 52 (25.12) Note. Data weregiven as the mean ± SD or n (%). Smoking was defined as at least 1 cigarette per day for more than 6 months; drinking was defined as more than 12 times in the past 12 months; more vegetable and fruit intake was defined as ≥ 500 g/d; meat ≥ 75 g/d was high-fat diet. The clinical cut points obtained were as follows: < 20 ng/mL (deficiency); 20−30 ng/mL (insufficiency); and > 30 ng/mL (sufficiency). FPG, fasting plasma glucose; FIns, fasting insulin; HOMA-IR, Homeostasis model assessment insulin resistance; BMI, body mass index; WC, waist circumference; DBP, diastolic blood pressure; SBP, systolic blood pressure; PP, pulse pressure; Ln, natural log-transformed.  下载: 导出CSV
Table 1. Association between serum 25(OH)D level and obesity with T2DM in the total sample and stratified by WC category
Measurement N ORs (95% CIs) Model 1 Model 2 Model 3 Total 25(OH)D category, ng/mL < 20 444 1 (ref.) 1 (ref.) 1 (ref.) 20–30 134 0.955 (0.616, 1.480) 0.879 (0.553, 1.398) 0.959 (0.597, 1.539) > 30 323 0.518 (0.360, 0.745)*** 0.466 (0.318, 0.683)*** 0.530 (0.358, 0.783)** Ptrend < 0.001 < 0.001 0.002 Abdominal obesity 25(OH)D category, ng/mL < 20 372 1 (ref.) 1 (ref.) 1 (ref.) 20–30 110 0.803 (0.495, 1.302) 0.686 (0.409, 1.152) 0.750 (0.444, 1.267) > 30 255 0.464 (0.311, 0.691)*** 0.433 (0.282, 0.664)*** 0.471 (0.305, 0.726)** Ptrend < 0.001 < 0.001 0.001 Non-abdominal obesity 25(OH)D category, ng/mL < 20 72 1 (ref.) 1 (ref.) 1 (ref.) 20–30 23 3.062 (0.989, 9.480) 4.371 (1.062, 17.993)* 4.533 (1.014, 20.260)* > 30 67 1.228 (0.466, 3.237) 1.038 (0.339, 3.183) 1.192 (0.373, 3.8044) Ptrend 0.677 0.906 0.714 Note. The clinical cut points of serum 25(OH)D levels obtained were as follows: < 20 ng/mL (deficiency), 20–30 ng/mL (insufficiency), and > 30 ng/mL (sufficiency). WC, waist circumference; OR, odds ratio; 95% CI, 95% confidence interval. *: P < 0.05, **: P < 0.01, ***: P < 0.001. Model 1: no adjustment. Model 2: adjusted for age, sex, marital status, education level, monthly income, smoking, drinking, high-fat diet, vegetable intake, physical activity, and family history of T2DM. Model 3: further adjusted for BMI, body mass index; SBP, systolic blood pressure; and PP, pulse pressure.
下载: 导出CSV
Table 2. Interaction effect of serum vitamin D level and WC category on obesity with T2DM
Measurement 25(OH)D category, ng/mL < 20 20–30 > 30 P WC category Multivariate-adjusted 0.038a Abdominal obesity 1 (ref.) 0.756 (0.447, 1.281) 0.465 (0.302, 0.717)** 0.001b Non-abdominal obesity 0.561 (0.251, 1.257) 2.421 (0.853, 6.870) 0.598 (0.265, 1.348) 0.780b Note. Adjusted ORs and 95% CIs for the 25(OH)D categories from the interaction models (all models adjusted for age, sex, marital status, education level, monthly income, smoking, drinking, high-fat diet, vegetable intake, physical activity, family history of T2DM, BMI, SBP, and PP). The clinical cut points obtained were as follows: < 20 ng/mL (deficiency), 20–30 ng/mL (insufficiency), and > 30 ng/mL (sufficiency). WC, waist circumference; BMI, body mass index; SBP, systolic blood pressure; and PP, pulse pressure. aP for values are Pinteraction, bP for values are Ptrend. *: P < 0.05, **: P < 0.01, ***: P < 0.001.
下载: 导出CSV
S2. The adjusted β coefficients (95% CIs) in markers of glucose metabolism associated with Ln25(OH)D in the total obese sample and stratified by WC category
Variables β coefficients (95% CIs) N Model 1 Model 2 Model 3 LnFPG Ln25(OH)D Total continuous −0.045 (−0.074, −0.016) −0.041 (−0.069, −0.012) −0.035 (−0.063, −0.006) < 20 ng/mL 444 Ref. Ref. Ref. 20−30 ng/mL 134 0.008 (−0.077, 0.060) 0.019 (−0.086, 0.048) 0.010 (−0.077, 0.057) > 30 ng/mL 323 −0.098 (−0.149, −0.047) −0.098 (−0.148, −0.047) −0.086 (−0.136, −0.036) Abdominal obesity continuous −0.056 (−0.089, −0.024) −0.048 (−0.081, −0.016) −0.044 (−0.077, −0.012) < 20 ng/mL 372 Ref. Ref. Ref. 20−30 ng/mL 110 −0.031 (−0.108, 0.045) −0.046 (−0.121, 0.029) −0.004 (−0.115, 0.035) > 30 ng/mL 255 −0.116 (−0.173, −0.059) −0.11 (−0.167, −0.053) −0.103 (−0.160, −0.046) Non-abdominal obesity continuous 0.023 (−0.039, 0.085) 0.004 (−0.058, 0.066) 0.017 (−0.045, 0.08) < 20 ng/mL 72 Ref. Ref. Ref. 20−30 ng/mL 23 0.109 (−0.041, 0.258) 0.121 (−0.033, 0.274) 0.14 (−0.015, 0.296) > 30 ng/mL 67 0.02 (−0.086, 0.126) 0.003 (−0.103, 0.109) 0.026 (−0.08, 0.132) LnHOMA-IR Ln25(OH)D Total continuous −0.058 (−0.114, −0.002) −0.054 (−0.111, 0.003) −0.039 (−0.095, 0.017) < 20 ng/mL 444 Ref. Ref. Ref. 20−30 ng/mL 134 0.06 (−0.072, 0.191) 0.061 (−0.070, 0.193) 0.092 (−0.037, 0.222) > 30 ng/mL 323 −0.123 (−0.221, −0.025) −0.119 (−0.218, −0.020) −0.0877 (−0.185, 0.010) Abdominal obesity continuous −0.081 (−0.142, −0.020) −0.074 (−0.136, −0.011) −0.065 (−0.126, −0.003) < 20 ng/mL 372 Ref. Ref. Ref. 20−30 ng/mL 110 −0.023 (−0.166, 0.012) −0.025 (−0.168, 0.119) 0.004 (−0.138, 0.146) > 30 ng/mL 255 −0.167 (−0.275, −0.059) −0.164 (−0.273, −0.055) −0.146 (−0.254, −0.037) Non-abdominal obesity continuous 0.072 (−0.064, 0.208) 0.061 (−0.078, 0.201) 0.088 (−0.050, 0.227) < 20 ng/mL 72 Ref. Ref. Ref. 20−30 ng/mL 23 0.466 (0.149, 0.783) 0.499 (0.164, 0.835) 0.501 (0.167, 0.836) > 30 ng/mL 67 0.146 (−0.080, 0.372) 0.172 (−0.060, 0.403) 0.220 (−0.009, 0.449) Note. The Clinical cut points obtained were as follows: < 20 ng/mL (deficiency); 20−30 ng/mL (insufficiency); and > 30 ng/mL (sufficiency). FPG, fasting plasm glucose; FIns, fasting insulin; HOMA-IR, Homeostasis model assessment insulin resistance; 95% CI: 95% confidence interval; Tertile 1, the first/ lowest tertile; Tertile 2, the second tertile; Tertile 3, the third tertile; Model 1: no adjustment. Model 2: adjusted for age, sex, marital status, education level, monthly income, smoking, drinking, high-fat diet, vegetables and fruit intake, and physical activity, family history of T2DM. Model 3: further adjusted for BMI, body mass index; SBP, systolic blood pressure; and PP, pulse pressure; 95% CI, 95% confidence interval; Ln, natural log-transformed.
下载: 导出CSV
S3. Interaction effect of 25(OH)D levels and WC category on glucose metabolism
Variables 25(OH)D category, ng/mL < 20 20−30 > 30 Pinteraction LnFPG WC category Abdominal obesity ref. −0.041 (−0.114, 0.032) −0.102 (−0.157, −0.047) 0.071 Non-abdominal obesity ref. 0.147 (−0.018, 0.312) 0.010 (−0.106, 0.126) LnHOMA-IR WC category Abdominal obesity ref. 0.004 (−0.138, 0.146) −0.139 (−0.247, −0.031) 0.004 Non-abdominal obesity ref. 0.538 (0.220, 0.856) 0.175 (−0.050, 0.400) Note. Adjusted β-coefficients and 95% confidence intervals for the 25(OH)D categories from the interaction models (all models adjusted for age, sex, marital status, education level, monthly income, smoking, drinking, high-fat diet, vegetables and fruit intake, and physical activity, family history of T2DM, BMI, SBP and PP). The Clinical cut points obtained were as follows: < 20 ng/mL (deficiency); 20−30 ng/mL (insufficiency); and > 30 ng/mL (sufficiency). WC, waist circumference; FPG, fasting plasm glucose; HOMA-IR, Homeostasis model assessment insulin resistance; 95% CI: 95% confidence interval; Ln, natural log‐transformed.
下载: 导出CSV
-
[1] Astrup A, Finer N. Redefining type 2 diabetes: 'diabesity' or 'obesity dependent diabetes mellitus'? Obes Rev, 2000; 1, 57−9. [2] Frühbeck G, Toplak H, Woodward E, et al. Obesity: the gateway to ill health - an EASO position statement on a rising public health, clinical and scientific challenge in Europe. Obes Facts, 2013; 6, 117−20. doi: 10.1159/000350627 [3] Sun HL, Long SR, Fu SX, et al. Association between Vitamin D levels and the risk of metabolic syndrome in a rural Chinese population. Biomed Environ Sci, 2021; 34, 330−3. [4] Zhai Y, Ren ZP, Zhang M, et al. Abdominal obesity and its attribution to all-cause mortality in the general population with 14 years follow-up: findings from Shanxi cohort in China. Biomed Environ Sci, 2020; 33, 227−37. [5] Greco EA, Lenzi A, Migliaccio S. Role of hypovitaminosis D in the pathogenesis of obesity-induced insulin resistance. Nutrients, 2019; 11, 1506. doi: 10.3390/nu11071506 [6] Scott D, Mousa A, Naderpoor N, et al. Vitamin D supplementation improves waist-to-hip ratio and fasting blood glucose in Vitamin D deficient, overweight or obese Asians: a pilot secondary analysis of a randomised controlled trial. J Steroid Biochem Mol Biol, 2019; 186, 136−41. doi: 10.1016/j.jsbmb.2018.10.006 [7] Kabadi SM, Lee BK, Liu LJ. Joint effects of obesity and Vitamin D insufficiency on insulin resistance and type 2 diabetes: results from the NHANES 2001-2006. Diabetes Care, 2012; 35, 2048−54. doi: 10.2337/dc12-0235 [8] Barbarawi M, Zayed Y, Barbarawi O, et al. Effect of Vitamin D supplementation on the incidence of diabetes mellitus. J Clin Endocrinol Metab, 2020; 105, 2857−68. doi: 10.1210/clinem/dgaa335 [9] Leung RYH, Cheung BMY, Tan KCB, et al. 25-Hydroxyvitamin D and the risk of incident diabetes in Hong Kong Chinese. Public Health Nutr, 2020; 23, 1201−7. doi: 10.1017/S1368980019000582 [10] Mansouri M, Miri A, Varmaghani M, et al. Vitamin D deficiency in relation to general and abdominal obesity among high educated adults. Eat Weight Disord, 2019; 24, 83−90. doi: 10.1007/s40519-018-0511-4 -
 21489Supplementary Materials.pdf

-

 点击查看大图
计量
- 文章访问数: 601
- HTML全文浏览量: 262
- PDF下载量: 76
- 被引次数: 0


 Quick Links