

 下载:
下载:

-
Mycoplasma pneumoniae (M. pneumoniae, MP) is a pathogen that causes respiratory tract infections in children and accounts for 10%−40% of community-acquired pneumonia (CAP) in hospitalized children [1,2]. Clinical manifestations can be mild or severe; severe cases cause necrotizing pneumonia and even dangerous extrapulmonary complications. In recent years, many studies have shown that changes in intestinal microecology have important roles in pulmonary infection[3]. Maladjustment of the intestinal flora aggravates respiratory infections caused by pathogens such as influenza viruses, Staphylococcus aureus, Klebsiella pneumoniae, and Streptococcus pneumoniae [3]. Mouse studies have shown that antibiotic-induced intestinal dysbacteriosis aggravates MP respiratory tract infections and suggested that intestinal microflora has a regulatory effect on respiratory tract infections [4]. In this study, stool samples from children with MP pneumonia (MPP) were examined by 16S rDNA sequencing. Probiotics were administered to investigate changes in intestinal microflora in these children, and identify possible preliminary roles during MP infection.
-
Between September 2019 and November 2019, 14 children with MPP were admitted to Baotou Fourth Hospital (Baotou Children’s Hospital) in Inner Mongolia Autonomous Region, China and divided into probiotic group (AFY, n = 8) and general treatment group (AF, n = 6). Simultaneously, nine healthy children from Beijing Chang Ping Hospital of Integrated Chinese and Western Medicine in China were included as a healthy control group (KHJB).
MPP was diagnosed by consensus using the Diagnosis and Treatment of Children’s Mycoplasma Pneumoniae Pneumonia 2015 edition: (i) acute respiratory infection symptoms (fever, cough or wheezing) upon physical examination, and chest imaging with infiltrates; (ii) the MP infection was confirmed using serological tests (MP-IgM-positive (Diagnostic kit for Antibody to Mycoplasma pneumoniae, HAITIANLANBO.BIO-TECH.CO., Ltd, Fujian, China) and an antibody titer ≥ 1:160 or a four-fold or greater increase in titer (SERODIA® -MYCO II, FUJIREBIO INC. Tokyo, Japan) and MP nucleic acid detection in nasopharyngeal aspirates[1,5].
Inclusion criteria: (i) patients were 3–14 years old; (ii) patients were diagnosed with MPP; and (iii) the disease course was ≤ 7 days. Exclusion criteria: (i) patients with measles, whooping cough, chicken pox, or other infectious diseases; (ii) severely malnourished children; (iii) patients with underlying diseases such as asthma, chronic heart and lung disease, rheumatic disease, kidney disease, or immunodeficiency; (iv) children with other pathogenic infections (bacterial, fungal, and/or viral); (v) children treated with antibiotics, hormones, intestinal microbial preparations, or other immunological preparations in the previous month; and (vi) children who did not cooperate with sampling regimens or whose parents refused to participate.
Children in both groups received (i) azithromycin (Pfizer Pharmaceutical Co., Ltd,New York, USA), (ii) Pediatric Feirekechuan Oral Liquid (Heilongjiang Sunflower Pharmaceutical Co., Ltd, Heilongjiang, China), and (iii) other symptomatic treatments if necessary. Children in the probiotics group also received combined Bifidobacterium, Lactobacillus, Enterococcus, and Bacillus cereus live tablets (Hangzhou Grand Biologic Pharmaceutical INC, Zhejiang, China). Each tablet contained > 1.0 × 10⁶ colony forming unit (CFU) of Bifidobacterium, Lactobacillus, and Enterococcus and > 1 × 10⁵ CFU/g B. cereus. Children treated with probiotics received two tablets three times a day.
Study protocols were approved by the Ethics Committee of the Affiliated Beijing Friendship Hospital at Capital Medical University (Beijing, China), and methods were conducted in accordance with approved guidelines (Number: 2019-P2-206-02). Written informed consent was obtained from the parents or guardians of participants prior to enrollment.
-
Two stool specimens and two throat swabs were collected from AF and AFY groups, the specimens were collected on the first day of treatment (AF_A, AFY_A) and 7 ± 1 days after treatment (AF_B, AFY_B). One stool specimen and one throat swab were collected from KHJB group.
After defecation, samples were comprehensively collected from stools using a sampling spoon, quickly placed in a specimen box, and frozen at −80 °C. Specimens were tested at the Institute of Microbiology of the Chinese Academy of Sciences. Fluorescence quantitative polymerase chain reaction (PCR) was used to amplify 23S ribosomal RNA (23S rRNA) in MP throat swab specimens [6].
-
DNA was extracted from fecal samples (0.5 g) using a QIAamp PowerFecal DNA Kit (QIAGEN, Germany) according to manufacturer’s protocols. The V3–V4 region of bacterial 16S rDNA was then amplified using the primers: 1stF3: CCTACGGGNBGCASCAG and 1stR4: GACTACNVGGGTATCTAATCC (Beijing Liuhe Bgi Co., Ltd. Beijing, China). PCR was performed in a 25 μL mixture containing 5 μL 5 × GC buffer, 0.5 μL KAPA dNTP mix, 0.5 μL KAPA HiFi HotStart DNA polymerase, (Roche, USA) 0.5 μL each primer (10 pmol/L), and 50–100 ng template DNA. PCR cycling parameters were: 95 °C for 3 min, followed by 25 cycles at 95 °C for 30 s, 55 °C for 30 s, 72 °C for 30 s, and a final extension at 72 °C for 5 min. We then used AMPure XP (Beckman Coulter, USA) beads to purify amplicons from free primers and primer-dimer species. A second specific linker amplification step was next used to construct a library that fulfilled Illumina requirements. Each linker contained a unique eight base barcode sequence. PCR was performed in a 25 μL mixture: 5 μL 5× GC buffer, 0.75 μL KAPA dNTP mix, 0.5 μL KAPA HiFi HotStart DNA polymerase, 1.5 μL each primer (10 pmol/L), and 5 μL purified product. PCR cycling parameters: 95 °C for 3 min, followed by eight cycles at 95 °C for 30 s, 55 °C for 30 s, 72 °C for 30 s, and a final extension at 72 °C for 5 min. Amplicons were purified as described to clean up the final library before quantification. Finally, purified amplicons were pooled in equimolar quantities and paired-end sequenced (2 × 250) on an Illumina MiSeq platform (Illumina, USA) according to standard protocols.
-
Fast Length Adjustment of Short Reads was used to merge paired-end reads from next-generation sequencing [7]. Low quality reads were filtered out using fastq_quality_filter (-p 90 -q 25 -Q33) in the FASTX Toolkit 0.0.14, and chimera reads were removed using USEARCH 64 bit (Ver. 8.0.1517). The number of reads per sample was normalized using random subtraction based on the smallest sample size. Operational taxonomic units (OTUs) were aligned using the UCLUST algorithm with a 97% identity, and taxonomically classified using the SILVA 16S rRNA database (Ver. 128). Both α and β diversities were generated in the Quantitative Insights Into Microbial Ecology database and calculated based on weighted and unweighted Unifrac distance matrices [8]. The α diversity included an index of observed species, Chao1 estimator, Shannon and Simpson; the β diversity included principal coordinate analysis (PCoA)、Adonis analysis and UPGMA clustering tree analysis. We used the linear discriminant analysis effect size (LEfSe) method to identify species with statistically significant abundance between groups [9].
Proportions of bacteria in AF and AFY groups were compared in each patient before and after treatment, the bacteria was considered as increased/decreased with a ratio higher/lower than 1.2/0.83. When the bacteria was changed in more than half of the patient within groups, it was considered as being influenced by the treatment.
-
SPSS 20.0 software (IBM Corp, Armonk, NY, USA) was used for statistical data analysis. P < 0.05 was considered statistically significant.
-
In this study, 23 children were enrolled, aged 4 years and 8 months to 9 years and 5 months, of which one child was 4 years old and 8 months old, and the rest were > 5 years old. The mean age was 5 years and 8 months. No statistical differences in age were observed between AFY group, AF group, and KHJB group (P = 0.361).
-
Antibody titers were ≥ 1:160 in the general treatment and probiotics groups. MP nucleic acid levels in the first throat swabs were all positive.
-
After high-throughput sequencing of fecal samples from probiotic and healthy control groups, we generated 10,268,989 valid sequences in total. The average number of sequences/sample was 277,540.24.
-
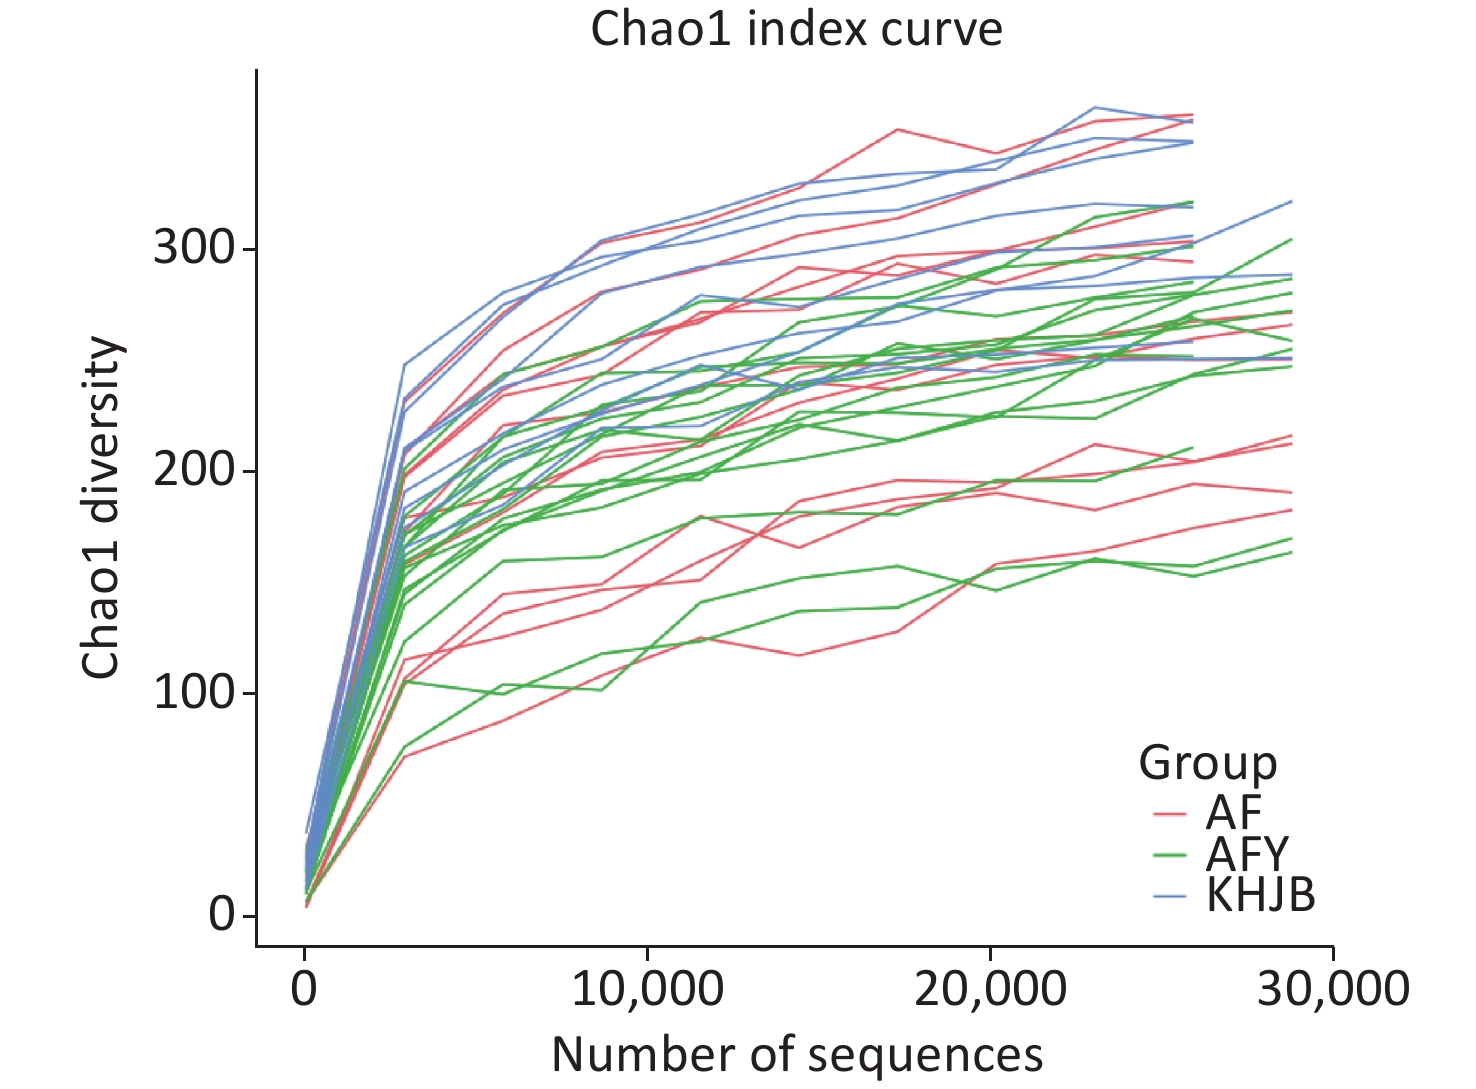
Some sequences were randomly selected from our data, the number of species represented by sequences counted, and a dilution curve constructed using sequence and species numbers. As shown (Figure 1), as the sample volume increased, sample flora OTUs tended to be stable and the curve tended to be flat. This indicated that sequencing data were sufficient and the sequencing depth of the sample had been reached.
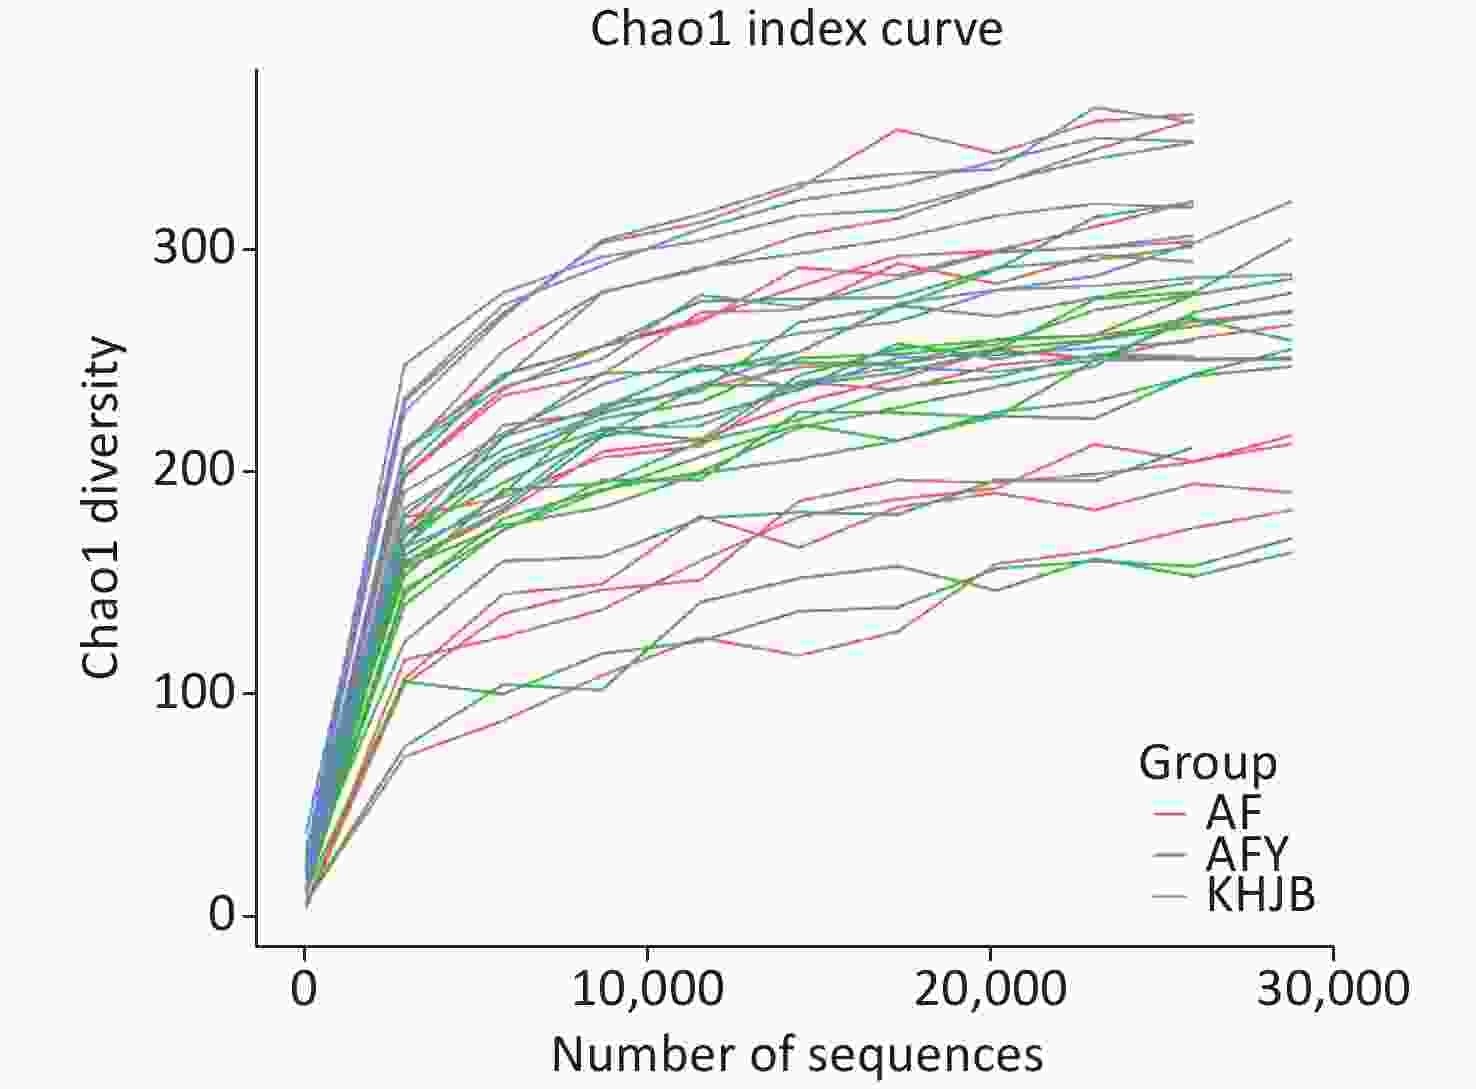
Figure 1. Intestinal flora dilution curve. AF, general treatment group; AFY, probiotic group; and KHJB, healthy control group.
-
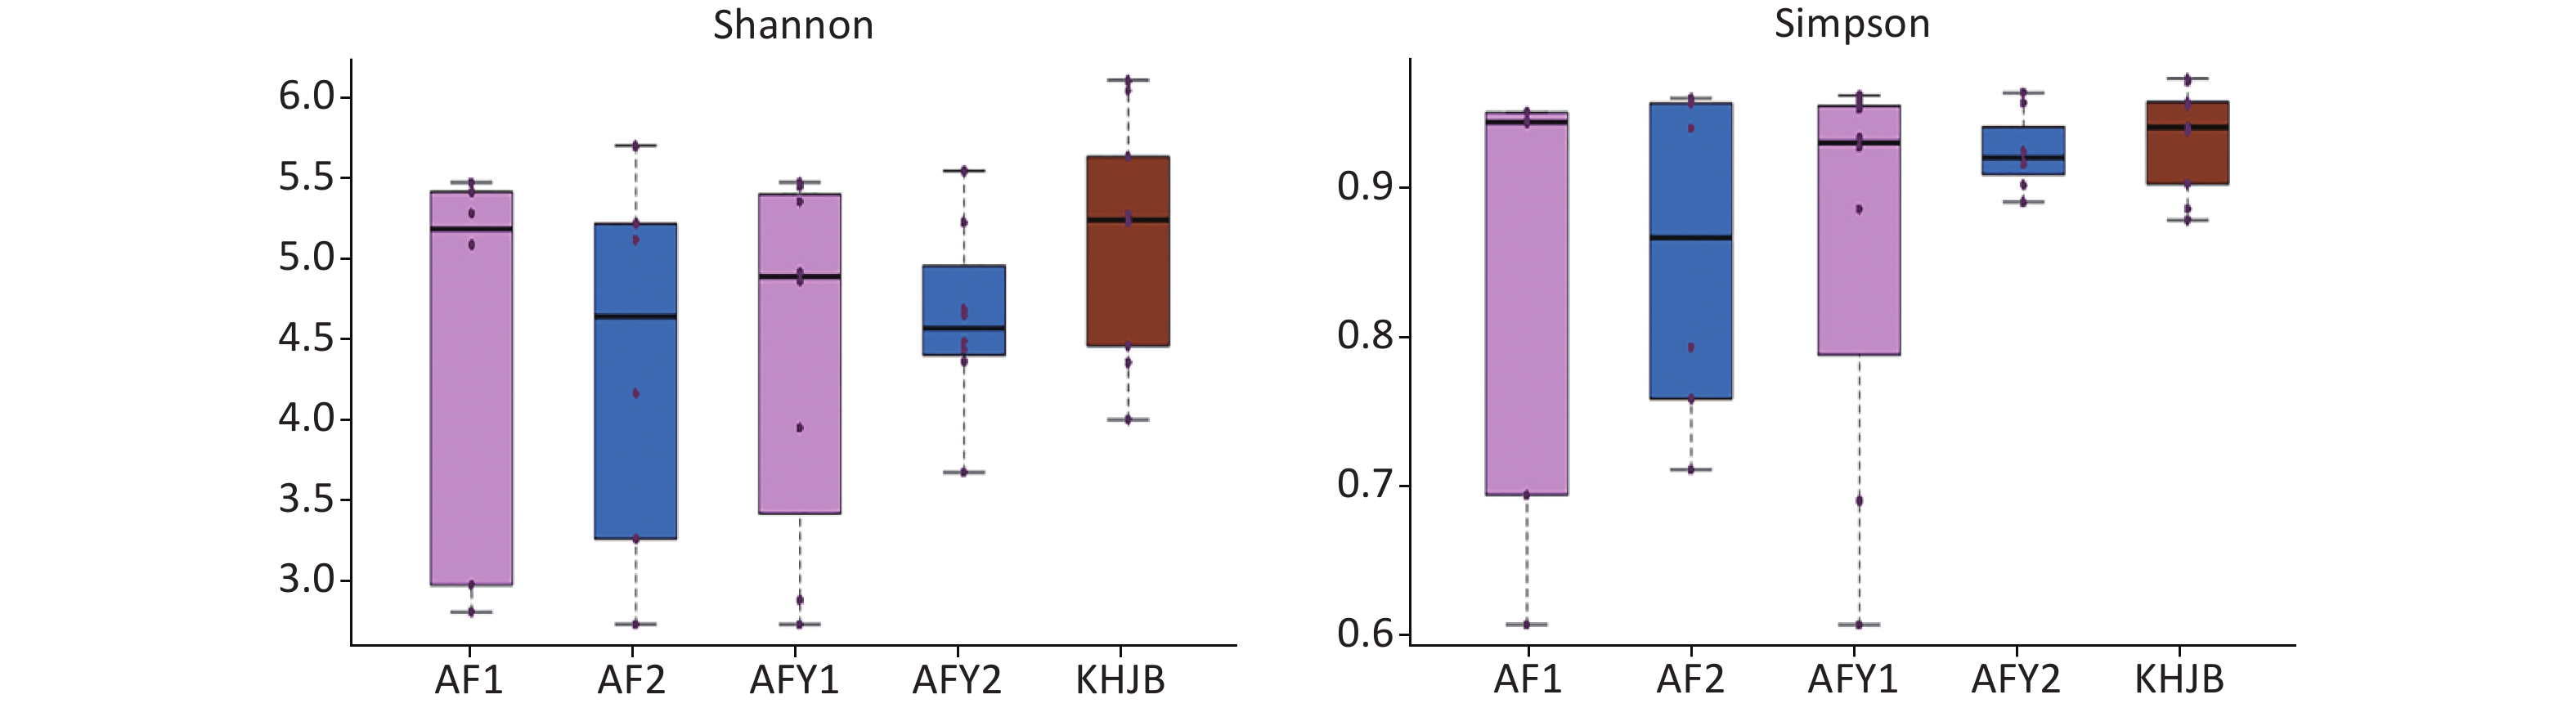
OTUs were higher in KHJB group than in AF and AFY groups (P < 0.05). The Chao1 index was higher in the KHJB group than in the AFY group (P < 0.05); no significant differences were observed between KHJB and AF groups. The Shannon index was higher in the KHJB group than in the AF group (P < 0.05); no significant differences were observed between KHJB and AFY groups. The Simpson index was higher in the KHJB group than in the AF group (P < 0.05); no significant differences were observed between KHJB and AFY groups.
The mean number of OTUs in stools was lower in the AF group than in the KHJB group, but differences were not statistically significant. The average Chao1 index of the KHJB group was higher than in the stool sample AF_A, which was higher than in the second stool sample AF_B; however, differences were not statistically significant. The average Shannon index was higher in the KHJB group than in the AF group, but differences were not statistically significant. The average Simpson index was higher in the KHJB group than AF_B which was higher than AF_A; however, differences were not statistically significant.
OTUs in the AFY group were lower than in the KHJB group (P < 0.05). The Chao1 index was higher in the KHJB group than in the AFY group (P < 0.05). The average Chao1 index of the stool sample AFY_B was lower than in AFY_A, but differences were not statistically significant. The average Shannon index was higher in the KHNB group than in the stool sample AFY_B, which was higher than in AFY_A; however, differences were not statistically significant. The average Simpson index of the KHJB group was higher than in the stool sample AFY_B, which was higher than in AFY_A; however, differences were not statistically significant (Figure 2).
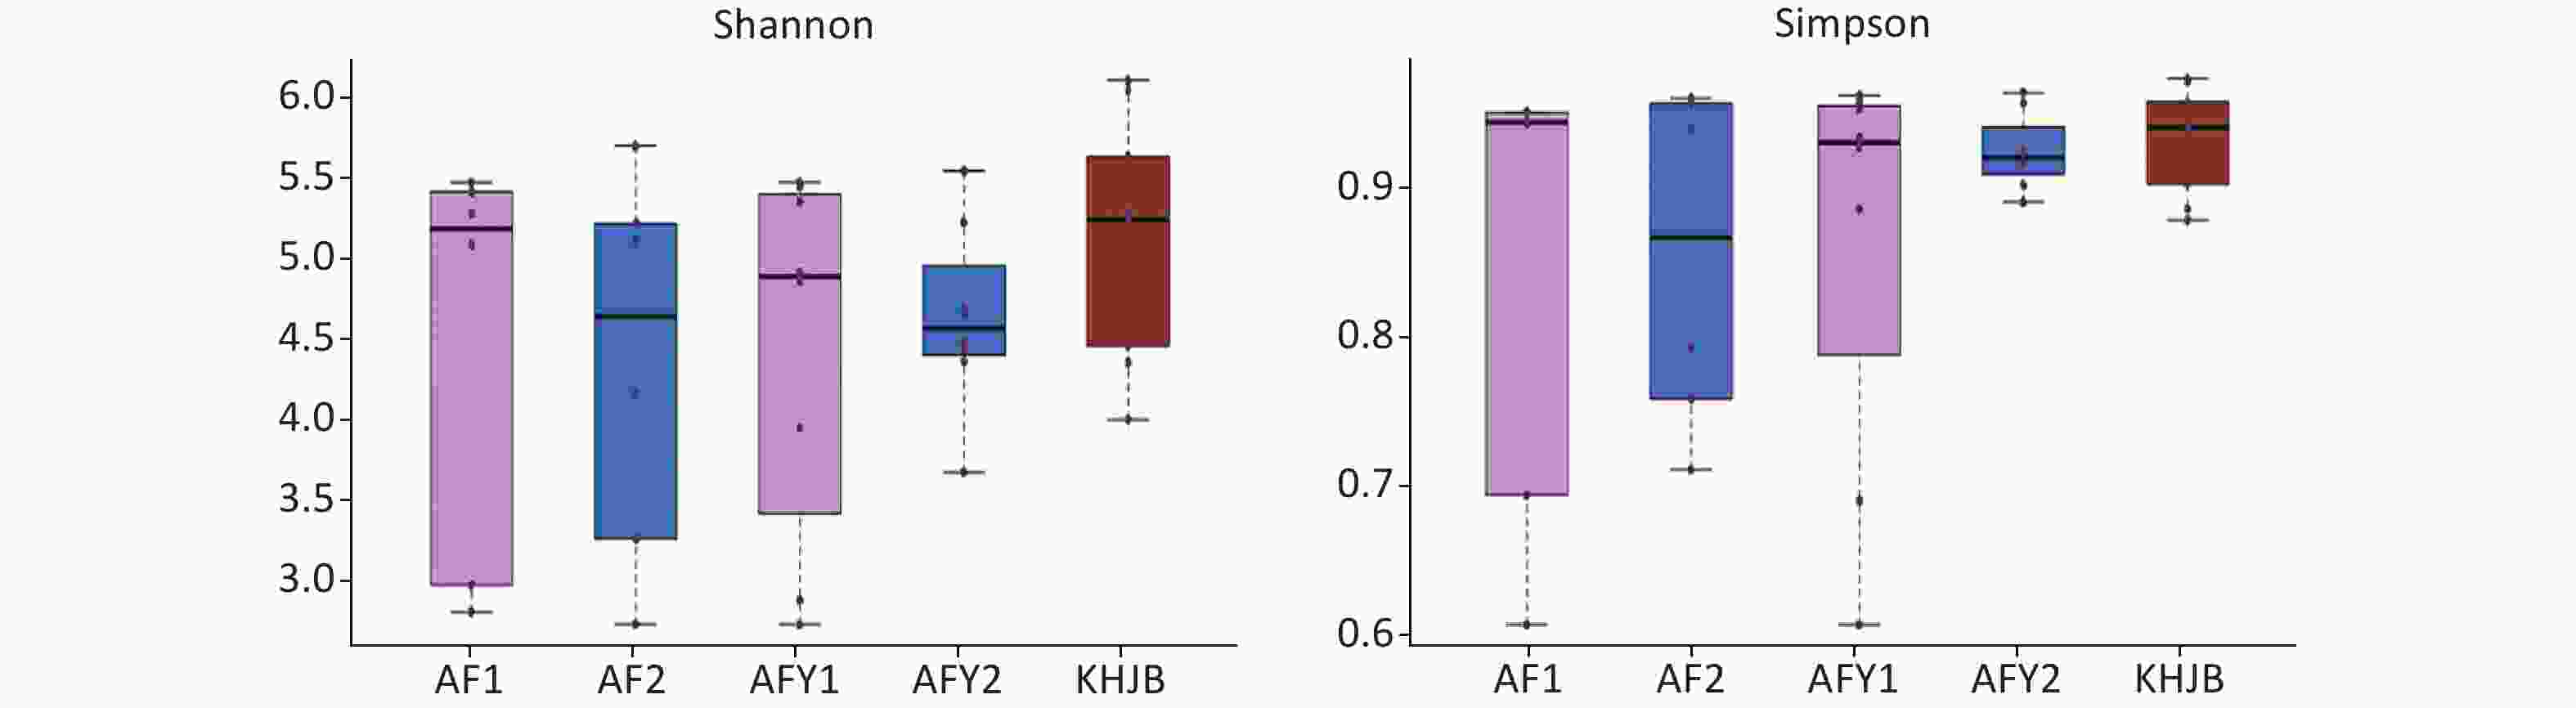
Figure 2. Comparison of α-diversity among groups. AF, general treatment group; AF_A, the first stool sample; AF_B, the second stool sample; AFY, probiotic group; AFY_A, the first stool sample; AFY_B, the second stool sample; KHJB, healthy control group. The intragroup differences of Shannon and Simpson index increased after MP infection and reduced after treatment in AFY group.
-
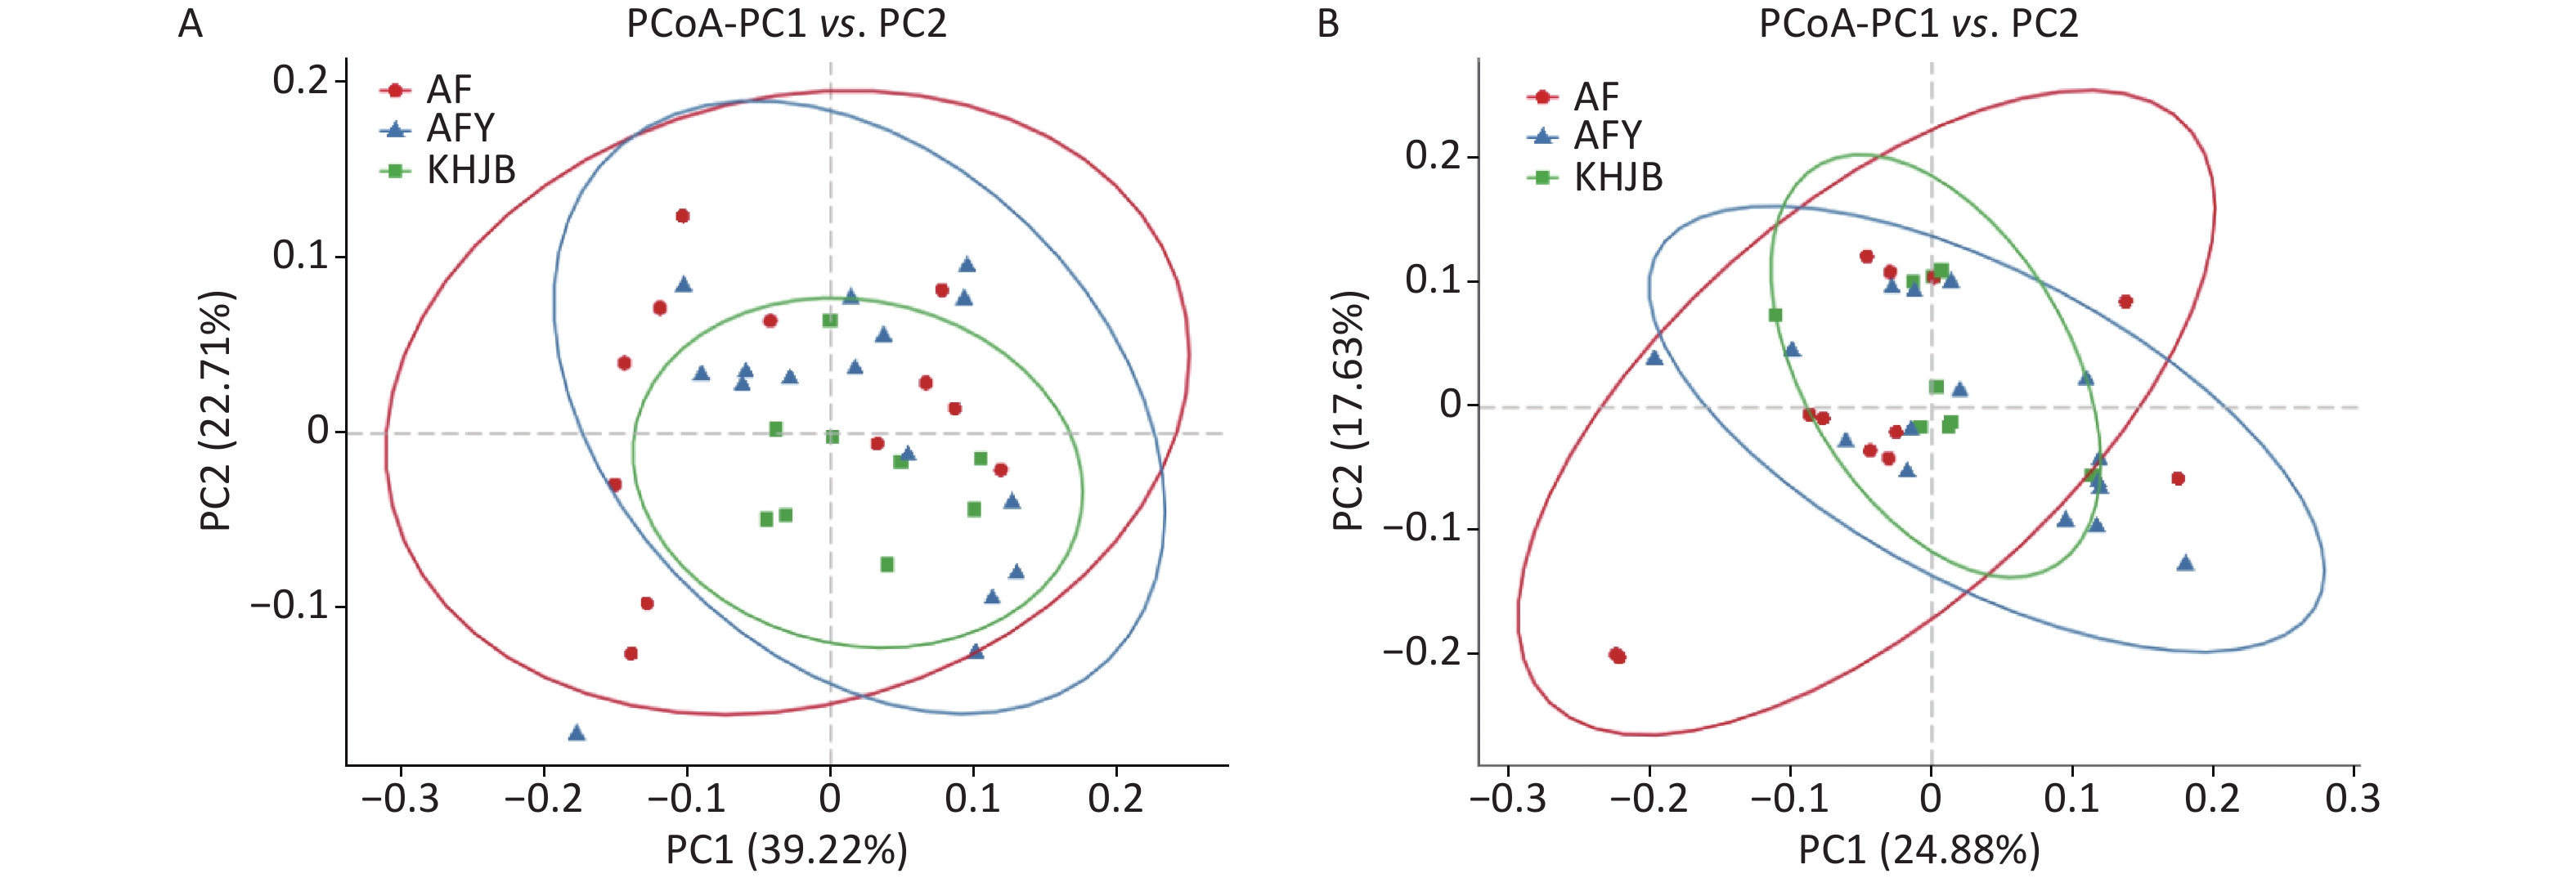
PCoA showed that the intragroup differences of bacterial community structures increased in AF and AFY groups comparing to KHJB group, while structural differences between AF and AFY groups were significant (Figure 3). Adonis analysis showed no significant differences in bacterial community structures between AF, AFY, and KHJB groups (R2 = 0.097, P = 0.087).
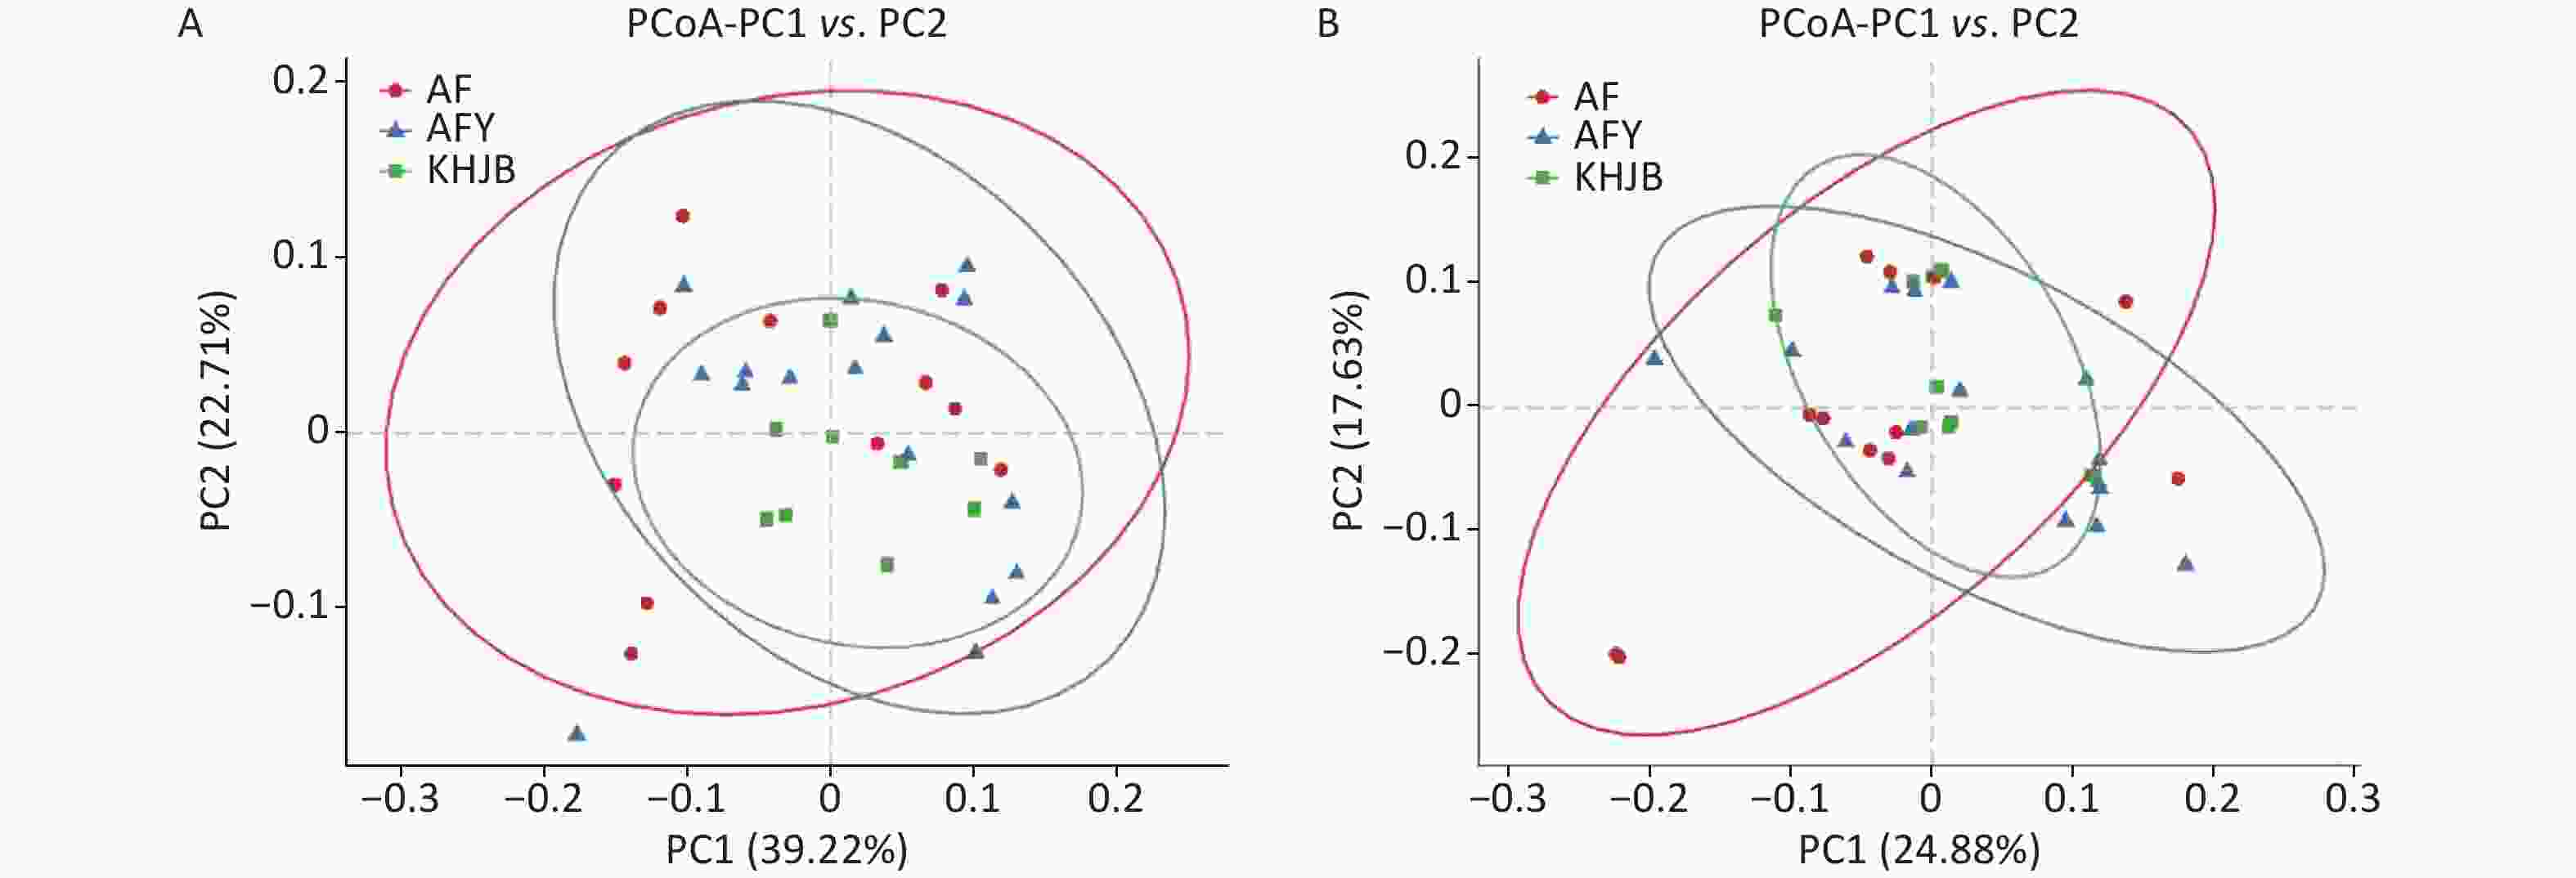
Figure 3. Principal coordinate analysis (PCoA) plots of individual fecal microbiota based on weighted UniFrac (A) and unweighted UniFrac distances (B). AF, general treatment group; AFY, probiotic group; KHJB, healthy control group.
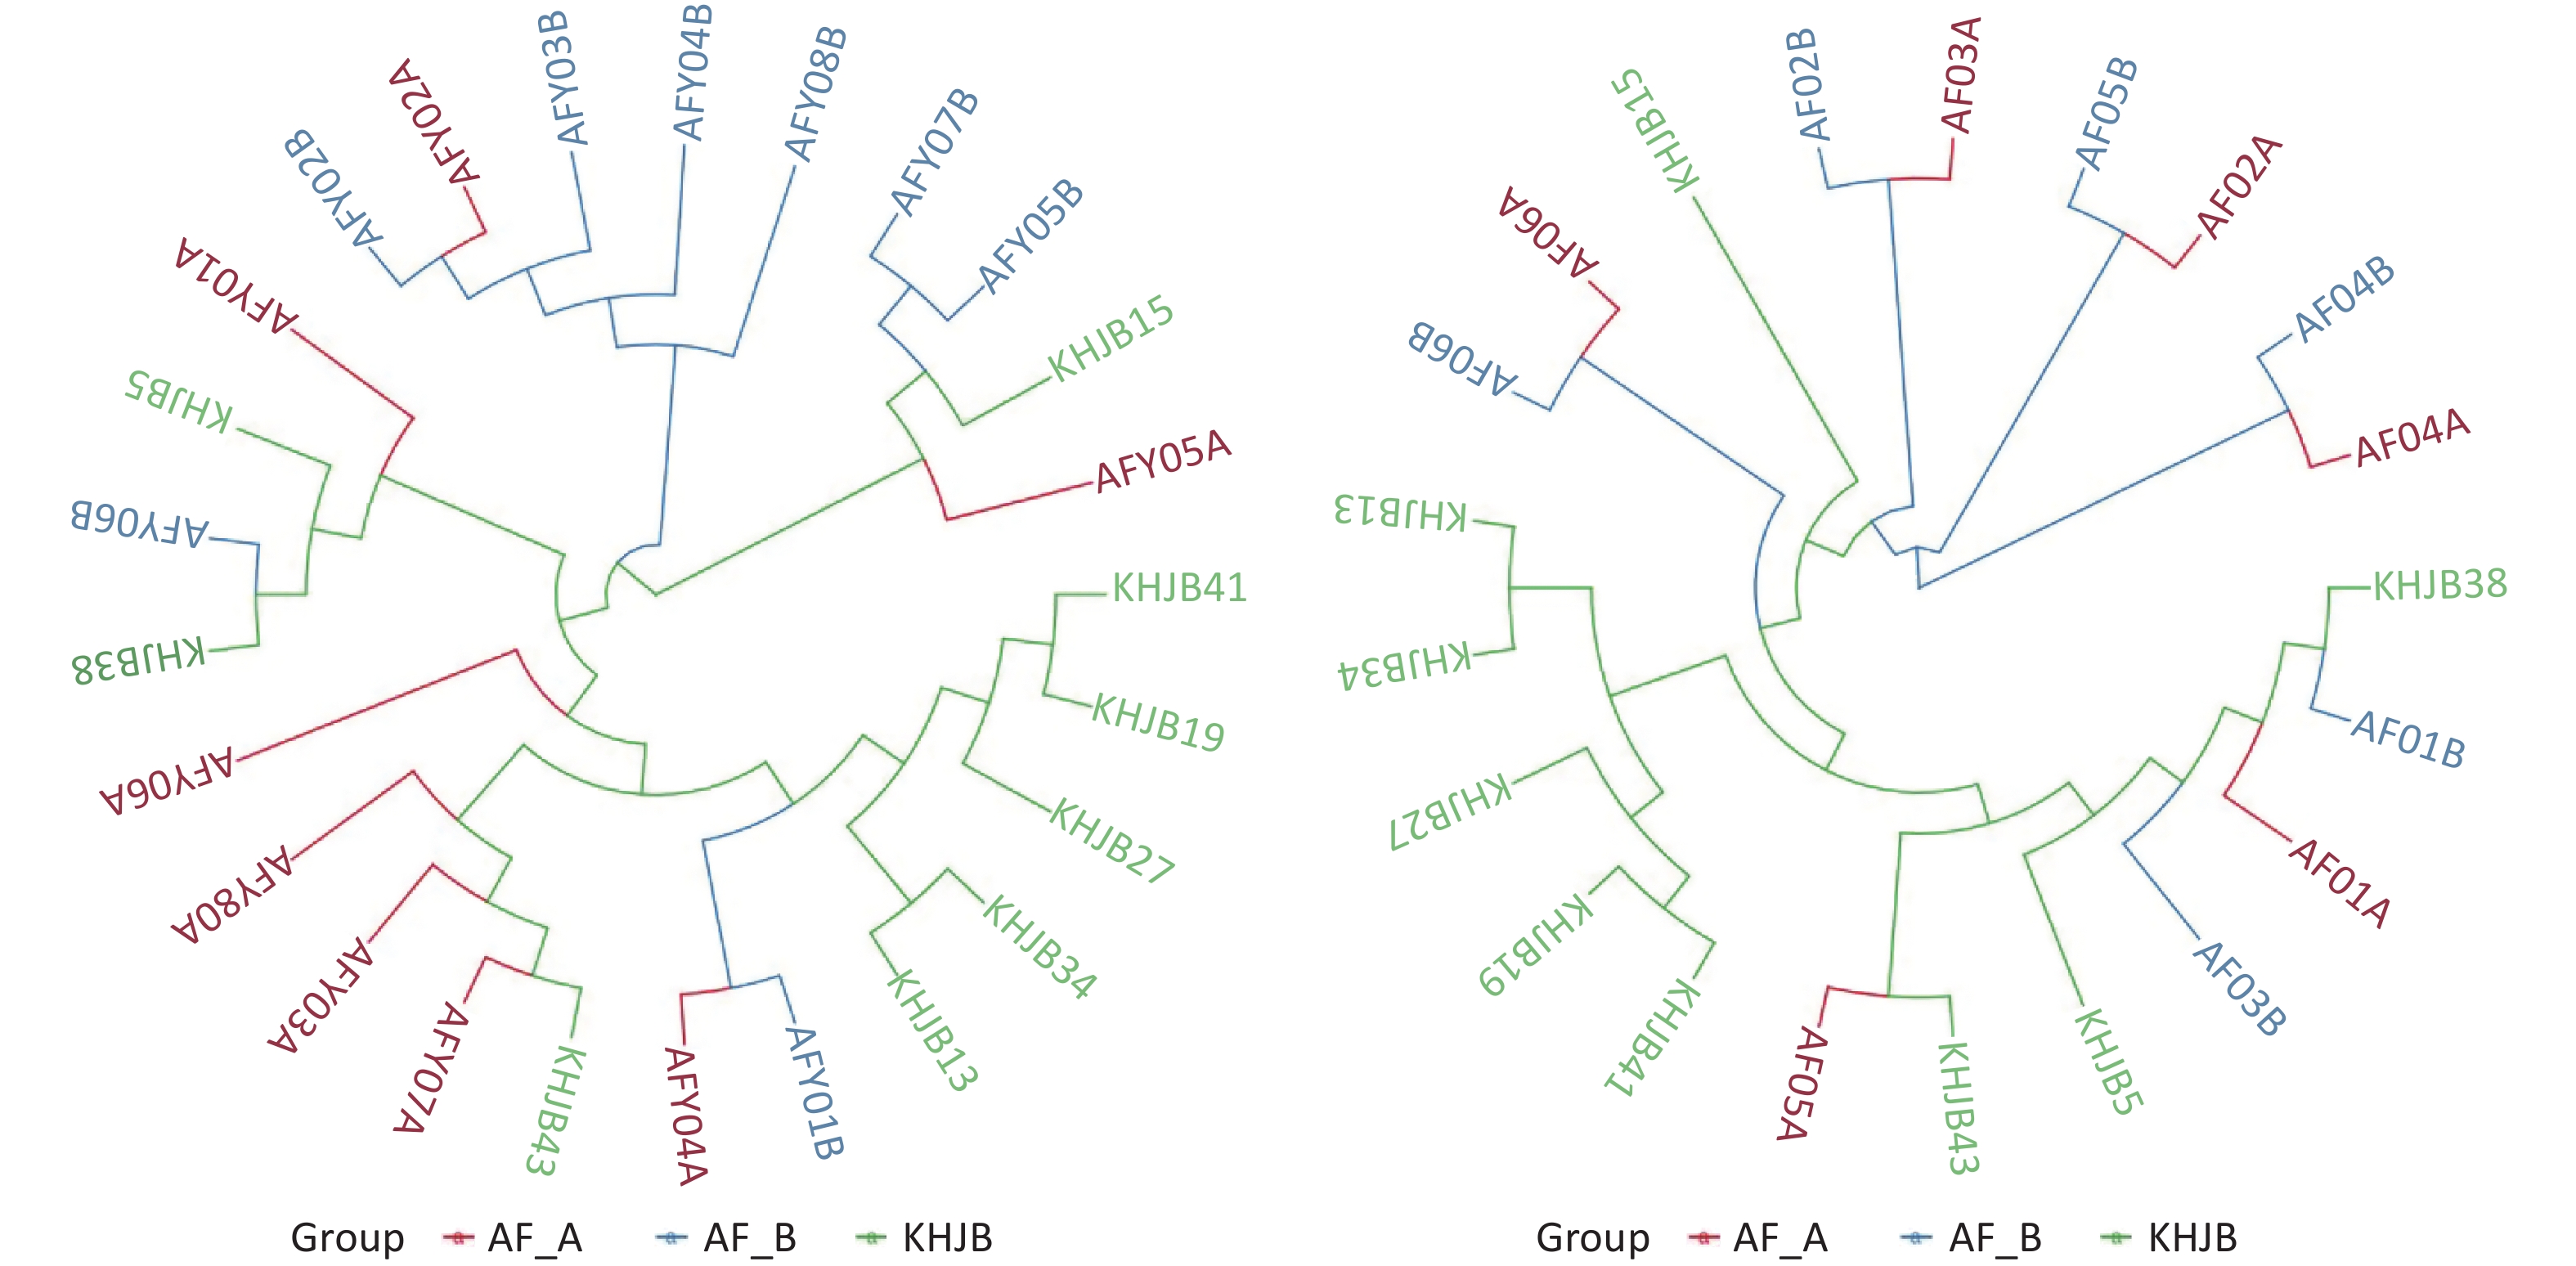
UPGMA clustering tree analysis based on the Weighted UniFrac distance showed that the bacterial community structures in AFY group are tending to be clustered together after treatment; While similarity in bacterial community structures were observed pre- and post-treatment in AF group. These results suggested that probiotics effectively stabilized intestinal flora (Figure 4).
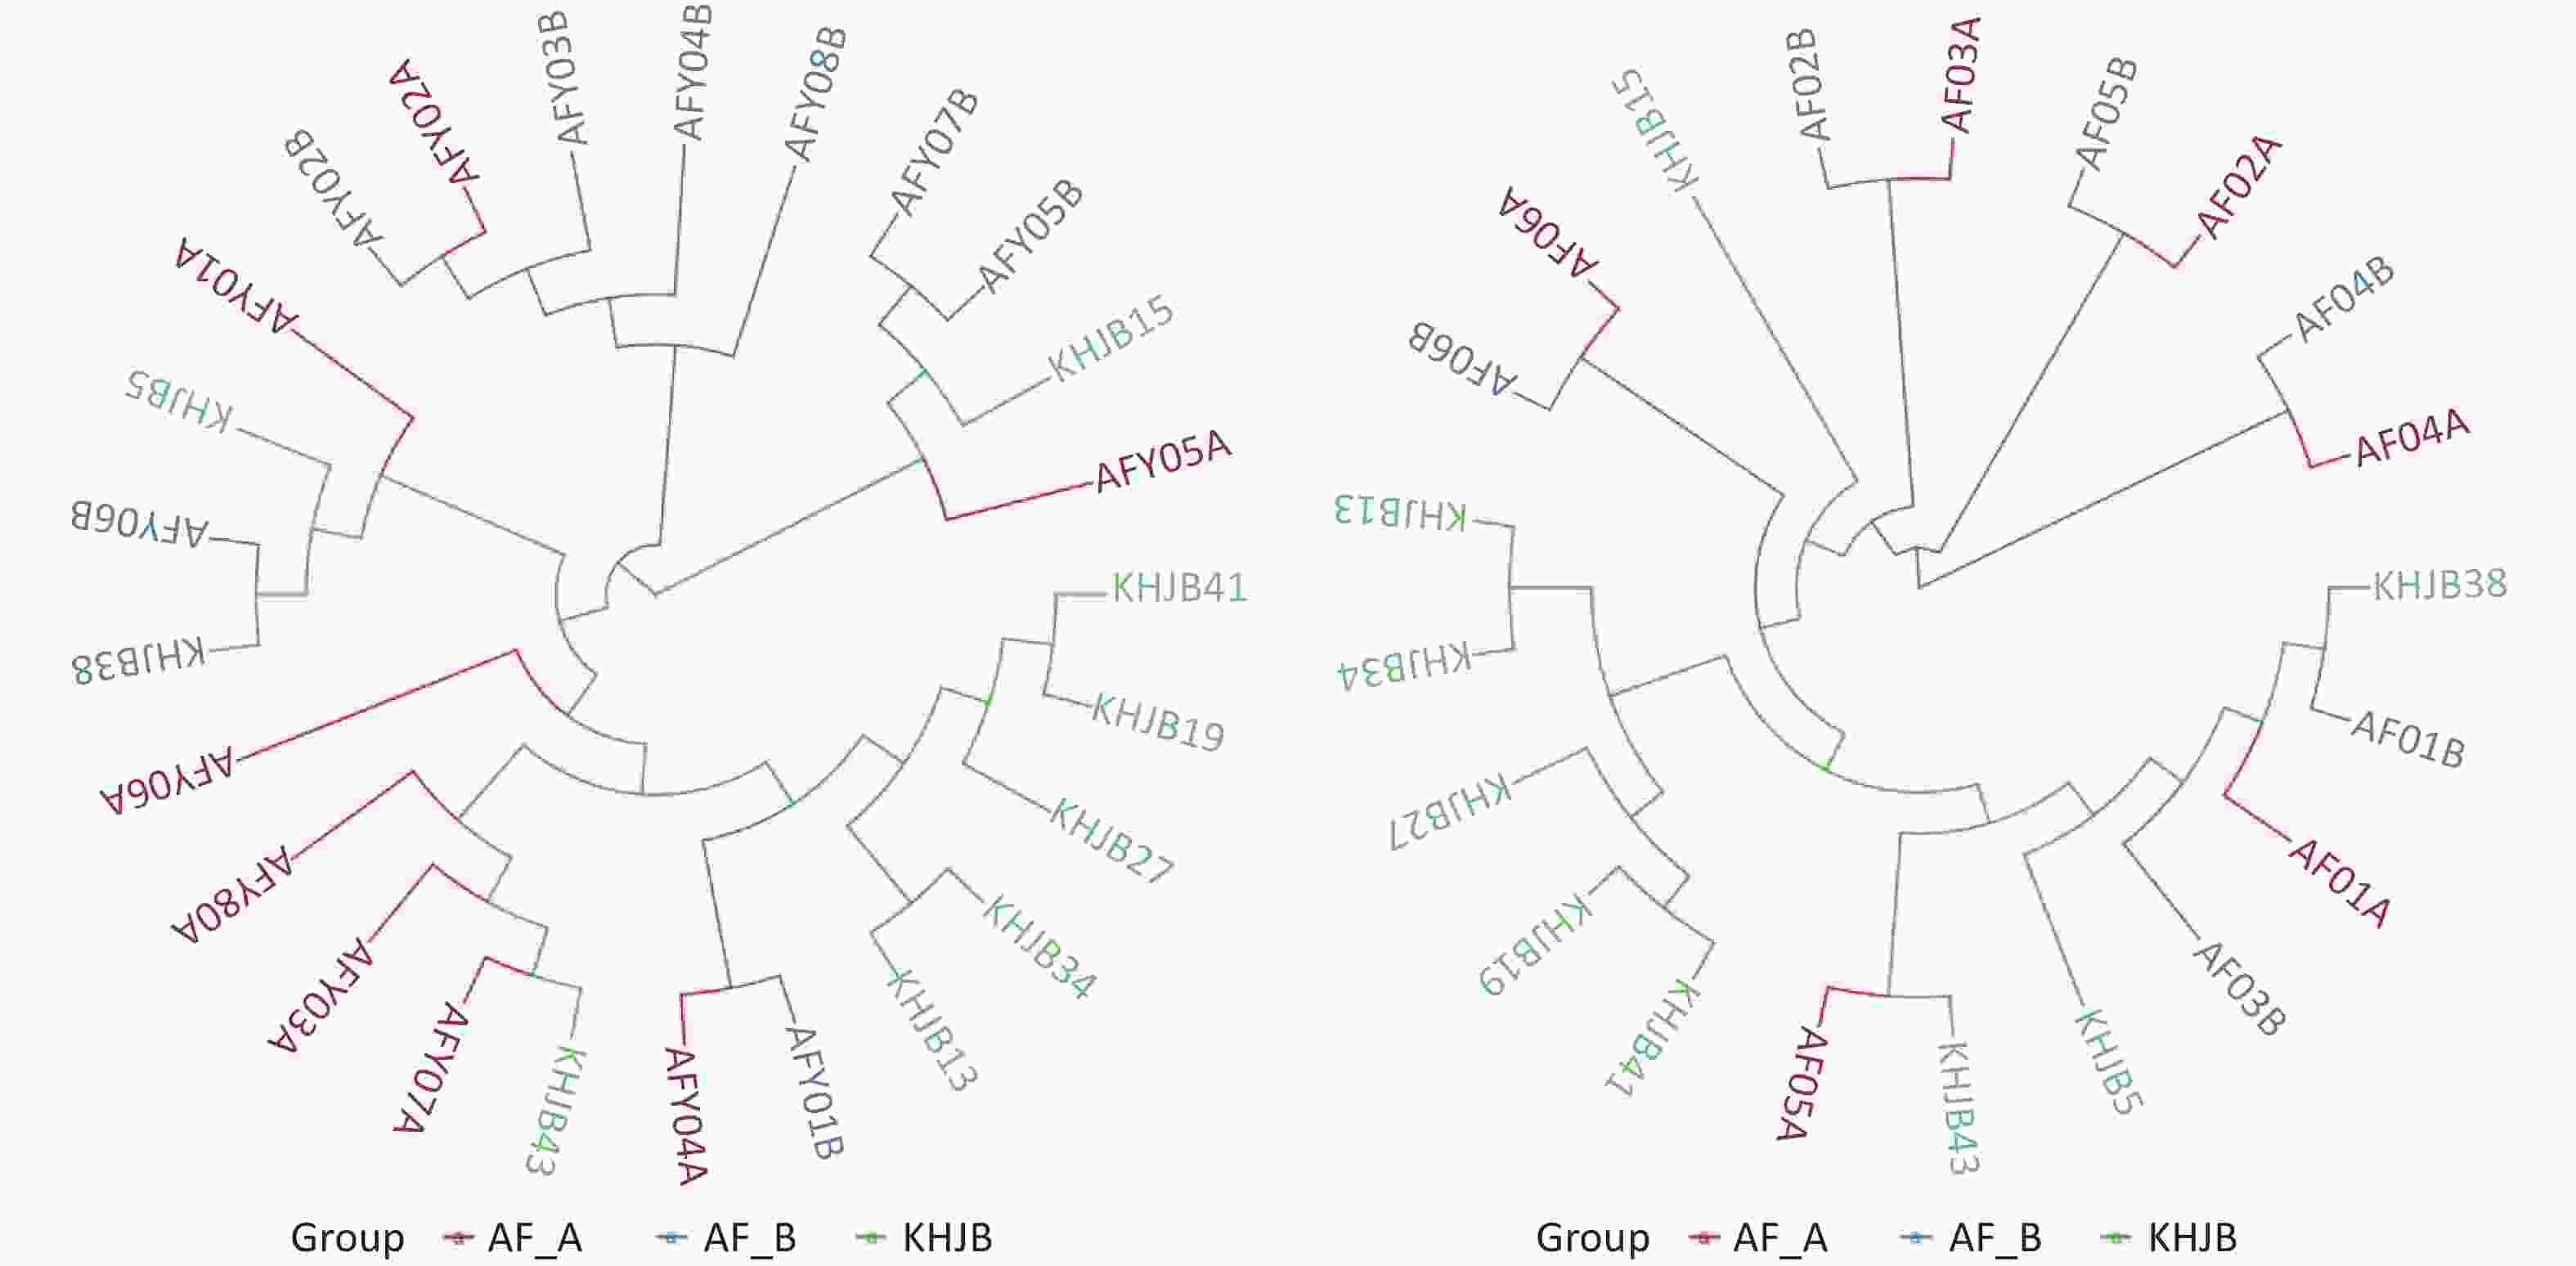
Figure 4. UPGMA clustering tree analysis. The bacterial community structures in AFY group are tending to be clustered together after treatment; While similarity in bacterial community structures were observed pre- and post-treatment in AF group.
-
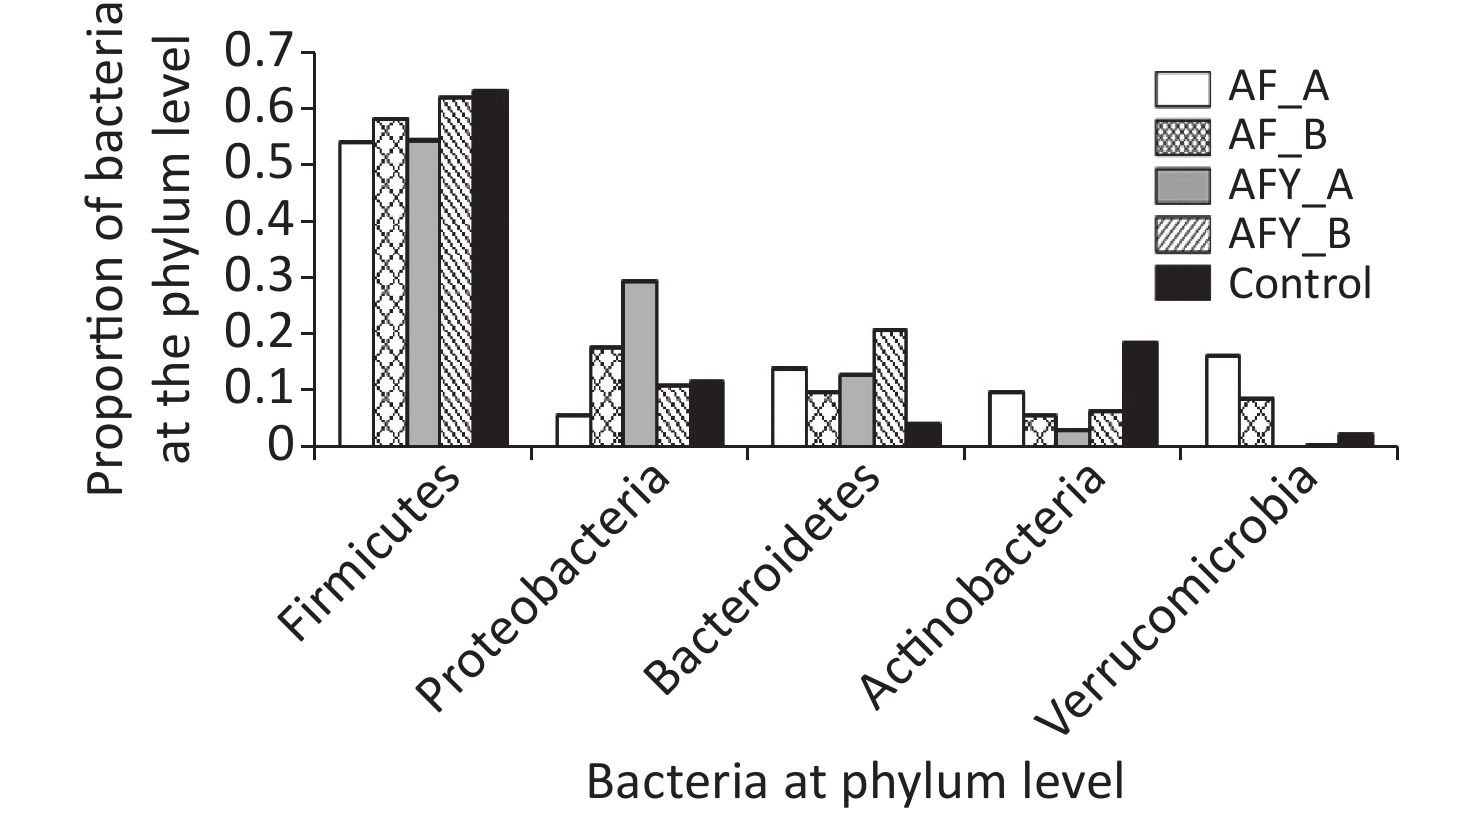
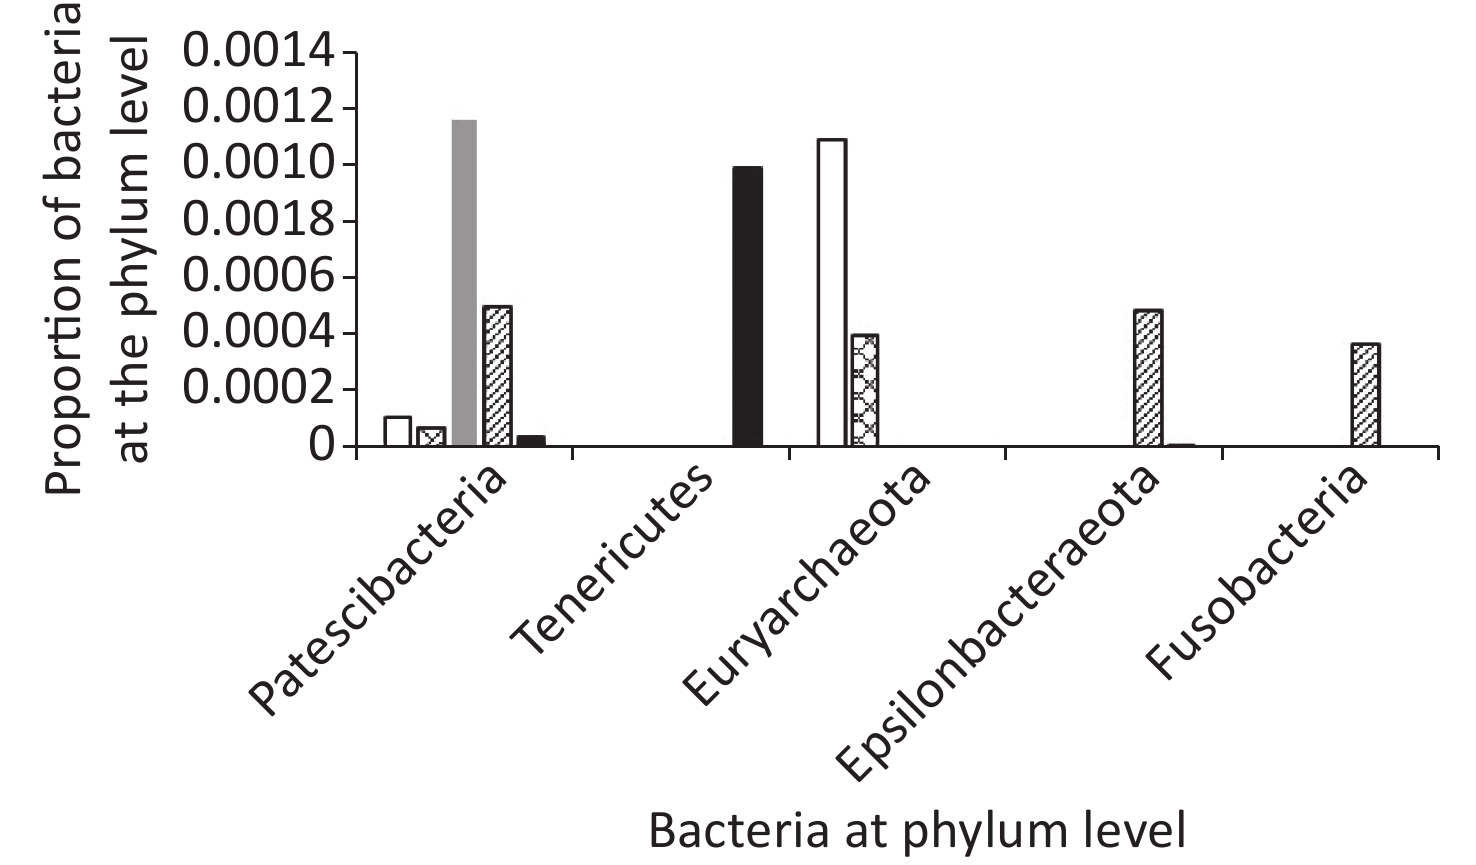
In total, ten phyla were detected across all samples: Firmicutes, Proteobacteria, Bacteroides, Actinobacteria, Verrucomicrobia, Patescibacteria, Tenericutes, Euryarchaeota, Fusobacteria, and Epsilonbacteraeota (Figures 5 and 6).
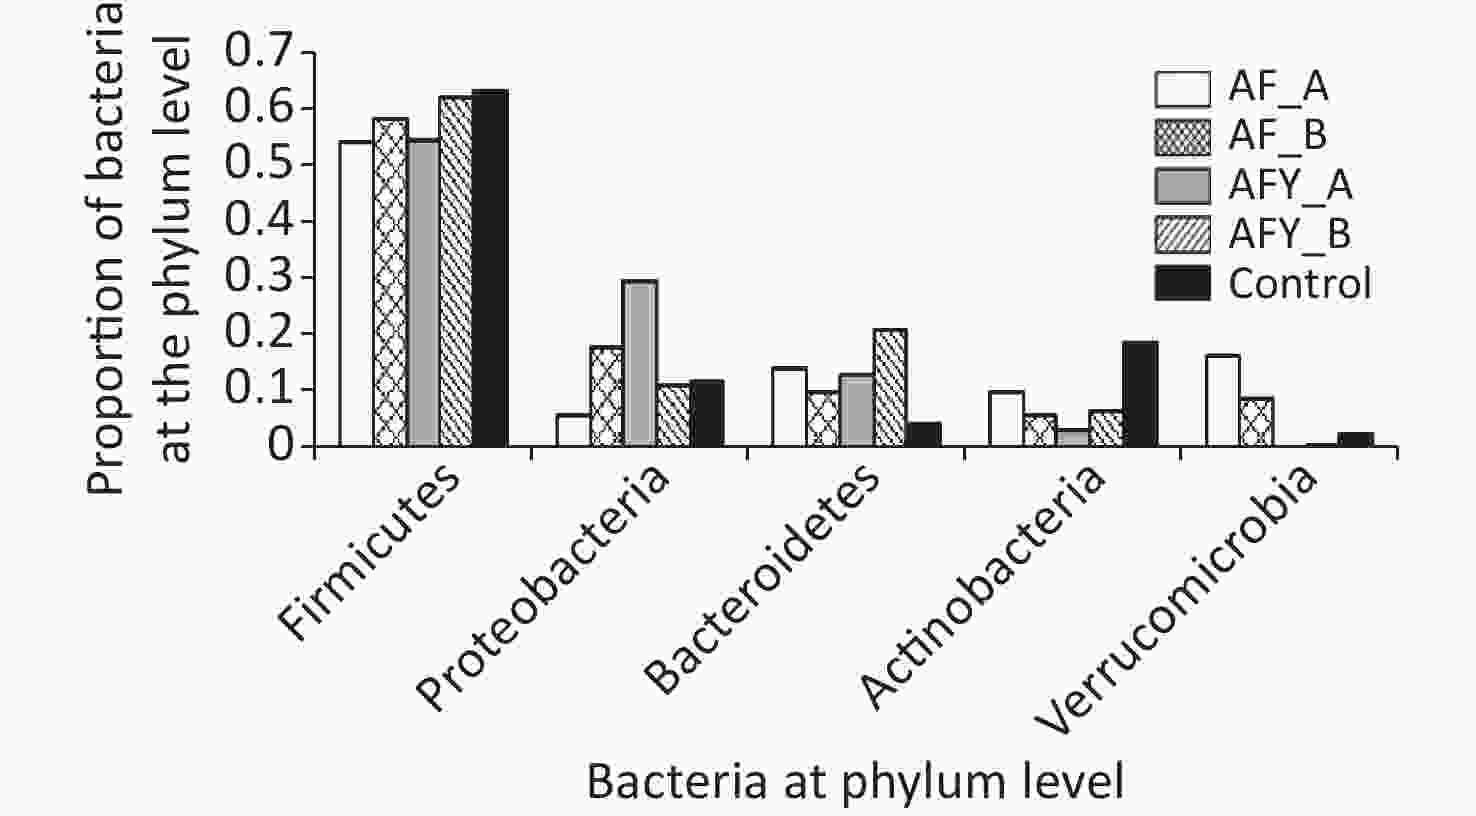
Figure 5. The top five bacteria at phylum level.
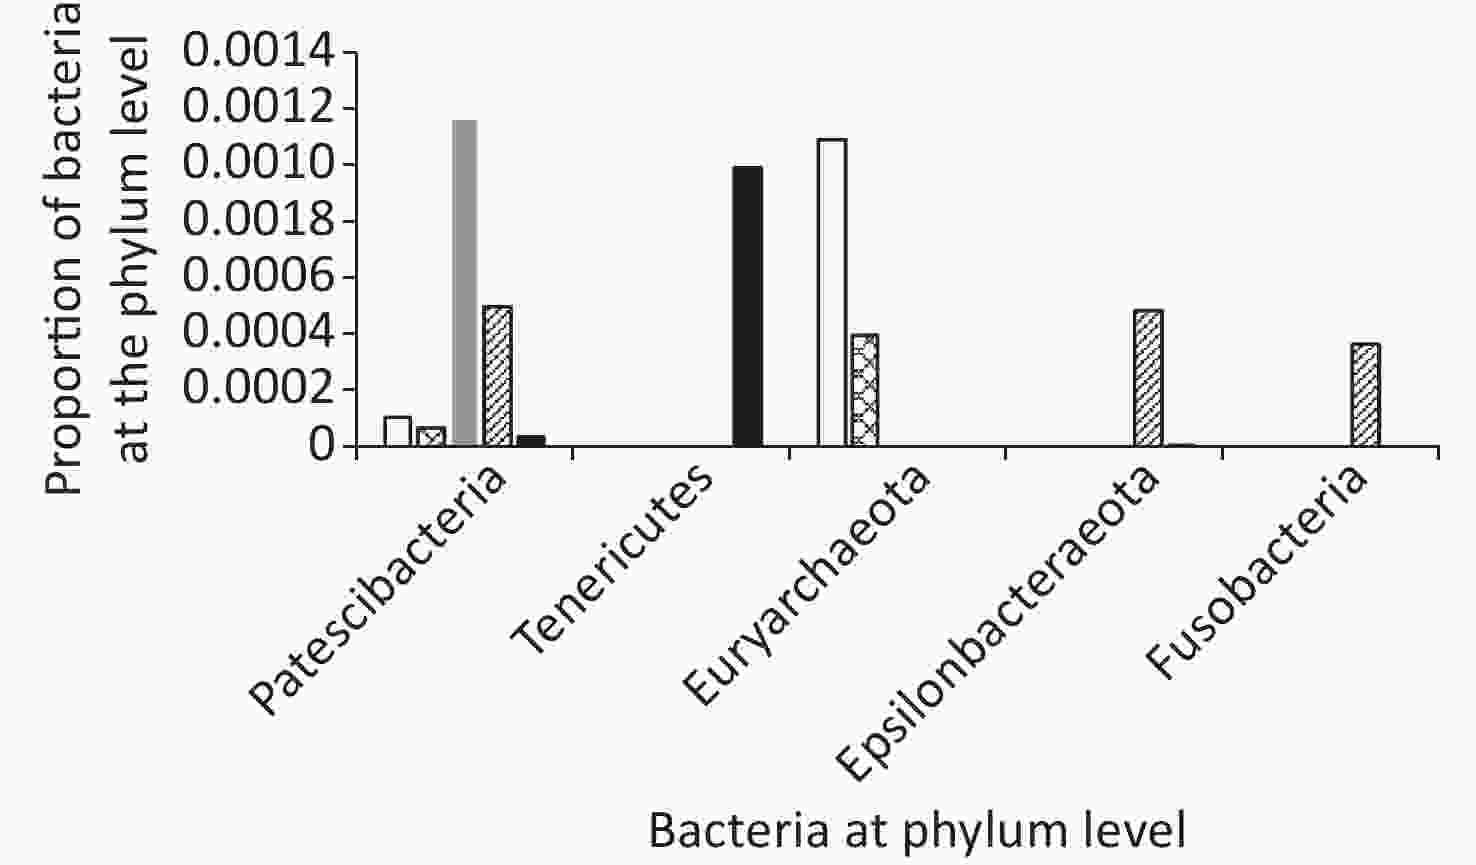
Figure 6. The top 6–10 bacteria at phylum level
Among groups, the proportion of Verrucomicrobia and Euryarchaeota was lower in the AFY group than in the AF group, and the proportion of Fusobacteria was higher in the AFY group than in the AF group (P < 0.05). When compared with the KHJB group, the proportion of Actinobacteria and Verrucomicrobia decreased, while the proportion of Bacteroidetes and Fusobacteria increased (P < 0.05).
The proportion of Actinomycetes in stool sample AF_B was lower in the AF group than in the KHJB group (P < 0.05). In the AFY group, the proportion of Epsilonbacteraeota was lower in the stool sample AFY_B than in AFY_A (P < 0.05). The proportion of Actinomycetes and Firmicutes in the stool specimen AFY_B was lower than in samples from the KHJB group (P < 0.05).
-
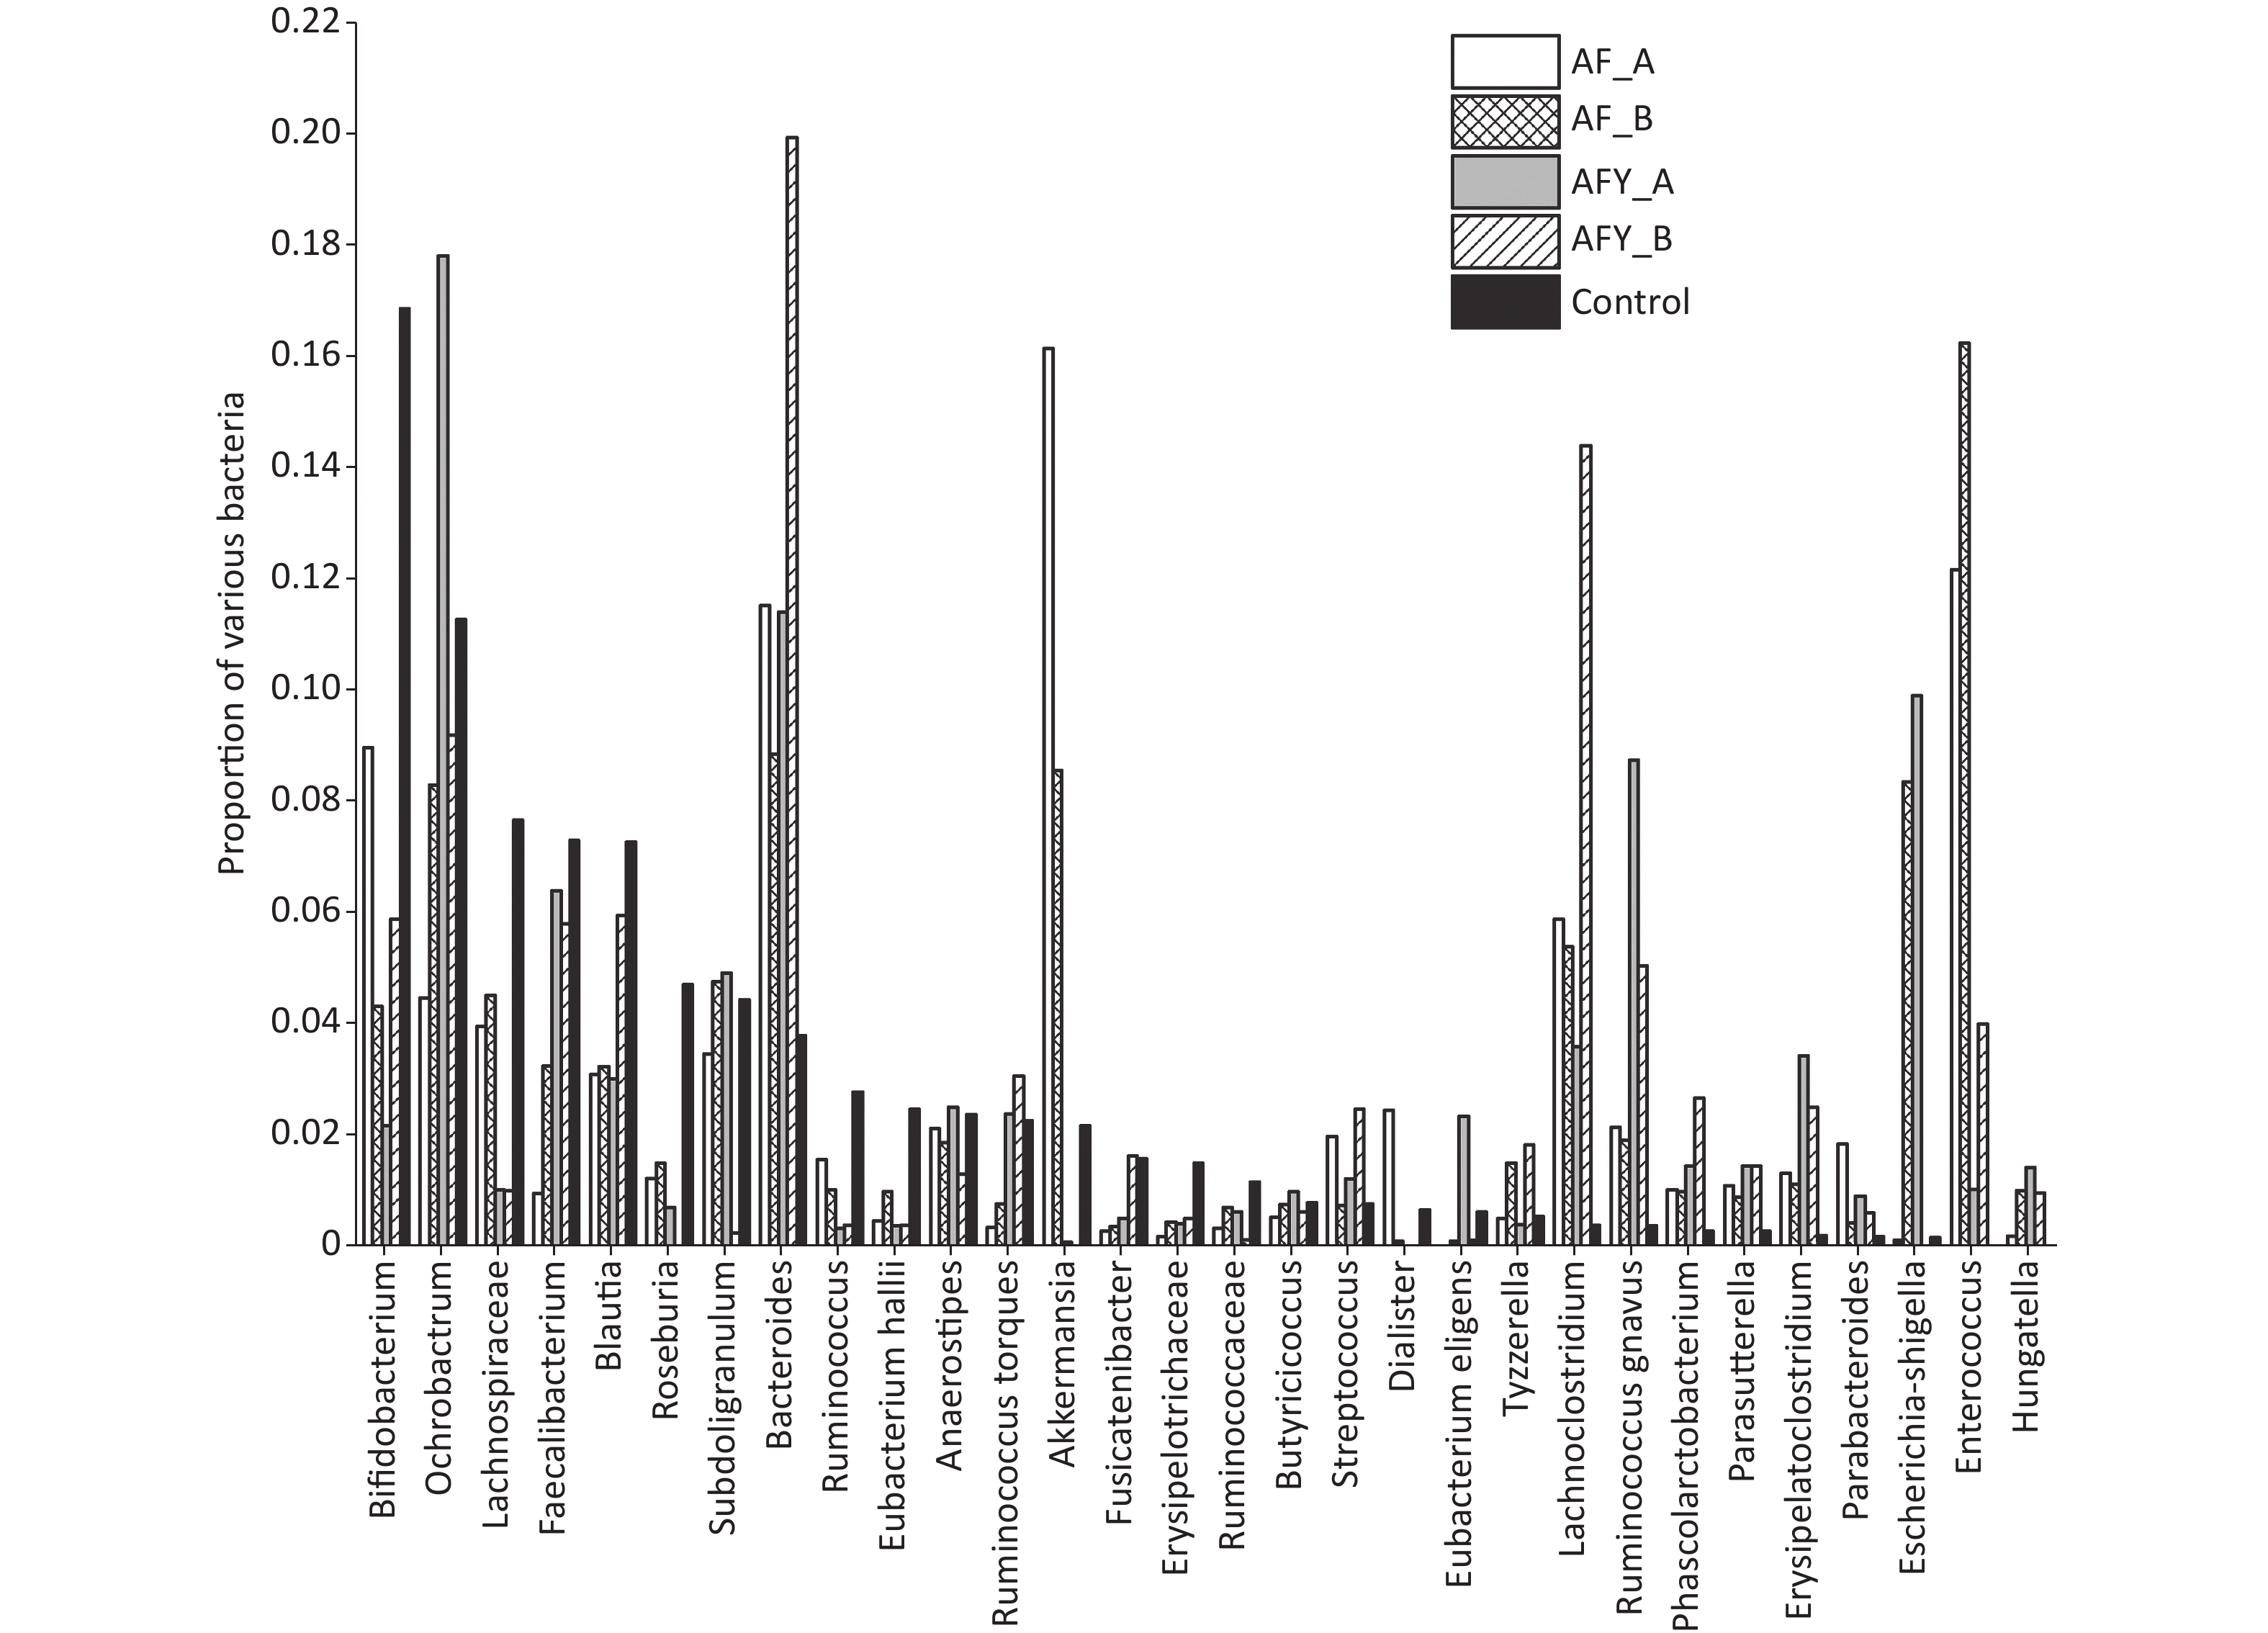
The proportion of Enterorhabdus was lower in the AF group than in the KHJB group, while the proportion of Lachnoclostridium was higher in the AF group than in the KHJB group (P < 0.05). The proportion of Akkermansia was lower in the AFY group than in the AF group, and the proportion of Bifidobacteria and Akkermansia was lower in the AFY than in the KHJB group. The proportion of Enterococcus, Lachnoclostridium, Clostridium erysipelas, and Erysipelatoclostridium increased when compared with levels in KHJB group (P < 0.05).
The proportion of Faecalibacterium and Eubacteriumhallii in stool samples AF_A was lower group than in the KHJB group (P < 0.05). The ratio of Bifidobacteria and Romboutsia in stool samples AF_B was lower than in the KHJB group (P < 0.05). In the AFY group, the proportion of Escherichia-Shigella and Butyrivibrio in stool samples AFY_B was lower than in AFY_A. The proportion of Bifidobacteria in stool samples AFY_A was lower than in KHJB group. The proportion of E. coli-Shigella and Subdoligranulum in stool samples AFY_B was lower than in KHJB group. When compared with the KHJB group, the proportion of Enterococcus, Lachnoclostridium, Roseburia, and Erysipelatoclostridium was lower in AFY group (P < 0.05, Figures 7 and 8).
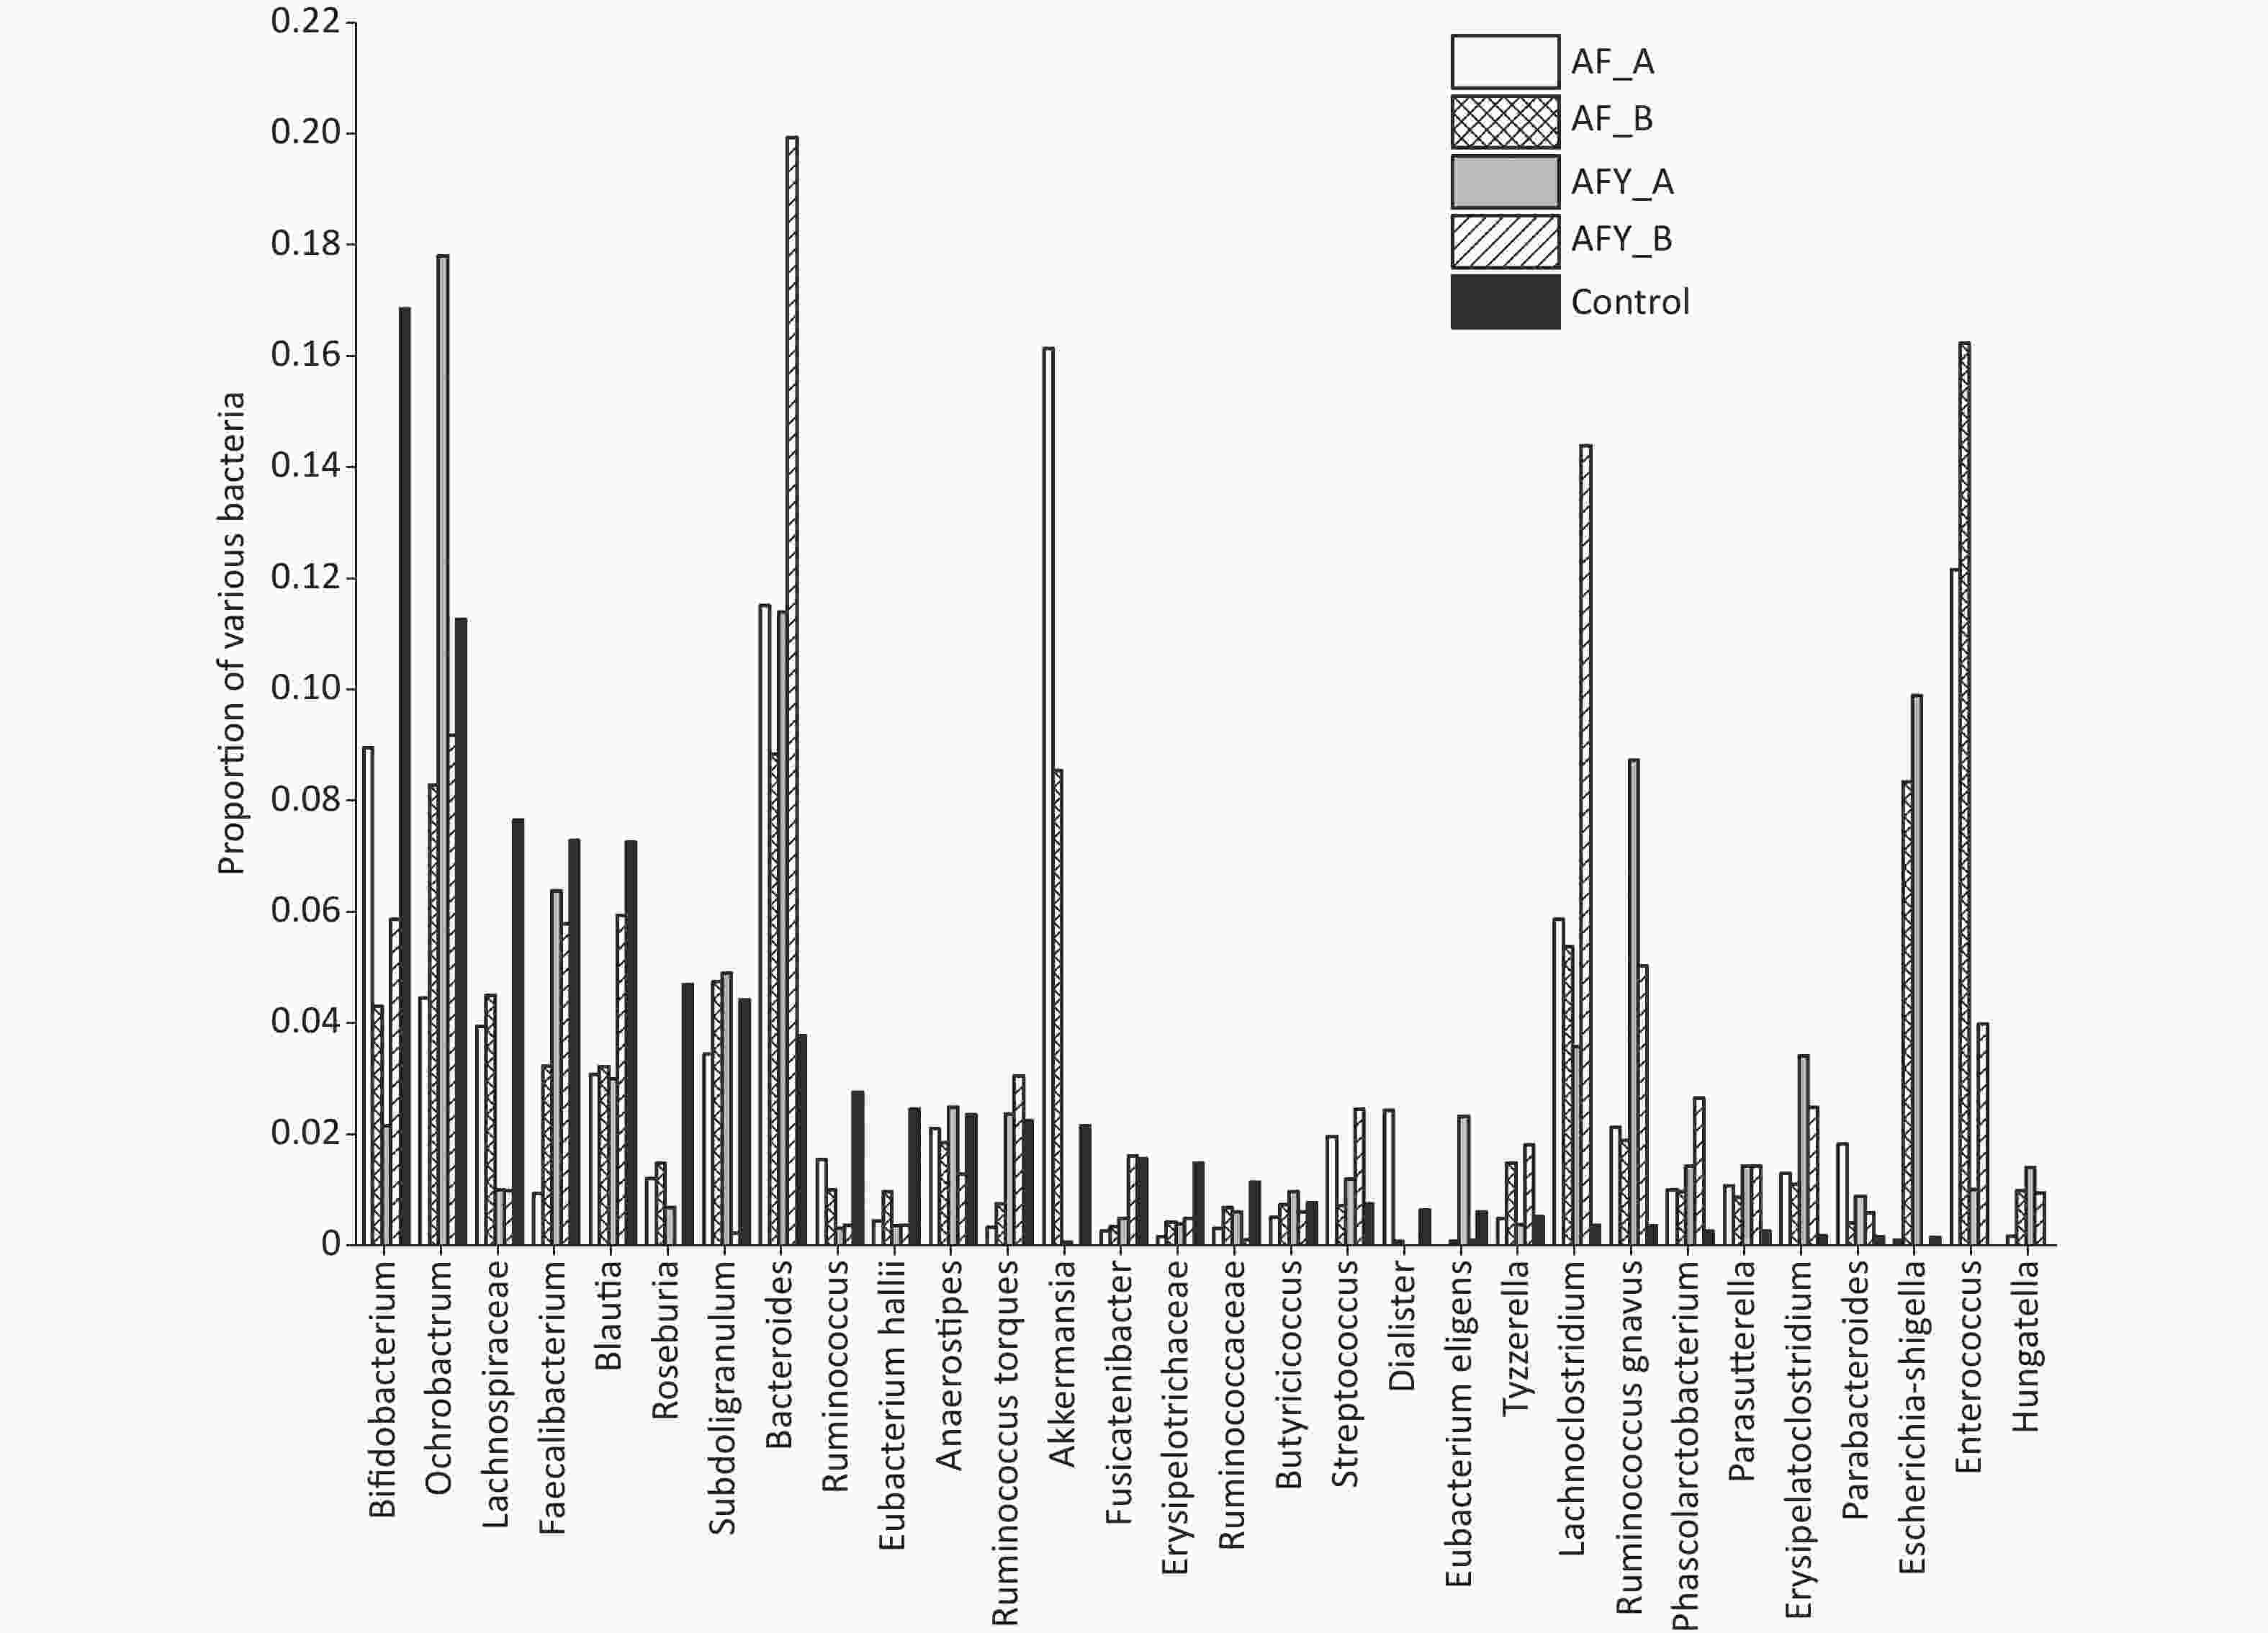
Figure 7. The top 30 different operational taxonomic units (OTUs) in bacterial communities. The graph compares the average proportion of different bacteria in each group and indicates overall changes in bacterial communities. The y-axis represents percentages. On the whole, bacteria were sorted according to the proportion and size of groups. In this figure, they were sorted according to bacteria in the control group.
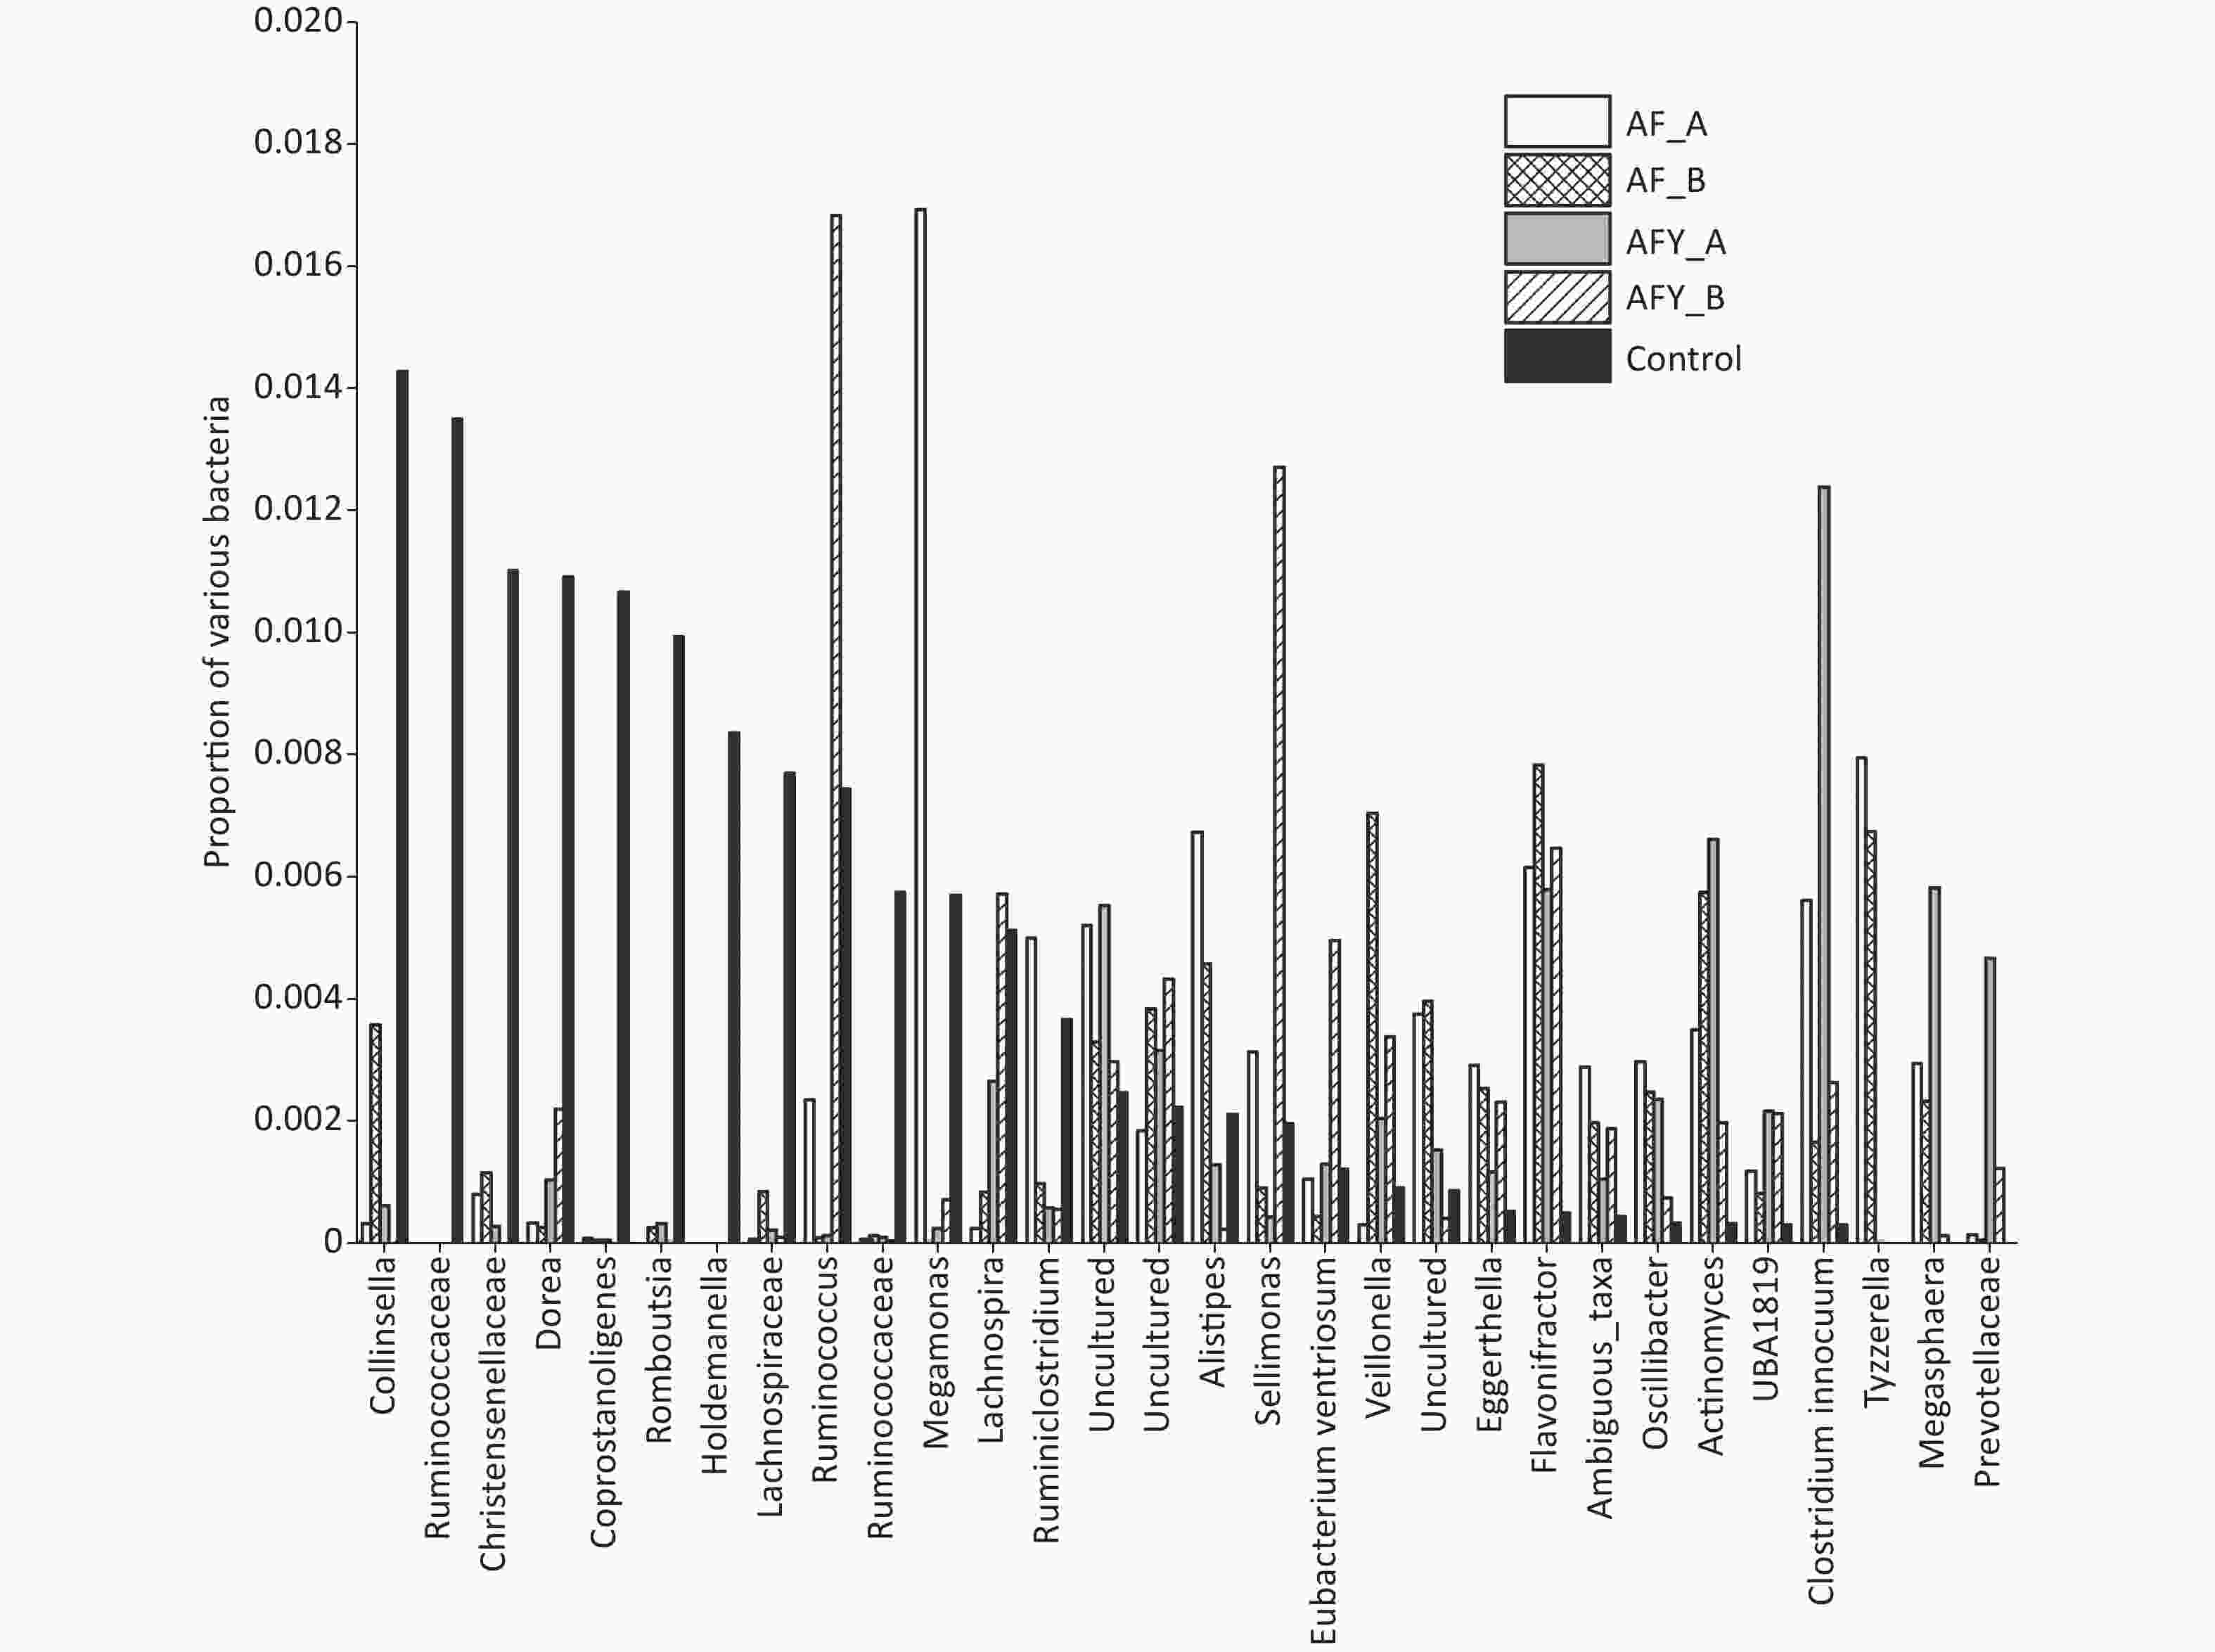
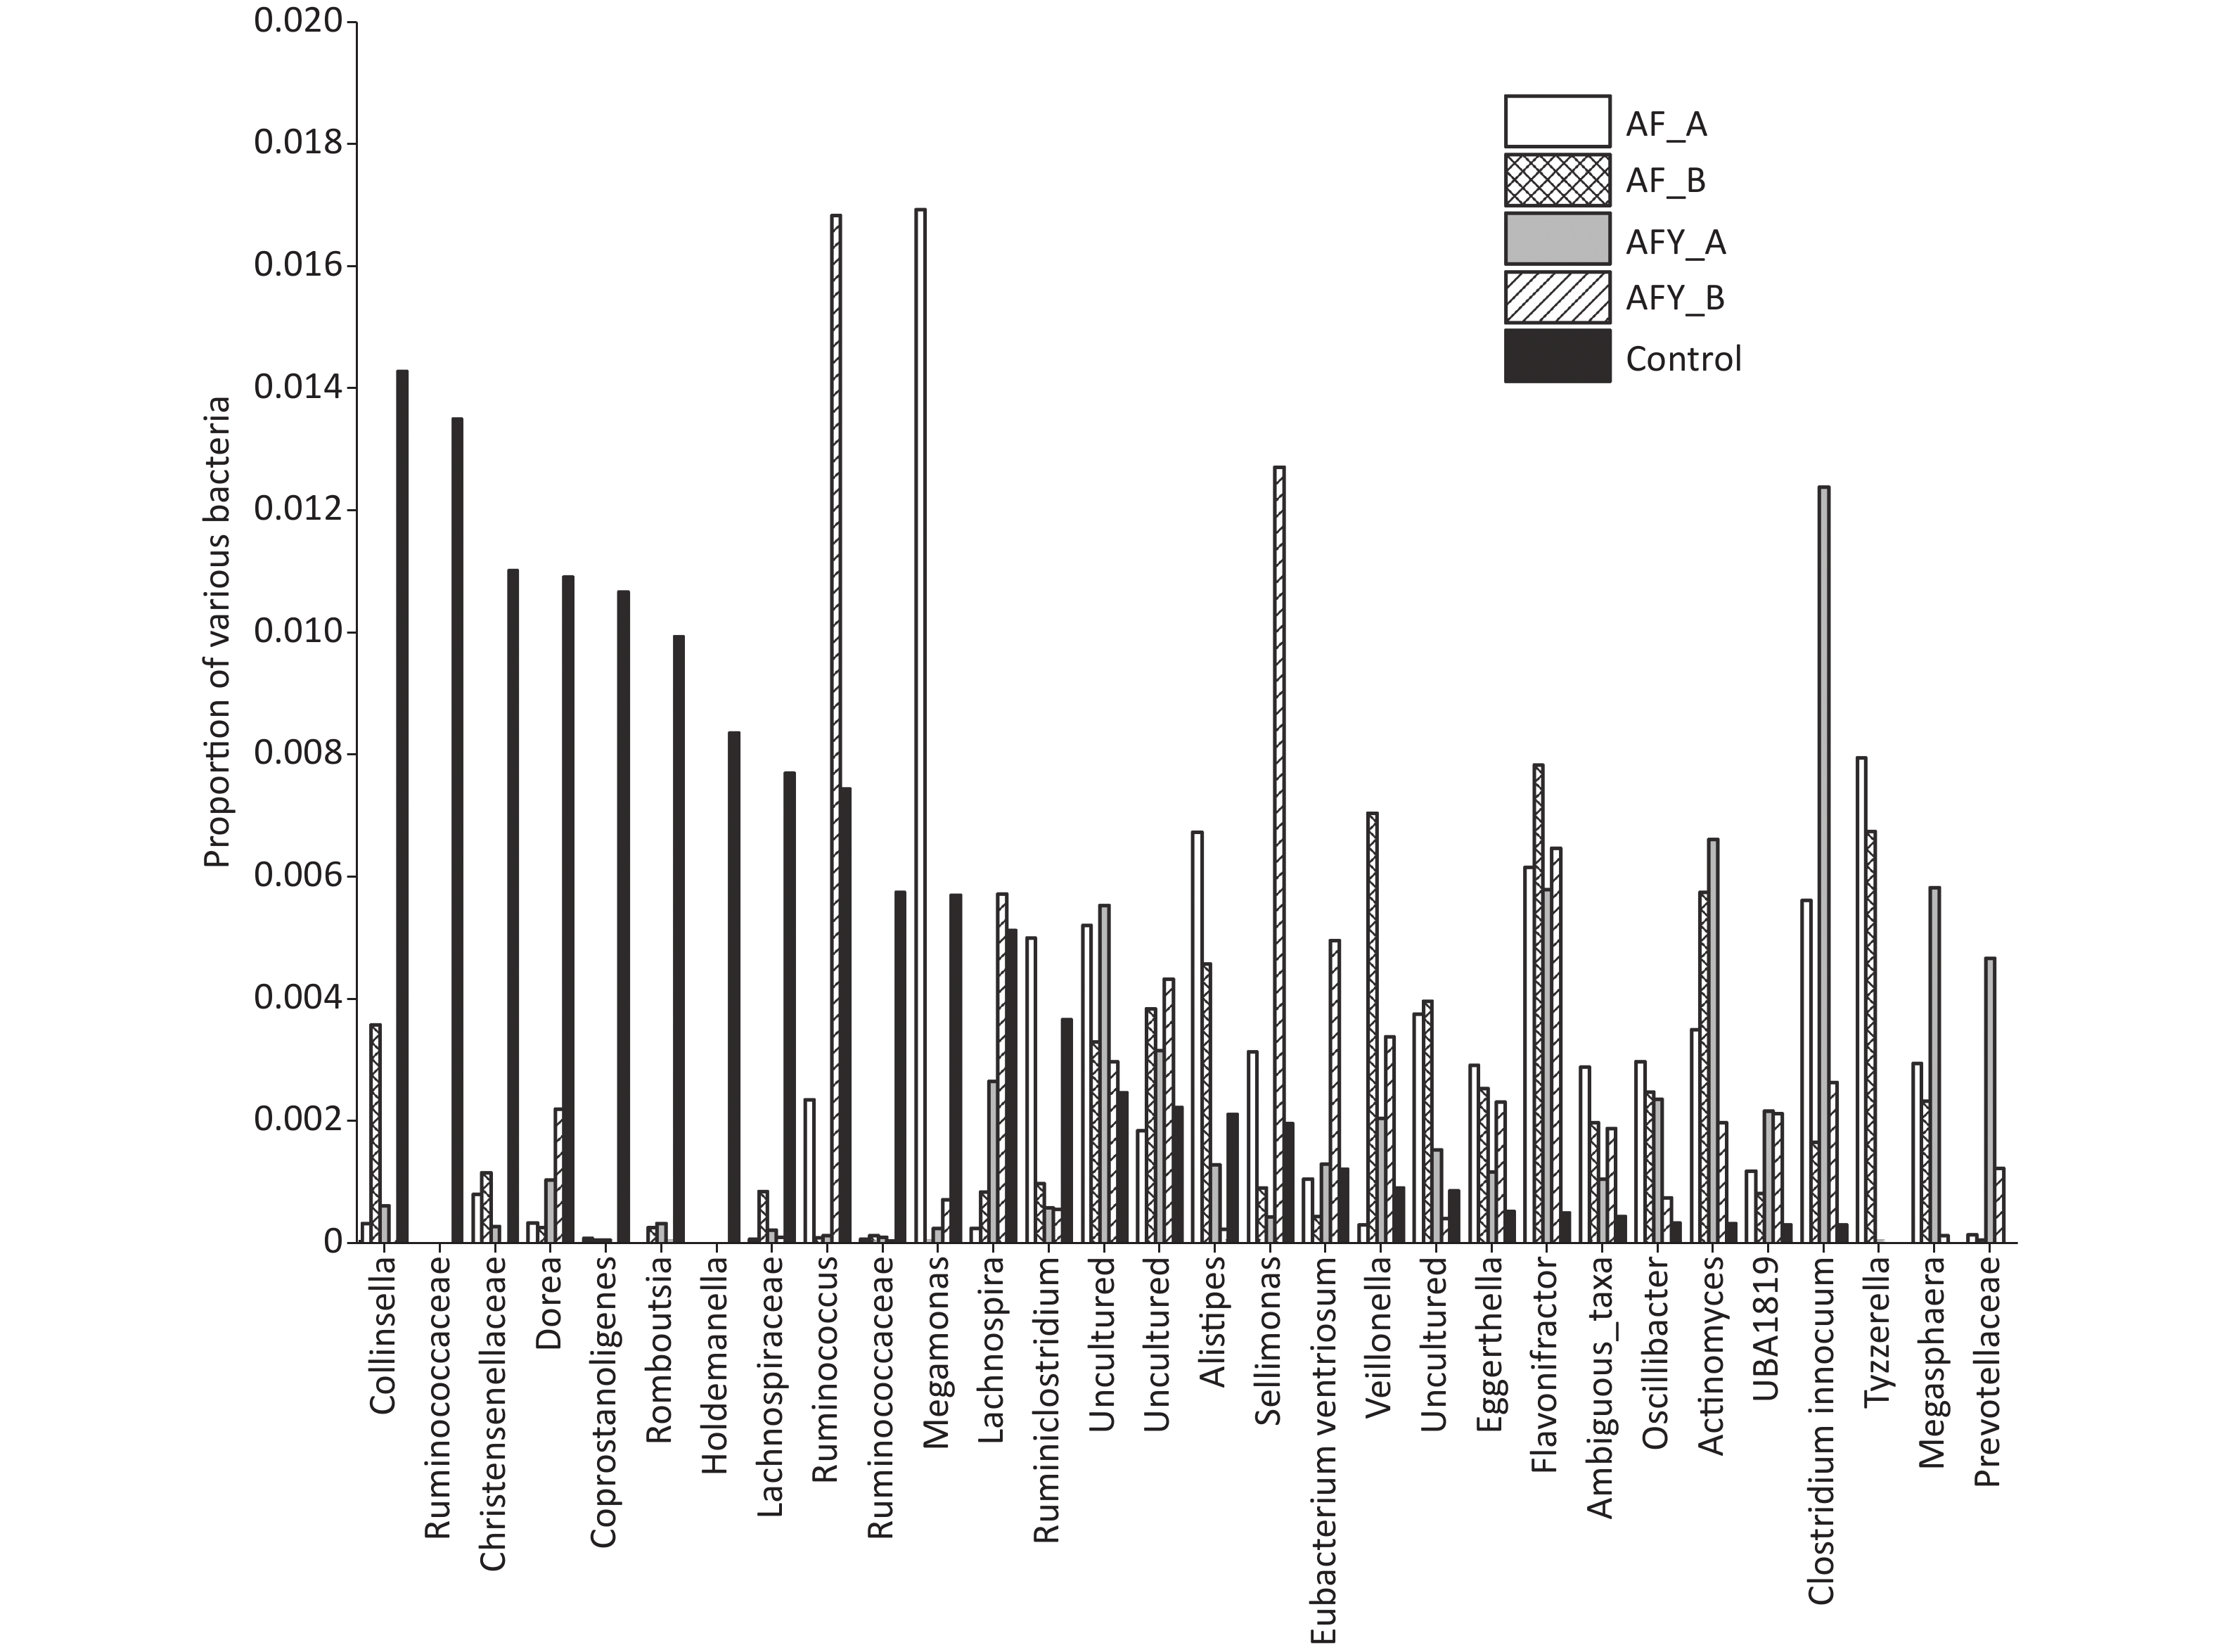
Figure 8. The top 31–60 different operational taxonomic units (OTUs) in bacterial communities. The graph compares the average proportion of different bacteria in each group and indicates overall changes in bacterial communities. The y-axis represents percentages.
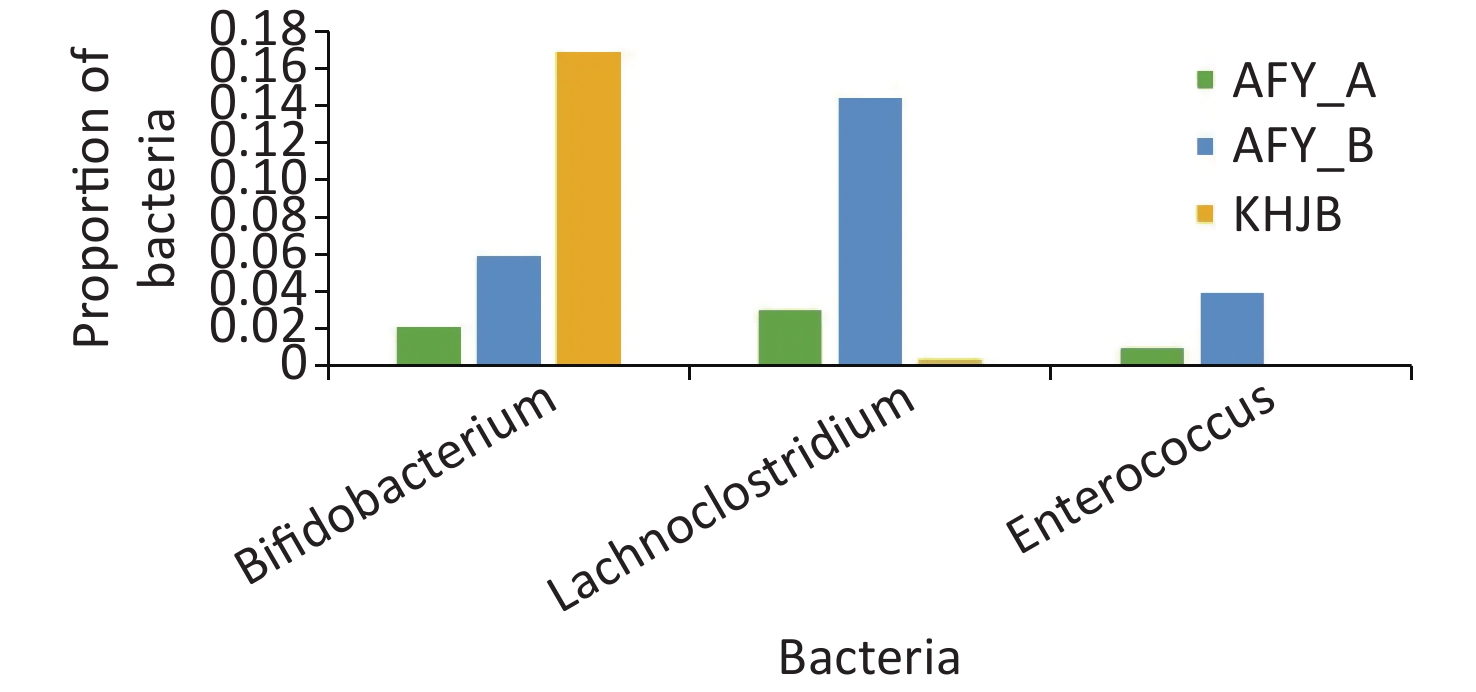
In the probiotic group (AFY), after receiving “combined live Bifidobacterium, Lactobacillus, Enterococcus, and B. cereus tablets”, the proportion of Bifidobacterium, Lactobacillus, and Enterococcus in stool samples AFY_B was higher than that in AFY_A, although differences were not statistically significant (P = 0.454, P = 0.113, and P = 0.463, respectively), but the proportion of Enterococcus in stool specimens (AFY_B) after probiotic treatment increased significantly when compared with healthy controls (P < 0.05). The proportion of Bifidobacterium in pre-treatment stool specimens (AFY_A) was lower than in healthy controls (P < 0.05), but no differences in Bifidobacterium ratios in stool specimens after probiotics treatment were noted when compared with healthy controls (Figure 9).
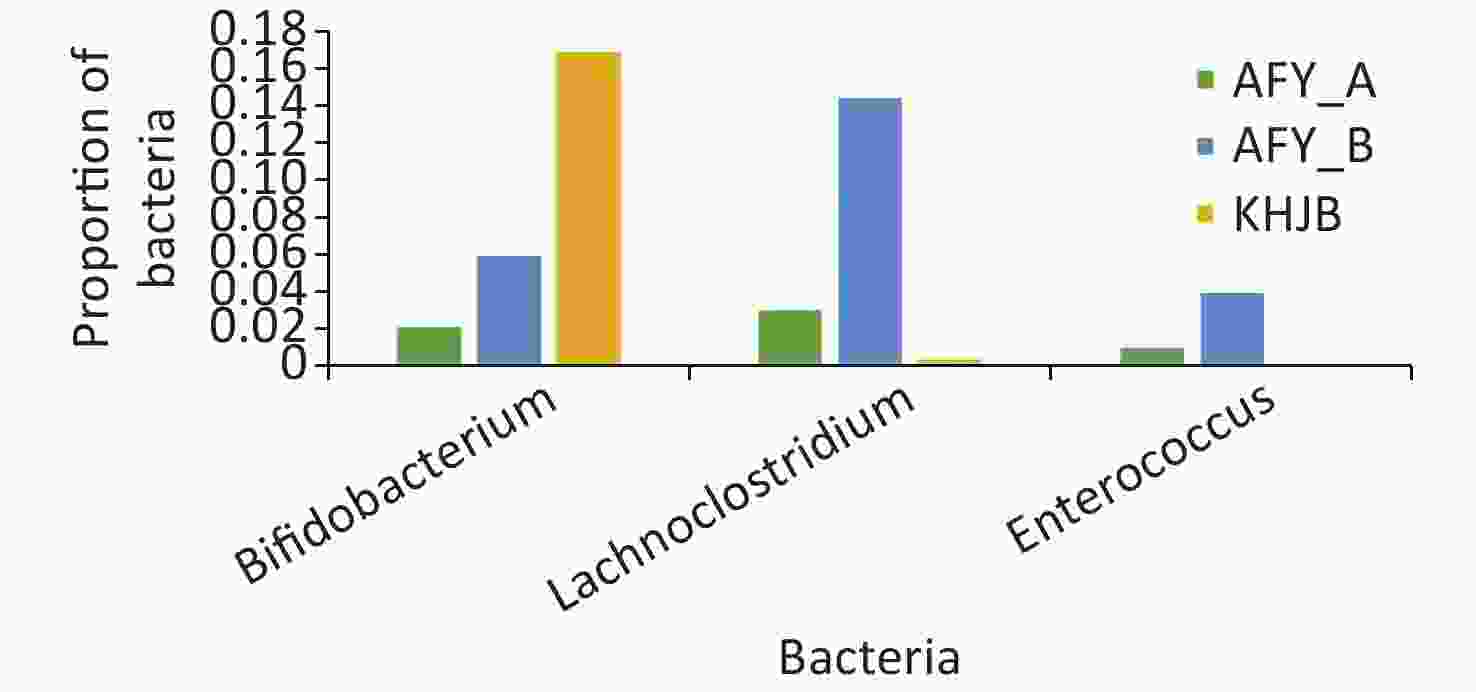
Figure 9. Bifidobacterium, Lactobacillus, and Enterococcus in probiotic (AFY) and healthy control groups (KHJB).
To analyze the influence of different treatment to intestinal flora, the changes in proportions of bacteria in each individual were analyzed at genus level. Fourteen bacterial species in the general treatment group increased and 21 species decreased after treatment; 13 species in the probiotic treatment group were increased and 21 species decreased (Table 1).
Table 1. The bacteria of inter-individual flora changes after treatment in general treatment (AF) and probiotic treatment groups (AFY)
General treatment group (AF) Probiotics group (AFY) Decreased after treatment Increased after treatment Decreased after treatment Increased after treatment Ruminococcus gnavus Fusicatenibacter Faecalibacterium Blautia Anaerostipes Faecalibacterium Anaerostipes Streptococcus Enterococcus Subdoligranulum Butyricicoccus Hungatella Lachnoclostridium Roseburia Lachnospiraceae Lachnoclostridium Streptococcus Ruminococcaceae Roseburia Peptostreptococcaceae Flavonifractor Veillonella Ruminococcus torques Flavonifractor Hungatella Lachnospira Fusicatenibacter Ruminiclostridium Ruminococcus torques Lachnospiraceae Granulicatella Phascolarctobacterium Ruminiclostridium5 Eubacterium eligens Ochrobactrum Veillonella Sellimonas ChristensenellaceaeR-7 Escherichia-Shigella Micrococcaceae Parabacteroides Ruminiclostridium Parasutterella Actinomyces Parasutterella LachnospiraceaeND3007 Pseudomonas Haemophilus Akkermansia Romboutsia Akkermansia Halomonas Bifidobacterium Pseudomonas Bacteroides Bosea Sellimonas Haemophilus Christensenellaceae Phyllobacterium Ruminiclostridium Ochrobactrum Lachnospiraceae Actinomyces Romboutsia Micrococcaceae Bosea Bacteroides Haemophilus -
The intestinal microecosystem is composed of billions of microorganisms which maintain a dynamic physiological balance and promote host immunity, metabolism, energy balance, and neural development [10,11]. Many studies have reported that the intestinal flora significantly alters after respiratory tract infections[12-14]. A study of 11 children (4–5 years) with CAP showed that gut the microbiome had increased for Escherichia/Shigella, Bifidobacterium, Streptococcus, and Psychrobacter abundance and decreased for Faecalibacterium, Bacteroides, Lachnospiraceae, and Ruminococcus abundance when compared with matched healthy controls [12]. Children with pulmonary tuberculosis had reduced intestinal microbial diversity, with an enrichment of pro-inflammatory Prevotella and the opportunistic pathogen Enterococcus, and decreased Ruminococcaceae, Bifidobacteriaceae, and Faecalibacterium prausnitzii probiotics when compared with healthy peers [13]. Mice with streptococcus pneumoniae-induced pneumonia had lower gut bacterial community diversity (lower phylogenetic diversity and Shannon indices) [14]. The number of intestinal probiotics in Avian influenza A (H7N9)-infected patients decreased while pathogens increased, thereby inducing intestinal injury and mucosal immune dysfunction [15]. Previous studies identified intestinal microbiota as a protective mediator during pneumococcal pneumonia, which enhanced primary alveolar macrophage function [16]. In our study, OTU’s, and Shannon and Simpson indices were lower in the general treatment group when compared with the healthy control group (P < 0.05). OTU’s and the Chao1 index in the probiotic group were lower than in the healthy control group (P < 0.05) and suggested that intestinal flora abundance and diversity in children with MPP were lower, and that intestinal flora community structures had changed when compared with healthy children, suggesting intestinal flora disorders occurred in children with MPP. Due to their drug actions and low side effects, macrolide antibiotics are the first treatment choice for children with MPP [1]. Previous studies reported that macrolides reduced intestinal flora richness in these children, significantly reducing the proportion of Bifidobacteria and Lactobacillus and significantly increasing the proportion of Proteobacteria, such as E. coli [17] and suggesting these antibiotics affected the intestinal microecology of children with MPP. Therefore, intestinal flora disorders in these children are not only caused by the condition but also by the therapy itself.
Healthy intestinal flora exhibits a high diversity, where Firmicutes and Bacteroidetes are dominant flora. Previous studies reported that the proportion of Firmicutes in the stool of children with sepsis, and patients with severe pneumonia, was significantly lower in normal control groups [18,19]. In our study, the highest relative abundant bacteria among groups were Firmicutes, but differences were not statistically significant. We hypothesized this was related to the small number of specimens and the condition of the children; therefore, further research on the fecal and intestinal flora of children with severe MPP is warranted. Actinobacteria is one of the main bacteria living in the intestines of healthy humans, and together with Bacteroidetes and Fusobacteria, they cover most obligate anaerobe bacteria and have a dominant position in the hypoxic environment of the colon, with key physiological roles [20,21]. We showed that at the phylum level, the proportion of Actinomycetes in second stool samples in the general treatment group was lower than in healthy controls. The proportion of Bifidobacteria in second stool samples of the generic treatment group was lower than in healthy controls and suggested that Actinomycetes were more strongly affected over a prolonged disease course. After the probiotic group received probiotics, differences within the group decreased and the Simpson diversity also decreased, but the proportion of Actinobacteria, Bifidobacteria, and Akkermansia decreased when compared with the healthy controls and suggested that probiotics improved but did not completely recover the intestinal flora disorder in children with MPP in the short term. Bifidobacterium is the dominant symbiotic bacterium in the colon microbiome, accounting for 25% of culturable fecal bacteria in adults and 80% in infants, and is widely clinically studied[22]. Studies have shown that infant Bifidobacteria, alone or in combination with other bacteria, specifically relieve different irritable bowel syndrome symptoms and reduce the incidence and severity of necrotizing enterocolitis in very-low-birth-weight infants [23,24]. Studies have also reported that short-term use of Clostridium butyricum plus Bifidobacterium infantile preparations effectively prevented antibiotic-associated diarrhea in hospitalized children receiving azithromycin treatment for MPP, and that the probiotic mixture partially reconstructed intestinal microbiota and restored bacterial diversity [25]. Probiotics could increase the proportion of beneficial bacteria such as Bifidobacteria and Faecalibacterium prausnitzii in children after adjuvant therapy and reduce opportunistic pathogens such as Enterococcus [26]. Short-chain fatty acids such as butyric acid in feces are significantly increased and appear to stabilize blood glucose levels, effectively improving immune indicators, and reducing the chance of secondary infections in children [26,27]. In our study, the proportion of Escherichia-Shigella in stool specimens in the probiotic group decreased after treatment, and the proportion of Escherichia-Shigella and Subdoligranulum decreased when compared with healthy controls. Enterococcus, Lachnoclostridium, Roseburia, and Erysipelatoclostridium were increased when compared with healthy controls. Roseburia produces butyric acid and is a key bacteria involved in dietary fiber xylan degradation in the human intestinal tract. Our results suggest that probiotics improve beneficial bacteria production in the intestinal flora of children with MPP and reduce pathogens such as Escherichia-Shigella.
-
This was a preliminary study of intestinal flora in children with MPP; however, some limitations were identified. Firstly, we only observed intestinal flora in patients with ordinary MPP, numbers were small, and the sampling area was limited. Secondly, we did not investigate the influence of cytokines and intestinal function on intestinal flora differences in children with MPP. Therefore, our report is preliminary in nature; further studies are required to compare changes in stool flora in children with MPP in different conditions, and explore relationships between MP infection and intestinal flora, and possible underlying mechanisms should be explored.
In conclusion, intestinal flora disorders occur in children with MPP. Such changes were manifested by decreased flora abundance and diversity and changes in community structures. The proportion of beneficial Bifidobacteria was decreased, while the proportion of pathogenic Enterococcus and C. erysipelis was increased. However, probiotic supplementation improved intestinal flora. In future studies, fecal flora in children with MPP must be investigated to elucidate possible immune mechanisms between intestinal flora and the condition. Such studies could identify significant therapies for treating sick children with MP infections.
-
The authors declare none.
doi: 10.3967/bes2022.070
Using 16S rDNA Sequencing Technology to Preliminarily Analyze Intestinal Flora in Children with Mycoplasma pneumoniae Pneumonia
-
Abstract:
Objective We investigated changes in the intestinal flora of children with Mycoplasma pneumoniae pneumonia (MPP). Methods Between September 2019 and November 2019, stool samples from 14 children with MPP from The Fourth Hospital of Baotou city, Inner Mongolia Autonomous Region, were collected and divided into general treatment (AF) and probiotic (AFY) groups, according to the treatment of “combined Bifidobacterium, Lactobacillus, Enterococcus, and Bacillus cereus tablets live”. High-throughput 16S rDNA sequencing was used to identify intestinal flora. Results Intestinal flora abundance and diversity in children with MPP were decreased. Both Shannon and Simpson indices were lower in the AF group when compared with healthy controls (P < 0.05). When compared with healthy controls, the proportion of Enterorhabdus was lower in the AF group, while the proportion of Lachnoclostridium was higher (P < 0.05). The proportion of Bifidobacteria and Akkermansia was lower in the AFY group but Enterococcus, Lachnoclostridium, Roseburia, and Erysipelatoclostridium proportions were higher. The proportion of Escherichia coli–Shigella in the AFY group after treatment was decreased (P < 0.05). Conclusions The intestinal flora of children with MPP is disturbed, manifested as decreased abundance and diversity, and decreased Bifidobacteria. Our probiotic mixture partly improved intestinal flora disorders. -
Figure 1. Intestinal flora dilution curve. AF, general treatment group; AFY, probiotic group; and KHJB, healthy control group.
Figure 2. Comparison of α-diversity among groups. AF, general treatment group; AF_A, the first stool sample; AF_B, the second stool sample; AFY, probiotic group; AFY_A, the first stool sample; AFY_B, the second stool sample; KHJB, healthy control group. The intragroup differences of Shannon and Simpson index increased after MP infection and reduced after treatment in AFY group.
Figure 3. Principal coordinate analysis (PCoA) plots of individual fecal microbiota based on weighted UniFrac (A) and unweighted UniFrac distances (B). AF, general treatment group; AFY, probiotic group; KHJB, healthy control group.
Figure 4. UPGMA clustering tree analysis. The bacterial community structures in AFY group are tending to be clustered together after treatment; While similarity in bacterial community structures were observed pre- and post-treatment in AF group.
Figure 7. The top 30 different operational taxonomic units (OTUs) in bacterial communities. The graph compares the average proportion of different bacteria in each group and indicates overall changes in bacterial communities. The y-axis represents percentages. On the whole, bacteria were sorted according to the proportion and size of groups. In this figure, they were sorted according to bacteria in the control group.
Figure 8. The top 31–60 different operational taxonomic units (OTUs) in bacterial communities. The graph compares the average proportion of different bacteria in each group and indicates overall changes in bacterial communities. The y-axis represents percentages.
Figure 9. Bifidobacterium, Lactobacillus, and Enterococcus in probiotic (AFY) and healthy control groups (KHJB).
Table 1. The bacteria of inter-individual flora changes after treatment in general treatment (AF) and probiotic treatment groups (AFY)
General treatment group (AF) Probiotics group (AFY) Decreased after treatment Increased after treatment Decreased after treatment Increased after treatment Ruminococcus gnavus Fusicatenibacter Faecalibacterium Blautia Anaerostipes Faecalibacterium Anaerostipes Streptococcus Enterococcus Subdoligranulum Butyricicoccus Hungatella Lachnoclostridium Roseburia Lachnospiraceae Lachnoclostridium Streptococcus Ruminococcaceae Roseburia Peptostreptococcaceae Flavonifractor Veillonella Ruminococcus torques Flavonifractor Hungatella Lachnospira Fusicatenibacter Ruminiclostridium Ruminococcus torques Lachnospiraceae Granulicatella Phascolarctobacterium Ruminiclostridium5 Eubacterium eligens Ochrobactrum Veillonella Sellimonas ChristensenellaceaeR-7 Escherichia-Shigella Micrococcaceae Parabacteroides Ruminiclostridium Parasutterella Actinomyces Parasutterella LachnospiraceaeND3007 Pseudomonas Haemophilus Akkermansia Romboutsia Akkermansia Halomonas Bifidobacterium Pseudomonas Bacteroides Bosea Sellimonas Haemophilus Christensenellaceae Phyllobacterium Ruminiclostridium Ochrobactrum Lachnospiraceae Actinomyces Romboutsia Micrococcaceae Bosea Bacteroides Haemophilus  下载: 导出CSV
-
[1] Respiratory Branch of Chinese Pediatric Society of Chinese Medical Association, Editorial Board of Chinese Journal of Applied Clinical Pediatrics. Expert consensus on diagnosis and treatment of Mycoplasma pneumoniae pneumonia in children (2015). Chin J Appl Clin Pediatr, 2015; 30, 1304−8. (In Chinese [2] Principi N, Esposito S, Blasi F, et al. Role of Mycoplasma pneumoniae and Chlamydia pneumoniae in children with community-acquired lower respiratory tract infections. Clin Infect Dis, 2001; 32, 1281−9. doi: 10.1086/319981 [3] Brown RL, Sequeira RP, Clarke TB. The microbiota protects against respiratory infection via GM-CSF signaling. Nat Commun, 2017; 8, 1512. doi: 10.1038/s41467-017-01803-x [4] Zeng WW, Yu L, Ding WY, et al. Antibiotic-induced gut microbiota dysbiosis aggravates Mycoplasma pneumoniae infection. Chin J Microbiol Immunol, 2020; 40, 68−73. (In Chinese [5] Expert Committee on Rational Use of Medicines for Children Pharmaceutical Group, National Health and Family Planning Commission. Expert consensus on laboratory diagnostics and clinical practice of Mycoplasma pneumoniae infection in children in China. Chin J Pediatr, 2020; 58, 366−73. (In Chinese [6] Dou HW, Tian XJ, Xin DL, et al. Mycoplasma pneumoniae macrolide resistance and MLVA typing in children in Beijing, China, in 2016: is it relevant?. Biomed Environ Sci, 2020; 33, 916−24. (In Chinese [7] Magoč T, Salzberg SL. FLASH: fast length adjustment of short reads to improve genome assemblies. Bioinformatics, 2011; 27, 2957−63. doi: 10.1093/bioinformatics/btr507 [8] Caporaso JG, Kuczynski J, Stombaugh J, et al. QIIME allows analysis of high-throughput community sequencing data. Nat Methods, 2010; 7, 335−6. doi: 10.1038/nmeth.f.303 [9] Segata N, Izard J, Waldron L, et al. Metagenomic biomarker discovery and explanation. Genome Biol, 2011; 12, R60. doi: 10.1186/gb-2011-12-6-r60 [10] Dominguez-Bello MG, Blaser MJ, Ley RE, et al. Development of the human gastrointestinal microbiota and insights from high-throughput sequencing. Gastroenterology, 2011; 140, 1713−9. doi: 10.1053/j.gastro.2011.02.011 [11] Barko PC, McMichael MA, Swanson KS, et al. The gastrointestinal microbiome: a review. J Vet Intern Med, 2018; 32, 9−25. doi: 10.1111/jvim.14875 [12] Ren XM, Gamallat Y, Liu DJ, et al. The distribution characteristics of intestinal microbiota in children with community-acquired pneumonia under five Years of age. Microb Pathog, 2020; 142, 104062. doi: 10.1016/j.micpath.2020.104062 [13] Li WR, Zhu Y, Liao Q, et al. Characterization of gut microbiota in children with pulmonary tuberculosis. BMC Pediatr, 2019; 19, 445. doi: 10.1186/s12887-019-1782-2 [14] Feng JL, Dai WB, Zhang C, et al. Shen-ling-bai-zhu-san ameliorates inflammation and lung injury by increasing the gut microbiota in the murine model of Streptococcus pneumonia-induced pneumonia. BMC Complement Med Ther, 2020; 20, 159. doi: 10.1186/s12906-020-02958-9 [15] Qin N, Zheng BW, Yao J, et al. Influence of H7N9 virus infection and associated treatment on human gut microbiota. Sci Rep, 2015; 5, 14771. doi: 10.1038/srep14771 [16] Gauguet S, D'Ortona S, Ahnger-Pier K, et al. Intestinal microbiota of mice influences resistance to Staphylococcus aureus pneumonia. Infect Immun, 2015; 83, 4003−14. doi: 10.1128/IAI.00037-15 [17] McDonnell L, Gilkes A, Ashworth M, et al. Association between antibiotics and gut microbiome dysbiosis in children: systematic review and meta-analysis. Gut Microbes, 2021; 13, 1870402. doi: 10.1080/19490976.2020.1870402 [18] Zhang XY, Yang XJ, Zhang ZQ, et al. Analysis of intestinal patients’ flora changes with severe pneumonia based on 16SrDNA sequencing technology. Chin Crit Care Med, 2019; 31, 1479−84. (In Chinese [19] Wang Y, Yang ZW, Cheng YB, et al. Characteristics of gut microbiota in children with sepsis and influence of probiotic supplementation. Chin J Microbiol Immunol, 2021; 41, 440−7. (In Chinese [20] Tap J, Mondot S, Levenez F, et al. Towards the human intestinal microbiota phylogenetic core. Environ Microbiol, 2009; 11, 2574−84. doi: 10.1111/j.1462-2920.2009.01982.x [21] Mariat D, Firmesse O, Levenez F, et al. The Firmicutes/Bacteroidetes ratio of the human microbiota changes with age. BMC Microbiol, 2009; 9, 123. doi: 10.1186/1471-2180-9-123 [22] O'Callaghan A, Van Sinderen D. Bifidobacteria and their role as members of the human gut microbiota. Front Microbiol, 2016; 7, 925. [23] Whorwell PJ, Altringer L, Morel J, et al. Efficacy of an encapsulated probiotic Bifidobacterium infantis 35624 in women with irritable bowel syndrome. Am J Gastroenterol, 2006; 101, 1581−90. doi: 10.1111/j.1572-0241.2006.00734.x [24] Lin HC, Su BH, Chen AC, et al. Oral probiotics reduce the incidence and severity of necrotizing enterocolitis in very low birth weight infants. Pediatrics, 2005; 115, 1−4. doi: 10.1542/peds.2004-1463 [25] Ling ZX, Liu X, Guo S, et al. Role of probiotics in Mycoplasma pneumoniae pneumonia in children: a short-term pilot project. Front Microbiol, 2019; 9, 3261. doi: 10.3389/fmicb.2018.03261 [26] Wang Y, Yang ZW, Shi CS, et al. The effects of probiotics on the stabilization of blood glucose and the mechanism in children with severe infectious pneumonia. Parent Enteral Nutr, 2017; 24, 159−63. (In Chinese [27] Wang Y, Gao L, Zhang YH, et al. Efficacy of probiotic therapy in full-term infants with critical illness. Asia Pac J Clin Nutr, 2014; 23, 575−80. -

 点击查看大图
计量
- 文章访问数: 1082
- HTML全文浏览量: 472
- PDF下载量: 144
- 被引次数: 0

 Quick Links