

 下载:
下载:

-
The liver is an essential organ of the human body, with functions of synthesis and metabolism. The literature provides several studies on the three-dimensional (3D) culture of liver-like tissue in vitro [1-3]. The 3D hepatocyte culture and organ chips in vitro can be used for liver development research, to treat liver diseases [4], and to conduct liver disease treatment drug screening models [5-6]. Additionally, they can be used for research on the liver metabolism of drugs, heavy metals, organic pollutants, and the study on toxicity screening assays [7-8].
Several 3D cell culture methods include agitation-based approaches, hanging drop, matrices, and scaffolds [9]. 3D cell culture scaffold materials have similar characteristics to extracellular matrix (ECM), which better simulates the microenvironment of somatic cells [10]. 3D culture model is a good platform for the propagation of viruses that are difficult to culture using traditional monolayer cell and animal models [11]. Therefore, many studies exist in the literature on using scaffold materials to construct different 3D tissues. Presently, the scaffold materials that 3D cell culture mainly relies on include natural materials represented by ECM components such as chitin, hydrogel [12], hyaluronic acid [13], and polyester-based degradable polymers. The polyester-based degradable polymers include polylactic acid, polyglycolic acid, polylactic ethanolamine, peptide-functionalized poly (ethylene glycol) [14], polylactic acid/hydroxylactic acid copolymer, and other synthetic materials [15-16].
VitroGel is a readily available, non-exogenous, adjustable hydrogel system that simulates the endogenous physiological microenvironment for in vitro culture of various cell types. The hydrogel system is stable at room temperature, neutral pH, transparent, permeable, compatible with different imaging systems, convenient, and straightforward for cell recovery. It can also be injected into animals for in vivo research. The concentration of the hydrogel solution and the concentration of seed cells can be adjusted to form a hydrogel system of different strengths for the 3D culture of different cells. VitroGel keeps cell monolayer culture, 3D cultures, and in vivo research under the same platform system, facilitating related research.
HepG2 cells have commonly been used in previous literature on evaluating drug metabolism and toxicity [17-18]. The inoculation concentration of cells and culture time is different in most 3D culture studies in the literature. Mariko [19] seeded HepG2 cells at a density of 5.0 × 10⁴ cells/well in a 96-well and cultured them for 7 days. Kazuaki [20] showed that 1 × 10⁴ cells were seeded in one well and cultured for 3, 6, or 12 days. However, Xu [21] and Di [22] showed that 105 cells/well inoculation concentrations were seeded, and cells were respectively cultured for 4 and 15 days. Optimal culture conditions play a decisive role in the success of a 3D culture. Most research in the literature directly uses one kind of culture condition for 3D culture. Similarly, only a few studies focus on systematic comparison or optimization of culture conditions.
The optimum process parameters are determined using response surface methodology (RSM): a practical and powerful tool for optimizing experimental conditions. RSM is used to study the effects of several factors influencing a response by simultaneously varying them in a limited number of experiments [23-24]. This study uses single-factor experiments to delineate the role of the above factors (the inoculation concentration of HepG2s on the scaffold material, the culture time, and the hardness of the scaffold material). Then, a three-factor–three-level Box–Behnken design with 17 separate runs was used to assess the effect of multifactorial conditions on the OD value of cell activity detection. Therefore, RSM was used to determine the optimal conditions for 3D culture. Cell proliferation, living/dead cell assay, and fluorescence staining were performed to evaluate the effect of the VitroGel system on HepG2 cell characteristics and integrity. Albumin secretion was used to determine the biological activity and effectiveness of 3D cultured HepG2s.
This study optimized the HepG2s 3D culture conditions based on the VitroGel system and constructed a 3D tissue of HepG2 in vitro, laying the foundation for future scientific research work such as liver metabolism of toxic substances, tumorigenesis, and drug screening. Furthermore, it provides a reference for the 3D cultivation of other cells. This research work will be conducive to proposing health guidance values for important pollutants and providing technical support for food-related policies.
-
HepG2 cells were obtained from the Stem Cell Bank of the Chinese Academy of Sciences. HepG2 cells were maintained in MEM (SH30024.01, HyClone) supplemented with 10% FBS (11011-8611, EVERY GREEN) and were cultured in an incubator at 37 °C containing 5% CO2. Cells were passaged by treatment with 0.25% trypsin/0.02% EDTA (T1320, Solarbio) when the cultures reached 80%–90%. Then, the cells needed were prepared for 3D cell culture.
-
A VitroGel 3D-RGD (TWG003, The Well Bioscience Inc., NJ, USA) was used for 3D cell culture. The VitroGel 3D-RGD hydrogel was prepared with VitroGel Dilution Solution (MS01-50, The Well Bioscience Inc.) at different ratios (v/v) after preheating to room temperature. Then, the diluted hydrogel solution was gently mixed with cell suspensions of 4:1 (v/v). Seventy-five microliters of the hydrogel–cell mixture were added to the 96-well microplate without introducing bubbles. The hydrogel–cell mixture was allowed to stabilize for 20 min at room temperature. The hydrogel–cell mixture was covered by a 75 μL cell culture medium and cultured in an incubator at 37 °C containing 5% CO2. The cell culture medium was exchanged every day by half volume. Additionally, different sizes of the hydrogel–cell mixture can be made when needed: the volume ratio of the diluted hydrogel solution to the cell suspension should be 4:1 (v/v).
-
CCK-8 assay was used to determine the number of viable cells in 3D cell cultures. The CCK-8 Assay Kit (CK04) was obtained from Dojindo Chemical Technology Co., Ltd. The growth medium was removed after incubation for a certain period, and the 3D cell cultures were washed with PBS. One hundred microliters of a serum-free medium containing 10% CCK-8 were applied to the wells for 2 h. Then, the absorbance was measured at 450 nm using a SpectraMax i3x Multi-Mode Detection plate-reader (Molecular Devices, LLC., San Jose, CA, USA).
-
The independent factors affecting 3D cell culture include the concentration of inoculated cells, culture time, and hydrogel dilution degree. Three independent factor tests were conducted to investigate their effects on 3D cell culture. Effects of the concentration of inoculated cells were determined by using the hydrogel dilution of 1:2 and the final concentration of the cells of 1 × 10⁶/mL, 5 × 10⁵/mL, 1 × 10⁵/mL, 5 × 10⁴/mL, and 1 × 10⁴/mL, respectively. The cell activity was measured at 1, 4, 7, 10, and 13 days after culture. Effects of the culture time were determined by culturing cells for 11 days with a final concentration of 1 × 10⁵/mL and a hydrogel dilution degree of 1:2, and the cell activity was detected every day. Effects of the hydrogel dilution degree were determined by using the final concentration of 1 × 10⁵/mL and the hydrogel dilution degree of 1:0, 1:1, 1:2, 1:3, 1:4, and 1:5, respectively. The cell activity was measured at 1, 4, 7, 10, and 13 days after culture.
-
Box–Behnken design was utilized for the condition optimization of the 3D HepG2 culture. The OD value of cell activity detection was chosen for the response surface value (Y). The factors affecting 3D cell culture were explored, including the concentration of inoculated cells (A), the culture time (B), and the hydrogel dilution degree (C). The RSM approach was used to determine the arrangement of independent variables and categorize them into three (low, center, and high) levels as mentioned above [25] (Table 1). Design-Expert 8 was used to design and analyze the experimental data. The parameters were summarized in a 17-run, triple-factor, and three-level experiment (Table 2). The response surface value (Y) was determined in three independent assays, and the mean values were used later for regression analysis.
Table 1. Experimental factors and respective levels of the 3D HepG2 culture used in the Box–Behnken design
Level A: the concentration of cells (105/mL) B: the culture time (days) C: the hydrogel dilution degree (1:n) −1 5 2 1 0 3 4 2 1 1 6 3 Table 2. Box–Behnken design offered to the 3D HepG2 culture
Run A: the
concentration
of cells (105/mL)B: the
culture time
(days)C: the
hydrogel
dilution
degree
(1:n)OD value
(mean ± SD)Predictive
value1 0 0 0 2.879 ± 0.049 2.86 2 1 −1 0 1.378 ± 0.030 1.34 3 1 0 −1 1.742 ± 0.139 1.78 4 0 −1 1 1.828 ± 0.154 1.81 5 1 1 0 2.133 ± 0.111 2.08 6 −1 −1 0 2.347 ± 0.145 2.40 7 0 0 0 2.871 ± 0.040 2.86 8 0 1 −1 2.331 ± 0.010 2.35 9 0 0 0 2.822 ± 0.079 2.86 10 0 1 1 2.865 ± 0.049 2.86 11 −1 0 1 2.863 ± 0.074 2.82 12 −1 1 0 2.873 ± 0.066 2.91 13 0 0 0 2.819 ± 0.020 2.86 14 1 0 1 1.935 ± 0.062 1.99 15 −1 0 −1 2.919 ± 0.014 2.86 16 0 −1 −1 2.153 ± 0.150 2.15 17 0 0 0 2.914 ± 0.023 2.86 -
To observe and characterize the growth state, morphology, and survival of 3D HepG2 culture, the hydrogel–cell mixtures were collected at different culture times and stained for the MitoBright LT Green/Hoechst 33342 (MT10 and H342, Dojindo Chemical Technology Co., Ltd.) and normal/necrotic cell detection kit (KGA501, KeyGEN BioTECH), respectively.
-
HepG2s were cultured in the VitroGel 3D-RGD under the optimum conditions. The culture medium supernatant was collected daily in a sterile centrifuge and stored at −80 °C. At the same time, it was compared with the 2D culture inoculated with the same number of HepG2s. The number of inoculated cells was 3.465 × 10⁴ per well. Human Albumin SimpleStep ELISA Kit (ab179887, abcam) was used to measure albumin content in the culture medium and determine the function of HepG2s in the hydrogel material.
-
Data are shown as mean ± standard deviation (SD) of at least three independent experiments. Then, the results were calculated, and graphs were obtained using Origin software (2019b). The results of RSM were analyzed using Design Expert Software (version 8.0) at a significance level of 0.05.
-
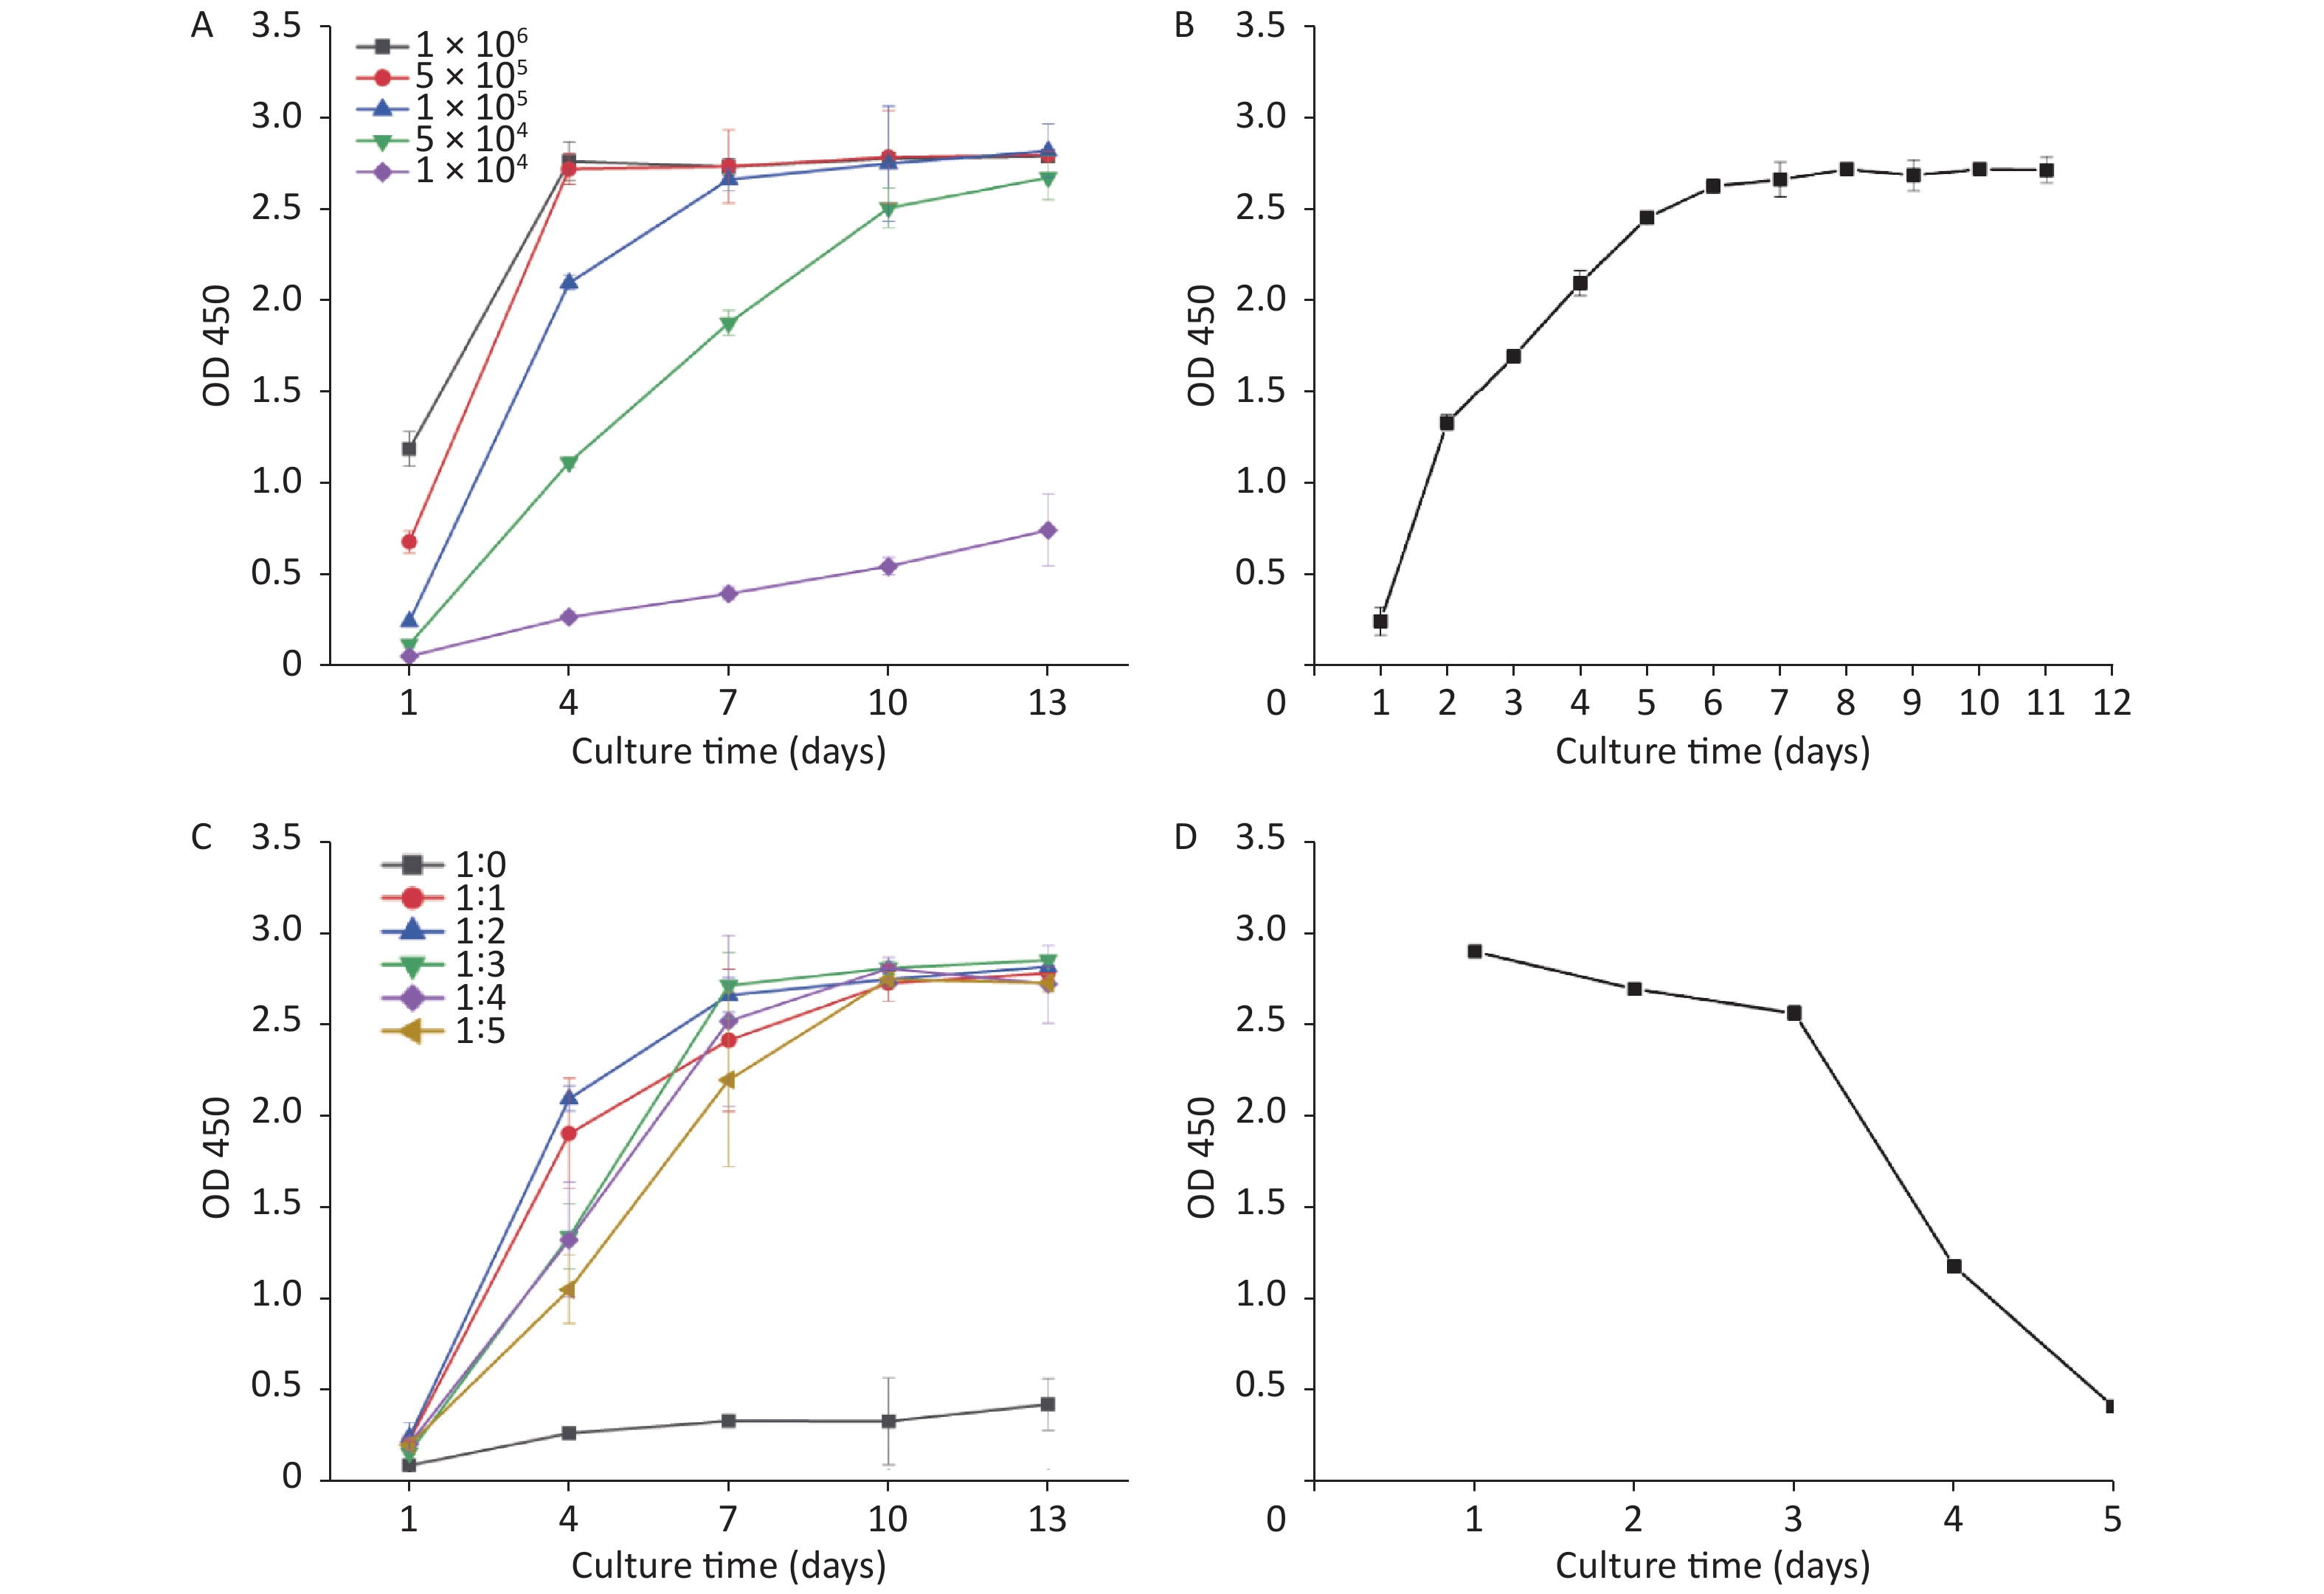
Factors such as the concentration of inoculated cells, the culture time, and the hydrogel dilution degree were considered influential in the 3D HepG2 culture. Figure 1 shows the effect of changing three independent factors on the 3D HepG2 culture. Figure 1B shows that as the culture time increased, the OD value of cell activity increased quickly in 2–6 days and then almost unchanged. Therefore, 2–6 days was rapid cell growth and selected the optimum range of the culture time. The growth rate and number of HepG2s were distinct using different concentration of inoculated cells and hydrogel dilution degrees. Figure 1A shows that the number of HepG2s increased quickly with higher magnitude when the concentration of inoculated cells was 1 × 10⁵/mL–5 × 105/mL. The OD value of cell activity increased quickly when the hydrogel dilution degree was 1:1–1:5, as shown in Figure 1C: At 4 days, the OD value was highest when the hydrogel dilution degree was 1:2. However, the OD value reached a peak at 7 days when the hydrogel degree dilution was 1:3. Therefore, 1:1–1:3 was selected to be the optimum range of the hydrogel dilution degree. After a comprehensive analysis, the process parameters’ range was the concentration of inoculated cells of 1 × 10⁵/mL–5 × 105/mL, the culture time of 2–6 days, and the hydrogel dilution degree of 1:1–1:3.
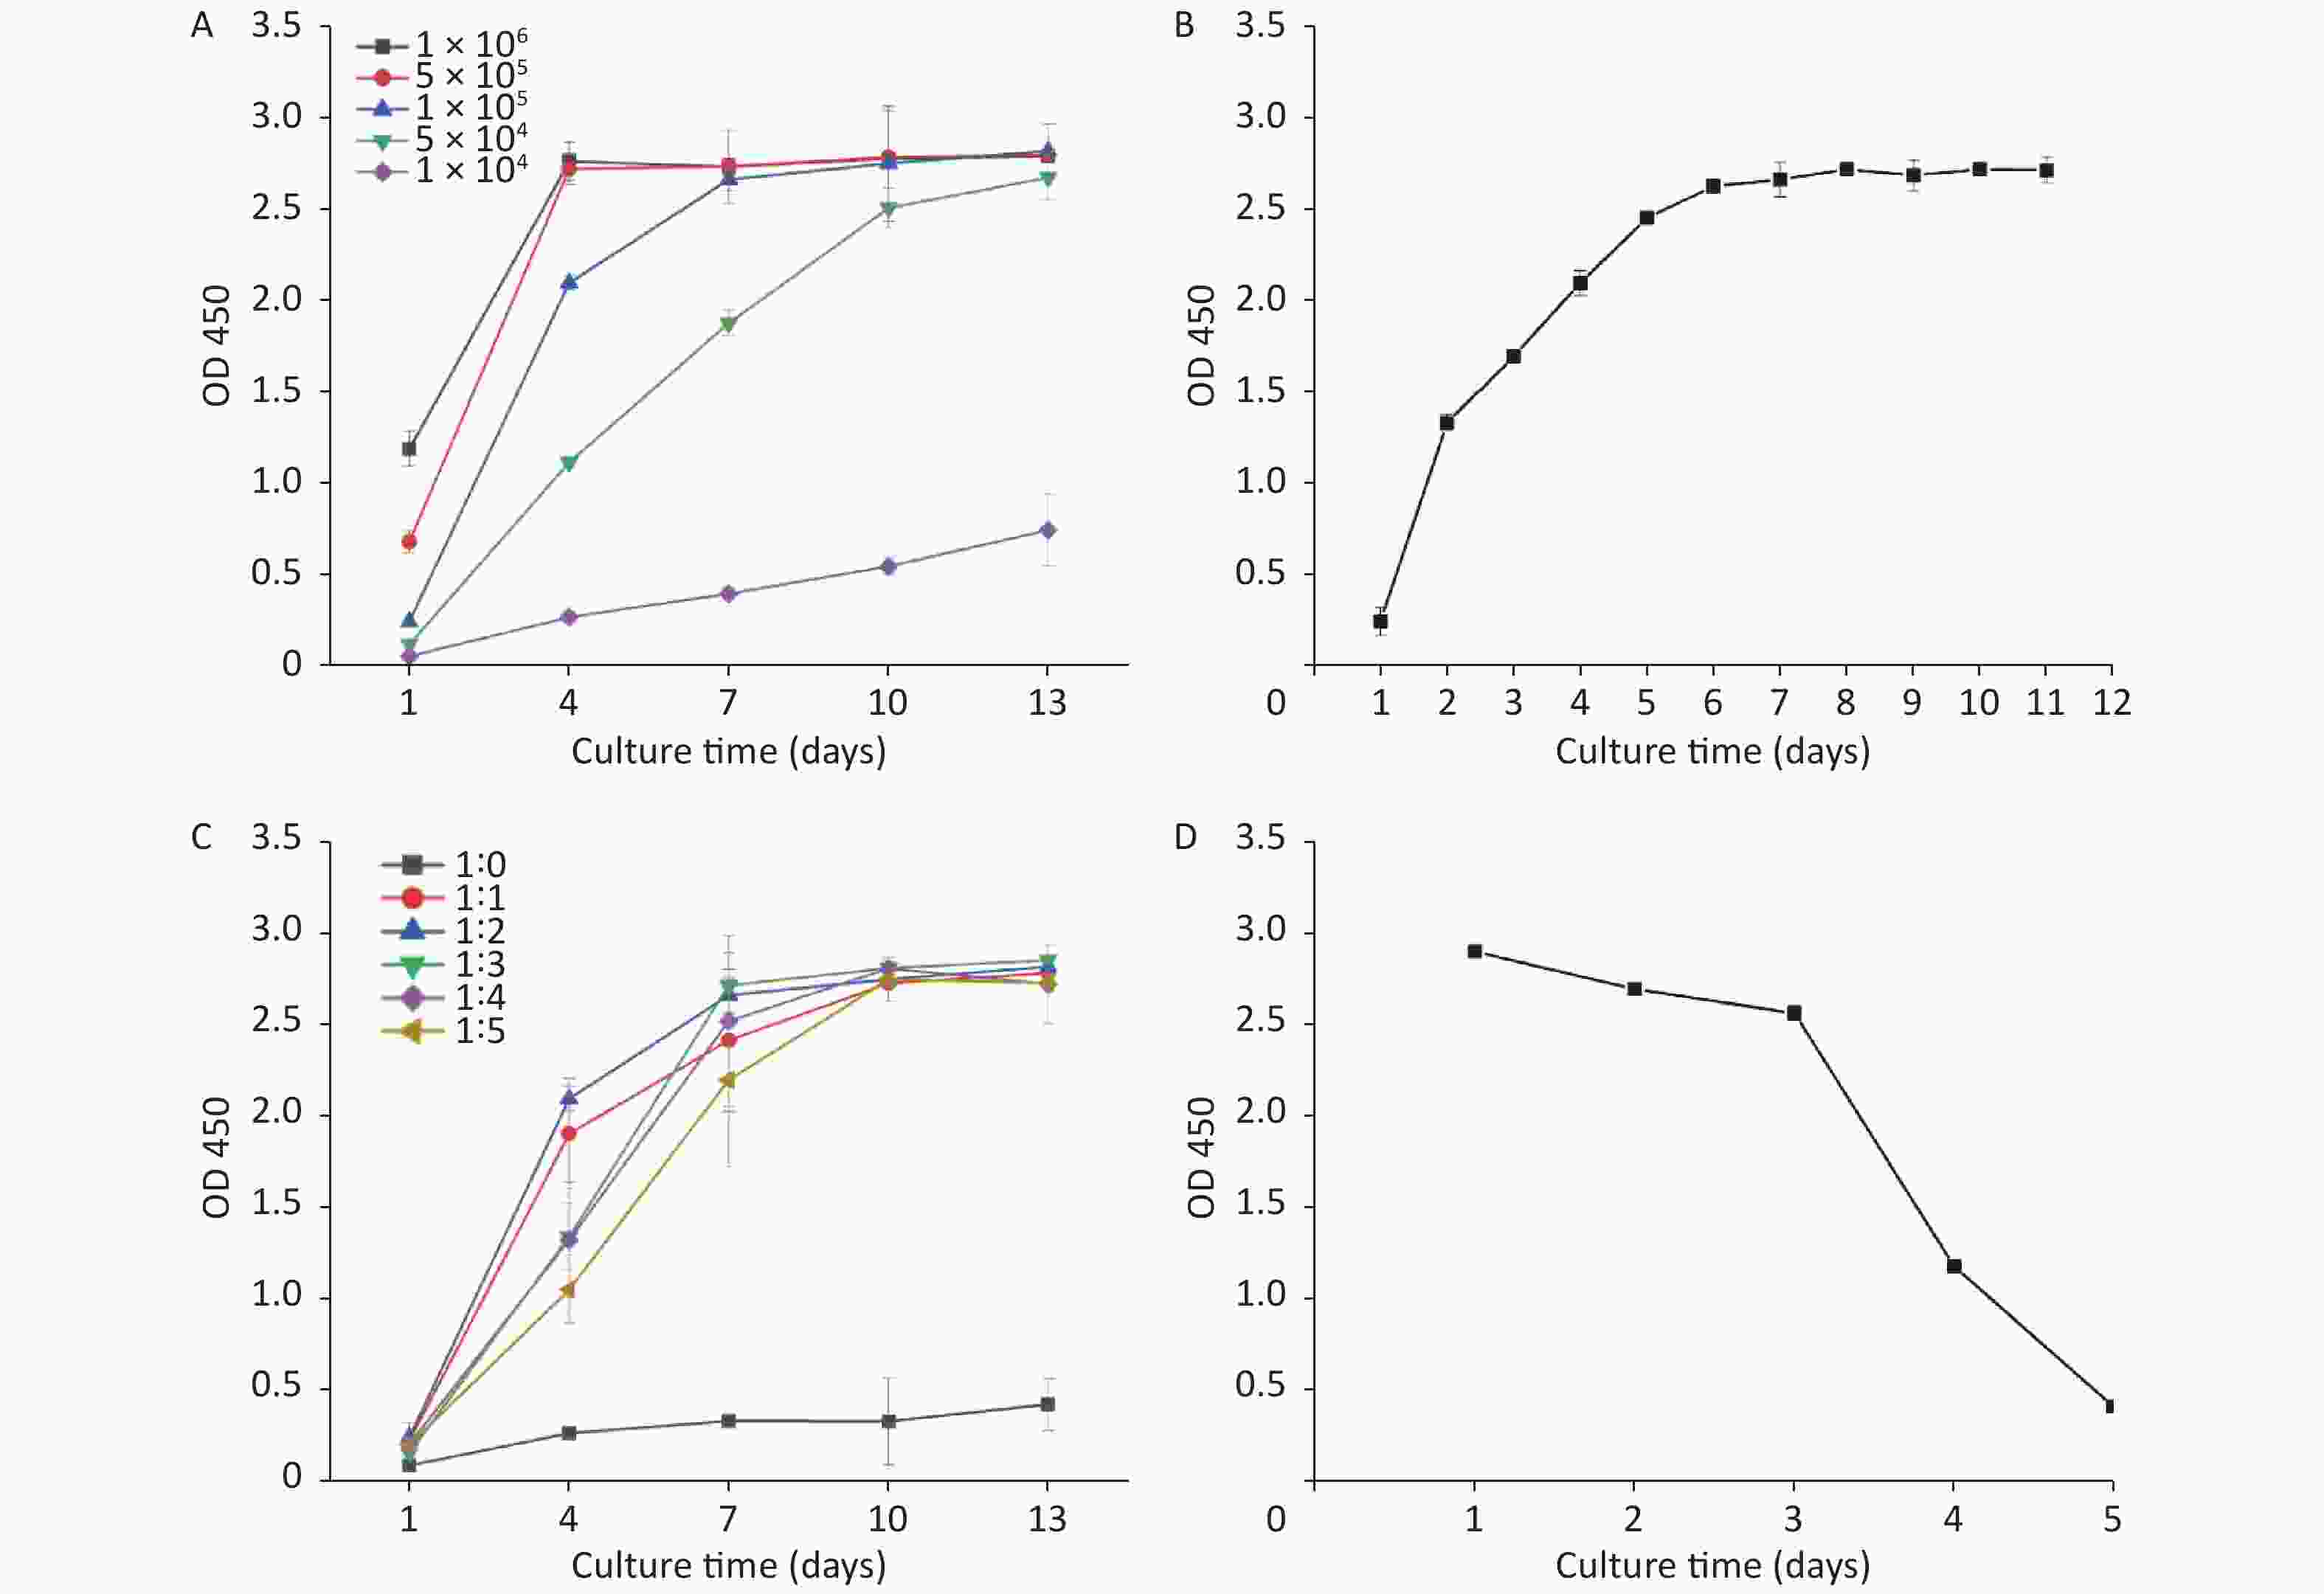
Figure 1. Effects of the concentration of inoculated cells, the culture time, and the hydrogel dilution degree on 3D HepG2 culture (A, different concentration of inoculated cells; B, different culture times; C, different hydrogel dilution degree; D, the growth curve of 2D HepG2 culture).
Additionally, HepG2 cells were conventionally 2D cultured in a 96-well microplate. Figure 1D shows the OD value of cell activity at different culture times: The OD value of cell activity decreased slowly in 1–3 days, and cells were close to death on the fifth day. Under the condition of the same number of cells seeded in the well plate, the cell activity of 3D HepG2 culture was significantly better than 2D culture and still good even at 11 days (Figure 1B).
-
To improve the activity and quantity of 3D HepG2 culture, the mentioned variables were optimized using the Box–Behnken design and explored in a 17-run parallel comparative experiment. The concentration of inoculated cells (5 × 10⁵/mL, 3 × 10⁵/mL, and 1 × 10⁵/mL), the culture time (2, 4, and 6 days), and the hydrogel dilution degree (1:1, 1:2, and 1:3) were regarded as the three independent variables. At the same time, the response value was the OD value of cell activity. Table 1 shows the process parameters and levels of the response surface design.
Design-Expert 8 was used to design and analyze the experimental data and obtain the quadratic equation. Table 2 shows the design program and results. The relationship of the response (Y, the OD value of cell activity) and the independent variables (A, the concentration of inoculated cells; B, the culture time; C, the hydrogel dilution degree ) can be expressed as follows:
$$\begin{aligned} {\rm{Y}} = \;&2.86 - 0.48{\rm{A}} + 0.31{\rm{B}} + 0.043{\rm{C}} + 0.057{\rm{AB}} \;+ \\&0.062{\rm{AC}} + 0.21{\rm{BC}} - 0.3{\rm{A}}^{2} -0.37{\rm{B}}^{2} -0.19{\rm{C}}^{2} \\[-10pt]\end{aligned} $$ (1) -
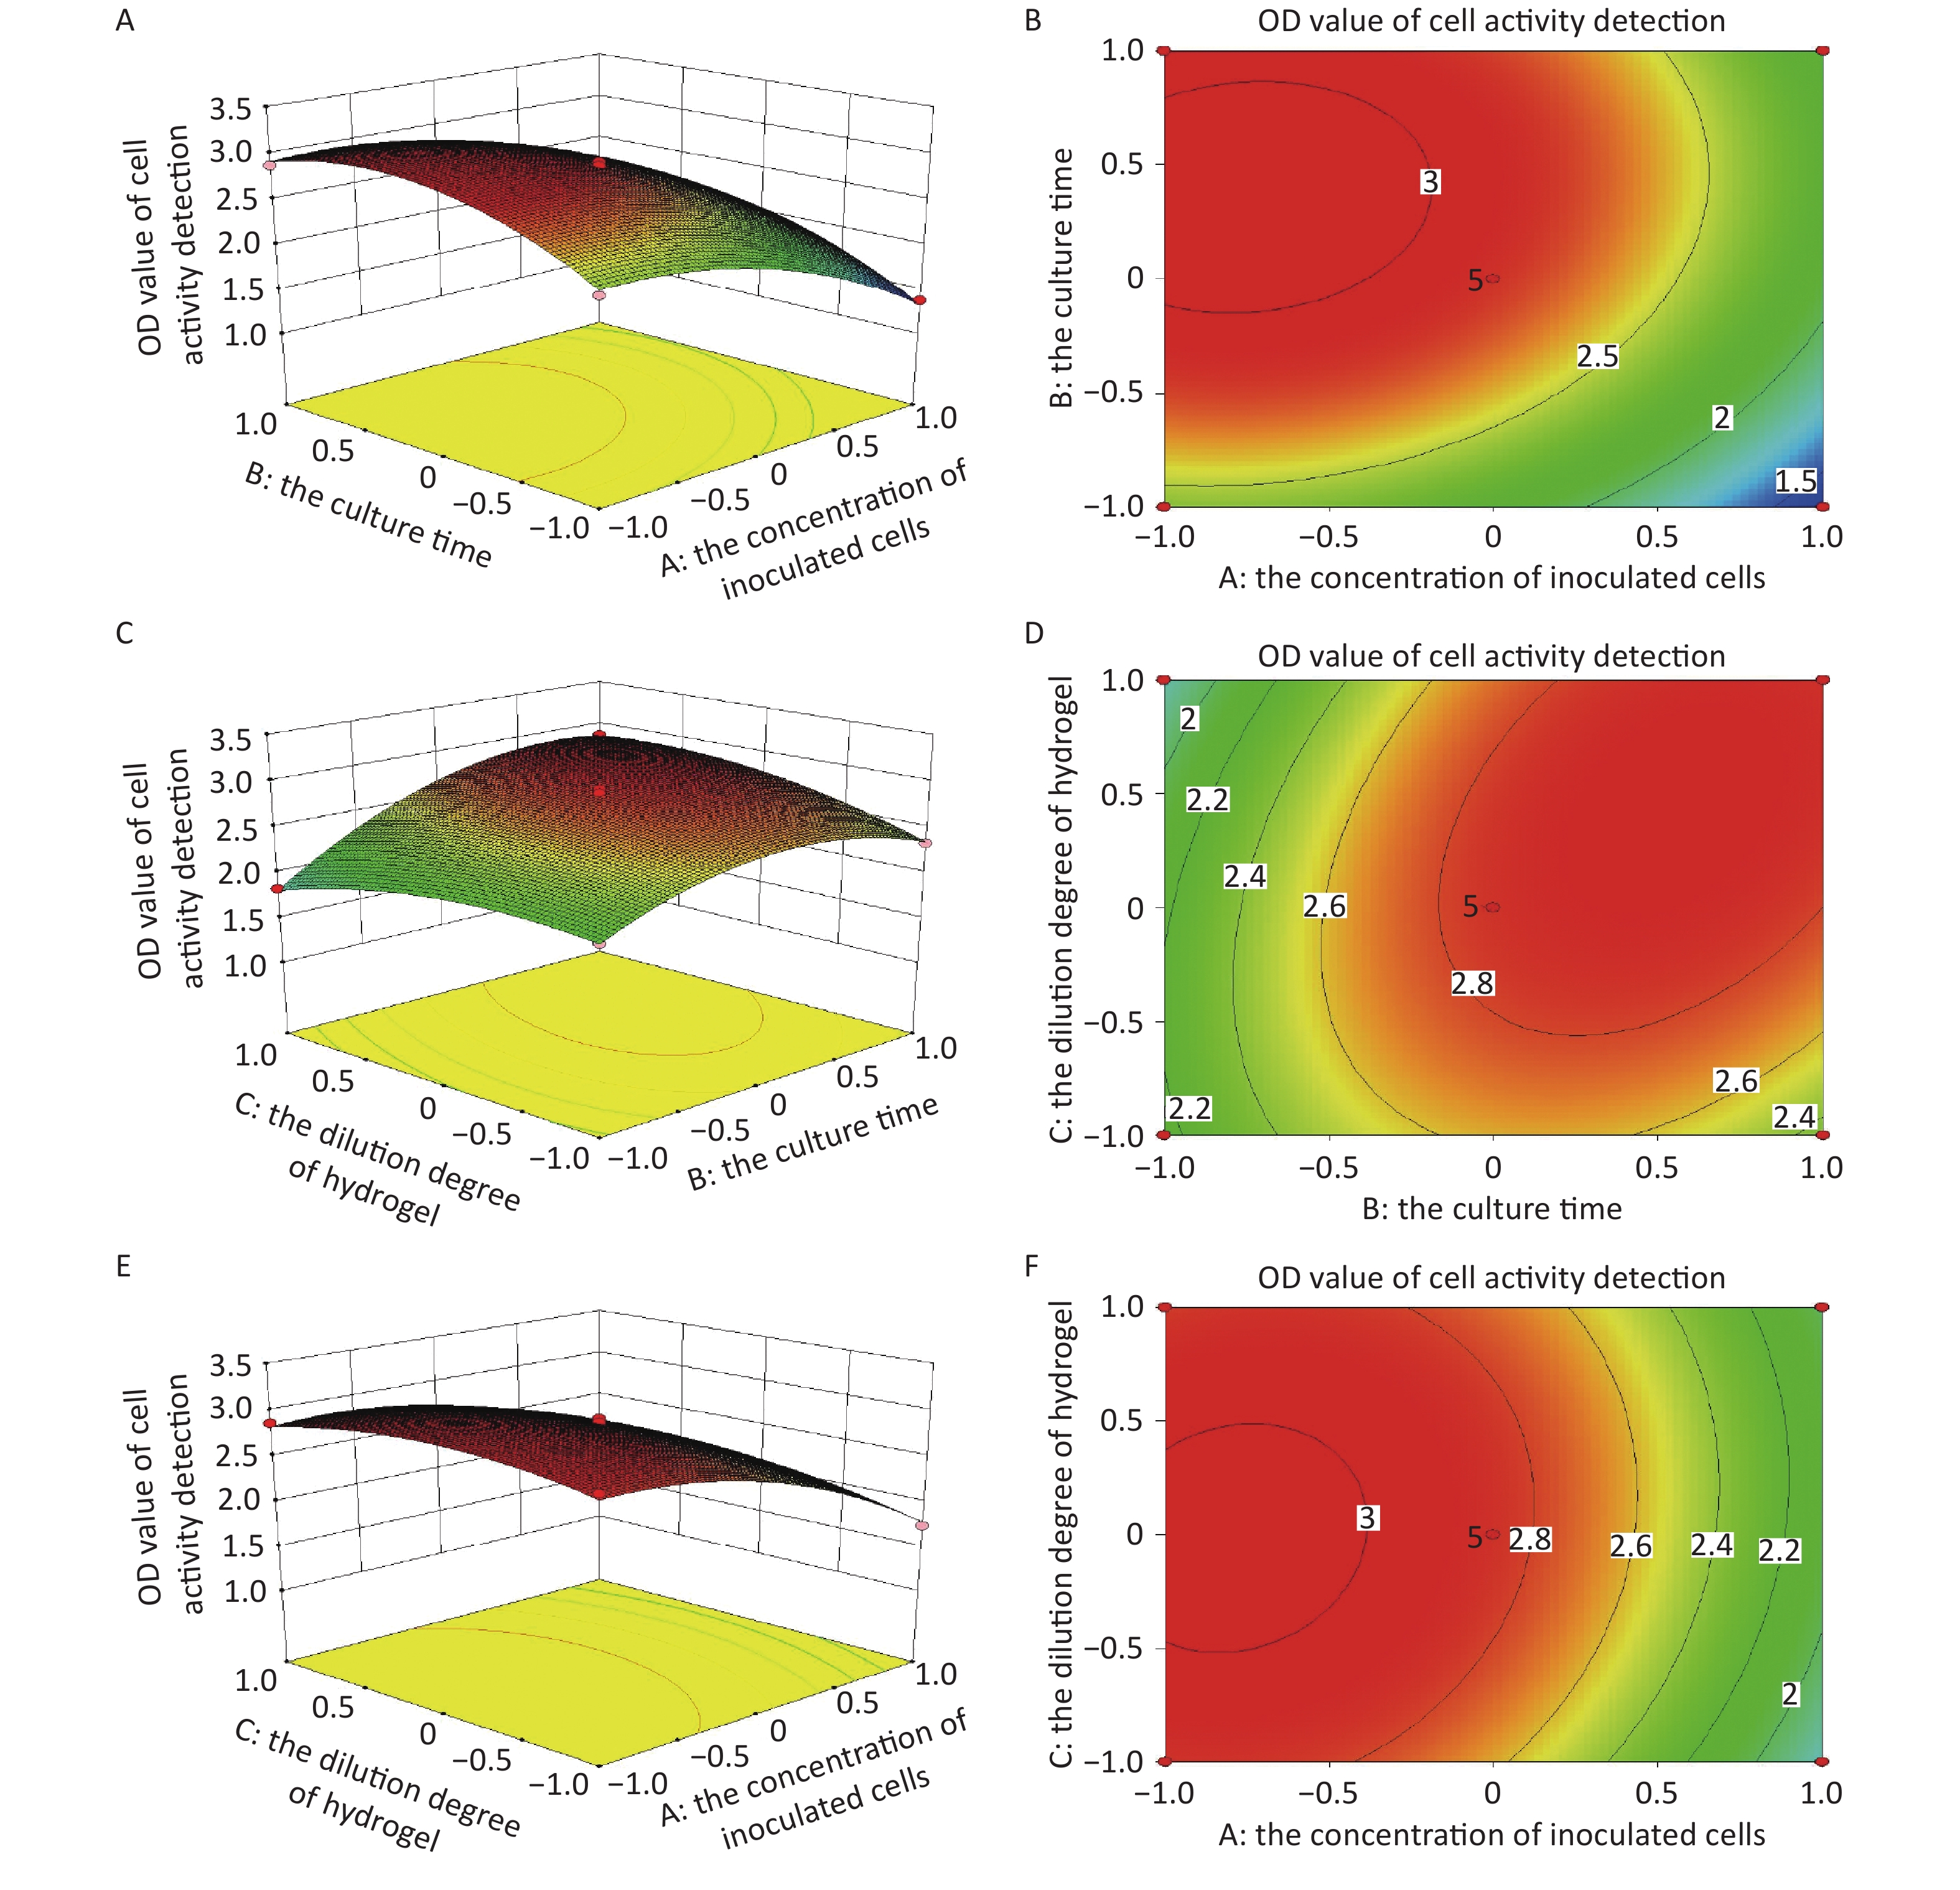
The ANOVA indicated that the quadratic regression model of the 3D HepG2s culture based on the VitroGel system was significant (F = 116.23, P < 0.0001; Table 3), lack of fit was not significant (F = 4.25, P = 0.0979 > 0.05), with a satisfactory determination coefficient (R2 = 0.9934). The P-values of A, B, A2, B2, C2, and BC were < 0.01, whereas the P-values of others were > 0.05, meaning that the linear variables (A and B) influenced the response extremely significantly, as shown in Table 3. The F and P-values in the ANOVA results showed the order that affected the 3D HepG2 culture: the concentration of cells, the culture time, and the hydrogel dilution degree. The concentration of cells had the greatest impact on the response value. The intensity of influence ranked as BC > AC > AB. Figure 2 shows the response surface plots and contour maps about the interaction effects on the yield of the response value. The ANOVA results confirm a satisfactory adjustment of the model and the experimental data, meaning that the model was successful, and the results are reliable, as shown in Table 3. Therefore, the model can analyze and predict 3D HepG2s culture based on the VitroGel system.
Table 3. Analysis of variance for response surface quadratic model of 3D HepG2 culture
Source model Sum of squares Degree of freedom Mean squares F-value P-value Significant Model 4.08 9 0.45 116.23 < 0.0001 ** A 1.82 1 1.82 466.02 < 0.0001 ** B 0.78 1 0.78 199.59 < 0.0001 ** C 0.0153 1 0.0153 3.84 0.091 N AB 0.013 1 0.013 3.36 0.1095 N AC 0.016 1 0.016 3.97 0.0865 N BC 0.18 1 0.18 47.28 0.0002 ** A2 0.39 1 0.39 99.65 < 0.0001 ** B2 0.59 1 0.59 151.25 < 0.0001 ** C2 0.16 1 0.16 39.94 0.0004 ** Residual 0.027 7 0.003902 Lack of fit 0.021 3 0.006932 4.25 0.0979 N Pure error 0.006518 4 0.00163 Total 4.11 16 Note. “**” Means that the effect is extremely significant (P < 0.01), N means that the effect is not significant (P > 0.05). 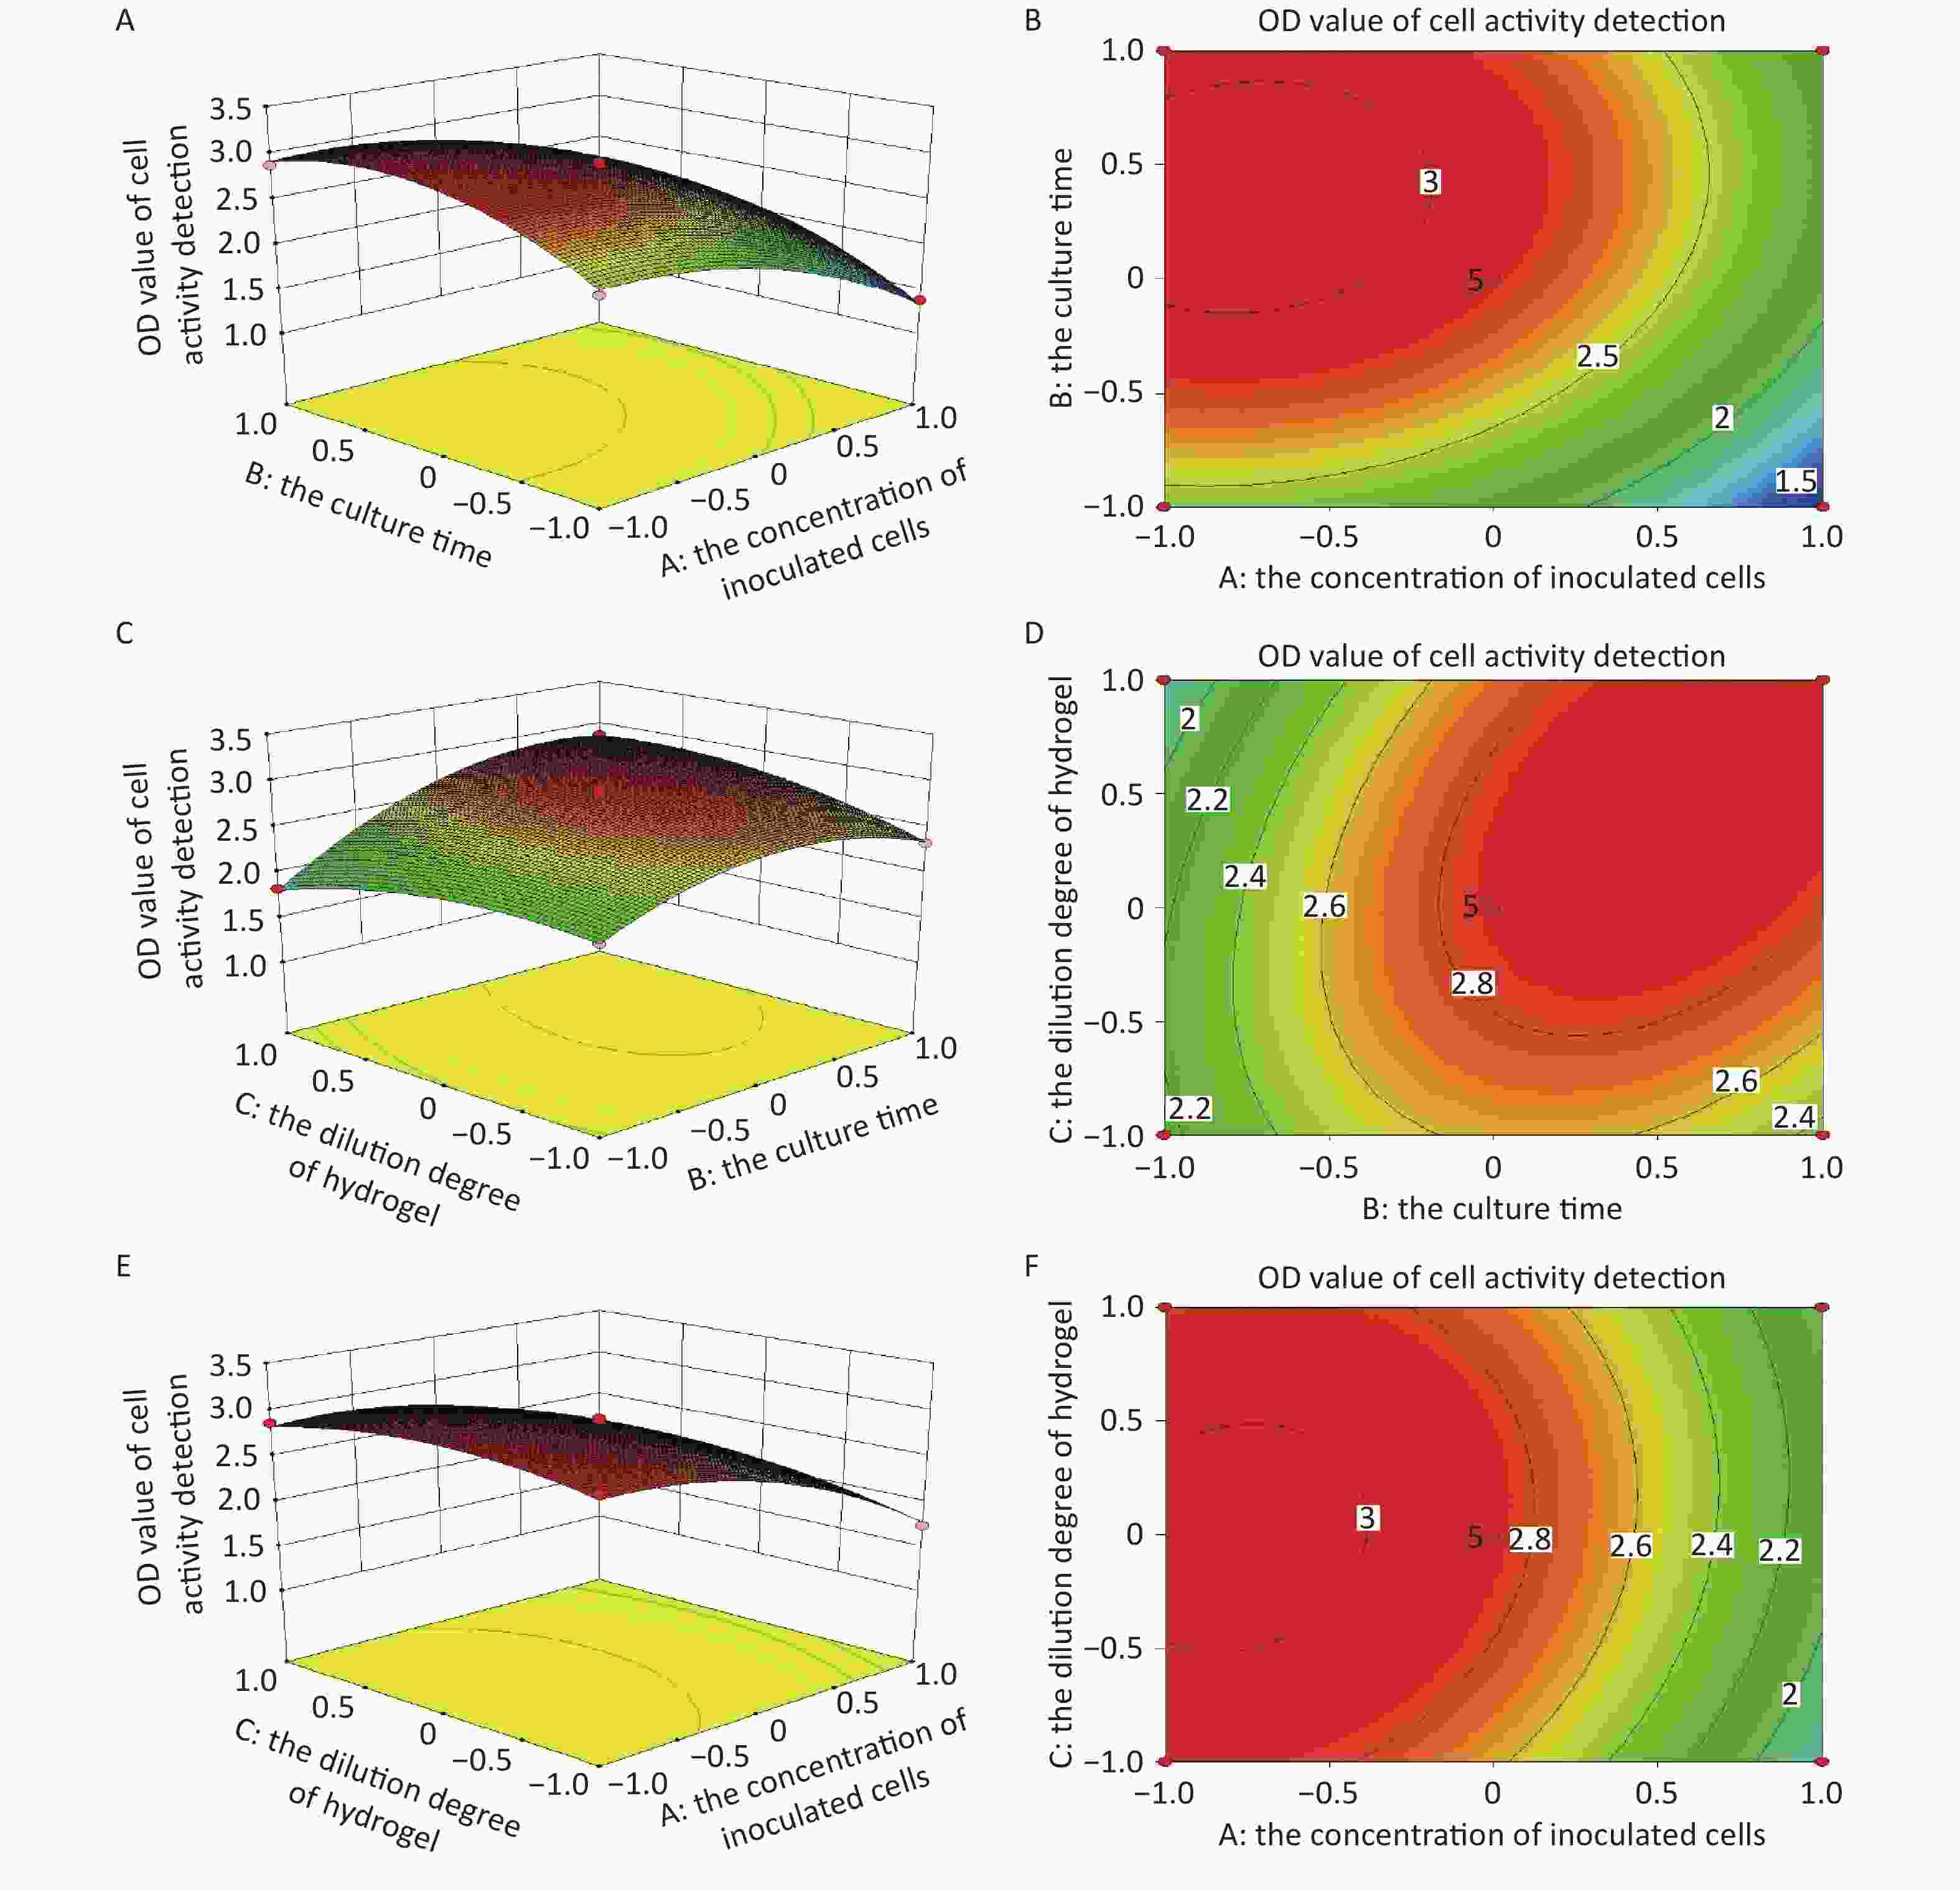
Figure 2. RSM graphs of the concentration of inoculated cells, the culture time, the hydrogel dilution degree to 3D HepG2 cells culture (A, C, and E are the response surface figures; B, D, and F are the contour figures).
-
The optimum process parameters were determined by maximizing the R1 responses. The predicted optimal condition for the culture process was found at 4.44 × 10⁵/mL (A), 4.86 days (B), and 1:2.23 (C), resulting in the OD value of cell activity of 3.10. The culture process was once more repeated by modifying the optimum conditions. The OD value of the cell viability detected was 2.978, with a relative error from the predicted OD value of 3.94%. Therefore, the model can be applied to optimize the 3D HepG2s culture based on the VitroGel system.
-
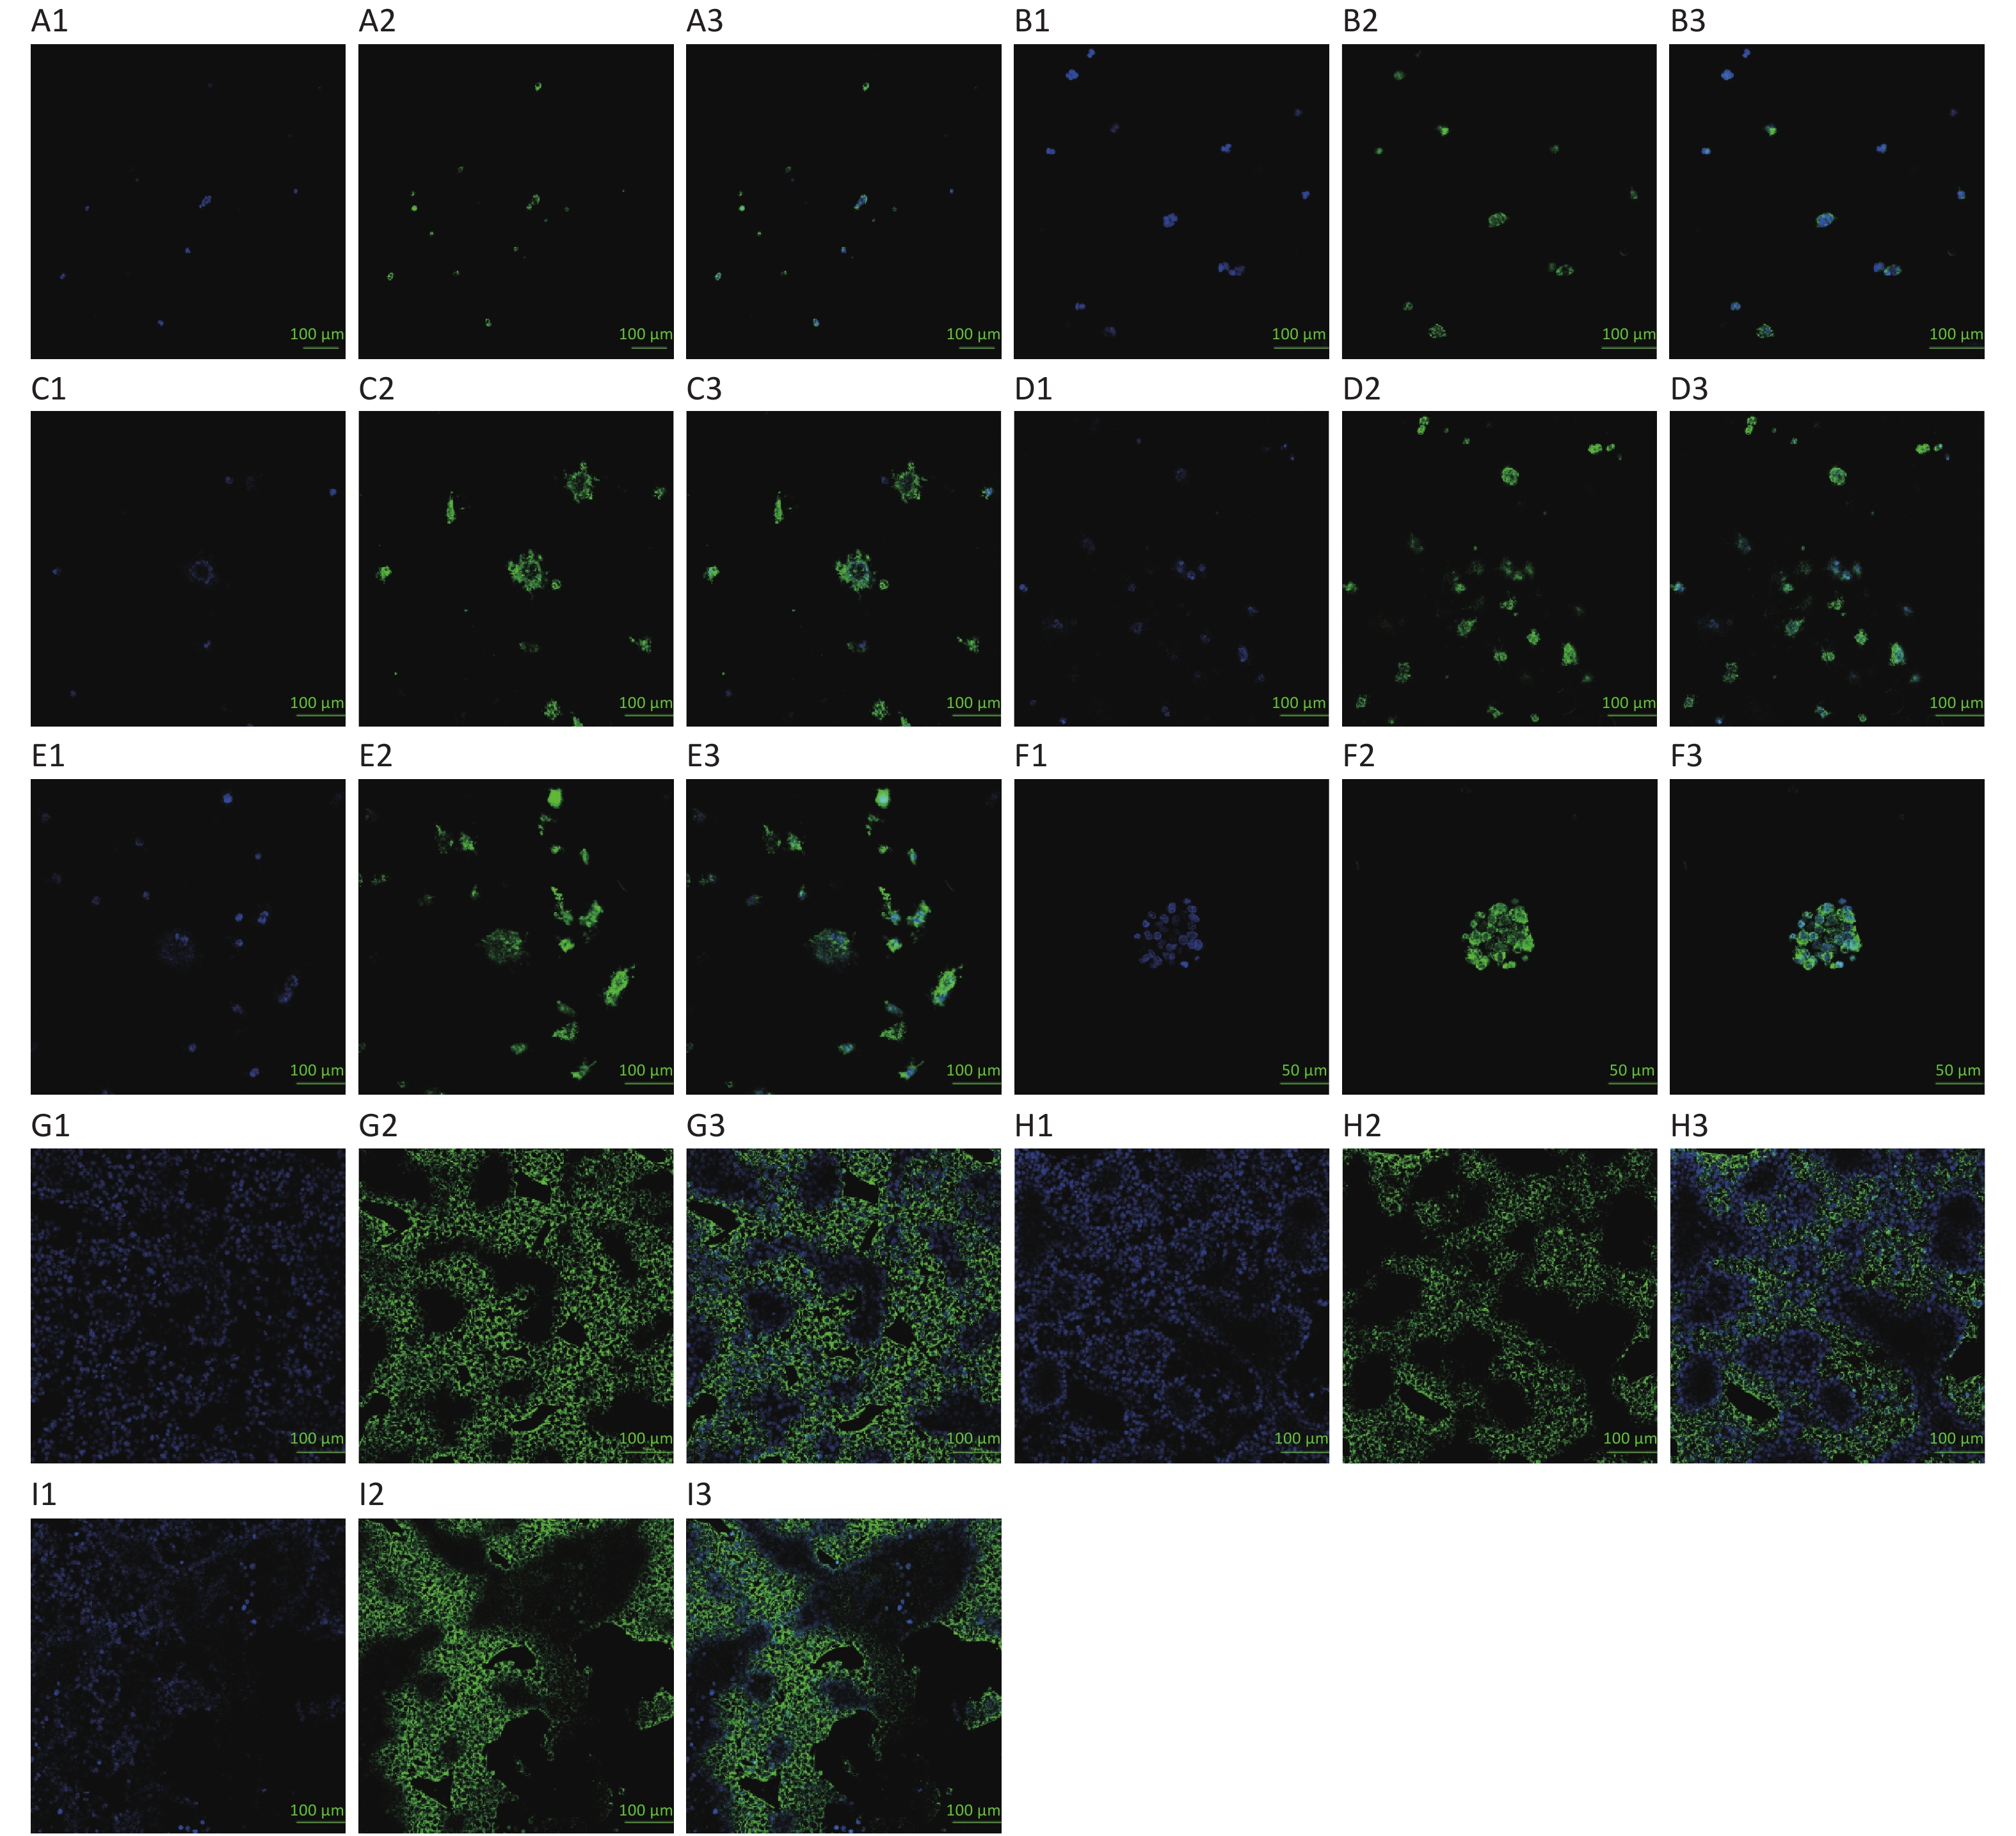
The fluorescence images were acquired with a Leica high-resolution forward fluorescence microscope DM6000. The HepG2 culture mixtures were stained with Hoechst 33342/MitoBright LT Green: Blue highlights the nucleus, and green highlights the cytoplasm. The HepG2 clusters in the hydrogel material increased with the growth of the culture time, and the number of cells in the clusters also increased, as shown in Figure 3A–E. Big HepG2 clusters of dozens of cells can be seen approximately on the 10th day (Figure 3F). However, cells of 2D culture increased and reached the peak approximately on the 3rd day and decreased gradually (Figure 3G–I).
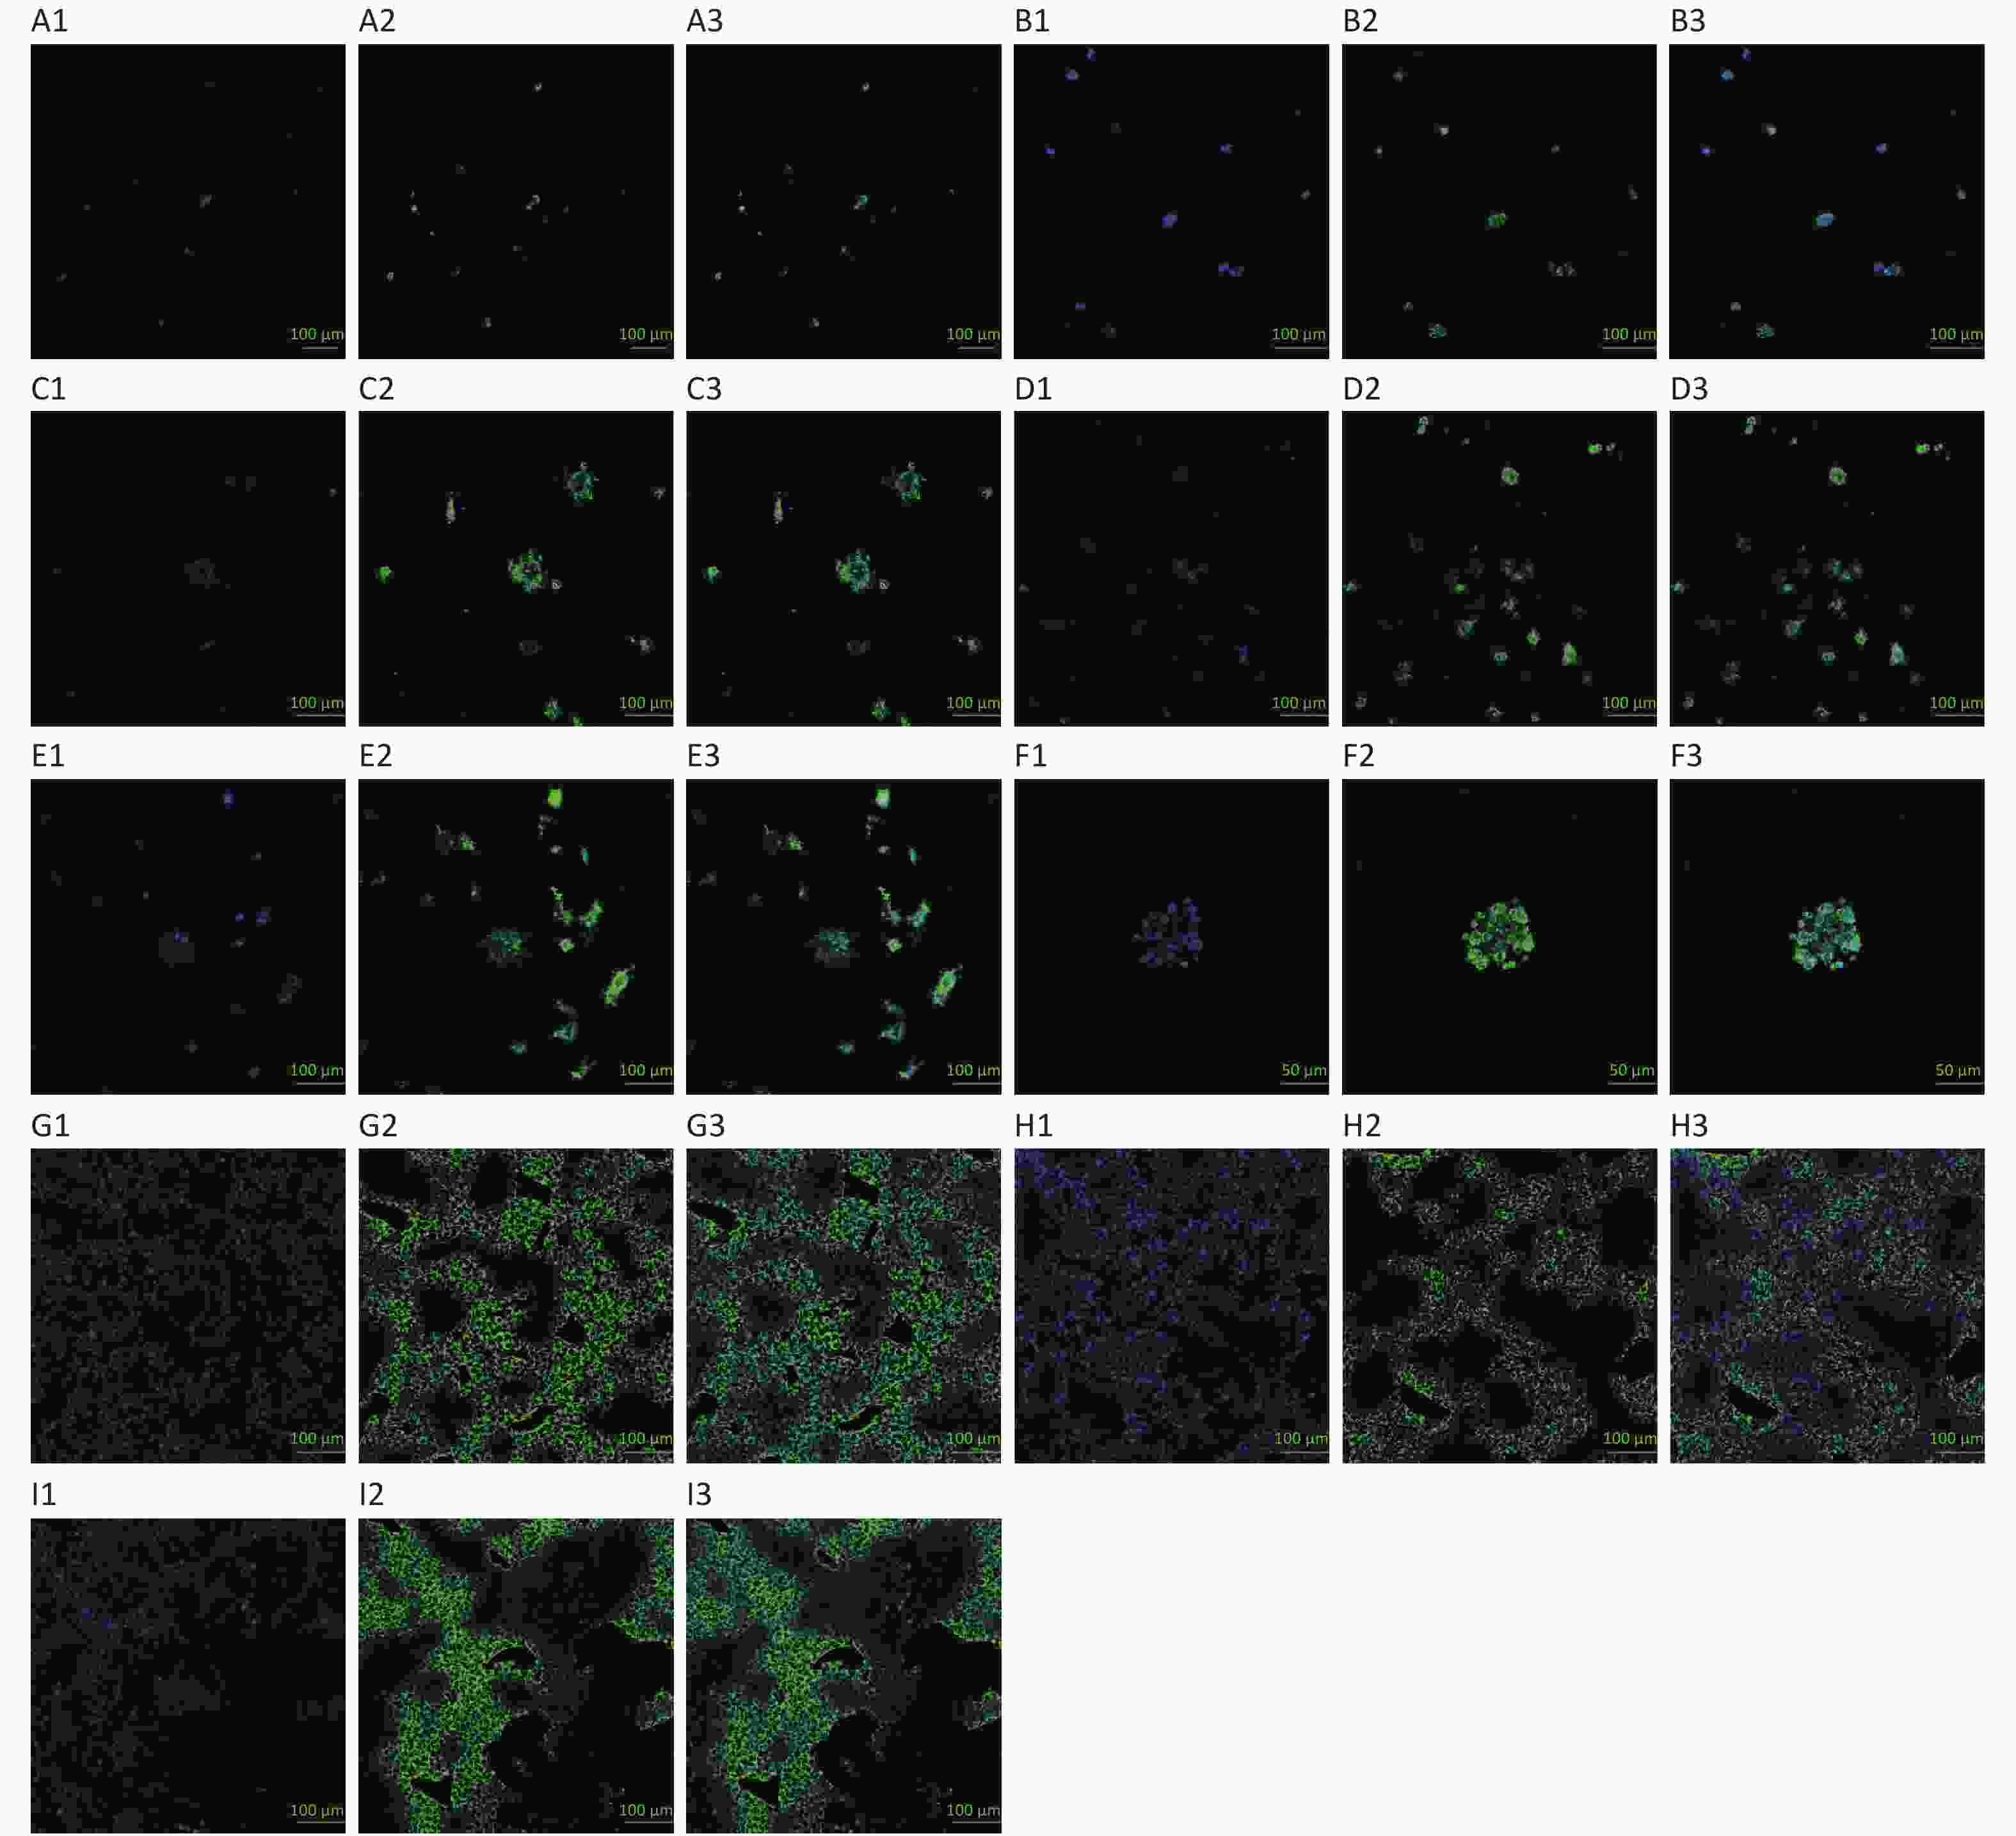
Figure 3. Hoechst 33342/MitoBright LT green staining in 3D and 2D HepG2 culture. Images A–E, G–I at 20×; image F at 40×
The 3D HepG2 culture mixtures were stained with Hoechst 33342/MitoBright LT Green on the 2nd, 4th, 6th, 8th, and 10th day, as shown in Figure 3A–E. Picture F was the 3D HepG2 culture mixtures stained on the 10th day at 40×. The 2D HepG2s were stained with Hoechst 33342/MitoBright LT Green on the 1st, 3rd, and 5th day, as shown in Figure 3G, H, and I, respectively. Among them, Figure 3A1, B1, C1, D1, E1, F1, G1, H1, and I1 were Hoechst 33342 staining; Figure 3A2, B2, C2, D2, E2, F2, G2, H2, and I2 were MitoBright LT Green staining; and Figure 3A3, B3, C3, D3, E3, F3, G3, H3, and I3 were merged images (images A–E, G–I at 20×; image F at 40×).
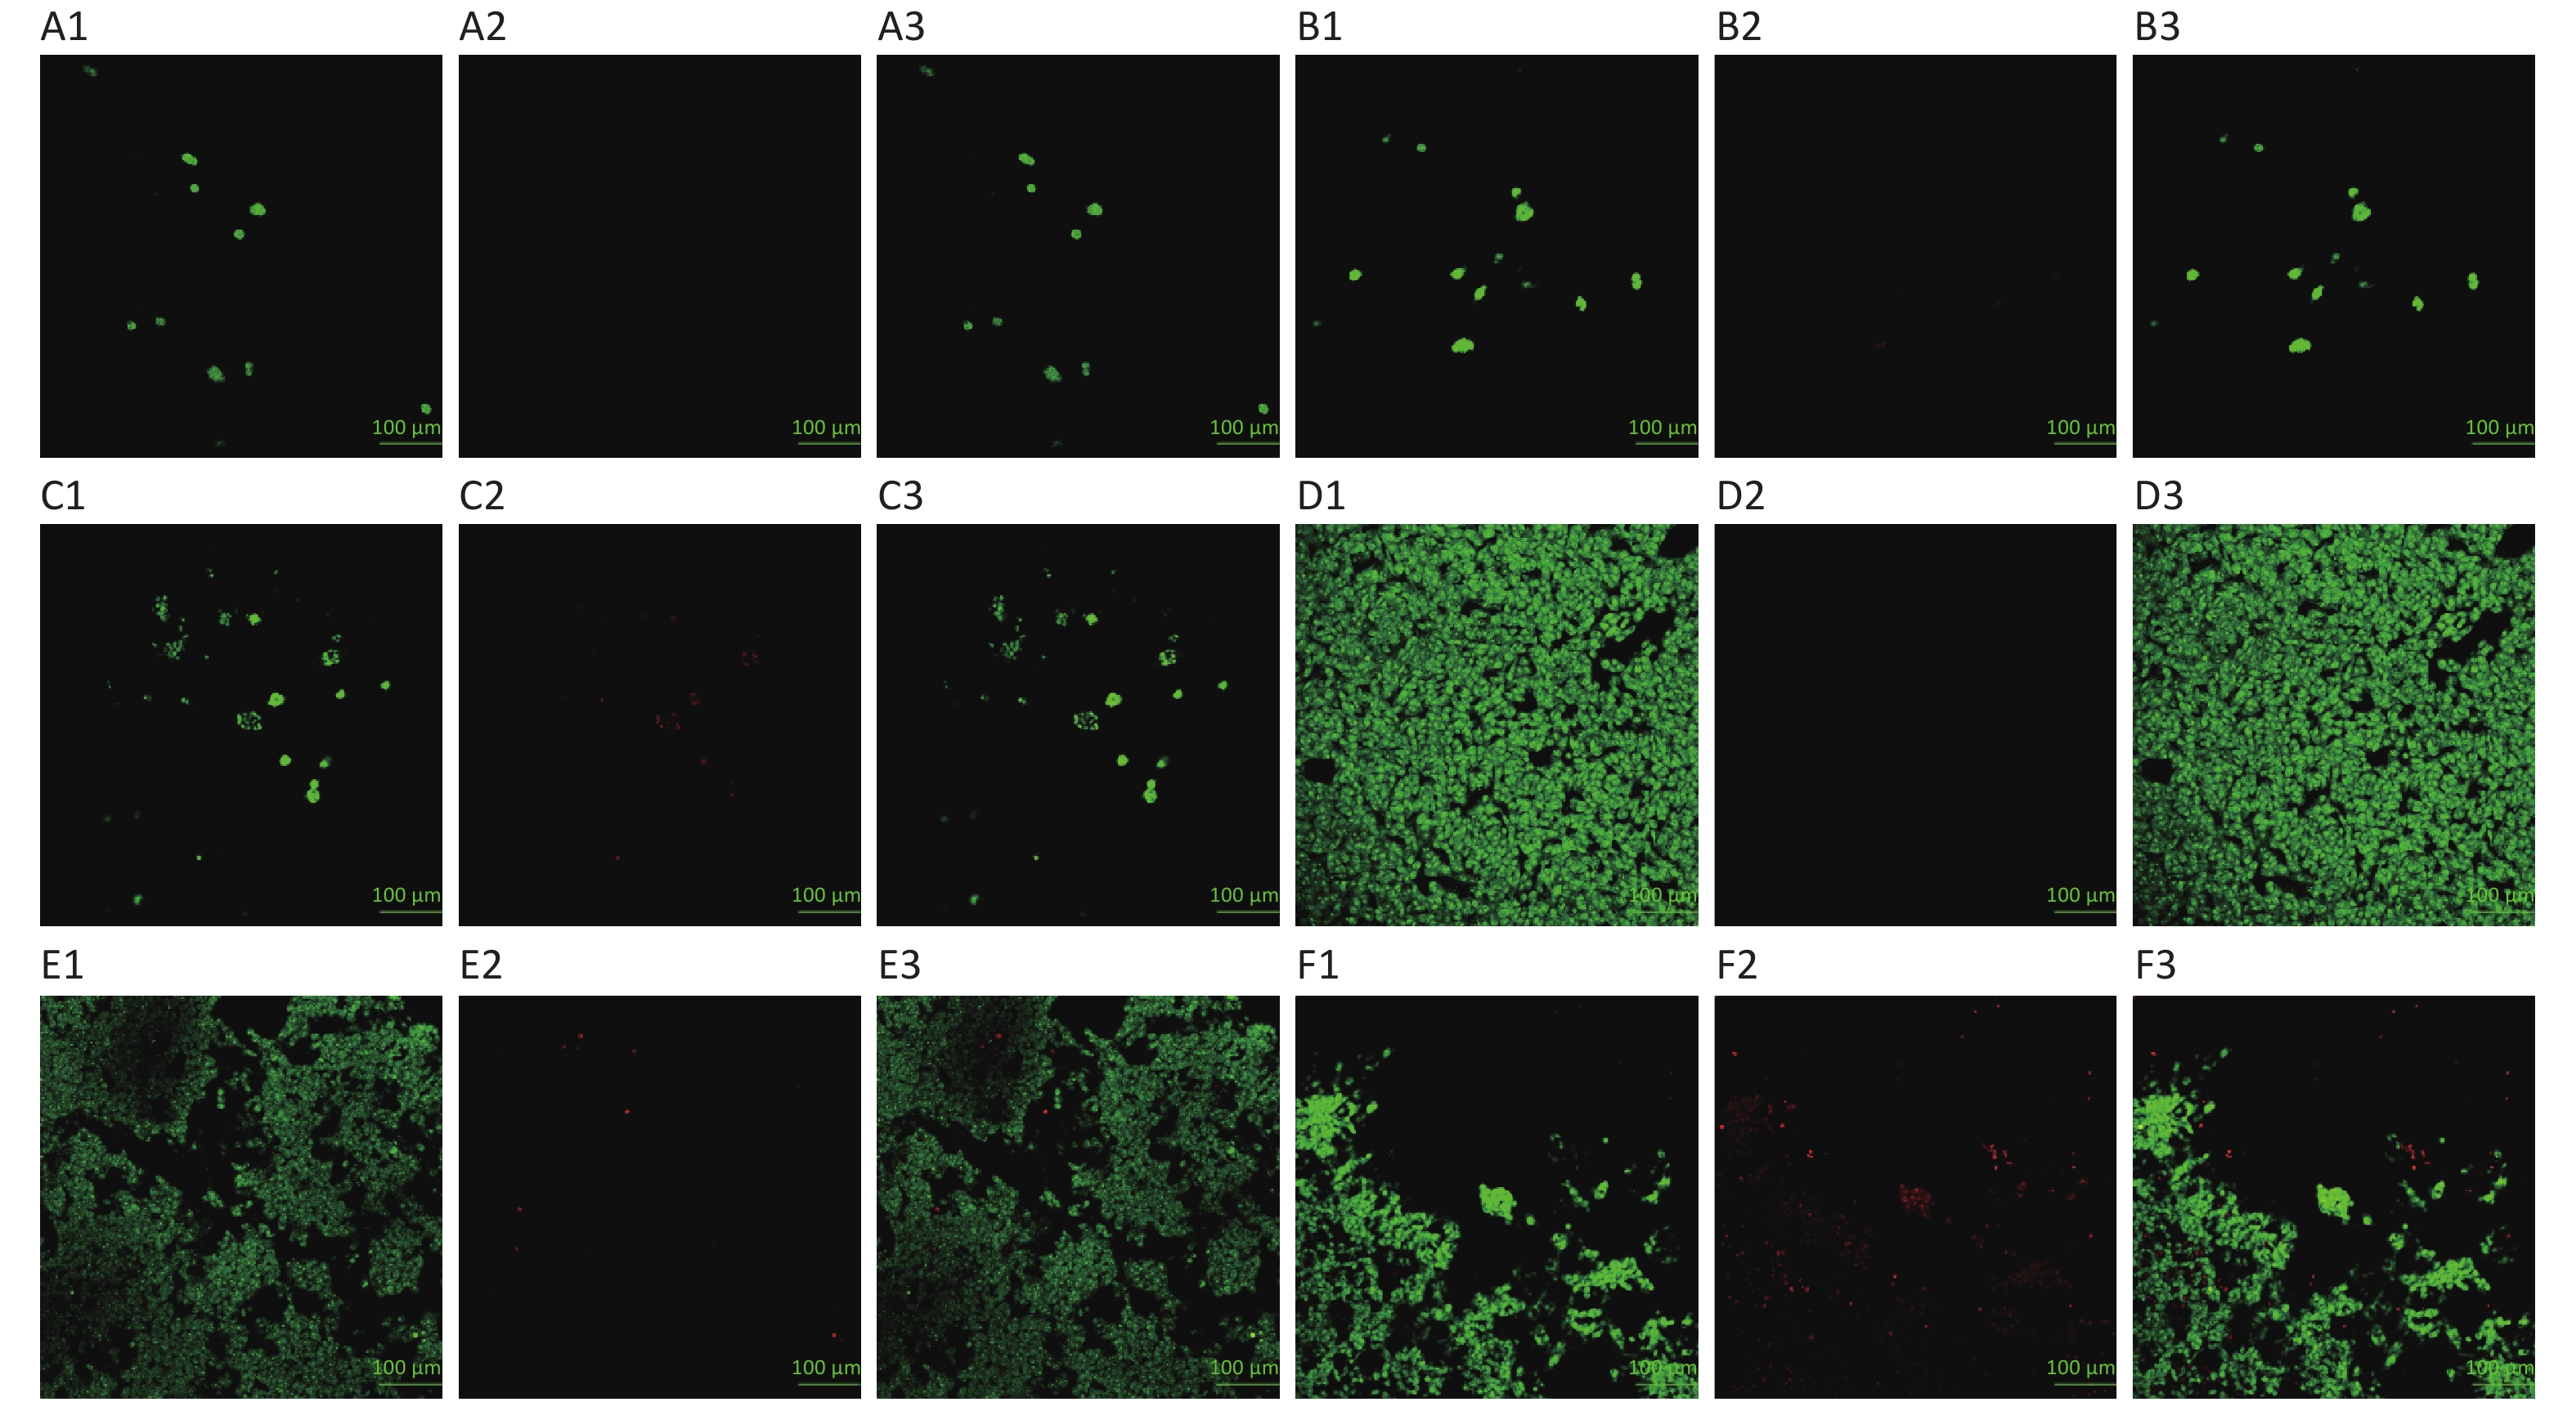
The 3D HepG2 culture mixtures were stained with a normal/necrotic cell detection kit: Green highlights the living cells, and orange/red highlights the apoptosis/dead cells (Figure 4). According to normal/necrotic cell identification observation, apoptosis/dead cells gradually appeared in cell clusters of 3D culture after 6 days, whereas dead cells were more evident after 10 days. It can be because the increased number of living cells was equal to the number of apoptosis/dead cells, resulting in the unchanged curve of CCK-8 after 6 days of culture (Figure 1B). However, apoptotic/dead cells of 2D culture appeared from the 4th day and increased obviously after 6 days.
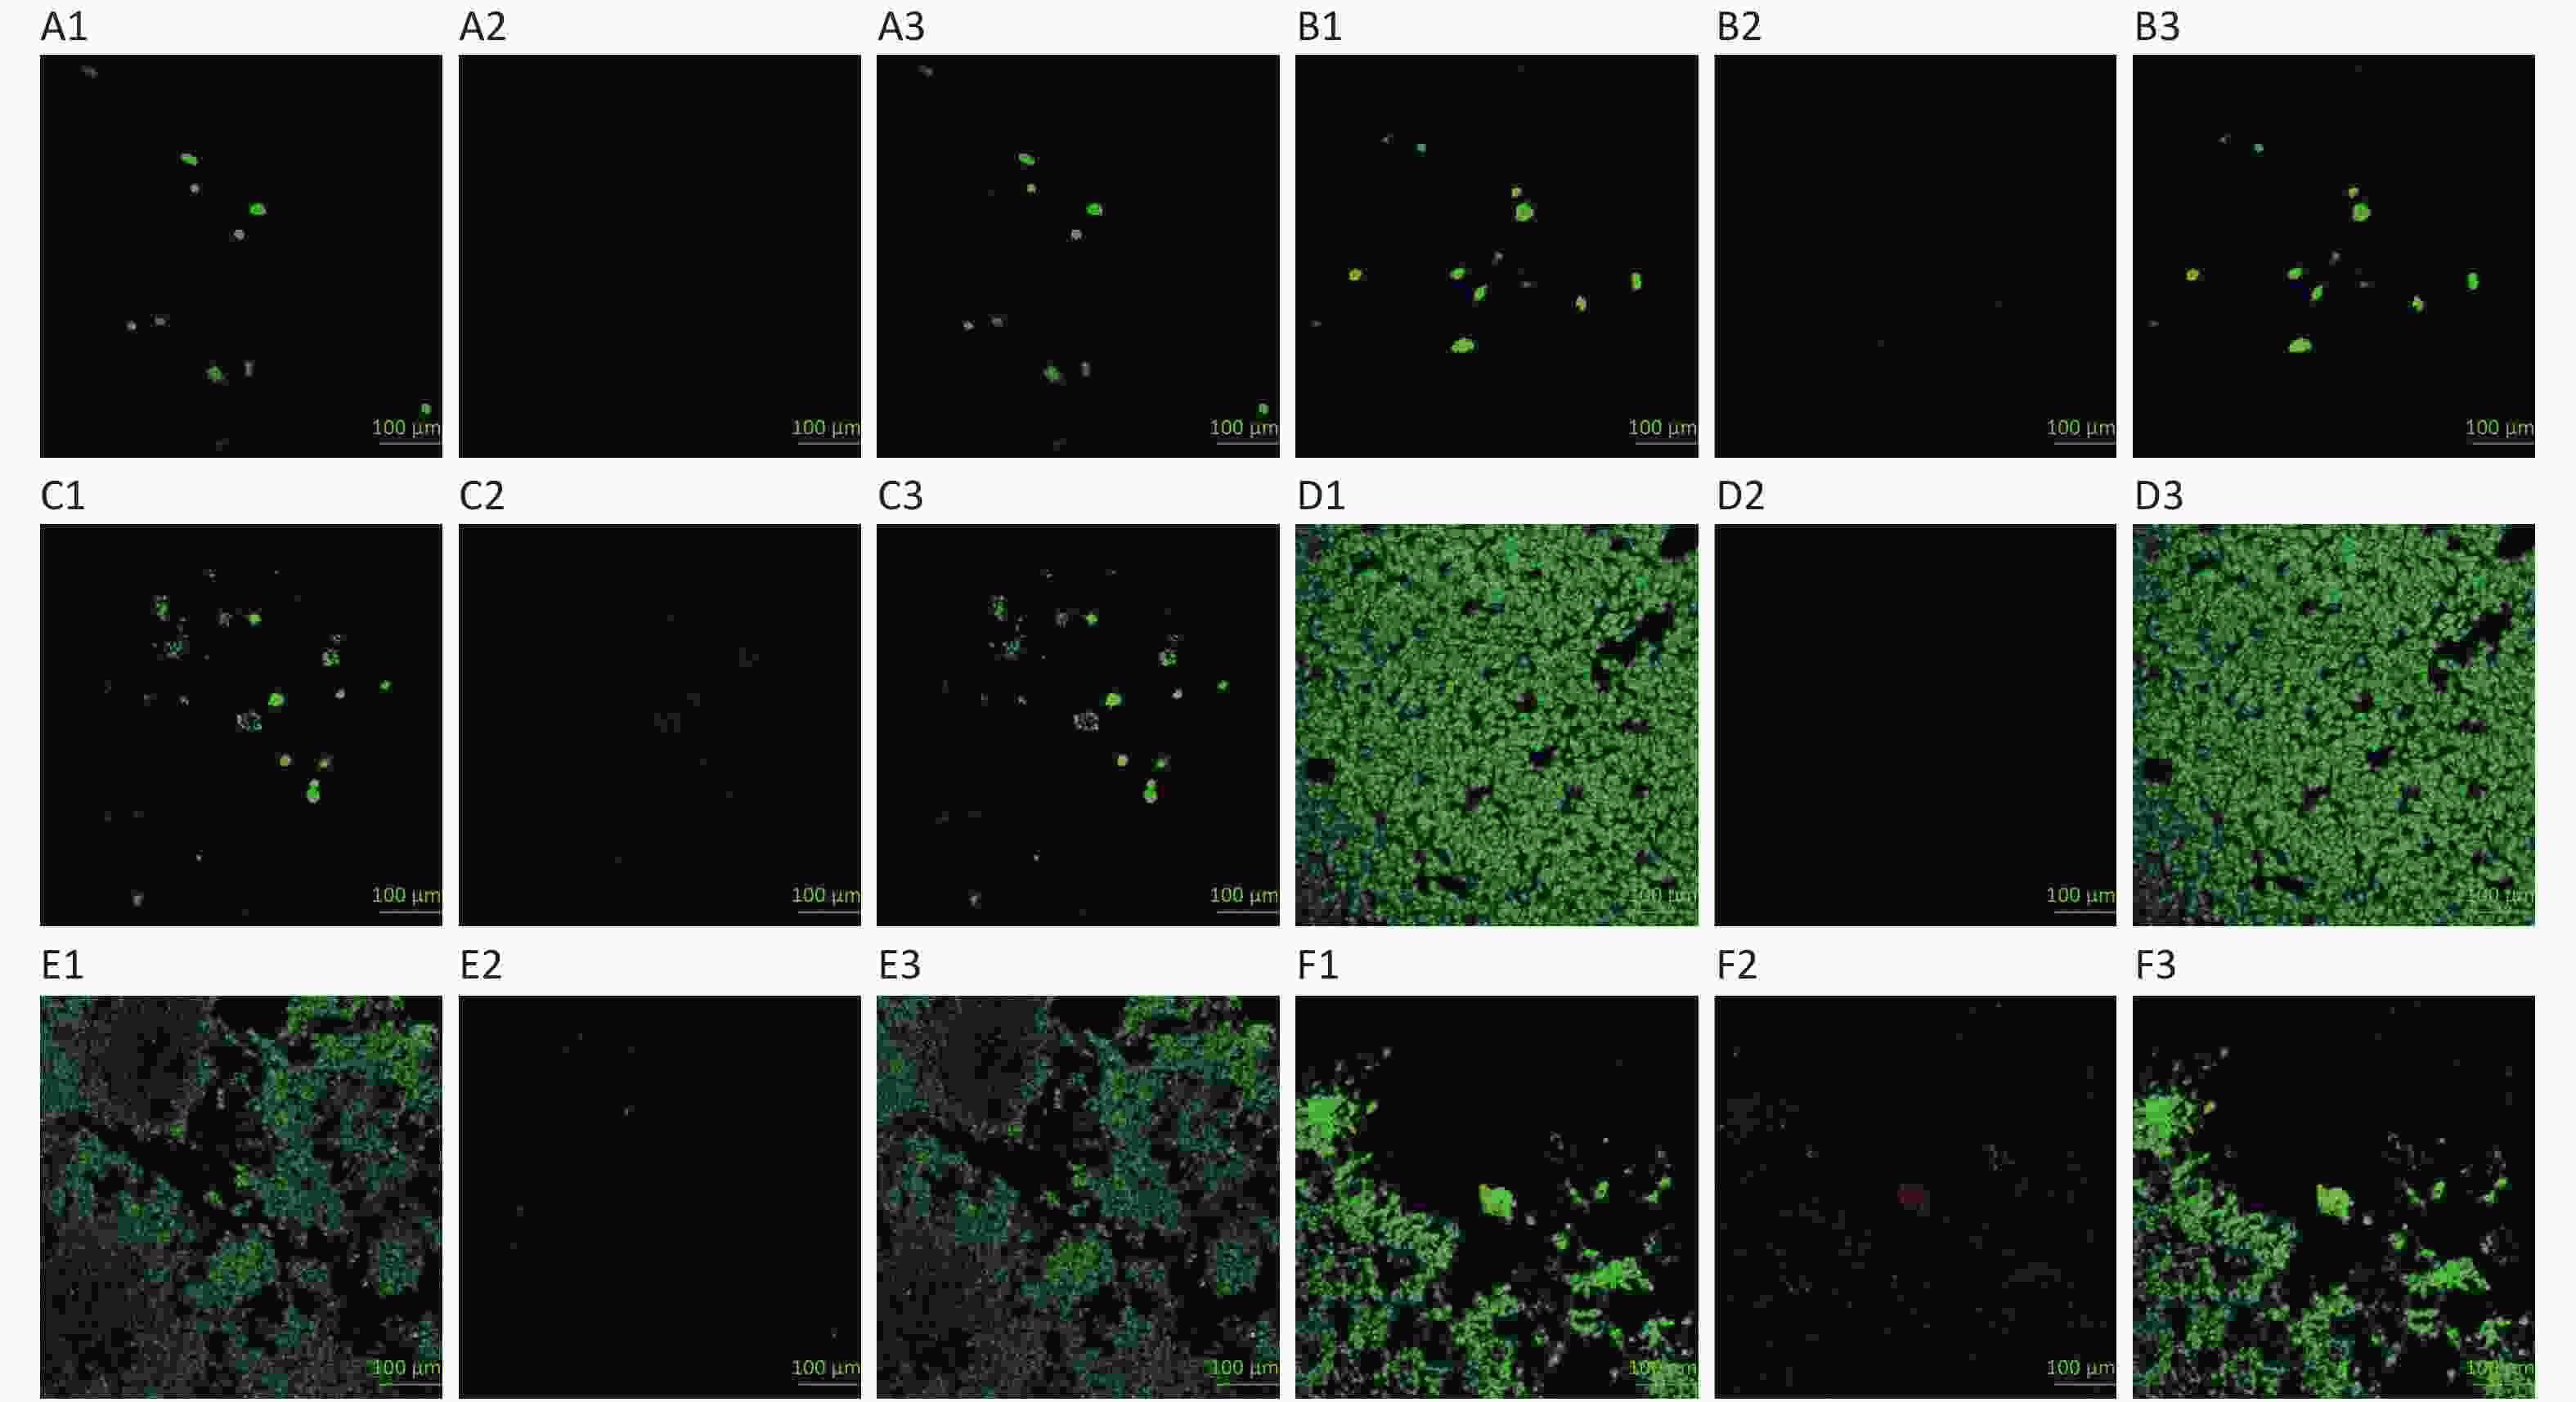
Figure 4. Identification of dead and living cells in 3D and 2D HepG2 culture. Images A–F at 20×
The 3D HepG2 culture mixtures were stained with a normal/necrotic cell detection kit on the 3rd, 6th, and 11th day, as shown in Figure 4A, B, and C, respectively. The 2D HepG2s were stained with a normal/necrotic cell detection kit on the 2nd, 4th, and 7th day, as shown in Figure 4D, E, and F, respectively. Among them, Figure 4A1, B1, C1, D1, E1, and F1 were the living cells staining; Figure 4A2, B2, C2, D2, E2, and F2 were apoptosis/dead cells staining; and Figure 4A3, B3, C3, D3, E3, and F3 were merged images (images A–F at 20×).
-
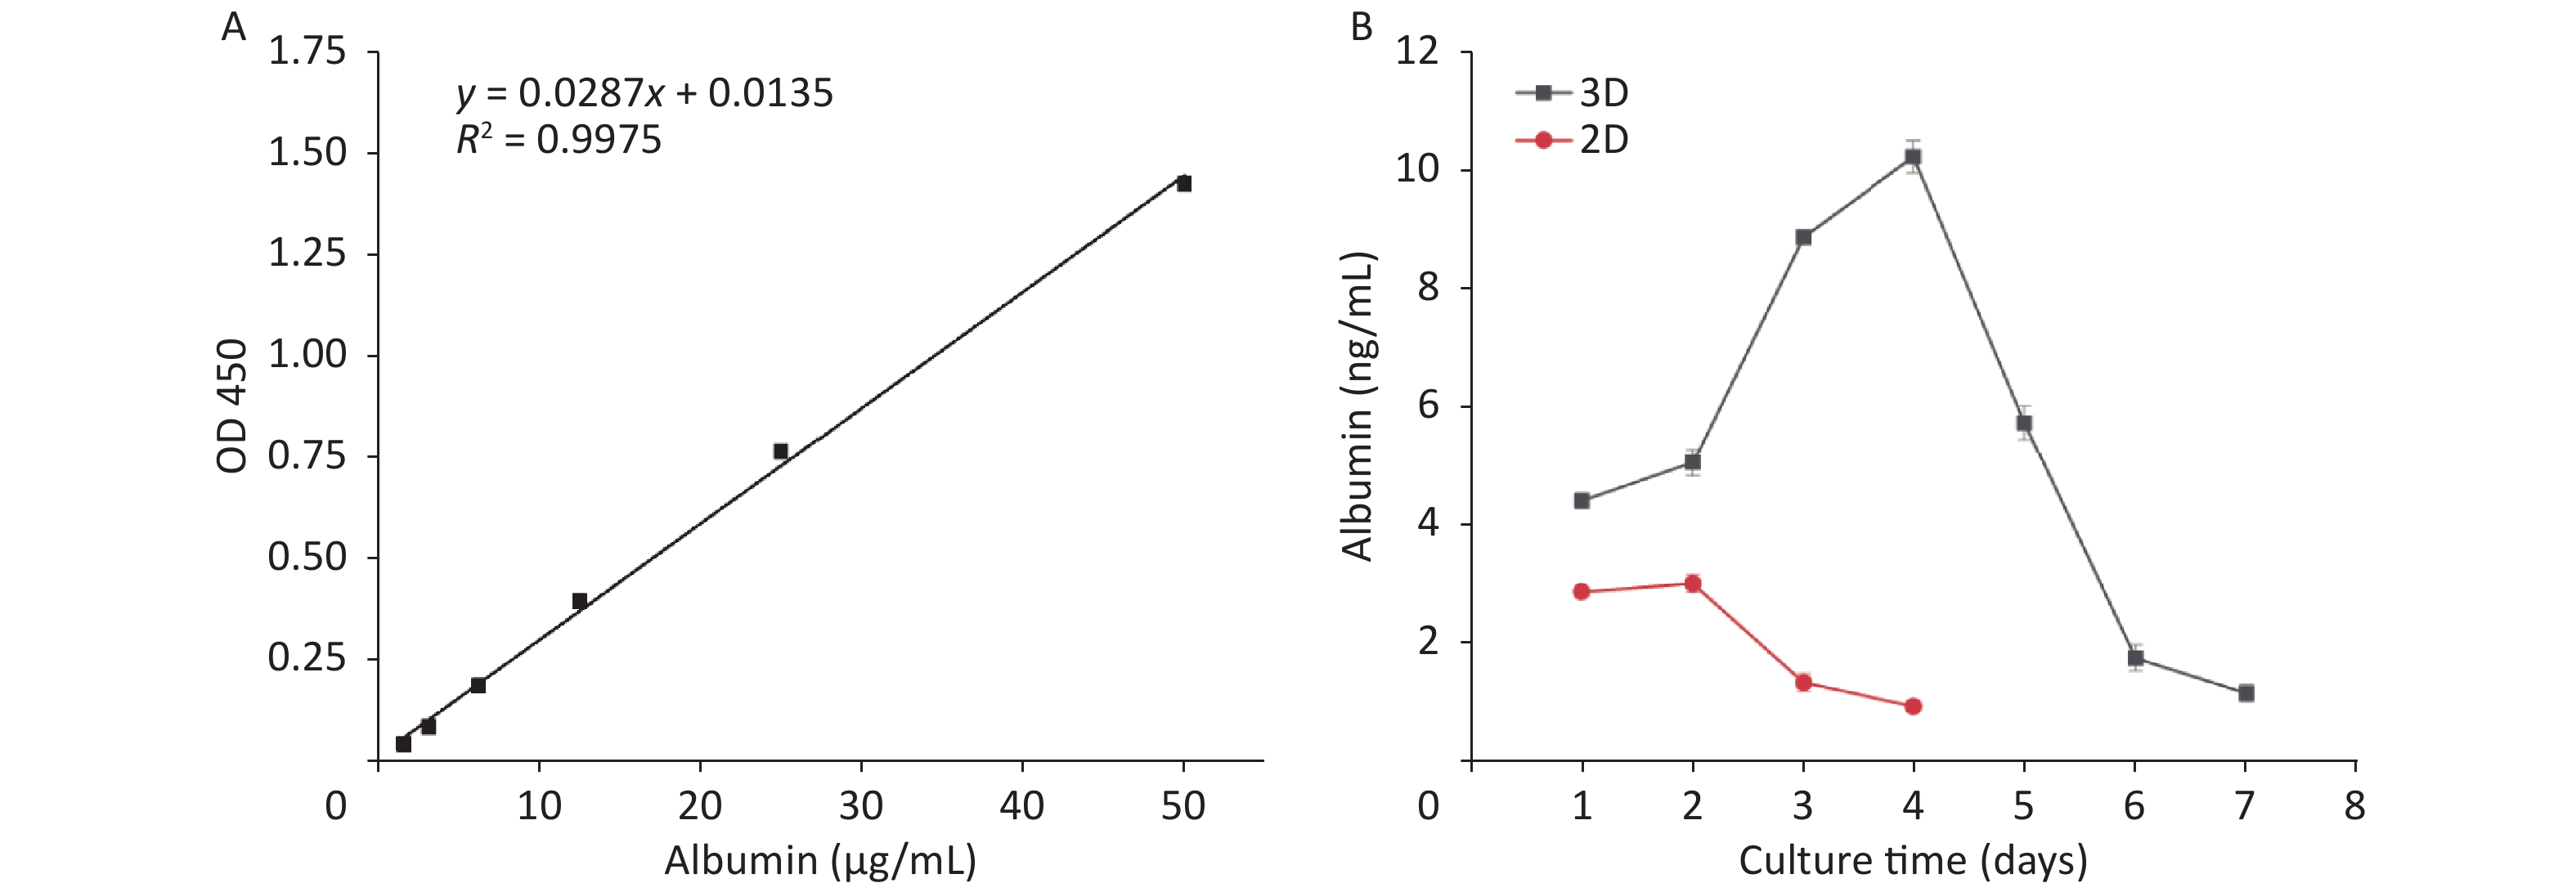
As incubation time extended, albumin secretion in the HepG2 cell culture medium was detected and compared between the 2D and 3D methods. Figure 5 shows that HepG2s secreted albumin but different between 2D and 3D cultures. This difference indicates that as the culture time increased, the albumin secretion of 3D culture increased quickly and reached the peak on the 4th day and then gradually decreased. The albumin secretion of 2D culture was significantly lower than that of 3D culture, and it decreased with culture time, which was consistent with the change of the 2D growth curve (Figure 1D).
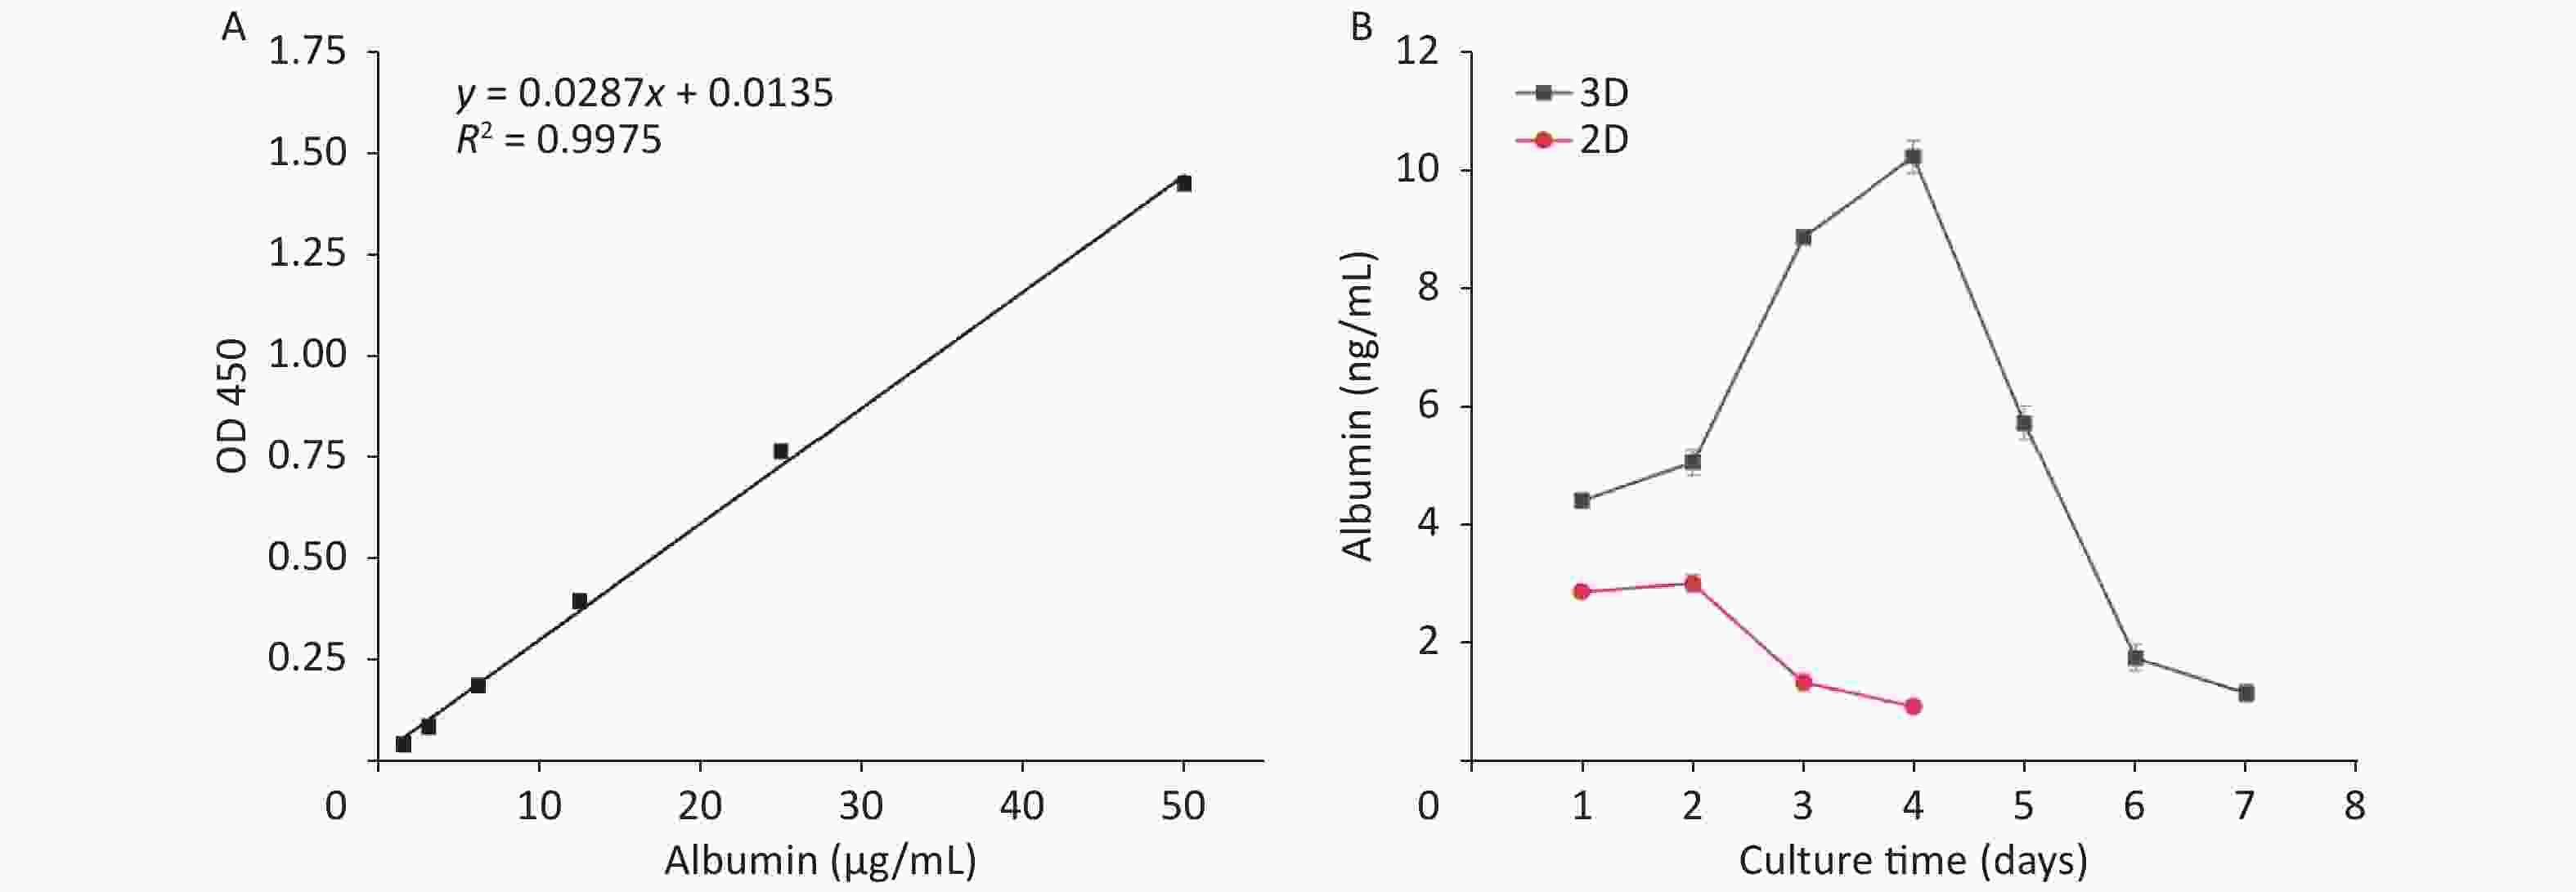
Figure 5. Detection of albumin secretion in the cell culture medium.
-
3D cell culture technology is a technology between monolayer 2D cell culture and animal experiments [26]. It can simulate the growth, proliferation, migration, differentiation and apoptosis of cells in the body to the greatest extent [27], and it is easy to form tissues and organs with reasonable morphology and physiological functions[28-29]. Therefore, 3D cell culture technology is often used in drug discovery, drug carriers, drug toxicology, drug screening, virus research, tumors research on treatment and other aspects[30].
The purpose of this study is successfully construct a feasible and stable 3D hepatocyte model in vitro. It provides the foundation for high-throughput toxicological evaluation studies. The focus of this study is select an appropriate scaffold material and optimize the most suitable culture conditions.
In this study, scaffold method was adopted as 3D culture of HepG2 cell. The VitroGel is a room-temperature stable, ready-to-use, adjustable hydrogel system, which closely mimics ECM environment. Compared with traditional 2D monolayer cell culture, 3D cell culture based on the VitroGel provides a more natural cell environment for cell growth. The cells grow in clusters in the scaffold. There is no space limit to cell growth. Cell survival time of 3D culture was obviously longer than 2D culture (Figure 1B, Figure 1D). Apoptotic/dead cells of 3D culture appeared later than 2D culture (Figure 4). The author continued the culture observation, and the activity of the 3D cell culture was still good at 30 days, which could be more conducive to long-term drug or poison observation experiments.
RSM was used to optimize the optimal process parameters of 3D culture, which was scientific, effective and feasible. The optimal condition for the 3D HepG2 culture based on the VitroGel system was found at 4.44 × 10⁵/mL (A), 4.86 days (B), and 1:2.23 (C). After verification, the relative deviation from the predicted OD value for cell viability was 3.94%. Therefore, the optimized process conditions are suitable for 3D HepG2s culture based on the the VitroGel system. It is known from the RSM experiment that the concentration of cell inoculation has the greatest influence on 3D culture, which should be paid special attention in the process of culture.
Additionally, the 3D culture cell maintained the original cell characteristics and biological activity function. This is known by fluorescent staining and albumin secretion. The blue nucleus is closely enclosed by the green cytoplasm (Figure 3). The detection of albumin in cell culture medium demonstrated that cells of 3D culture maintained the hepatocytes biological function and were significantly higher than cells cultured in 2D. Therefore, the liver tissue of the VitroGel system can be used as a liver substitute for drug screening and toxic pathway research models in vitro.
-
The 3D HepG2 culture and organ chips in vitro were the material basis for subsequent drug screening scientific research work and a prerequisite for treating liver substitute diseases. The success of the constructed tissue depended on the activity and function of the cells in the tissue. In summary, the optimal culture conditions for HepG2s on the VitroGel were determined by RSM optimization. A 3D HepG2 tissue with liver biological activity and function was constructed, laying the foundation for liver function research. Additionally, the RSM of analyzing the optimal conditions for 3D culture was also applicable to other cell lines, providing a reference for in vitro tissue engineering research.
-
HUO Jun Sheng and CHEN Chen, as the corresponding author, designed the experiment with fund-raising, conducted the experiment, and wrote the draft, review, and editing.
-
The authors would like to express sincere thanks to all authors who helped complete this paper.
-
All authors declare no conflicts of interest.
doi: 10.3967/bes2022.091
Optimization of Three-Dimensional Culture Conditions of HepG2 Cells with Response Surface Methodology Based on the VitroGel System
-
Abstract:
Objective This study optimizes three-dimensional (3D) culture conditions of HepG2 using response surface methodology (RSM) based on the VitroGel system to facilitate the cell model in vitro for liver tissues. Method HepG2 cell was 3D cultured on the VitroGel system. Cell viability was detected using Cell Counting Kit-8 (CCK-8) assay of HepG2 lived cell numbers. The proliferation of HepG2 cell and clustering performance was measured via fluorescence staining test. Albumin concentration in the culture medium supernatant as an index of HepG2 cell biological function was measured with ELISA kit. Independent factor tests were conducted with three key factors: inoculated cell concentration, cultured time, and dilution degree of the hydrogel. The preliminary results of independent factor tests were used to determine the levels of factors for RSM. Result The selected optimal culture conditions are as follows: concentration of inoculated cells was 4.44 × 10⁵/mL, culture time was 4.86 days, and hydrogel dilution degree was 1:2.23. The result shows that under optimal conditions, the predicted optical density (OD) value of cell viability was 3.10 and measured 2.978 with a relative error of 3.94%. Conclusion This study serves as a reference for the 3D HepG2 culture and constructs liver tissues in vitro. Additionally, it provides the foundation for repeated dose high-throughput toxicity studies and other scientific research work. -
Key words:
- Response surface methodology /
- The three-dimensional culture /
- Hydrogel
-
Figure 1. Effects of the concentration of inoculated cells, the culture time, and the hydrogel dilution degree on 3D HepG2 culture (A, different concentration of inoculated cells; B, different culture times; C, different hydrogel dilution degree; D, the growth curve of 2D HepG2 culture).
Figure 2. RSM graphs of the concentration of inoculated cells, the culture time, the hydrogel dilution degree to 3D HepG2 cells culture (A, C, and E are the response surface figures; B, D, and F are the contour figures).
Figure 3. Hoechst 33342/MitoBright LT green staining in 3D and 2D HepG2 culture. Images A–E, G–I at 20×; image F at 40×
Figure 4. Identification of dead and living cells in 3D and 2D HepG2 culture. Images A–F at 20×
Figure 5. Detection of albumin secretion in the cell culture medium.
(A) standard curve line of albumin; (B) albumin secretion of 2D and 3D culture.
Table 1. Experimental factors and respective levels of the 3D HepG2 culture used in the Box–Behnken design
Level A: the concentration of cells (105/mL) B: the culture time (days) C: the hydrogel dilution degree (1:n) −1 5 2 1 0 3 4 2 1 1 6 3  下载: 导出CSV
Table 2. Box–Behnken design offered to the 3D HepG2 culture
Run A: the
concentration
of cells (105/mL)B: the
culture time
(days)C: the
hydrogel
dilution
degree
(1:n)OD value
(mean ± SD)Predictive
value1 0 0 0 2.879 ± 0.049 2.86 2 1 −1 0 1.378 ± 0.030 1.34 3 1 0 −1 1.742 ± 0.139 1.78 4 0 −1 1 1.828 ± 0.154 1.81 5 1 1 0 2.133 ± 0.111 2.08 6 −1 −1 0 2.347 ± 0.145 2.40 7 0 0 0 2.871 ± 0.040 2.86 8 0 1 −1 2.331 ± 0.010 2.35 9 0 0 0 2.822 ± 0.079 2.86 10 0 1 1 2.865 ± 0.049 2.86 11 −1 0 1 2.863 ± 0.074 2.82 12 −1 1 0 2.873 ± 0.066 2.91 13 0 0 0 2.819 ± 0.020 2.86 14 1 0 1 1.935 ± 0.062 1.99 15 −1 0 −1 2.919 ± 0.014 2.86 16 0 −1 −1 2.153 ± 0.150 2.15 17 0 0 0 2.914 ± 0.023 2.86
下载: 导出CSV
Table 3. Analysis of variance for response surface quadratic model of 3D HepG2 culture
Source model Sum of squares Degree of freedom Mean squares F-value P-value Significant Model 4.08 9 0.45 116.23 < 0.0001 ** A 1.82 1 1.82 466.02 < 0.0001 ** B 0.78 1 0.78 199.59 < 0.0001 ** C 0.0153 1 0.0153 3.84 0.091 N AB 0.013 1 0.013 3.36 0.1095 N AC 0.016 1 0.016 3.97 0.0865 N BC 0.18 1 0.18 47.28 0.0002 ** A2 0.39 1 0.39 99.65 < 0.0001 ** B2 0.59 1 0.59 151.25 < 0.0001 ** C2 0.16 1 0.16 39.94 0.0004 ** Residual 0.027 7 0.003902 Lack of fit 0.021 3 0.006932 4.25 0.0979 N Pure error 0.006518 4 0.00163 Total 4.11 16 Note. “**” Means that the effect is extremely significant (P < 0.01), N means that the effect is not significant (P > 0.05).
下载: 导出CSV
-
[1] Agarwal T, Banerjee D, Konwarh R, et al. Recent advances in bioprinting technologies for engineering hepatic tissue. Mater Sci Eng C, 2021; 123, 112013. doi: 10.1016/j.msec.2021.112013 [2] Sk MM, Das P, Panwar A, et al. Synthesis and characterization of site selective photo-crosslinkable glycidyl methacrylate functionalized gelatin-based 3D hydrogel scaffold for liver tissue engineering. Mater Sci Eng C, 2021; 123, 111694. doi: 10.1016/j.msec.2020.111694 [3] Chen AX, Chhabra A, Song HHG, et al. Controlled apoptosis of stromal cells to engineer human microlivers. Adv Funct Mater, 2020; 30, 1910442. doi: 10.1002/adfm.201910442 [4] Furuya K, Zheng YW, Sako D, et al. Enhanced hepatic differentiation in the subpopulation of human amniotic stem cells under 3D multicellular microenvironment. World J Stem Cells, 2019; 11, 705−21. doi: 10.4252/wjsc.v11.i9.705 [5] Bell CC, Lauschke VM, Vorrink SU, et al. Transcriptional, functional, and mechanistic comparisons of stem cell-derived hepatocytes, HepaRG cells, and three-dimensional human hepatocyte spheroids as predictive in vitro systems for drug-induced liver injury. Drug Metab Dispos, 2017; 45, 419−29. doi: 10.1124/dmd.116.074369 [6] Lee JY, Han HJ, Lee SJ, et al. Use of 3D human liver organoids to predict drug-induced phospholipidosis. Int J Mol Sci, 2020; 21, 2982. doi: 10.3390/ijms21082982 [7] Ramaiahgari SC, Den Braver MW, Herpers B, et al. A 3D in vitro model of differentiated HepG2 cell spheroids with improved liver-like properties for repeated dose high-throughput toxicity studies. Arch Toxicol, 2014; 88, 1083−95. [8] Shah UK, De Oliveira Mallia J, Singh N, et al. Reprint of: a three-dimensional in vitro HepG2 cells liver spheroid model for genotoxicity studies. Mutat Res/Gene Toxicol Environ Mutagen, 2018; 834, 35−41. doi: 10.1016/j.mrgentox.2018.06.020 [9] Breslin S, O'Driscoll L. Three-dimensional cell culture: the missing link in drug discovery. Drug Discov Today, 2013; 18, 240−9. doi: 10.1016/j.drudis.2012.10.003 [10] Ghosh S, Börsch A, Ghosh S, et al. The transcriptional landscape of a hepatoma cell line grown on scaffolds of extracellular matrix proteins. BMC Genomics, 2021; 22, 238. doi: 10.1186/s12864-021-07532-2 [11] Chen YX, Xie GC, Pan D, et al. Three-dimensional culture of human airway epithelium in Matrigel for evaluation of human rhinovirus C and Bocavirus infections. Biomed Environ Sci, 2018; 31, 136−45. [12] Curvello R, Alves D, Abud HE, et al. A thermo-responsive collagen-nanocellulose hydrogel for the growth of intestinal organoids. Mater Sci Eng C, 2021; 124, 112051. doi: 10.1016/j.msec.2021.112051 [13] Katoh S, Yoshioka H, Senthilkumar R, et al. Enhanced expression of hyaluronic acid in osteoarthritis-affected knee-cartilage chondrocytes during three-dimensional in vitro culture in a hyaluronic-acid-retaining polymer scaffold. Knee, 2021; 29, 365−73. doi: 10.1016/j.knee.2021.02.019 [14] Singh SP, Schwartz MP, Tokuda EY, et al. A synthetic modular approach for modeling the role of the 3D microenvironment in tumor progression. Sci Rep, 2015; 5, 17814. doi: 10.1038/srep17814 [15] Heidari R, Soheili ZS, Samiei S, et al. Alginate as a cell culture substrate for growth and differentiation of human retinal pigment epithelial cells. Appl Biochem Biotechnol, 2015; 175, 2399−412. doi: 10.1007/s12010-014-1431-z [16] Zhang X, Morits M, Jonkergouw C, et al. Three-dimensional printed cell culture model based on spherical colloidal lignin particles and cellulose nanofibril-alginate hydrogel. Biomacromolecules, 2020; 21, 1875−85. doi: 10.1021/acs.biomac.9b01745 [17] Guo L, Dial S, Shi LM, et al. Similarities and differences in the expression of drug-metabolizing enzymes between human hepatic cell lines and primary human hepatocytes. Drug Metab Dispos, 2011; 39, 528−38. doi: 10.1124/dmd.110.035873 [18] Sakai Y, Nakazawa K. Technique for the control of spheroid diameter using microfabricated chips. Acta Biomater, 2007; 3, 1033−40. doi: 10.1016/j.actbio.2007.06.004 [19] Taniguchi M, Miyamoto H, Tokunaga A, et al. Evaluation of mRNA expression of drug-metabolizing enzymes in acetaminophen-induced hepatotoxicity using a three-dimensional hepatocyte culture system. Xenobiotica, 2020; 50, 654−62. doi: 10.1080/00498254.2019.1683258 [20] Nakamura K, Kato N, Aizawa K, et al. Expression of albumin and cytochrome P450 enzymes in HepG2 cells cultured with a nanotechnology-based culture plate with microfabricated scaffold. J Toxicol Sci, 2011; 36, 625−33. doi: 10.2131/jts.36.625 [21] Xu JW, Qi GY, Sui CX, et al. 3D h9e peptide hydrogel: an advanced three-dimensional cell culture system for anticancer prescreening of chemopreventive phenolic agents. Toxicol Vitro, 2019; 61, 104599. doi: 10.1016/j.tiv.2019.104599 [22] Meng D, Lei XX, Li Y, et al. Three dimensional polyvinyl alcohol scaffolds modified with collagen for HepG2 cell culture. J Biomater Appl, 2020; 35, 459−70. doi: 10.1177/0885328220933505 [23] Kaynar SÇ, Kaynar ÜH. Method for the determination of polonium-210 in tea samples using response surface methodology (RSM). Nucl Sci Tech, 2019; 30, 45. doi: 10.1007/s41365-019-0567-5 [24] Tabandeh F, Khodabandeh M, Yakhchali B, et al. Response surface methodology for optimizing the induction conditions of recombinant interferon beta during high cell density culture. Chem Eng Sci, 2008; 63, 2477−83. doi: 10.1016/j.ces.2008.02.003 [25] Muhammad U, Lu HD, Wang J, et al. Optimizing the maximum recovery of dihydromyricetin from Chinese vine tea, Ampelopsis grossedentata, using response surface methodology. Molecules, 2017; 22, 2250. doi: 10.3390/molecules22122250 [26] Noi M, Mukaisho KI, Yoshida S, et al. ERK phosphorylation functions in invadopodia formation in tongue cancer cells in a novel silicate fibre-based 3D cell culture system. Int J Oral Sci, 2018; 10, 30. doi: 10.1038/s41368-018-0033-y [27] Kloxin AM, Kloxin CJ, Bowman CN, et al. Mechanical properties of cellularly responsive hydrogels and their experimental determination. Adv Mater, 2010; 22, 3484−94. doi: 10.1002/adma.200904179 [28] Xiao M, Qiu J, Kuang R, et al. Synergistic effects of stromal cell-derived factor-1α and bone morphogenetic protein-2 treatment on odontogenic differentiation of human stem cells from apical papilla cultured in the VitroGel 3D system. Cell Tissue Res, 2019; 378, 207−20. doi: 10.1007/s00441-019-03045-3 [29] Huch M, Koo BK. Modeling mouse and human development using organoid cultures. Development, 2015; 142, 3113−25. doi: 10.1242/dev.118570 [30] Langhans SA. Three-dimensional in vitro cell culture models in drug discovery and drug repositioning. Front Pharmacol, 2018; 9, 6. doi: 10.3389/fphar.2018.00006 -

 点击查看大图
计量
- 文章访问数: 1262
- HTML全文浏览量: 575
- PDF下载量: 154
- 被引次数: 0


 Quick Links