

 下载:
下载:

-
Diabetes is a common disease that has affected more than 285 million individuals [1]. Diabetic macular edema (DME) is an ophthalmic disease that causes vision loss. Patients with diabetic retinopathy (DR) may also be affected by DME [2]. Biomicroscopy, fluorescein angiography, optical coherence tomography, and color fundus photography have been used to guide treatment and follow-up in DME. Shading fundus imaging is utilized for analysis, and follow-up of retinal diseases [3]. It captures the three-dimensional fundus in two-dimensional pictures using a fundus camera. A two dimensional Fundus camera—provides a vertical and amplified view of the inner structures of the eye attached at the highest point of the camera [4]. There are two types of DR: non-proliferative and proliferative. Abnormal development of the veins and accumulation of liquid near the macula are chief causes of DME [5]. DME generally affects patients with type II diabetes. The diagnosis of DME is based on Optic Disc (OD) examination and detection of exudate (EX) in the macular region by fundus photography. Detection of EX is difficult because of the high intensity which appears similar to OD. The division of OD and blood vessels (BVs) is a significant strategy identify the macular and the macular focus known as the fovea. This consequently decreases the spillage in the macula and prevents vision deterioration. DME increases the risk of cardiovascular illnesses, stroke, nephropathy, and neuropathy.
This paper is organized as follows: section 2 describes the existing strategy used to detect DME. Section 3 describes the data used for experimentation. In section 4, a strategy has been proposed for the diagnosis of DME in retinal images. Section 5 presents the outcomes of the proposed technique and performance measures are computed to determine the sensitivity, specificity, and accuracy of the proposed method. Section 6 presents our conclusions and suggestions for future advances in this field.
The literature extensively describes the use of advanced imaging methods to detect DME. Exudates have been detected in the macula in two studies. Akram et al. introduced a novel technique of identifying EX and macula using a feature set and Gaussian mixtures model based classifier[6]. Giancardo et al. proposed shading, wavelet disintegration, and automatic lesion segmentation for DME analysis [7]. Deepak et al. have proposed a supervised learning method for DME recognition[8].
The researchers obtained 45 fundus photographs, with 15 each of normal, DME affected, and glaucoma affected individuals, from the HRF database (
https://www5.cs.fau.de/research/data/fundus-images/ ). These images were taken using a Topcon CR1 fundus camera.The identification and prediction of DME is performed with the sequence of steps described below in retinal images. Furthermore, it incorporates the additional phases. Brightening revision is a preprocessing step performed to reduce artifacts and uneven brightening display of the retinal picture. Precise identification of the OD may be necessary to decrease the false positive rate (FPR) to identify EXs. Atanassov’s intuitionistic fuzzy sets (A-FIS) algorithm is used to segment OD and will also be uprooted by the succession of morphological operations. The bottom-hat transformation was used to segment the main blood vessels. The raphe estimation strategy will be used to identify the macula and fovea, and gradient-based versatile thresholding may be used to identify EXs in the macula.
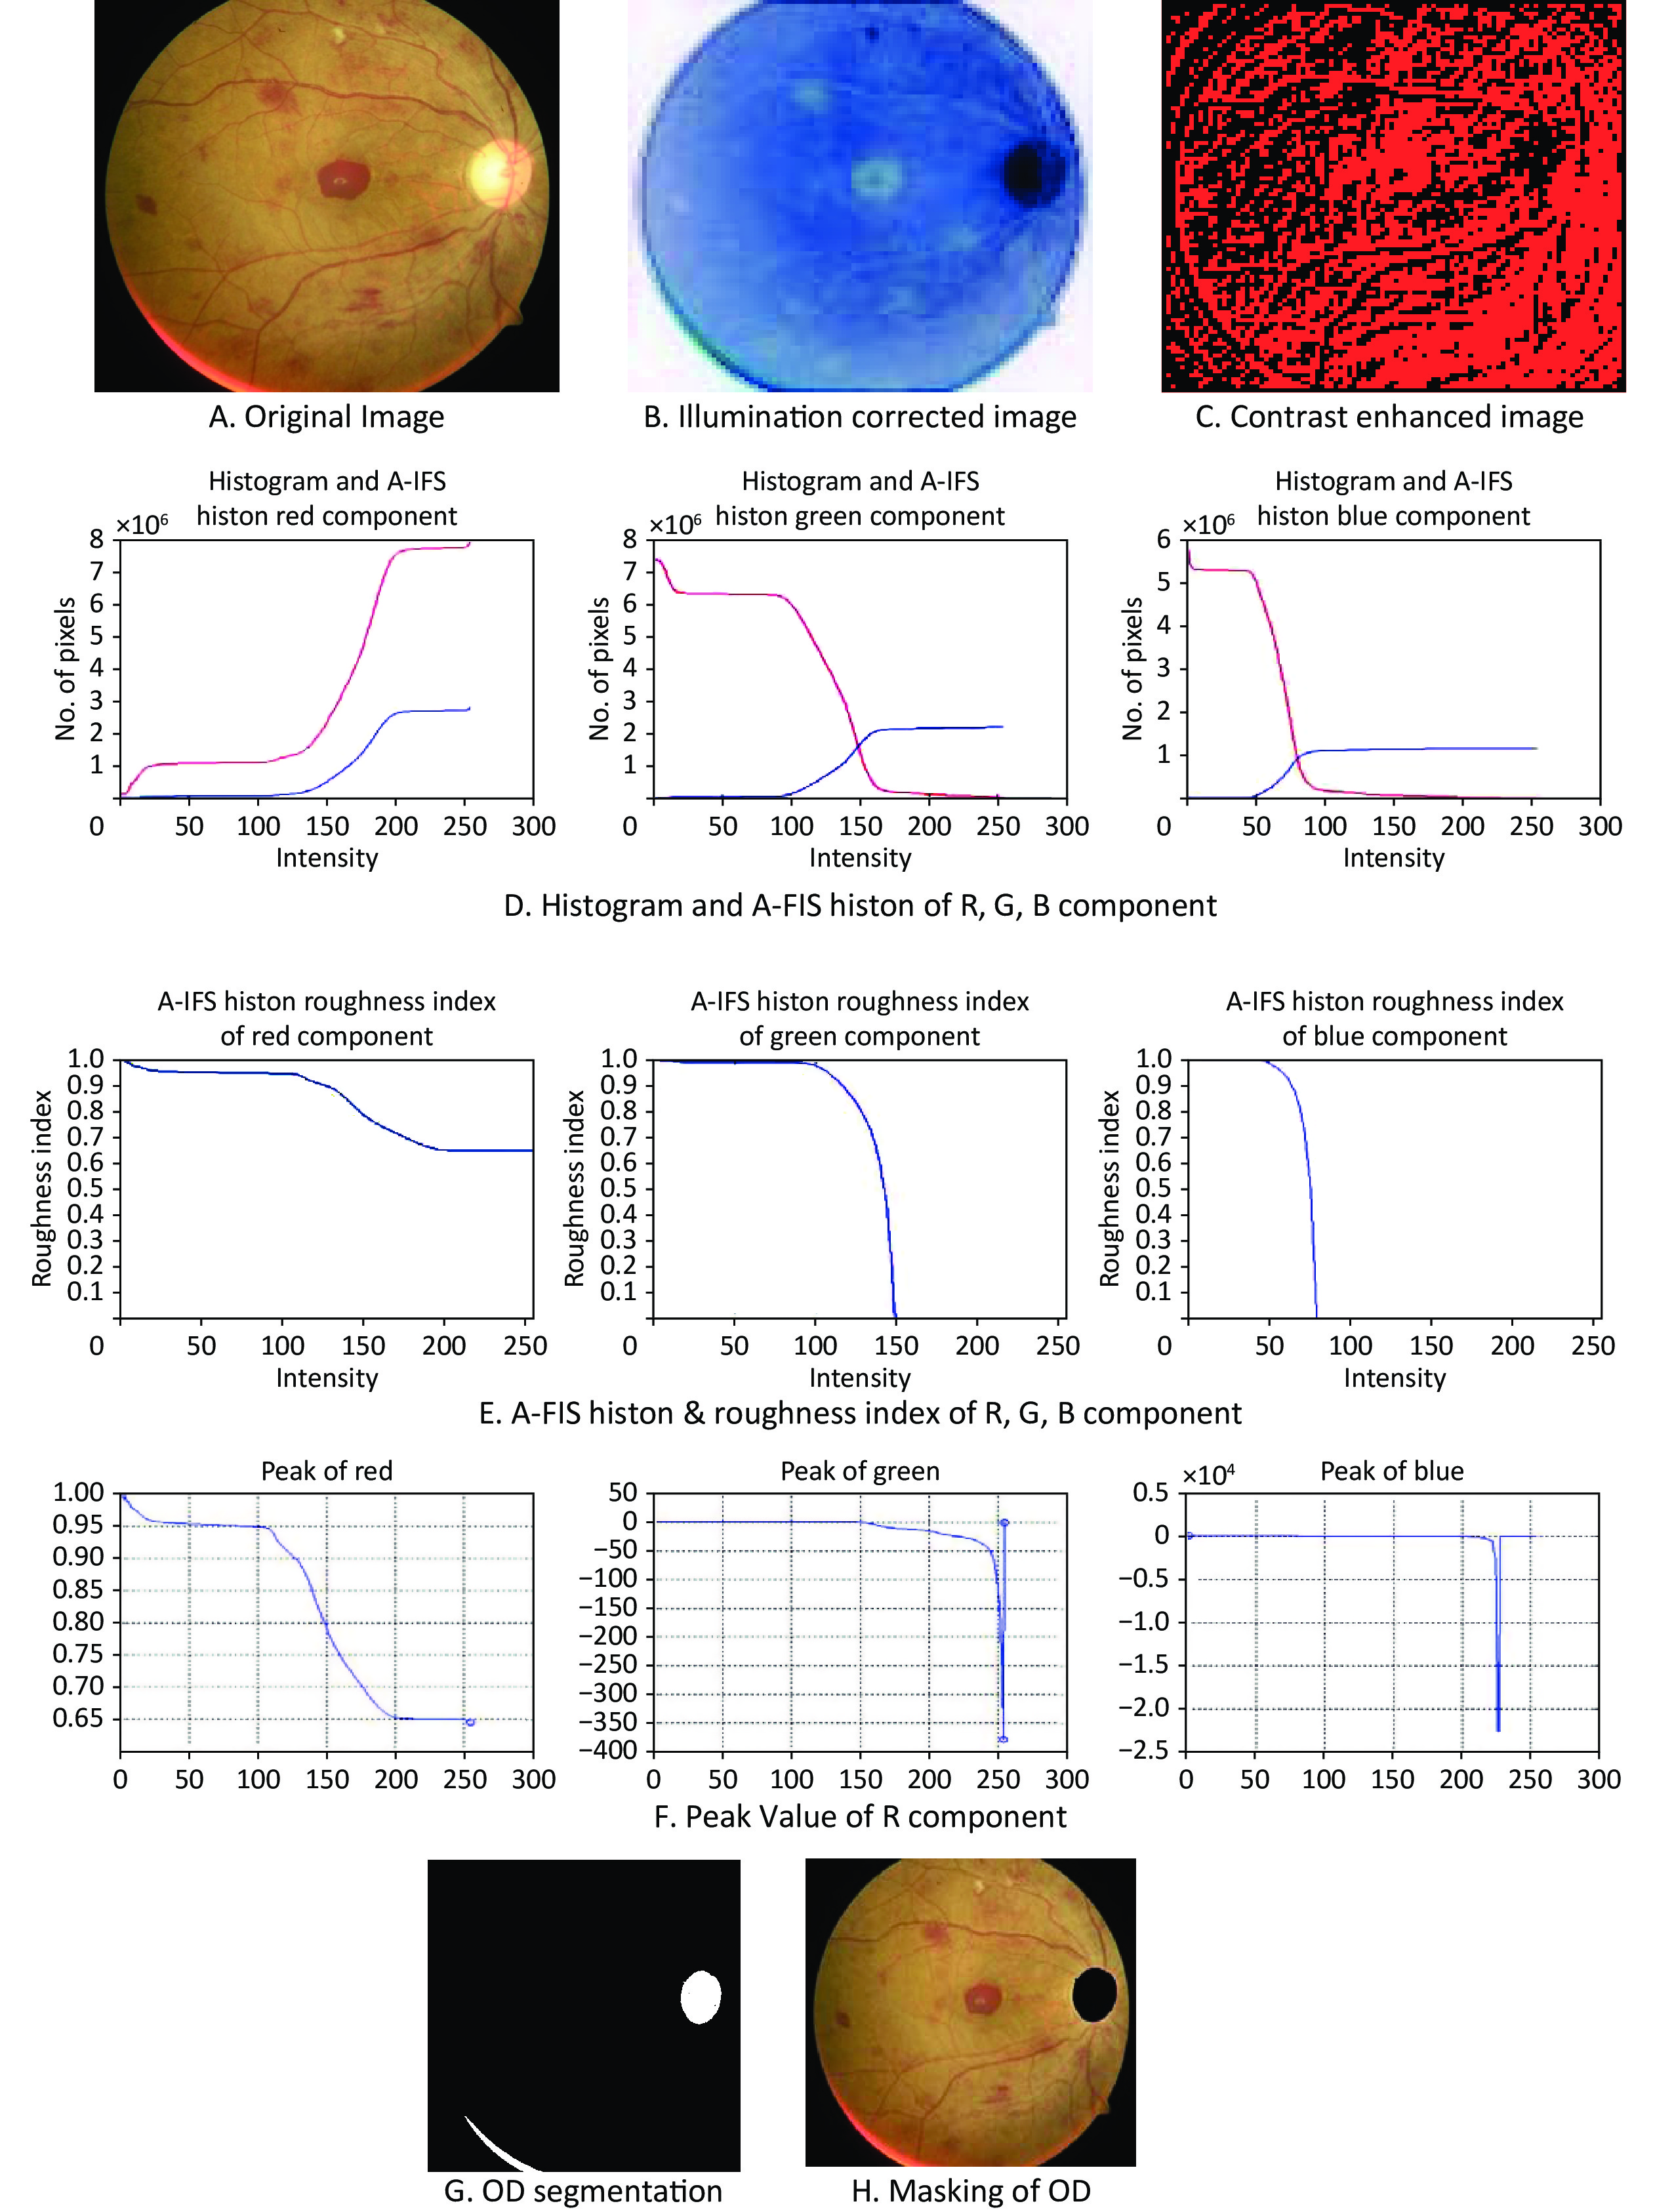
The input RGB image is pre-processed for noise, illumination and contrast enhancement by Weiner filter of 5 × 5, median filter, and mapping the intensity values from 0 to 255 respectively. The pre-handled RGB picture was changed to grayscale and utilized for additional preparation. The A-FIS is used to segment OD and described using two characteristic functions expressing the degree of membership and the degree of non-membership of elements. A-FIS histon consists of pixels that belong to the set of similar color pixels. The rough set theory is used to correlate upper and lower approximations of A-FIS histon. The histogram and roughness index were used to obtain the optimum threshold values for OD segmentation.
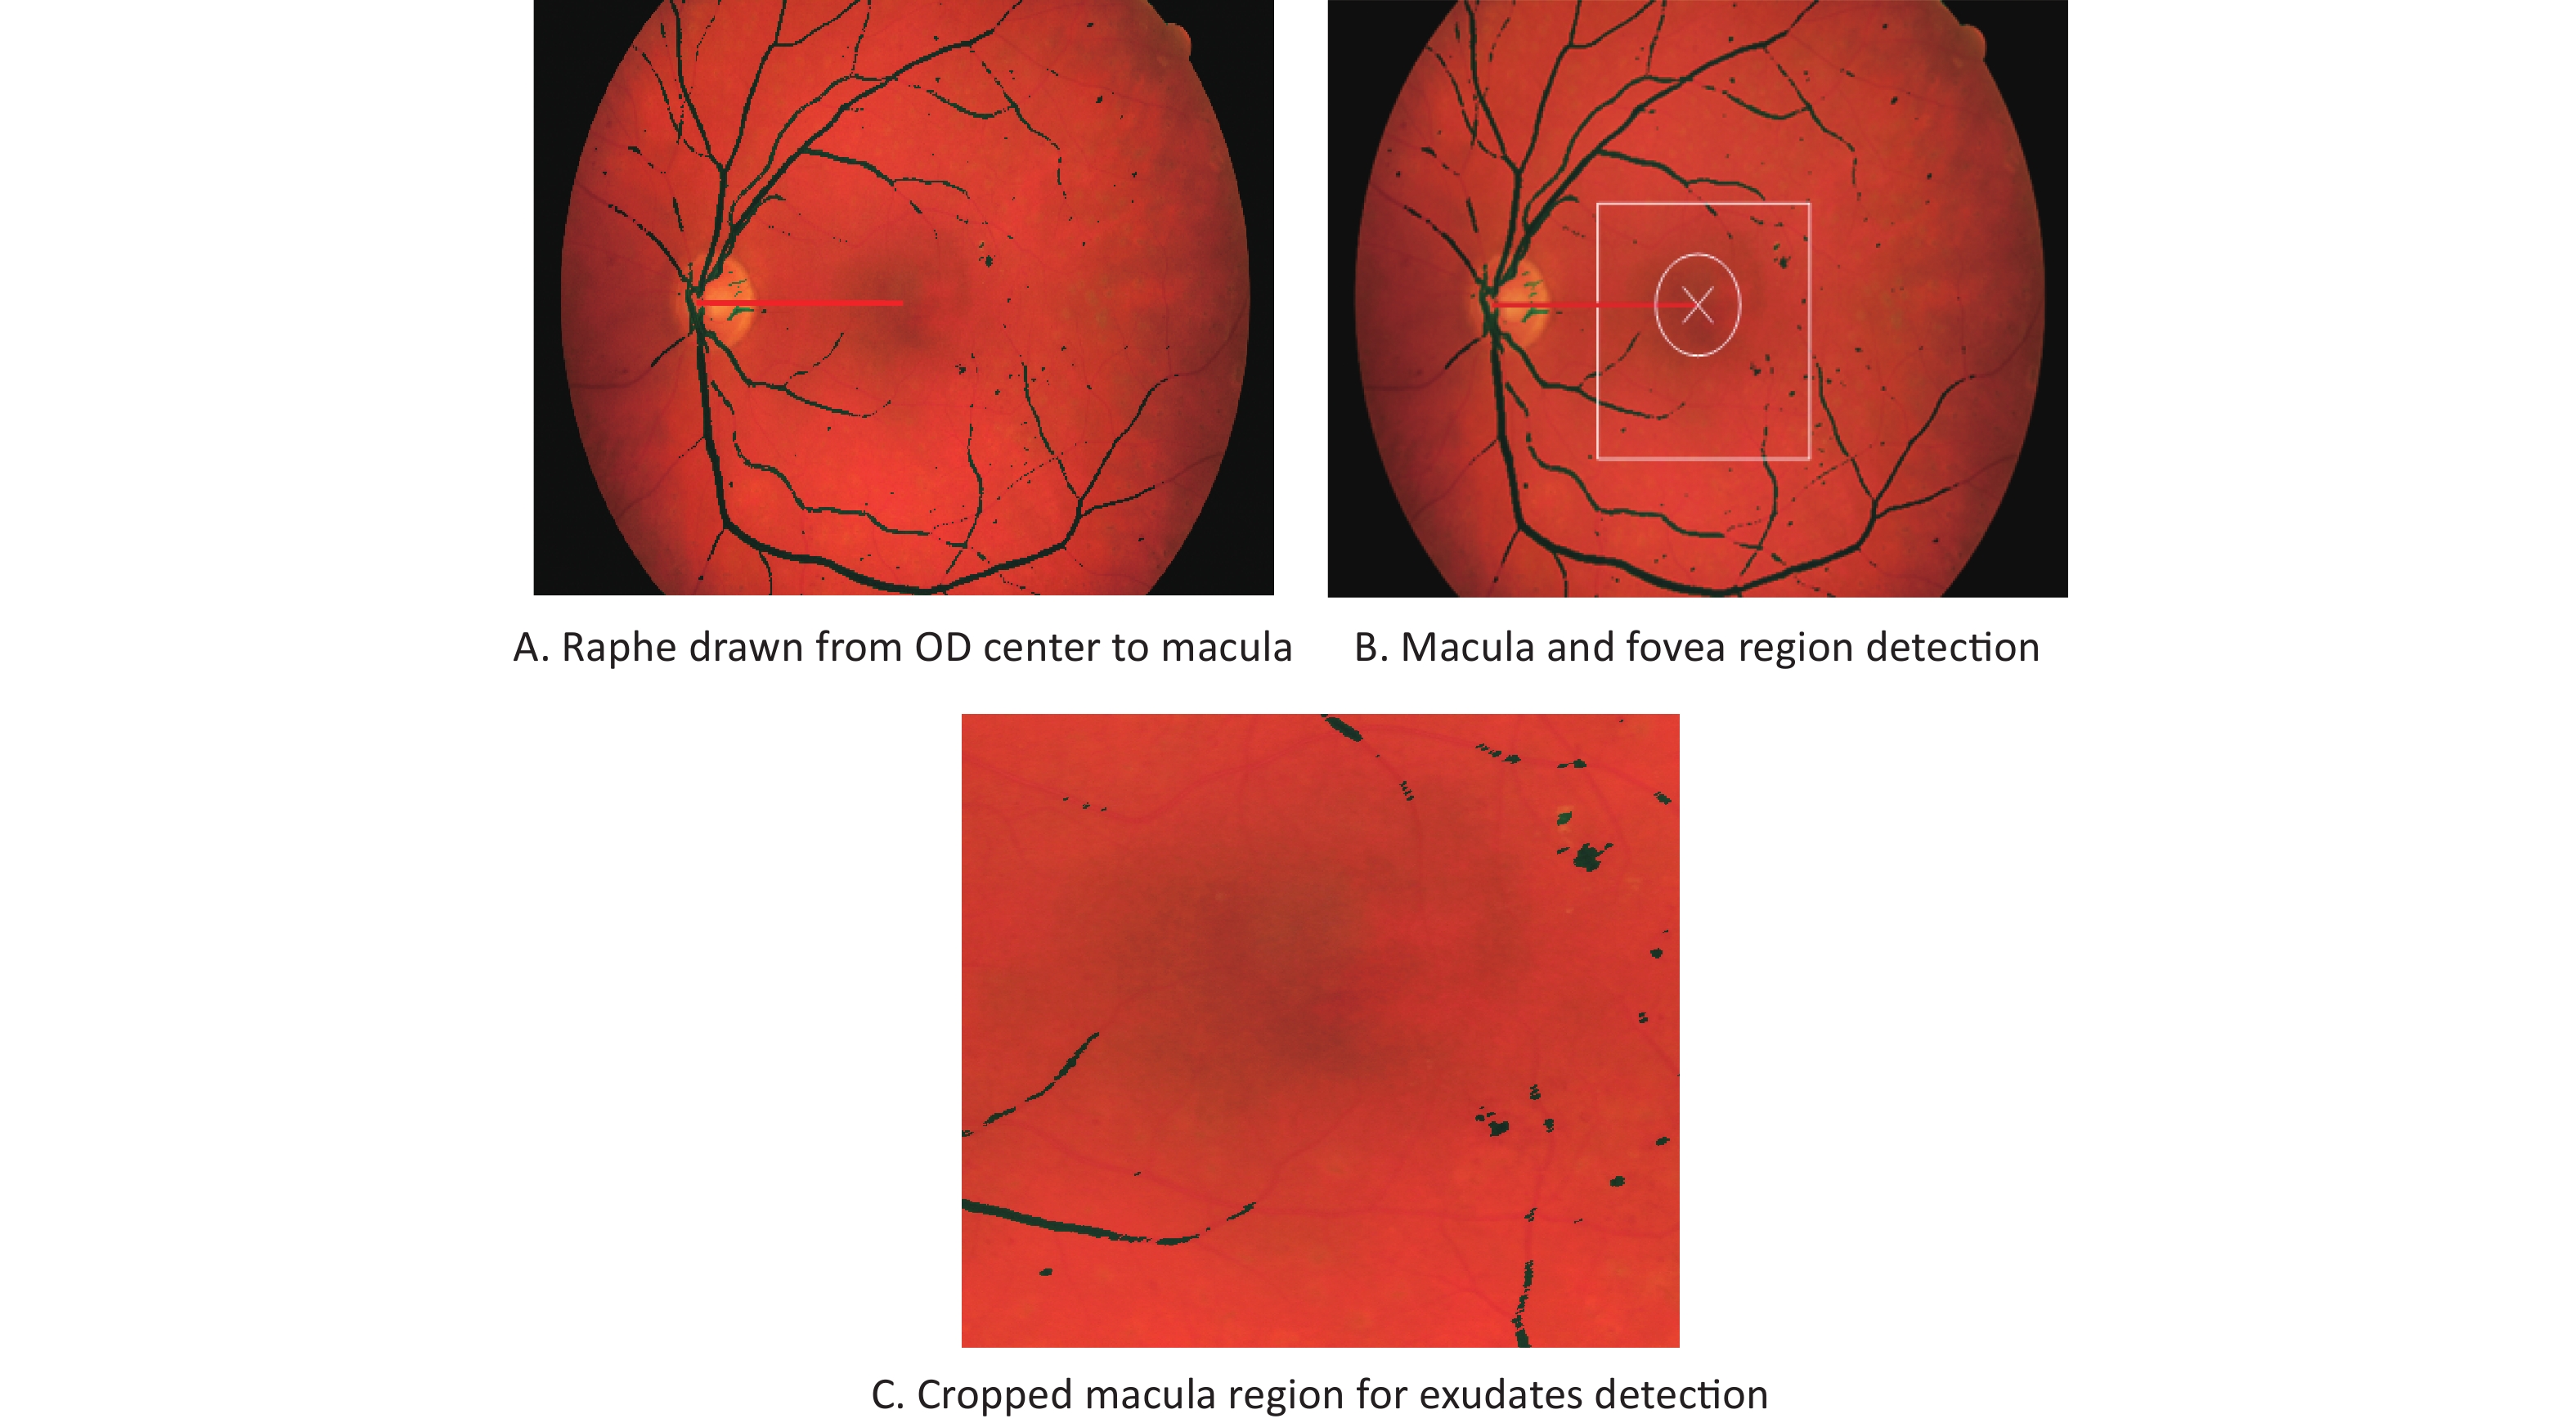
The BVs of the eye play a significant role in the sustenance of the eye. The site at which these BVs merge is the OD. BV is a significant retinal milestone in OD identification. On further thresholding, the major BVs are detached in a two-fold picture and then superimposed on an RGB picture. The center of the OD and center of the BV origin are taken as the OD co-ordinates XOD and YOD, respectively. The OD coordinates are utilized to draw the raphe. The raphe is drawn to reach the macular region which is the darkest region in the image, and the raphe separates the superior and inferior regions. This is the area with the highest number of cones and rods per unit area in the retina. The center darkest pixel of the macular region is called fovea. It will be located in the neighborhood of the OD, and it is responsible for central vision. The raphe drawn should be at a distance of 2.5 OD diameters (DOD) from the center of the OD in order to detect the fovea accurately. The fovea will be approximately 2 mm in diameter[9].
The resultant macula region image is segmented into seven clusters. It groups similar data into clusters. The membership grade is used to specify a degree of membership during each assignment of data to a cluster. Let it be considered that there is a collection of N data to be segmented into 7 classes or groups. It contains a membership matrix m of size 7 × N. The matrix element mij represents membership of the jth data Yj to class i. The following steps are performed to detect exudates in macula region [10].
For the proposed convolution neural network (CNN) model, input fundus images were enlarged to 224 × 224 pixels and cropped to 512 × 512 pixels. The images were scaled to 224 × 224 pixels because the original image size was too large for the CNN because of the high-power computations. The proposed model is a modified version of X ception with 85 layers and inputs of 1, convolution of 23, maximum activation (13), dense layers (1), dropout (1), pooling (12), add (11), and activation (23). The employed convolutional layers comprised (1,1) and (3,3) size filters using 64 to 1,024 filters across different network layers, as well as the Rectified Linear Unit (ReLU) function for triggering. The output from the preceding block was combined with the layers to reduce data loss in each block. By selecting the highest values from the processed photos, the max-pooling layer was used to spatially minimize the image dimension. Following the transformation, activation from the preceding layer was employed to maintain a mean activation close to 0 and a variance close to 1. Next, nonlinearity was added to the output from the previous step using the activation layer, whereas overfitting of the model was avoided using the dropout layer. The proposed model used a 0.2 drop rate with a global layer of max pool to convert a 3D output from the previous layer to a 2D output. In addition, a thick layer was used to create a completely connected network with a sigmoid-shaped activation function. Finally, the DME and normal pictures were distinguished using a logistic regression technique, with the optimizer and loss function being AdaDelta and binary cross-entropy, respectively.
The proposed technique was applied to retinal pictures in the HRF dataset using MATLAB on a PC-based framework. The qualitative and quantitative outcomes are presented in this subsection, and the advantages of the technique for the division and concealing of the OD are shown in Figure 1.

Figure 1. Results of optic disc segmentation and masking for DME detection. DME, diabetic macular edema
The macular and foveal findings are presented in Figure 2.
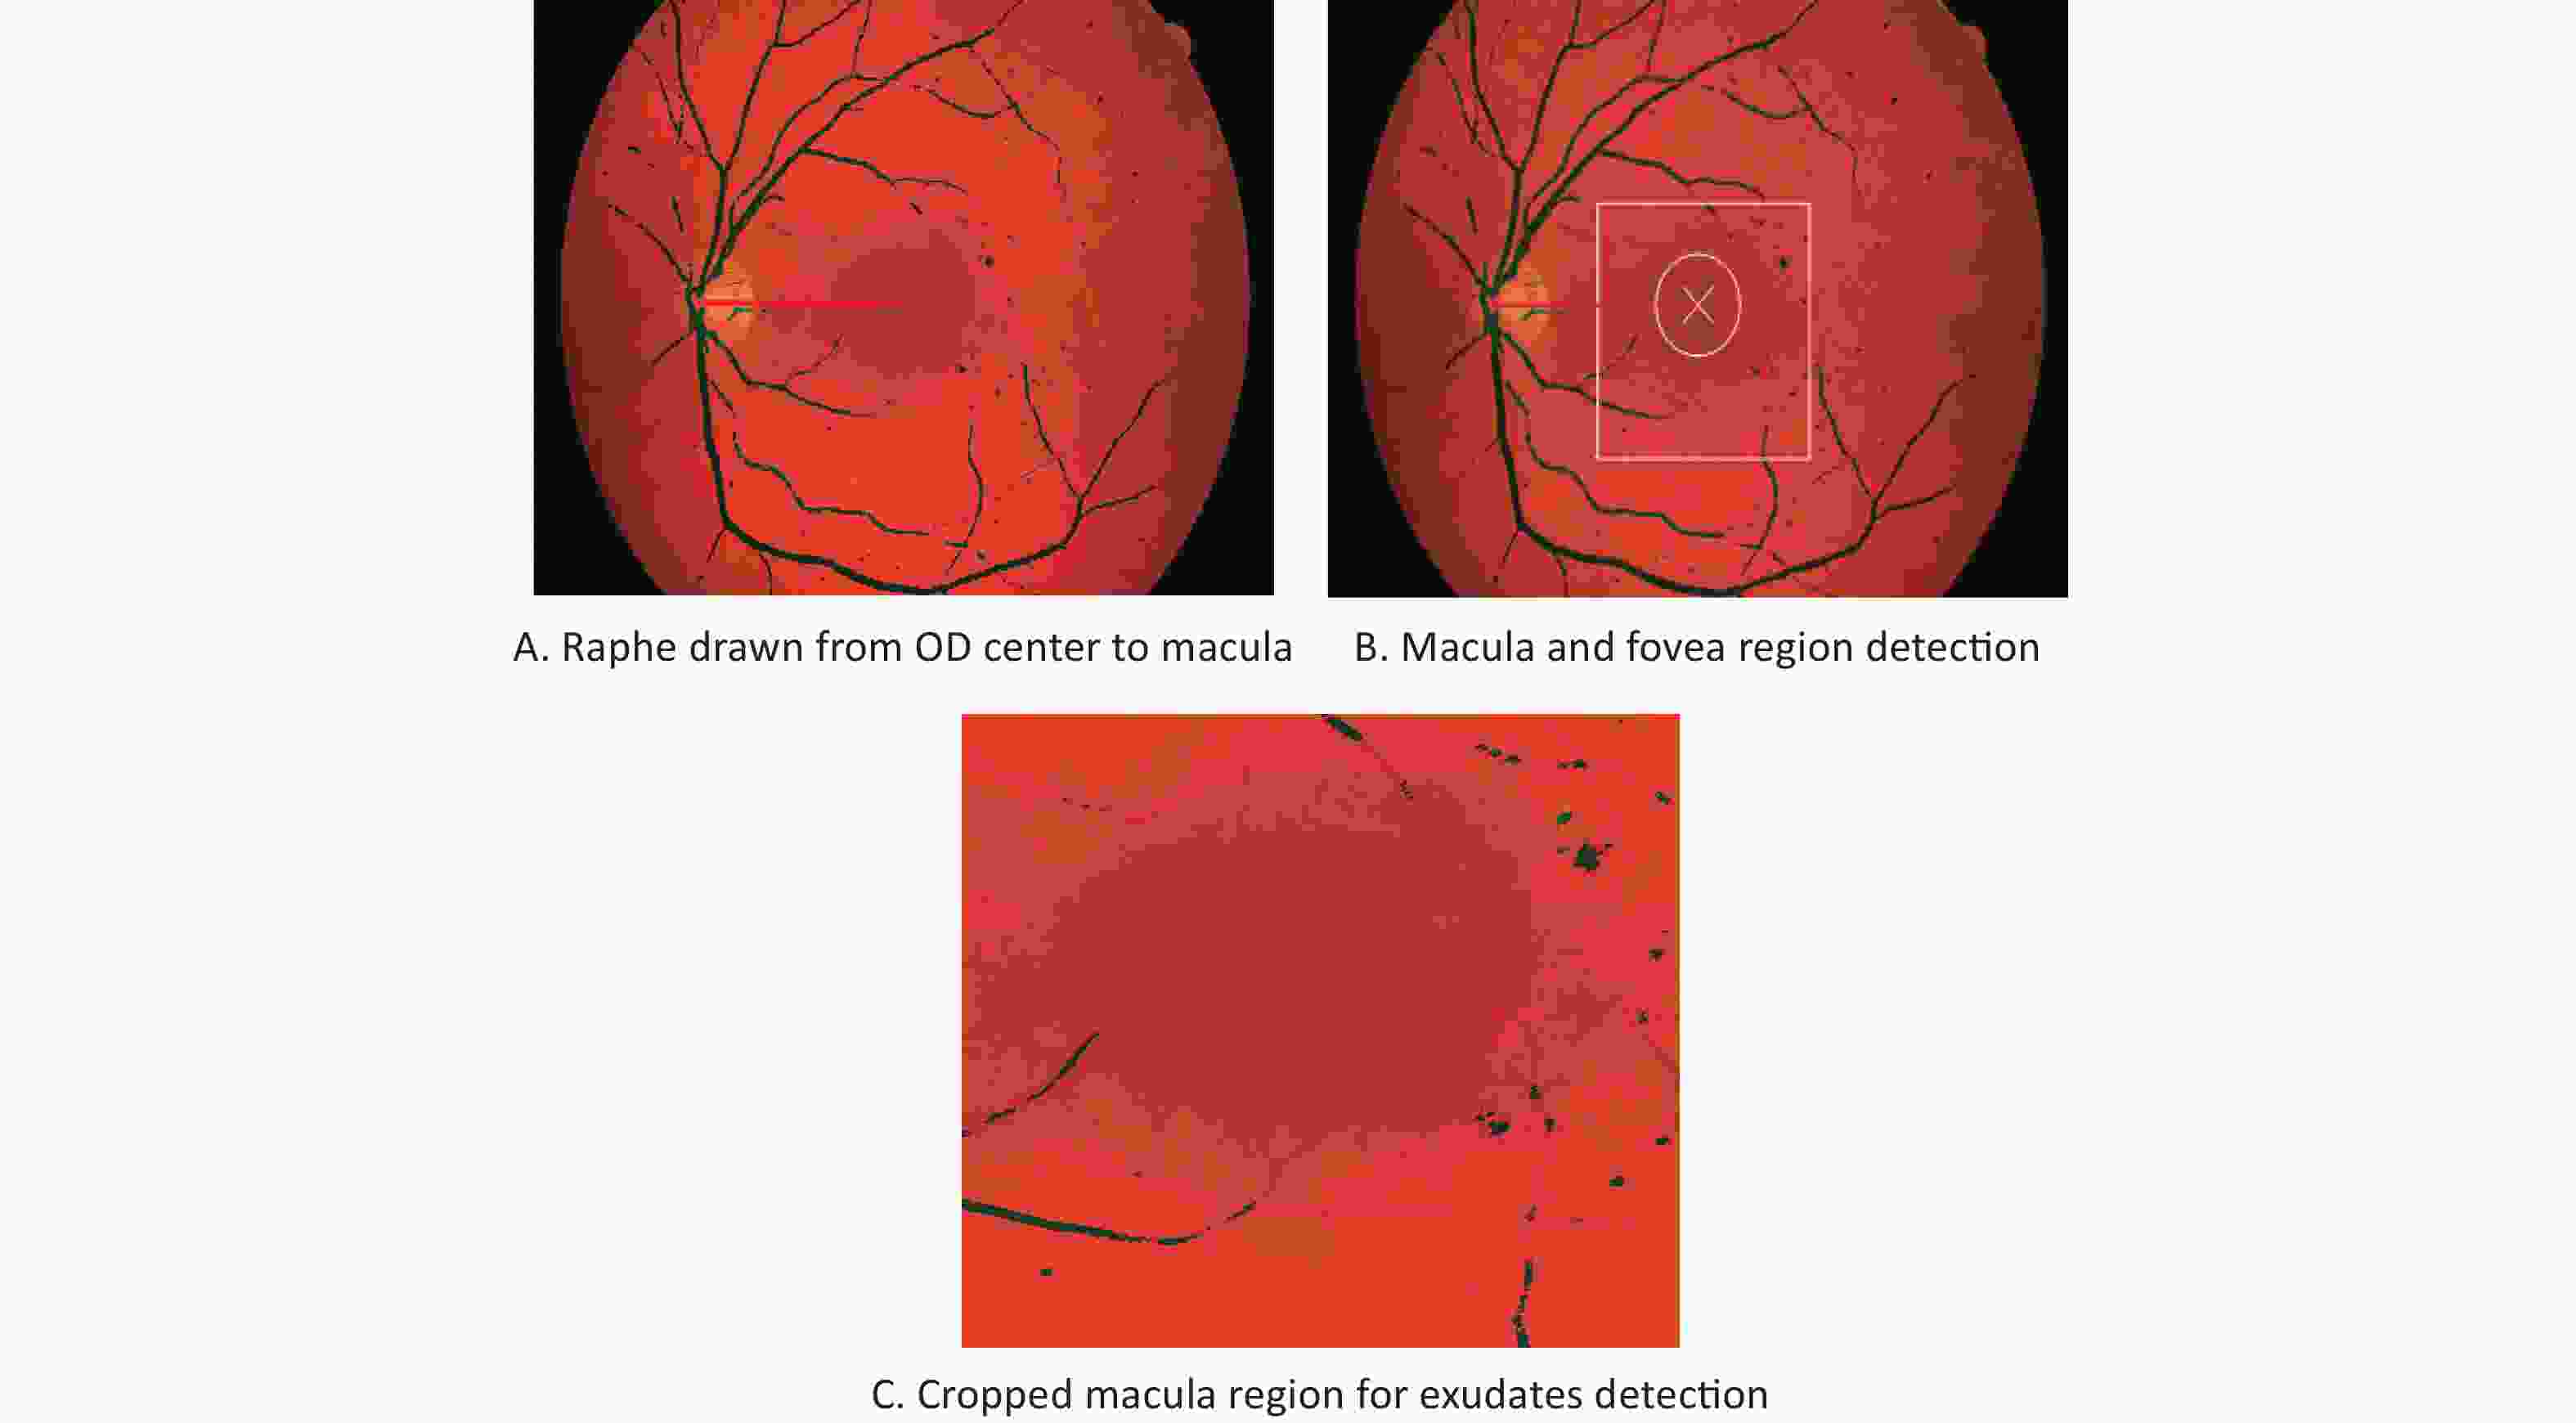
Figure 2. Results of macula and fovea detection in DME images.
The edge of the raphe is directed towards the fovea. The macular area is indicated using a square, which encases the haziest section of the fundus image. The cross indicates the raphe edge and is identified as the fovea, which is at 2.5 OD breadths, as shown in Figure 2B. The macular region was trimmed independently for additional preparation, as shown in Figure 2C.
The performance of the segmentation of the OD, EX, and recognition of the fovea was investigated quantitatively using different measures. Parameters, such as sensitivity (SE), specificity (SPE) and accuracy (ACC), were used to judge the performance of DME recognition. To quantify these boundaries, the divided OD and EXs were contrasted, and ground truth pictures were drawn with the assistance of a master ophthalmologist. In the event that the raphe distance attracted from OD focus to fovea focus (blunder) is inside 34 pixels, then, at that point the fovea is effectively distinguished. The presentation measures, such as SE, SPE, and ACC, were assessed for the proposed EX division calculation on retinal pictures. The results are presented in Table 1.
Table 1. Comparison of different EX segmentation method based on performance measures
Author name and year Algorithm SE (%) SPE (%) ACC (%) Santhi et al. 2014[11] FCM 73 97 95 k-means 88 95 95 k-means and morphology 96 91 91 Fuzzy 91 94 93 Proposed Method Gradient-based adaptive thresholding 98.2 97.4 99.23 Note. SE, sensitivity; SPE, specificity; ACC, accuracy; EX, exudate. The identification of DME in retinal pictures utilizing A-FIS calculation, raphe assessment, and slope-based versatile thresholding for the division of OD, EXs, and recognition of fovea is proposed in this work. The proposed technique was applied to different retinal pictures using MATLAB, and the results were introduced. The outcomes obtained for retinal pictures were contrasted with ground truth pictures based on the master ophthalmologist’s explanation. The SE, SPE, and ACC were assessed for OD and EX, and the segmentation of OD had an SE of 95.21%, SPE of 82.36%, and ACC of 99.21% utilizing A-FIS histon calculations. The segmentation of EXs had an SE of 98.2%, SPE of 97.4%, and ACC of 99.2% using angle-based versatile thresholding. The presentation measures were contrasted using different strategies.
Acknowledgment Author wish to thank her supervisor Dr. D. Manimegalai for her constant support and encouragement.
doi: 10.3967/bes2022.147
Identification and Prediction of Diabetic Macular Edema on Two-dimensional Fundus Images with Raphe Assessment and Deep Convolution Neural Networks
-
-
Figure 1. Results of optic disc segmentation and masking for DME detection. DME, diabetic macular edema
Table 1. Comparison of different EX segmentation method based on performance measures
Author name and year Algorithm SE (%) SPE (%) ACC (%) Santhi et al. 2014[11] FCM 73 97 95 k-means 88 95 95 k-means and morphology 96 91 91 Fuzzy 91 94 93 Proposed Method Gradient-based adaptive thresholding 98.2 97.4 99.23 Note. SE, sensitivity; SPE, specificity; ACC, accuracy; EX, exudate.  下载: 导出CSV
-
[1] Matsuda S, Tam T, Singh RP, et al. The impact of metabolic parameters on clinical response to VEGF inhibitors for diabetic macular edema. J Diabetes Complications, 2014; 28, 166−70. doi: 10.1016/j.jdiacomp.2013.11.009 [2] Garcia-Rubio YZ, Blanco-Hernández DMR, Lima-Gómez V. Expected effect of retinal thickness after focal photocoagulation in diabetic macular oedema. Cir Cir (Engl Ed), 2016; 84, 356−62. [3] Falavarjani KG, Tsui I, Sadda SR. Ultra-wide-field imaging in diabetic retinopathy. Vision Res, 2017; 139, 187−90. doi: 10.1016/j.visres.2017.02.009 [4] Mookiah MRK, Acharya UR, Fujita H, et al. Application of different imaging modalities for diagnosis of diabetic macular edema: a review. Comput Biol Med, 2015; 66, 295−315. doi: 10.1016/j.compbiomed.2015.09.012 [5] Au A, Singh RP. A multimodal approach to diabetic macular edema. J Diabetes Complications, 2016; 30, 545−53. doi: 10.1016/j.jdiacomp.2015.11.008 [6] Akram MU, Tariq A, Khan SA, et al. Automated detection of exudates and macula for grading of diabetic macular edema. Comput Methods Programs Biomed, 2014; 114, 141−52. doi: 10.1016/j.cmpb.2014.01.010 [7] Giancardo L, Meriaudeau F, Karnowski TP, et al. Exudate-based diabetic macular edema detection in fundus images using publicly available datasets. Med Image Anal, 2012; 16, 216−26. doi: 10.1016/j.media.2011.07.004 [8] Deepak KS, Sivaswamy J. Automatic assessment of macular edema from color retinal images. IEEE Trans Med Imaging, 2012; 31, 766−76. doi: 10.1109/TMI.2011.2178856 [9] Karkuzhali S, Manimegalai D. Robust intensity variation and inverse surface adaptive thresholding techniques for detection of optic disc and exudates in retinal fundus images. Biocybern Biomed Eng, 2019; 39, 753−64. doi: 10.1016/j.bbe.2019.07.001 [10] Suriyasekeran K, Santhanamahalingam S, Duraisamy M. Algorithms for diagnosis of diabetic retinopathy and diabetic macula edema-a review. In: Islam S. Diabetes: From Research to Clinical Practice. Springer, 2021; 357−73. [11] Santhi D, Manimegalai D, Karkuzhali S. Diagnosis of diabetic retinopathy by exudates detection using clustering techniques. Biomedical Engineering: Applications, Basis and Communications, 2014; 26, 1450077(1-13). -

 点击查看大图
图(2) / 表ll (1)
计量
- 文章访问数: 436
- HTML全文浏览量: 194
- PDF下载量: 53
- 被引次数: 0

 Quick Links