

 下载:
下载:

-
Depression is increasingly considered a public health problem; the total number of people living with depression worldwide in 2015 was 322 million, with a prevalence of 7.5% among females aged 55–74, and 5.5% among males[1]. Depression can lead to disability and cognitive decline and affect the quality of life of older adults[2]. Depressive disorders were the second leading cause of years lived with disability in 2010, and a leading cause of disability adjusted of life years [3]. Several lifestyle factors have been associated with depression, including poor diet [4], lack of physical activity [5], and obesity [6]. Notably, obesity is a major public health problem in China, and the latest national prevalence estimates for 2015 to 2019, based on criteria in China, were 34.3% for overweight adults and 16.4% for obese adults [7]. Several studies have investigated the association between obesity and depression in older adults, showing that obesity increases the incidence of depressive symptoms in older adults [8] and that initial levels of body mass index (BMI) and depressive symptoms correlate positively with each other [9]. However, findings on the relationship between obesity and depressive symptoms are inconsistent, and some studies have suggested that obesity or high BMI are protective factors for depression [10, 11]. In addition, the association between obesity and depression in older Chinese adults remains unclear.
The systemic inflammatory response is considered an important biological mechanism in the relationship between obesity and depression [12]. Chronic low-grade inflammation is a hallmark of obesity and a central pathophysiological process in depression [13]. High levels of C-reactive protein (CRP), a chronic marker of systemic inflammation [14], are associated with depression and high BMI [15]. However, some studies have suggested that the effect of systemic inflammation on depression is symptom-specific: positive for physical symptoms and negative for emotional symptoms [16].
To address these knowledge gaps, we investigated the association of obesity with depression in older adults and explored the role of systemic inflammation defined by CRP in this relationship using the Longitudinal Study of Disability and Cognitive Impairment.
-
Participants in this study were ≥ 65 years old, from the study of Surveillance and Management of Disability and Cognitive Impairment in older adults (SUM-DCI), which was established in 2018. One district/city each was selected from Liaoning province and Xinjiang Urgur Autonomous Region. In each district, two towns/streets were selected, where 500 subjects from each were recruited. A total of 1,973 subjects participated in the baseline survey, among which 1,459 were followed up in 2021.
The SUM-DCI study was approved by the Ethics Committee of the Chinese Center for Disease Control and Prevention. Written informed consent was obtained from all participants (or their proxies).
-
Depression was assessed using the geriatric depression scale-15 (GDS-15), a 15-item validated self-report questionnaire commonly used to measure depression in older adults [17], at baseline and at follow-up. Depression was defined as “yes” if the GDS score was ≥ 5 [18], and the change in the GDS score between baseline and follow-up was calculated; the highest quartile of change (≥ 2 points increase in GDS score) was defined as “worsening depressive symptoms” [19].
GDS-15 can be explained by three sub-dimensions, including general depressive affect [general depressive affect (GDA), seven items], life satisfaction [life satisfaction (LS), four items], and withdrawal [withdrawal (W), three items], with one item of “memory problems” omitted because it attributed to the aging process [20]. The detailed items for the GDA were as follows: 1) life is empty; 2) often get bored; 3) afraid something bad will happen; 4) often feeling helpless; 5) feeling worthless; 6) situation is hopeless; and 7) most people are better off than you are. The items included in LS are as follows: 1) satisfied with life; 2) in good spirits; 3) happy most of the time; and 4) wonderful to be alive now. The items for W were as follows: 1) dropped activities and interests; 2) preferred to stay at home; and 3) feeling full of energy.
-
Weight, height, and waist circumference (WC) were measured twice using standard methods, BMI was calculated as weight in kilograms divided by height in meters squared. General obesity was defined as a BMI ≥ 28.0, overweight as 24 ≤ BMI < 28.0, normal weight as 18.5 ≤ BMI < 24.0, and underweight as BMI ≤ 18.5. Abdominal obesity was defined using waist circumference, considering the criterion of ≥ 90 cm for males and ≥ 85 cm for females [21].
-
Chronic systemic inflammation was assessed using high-sensitivity CRP (hs-CRP). Fasting venous blood samples were collected, and serum was used to assess the baseline levels of hs-CRP and fasting plasma glucose (FPG) using a commercially available diagnostic kit (Roche Diagnostics, Mannheim, Germany) with an Automatic Biochemistry Analyzer (Hitachi 7180, Japan). High level of hs-CRP was defined as hs-CRP > 3 mg/L [22, 23].
The covariates included sociodemographics (age, sex, education level, marital status, living arrangement, and home income), lifestyle (smoking, exercise, and tea drinking), social activities, diabetes, hypertension, and sleep disturbance. Living arrangements were classified as “living alone” or not. Marital status was dichotomized as “yes” if the participant was currently married, and “no” if they were divorced, widowed, or never married. Social activity was assessed by asking the following questions: 1) How often did you do the following activities: a) going for outdoor activities and b) joining organized activities? The answers were measured on a scale from 1 to 5, such that: 1, almost everyday; 2, not every day but ≥ 1 time/week; 3, < 1 time/week but ≥ 1 time/month; 4, sometimes; and 5, never. We dichotomized responses for the above individual activities into two categories: “yes” if the answer was “almost every day” or “not every day but ≥ 1 time/week”, and “no” if the answer was any of the remaining activity levels; 2) “How many times did you travel in the past two years?” were defined as “yes” if the answer was once or more. A positive answer to any of the three types of social activities was coded as “yes.” High income was defined as a high tertile of home income per year. Systolic blood pressure (SBP) and diastolic blood pressure (DBP) were measured twice using the right arm, and the mean values were used. Hypertension was defined when SBP was ≥ 140 mmHg and/or DBP was ≥ 90 mmHg and/or self-reported diagnosis in hospital. Diabetes was defined as FPG ≥ 7.0 mmol/L and/or self-reported diagnosis in hospital [24]. Participants reported their sleep symptoms during the last month for at least 3 days each week, using the following questions: 1) “Taking > 30 min to fall asleep after going to bed?” (difficulty in initiating sleep); 2) “Waking up in the middle of the night two times or more?” (difficulty in maintaining sleep); and 3) “Waking up early and not being able to go back to sleep?” (early-morning waking), and sleep disturbance was defined if any response to the questions above was “yes” [25].
-
Participant characteristics by follow-up status and sex were compared using chi-square tests for categorical variables and t-tests for continuous variables, except for scores of GDS, GDA, LS, and W, which were all skewed distributed and shown as median values (M) and interquartile ranges (IQR). The four scores by follow-up status and sex were compared using Wilcoxon rank-sum non-parametric tests. The number of underweight participants was quite small (n = 30); therefore, underweight participants were not included in subsequent statistical analysis, which meant that the final sample size in subsequent statistical analysis was 1,429 of whom 1,085 subjects were free of depression at baseline. To explore the association between obesity and depression, logistic regression was used to analyze the odds ratio (OR) and 95% confidence interval (CI) of obesity for worsening depressive symptoms and incident depression. Three models were fit as follows: Model 1 was adjusted for baseline GDS score alone; Model 2 was further adjusted for age, sex, education level, marital status, living alone, and home income; and Model 3 was further adjusted for smoking, exercise, tea drinking, social activities, diabetes, hypertension, and sleep disturbance. The associations between obesity and depression among male and female participants were explored using logistic regression analysis.
To explore the possible role of CRP in the association between obesity and depression, we first explored the association between obesity and CRP levels using logistic regression, in which high CRP levels were used as dependent variables. We further explored the associations of CRP levels at baseline (independent variable) with GDS score and the scores of its three dimensions (GDA, LS, and W) at follow-up, as well as with score differences between baseline and follow-up, using linear regression models in which scores of GDS, GDA, LS, and W were transformed to log (1+Y) when scores at follow-up were investigated, and CRP level was transformed to log (X), considering of the skewed distribution of these variables. Data were shown as β (95% CI), representing change of log (1+Y) or Difference between baseline and follow-up for one unit of log (X). Notably, age, sex, education level, marital status, smoking, exercise, tea drinking, social activities, diabetes, hypertension, and sleep disturbance were adjusted for.
All statistical analyses were performed using SAS, version 9.4 (SAS Institute Inc., Cary, NC, USA). P < 0.05 was considered statistically significant; all P-values were two-sided.
-
The characteristics of the participants by followed up status and sex are listed in Table 1. No significant difference was observed between the subjects who were followed up and those who were lost, except that those who were lost to follow-up had fewer years of education and a slightly higher GDS score. Among the followed up subjects, compared with female participants, male participants were more likely to be educated, married, and wealthy, and usually reported a high prevalence of smoking and tea drinking, more social activities, and a lower prevalence of hypertension, sleep disturbance, and living alone.
Table 1. Characteristics of study participants by psychological resilience status
Characteristics Total Followed up Lost Male Female P-value No. of subjects 1,459 605 854 514 Age (years), mean (SD) 70.94 (4.24) 71.27 (4.31) 70.70 (4.17) 0.01 71.10 Education years* 0 202 (13.85) 42 (6.94) 160 (18.74) < 0.001 99 (19.26) 1–6 478 (32.76) 185 (30.58) 293 (34.31) 166 (32.30) > 6 779 (53.39) 378 (62.48) 401 (46.96) 249 (48.44) Married 1,118 (76.63) 553 (91.40) 565 (66.16) < 0.001 382 (74.32) Living alone 214 (14.67) 47 (7.77) 167 (19.56) < 0.001 85 (16.54) High income 513 (35.16) 240 (39.67) 273 (31.97) 0.002 164 (31.91) Smoking 190 (13.02) 187 (30.91) 3 (0.35) < 0.001 79 (15.37) Tea drinking 219 (15.01) 147 (24.30) 72 (8.43) < 0.001 61 (11.87) Exercise 1,043 (71.49) 434 (71.74) 609 (71.31) 0.86 372 (72.37) Social activities 1,334 (91.43) 567 (93.72) 767 (89.81) 0.009 465 (90.47) Hypertension 611 (41.88) 221 (36.53) 390 (45.67) 0.0005 203 (39.49) Diabetes 258 (17.68) 101 (16.69) 157 (18.38) 0.40 97 (18.87) Sleep disturbance 772 (52.91) 280 (46.28) 492 (57.61) < 0.001 264 (51.36) General obesity Underweight 30 (2.06) 11 (1.82) 19 (2.22) 0.66 19 (3.70) Normal weight 479 (32.83) 196 (32.40) 283 (33.14) 0.49 172 (33.46) Overweight 650 (44.55) 280 (46.28) 370 (43.33) 215 (41.83) Obesity 300 (20.56) 118 (19.50) 182 (21.31) 108 (21.01) Abdominal obesity 791 (54.22) 323 (53.39) 468 (54.80) 0.59 281 (54.67) Baseline scores GDS* 2 (1, 4) 2 (1, 4) 2 (1, 5) 0.22 3 (1, 5) GDA 0 (0, 1) 0 (0, 1) 0 (0, 2) 0.005 0 (0, 2) LS 1 (1, 1) 1 (1, 1) 1 (1, 1) 0.31 1 (1, 1) W 0 (0, 1) 0 (0, 1) 0 (0, 1) 0.15 1 (0, 1) Follow-up scores GDS 3 (2, 5) 3 (2, 5) 3 (2, 5) 0.34 − GDA 1(0, 2) 1 (0, 2) 1 (0, 2) 0.08 − LS 1 (1.1) 1 (1, 1) 1 (1, 1) 0.40 − W 1 (0.1) 1 (0, 1) 1 (0, 1) 0.60 − Note. Data were shown as n (%) for categorical variables and as x (s) for continuous variables. *The difference between the subjects who were followed up and those lost to follow-up was statistically significant (P < 0.05). The GDS, GDA, LS, and W scores were shown as M (IQR). GDS, geriatric depression scale; GDA, general depressive affect; LS, life satisfaction; W, withdrawal. Compared with the group of normal weight, those obesity subjects were significantly more likely to have “worsening depressive symptoms,” with OR (95% CI) of 1.42 (1.02–1.98); among those depression-free participants at baseline, the risk of incident depression at follow-up was also significantly increased, with OR (95% CI) of 1.65 (1.10–2.47). However, abdominal obesity was not statistically associated with the worsening of depressive symptoms or the incidence of depression (Table 2).
Table 2. Association of obesity with worsen depressive symptom and incident depression
Obesity status Model 1 Model 2 Model 3 Worsen depressive symptoms (n = 1,429) General obesity Normal weight 1.00 (reference) 1.00 (reference) 1.00 (reference) Overweight 1.00 (0.76, 1.30) 0.98 (0.75, 1.29) 0.97 (0.74, 1.29) Obesity 1.53 (1.13, 2.12)** 1.43 (1.03, 1.97)* 1.42 (1.02, 1.98)* Abdominal obesity No 1.00 (reference) 1.00 (reference) 1.00 (reference) Yes 1.13 (0.86, 1.47) 1.08 (0.83, 1.42) 1.10 (0.83, 1.44) Incident depression (n = 1,085) General obesity Normal weight 1.00 (reference) 1.00 (reference) 1.00 (reference) Overweight 1.09 (0.78, 1.51) 1.06 (0.76, 1.49) 1.05 (0.75, 1.48) Obesity 1.80 (1.23, 2.63)** 1.68 (1.14, 2.47)** 1.65 (1.10, 2.47)** Abdominal obesity No 1.00 (reference) 1.00 (reference) 1.00 (reference) Yes 1.05 (0.76, 1.45) 0.99 (0.71, 1.38) 0.99 (0.71, 1.39) Note. *P < 0.05, **P < 0.01. Model 1: adjusted for baseline GDS score alone; Model 2: additionally adjusted for age, sex, education level, marital status, living alone, and home income; and Model 3: further adjusted for smoking, exercise, tea drinking, social activities, diabetes, hypertension, and sleep disturbance. We further conducted analyses among male and female subjects separately and observed that the association of general obesity with worsening depressive symptoms and incident depression existed in male participants alone, with OR (95% CI) of 2.08 (1.27–3.42) and 2.12 (1.20–3.74), respectively. However, abdominal obesity was not significantly associated with depression in either sex (Table 3).
Table 3. Association of obesity with worsening depressive symptoms and incident depression among male and female participants
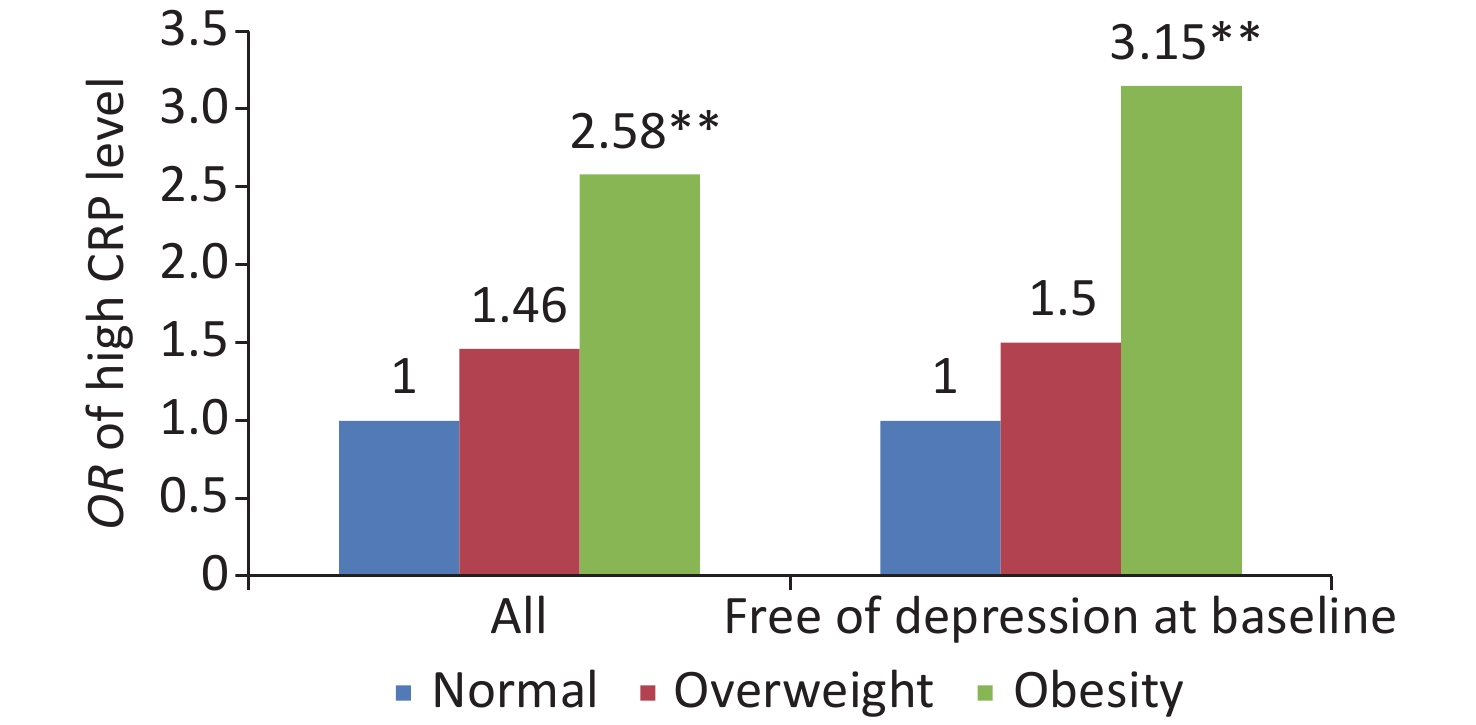
Obesity status Male Female Model 1 Full model Model 1 Full model Worsening depressive symptoms General obesity Normal weight 1.00 (reference) 1.00 (reference) 1.00 (reference) 1.00 (reference) Overweight 1.38 (0.92, 2.08) 1.42 (0.93, 2.19) 0.78 (0.55, 1.10) 0.73 (0.51, 1.06) Obesity 2.08 (1.27, 3.42)** 2.12 (1.25, 3.58)* 1.24 (0.82, 1.89) 1.05 (0.67, 1.64) Abdominal obesity No 1.00 (reference) 1.00 (reference) 1.00 (reference) 1.00 (reference) Yes 1.10 (0.74, 1.63) 1.08 (0.72, 1.63) 1.14 (0.80, 1.63) 1.11 (0.76, 1.62) Incident depression General obesity Normal weight 1.00 (reference) 1.00 (reference) 1.00 (reference) 1.00 (reference) Overweight 1.05 (0.64, 1.74) 1.07 (0.63, 1.81) 1.11 (0.72, 1.72) 1.04 (0.66, 1.65) Obesity 2.12 (1.20, 3.74)** 2.24 (1.22,4.11)** 1.56 (0.93, 2.61) 1.24 (0.71, 2.15) Abdominal obesity No 1.00 (reference) 1.00 (reference) 1.00 (reference) 1.00 (reference) Yes 1.01 (0.63, 1.62) 1.01 (0.62, 1.67) 1.09 (0.70, 1.70) 1.02 (0.64, 1.63) Note. Data were presented as OR (95% CI). Model 1: adjusted for baseline GDS score alone; Full model: additionally adjusted for age, sex, education level, marital status, living alone, home income, smoking, exercise, tea drinking, social activities, diabetes, hypertension, and sleep disturbances. *P < 0.05, **P < 0.01. Analysis revealed that general obesity was associated with high level of CRP (Linear trend, P < 0.001), with OR (95% CI) of 2.58 (1.75–3.81) in all the followed up subjects, and among the participants free of depression at baseline, the results were consistent, with OR (95% CI) of 3.15 (1.97–5.04) (Figure 1).
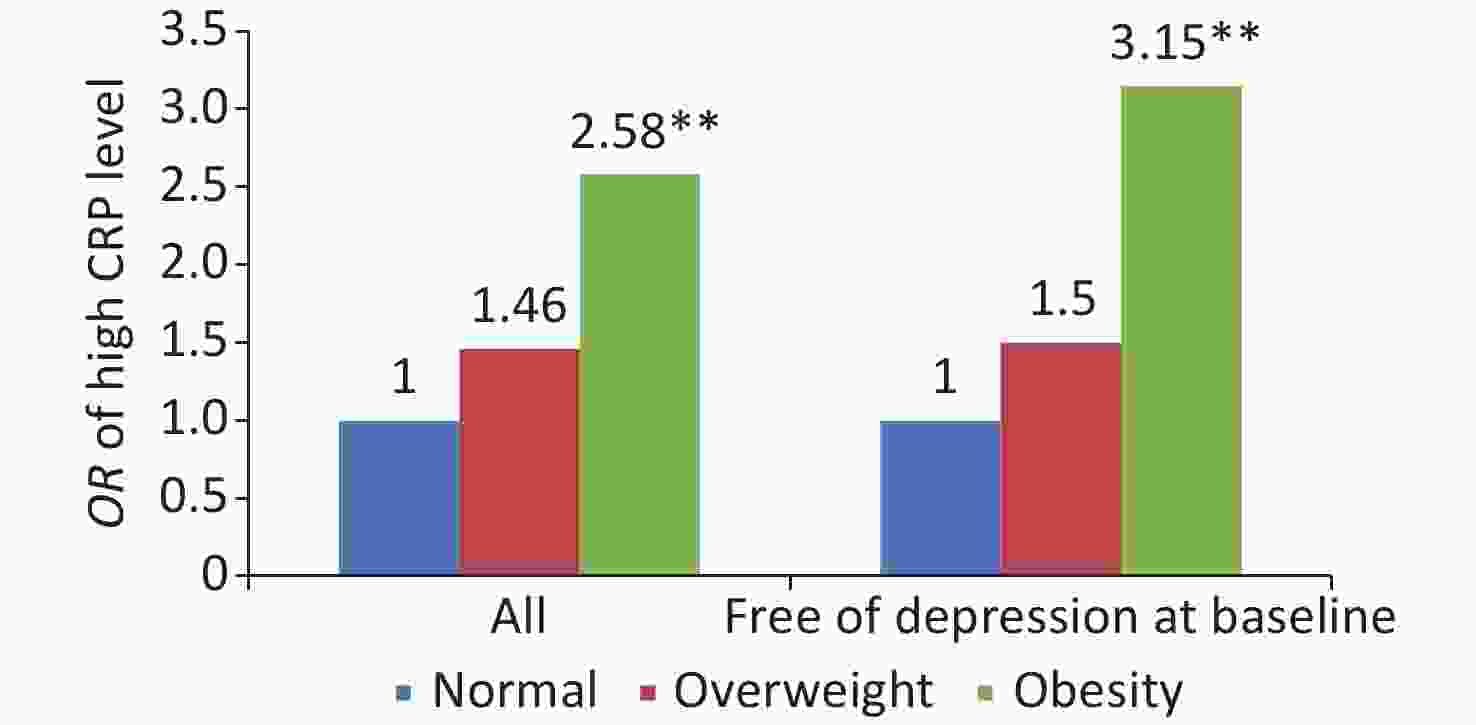
Figure 1. Odds ratio of high CRP levels by general obesity status. **P < 0.01.
The results revealed that the baseline CRP levels were not significantly associated with the GDS score at follow-up (P > 0.05) or with the score difference between baseline and follow-up (P > 0.05). However, it was significantly positively related with LS score (P < 0.05), specific dimension of depression, with β (95% CI) of was 0.015 (0.001, 0.03) and 0.018 (0.002, 0.03) among all participants and subjects free of depression at baseline, respectively, for score at follow-up; and for score difference between baseline and follow-up, the β was 0.04. No significant associations were observed between the CRP levels and GDA or W (Table 4).
Table 4. Associations of baseline CRP levels with scores of GDS and its dimensions
GDS and
dimensionsScore at follow-up Difference between baseline and follow-up All followed up Free of depression at baseline All followed up Free of depression at baseline GDS 0.003 (−0.02,0.03) 0.001 (−0.03, 0.03) −0.012 (−0.16, 0.13) −0.010 (−0.16, 0.14) GDA −0.002 (−0.03, 0.03) −0.005 (−0.04, 0.03) 0.039 (−0.003, 0.08) 0.034 (−0.009, 0.08) LS 0.015 (0.001, 0.03)* 0.018 (0.002, 0.03)* 0.038 (0.006, 0.07)* 0.039 (0.005, 0.07)* W −0.016 (−0.04, 0.01) −0.022 (-0.05, 0.01) −0.028 (−0.07, 0.02) −0.036 (−0.08, 0.01) Note. GDS, geriatric depression scale; GDA, general depressive affect; LS, life satisfaction; W, withdrawal. Data were shown as β (95% CI). In the linear regression models, CRP level were transformed to log (X) and included as independent variable; and GDS, GDA, LS, and W scores were transformed into log (1+Y) values and included as dependent variable, when scores at follow-up were investigated. *P < 0.05. -
This study revealed that general, rather than abdominal, obesity was positively associated with an increased risk of incident depression and worsening depressive symptoms in older adults, which was consistent with the findings of other studies. Previous studies have reported that increased BMI is predictive of a chronic course of depression [13] and that obese people have higher levels of depressive symptoms than those with normal weight [26]. One meta-analysis review revealed that obese adults have a 23%–36% increased risk of self-reporting depression symptoms as compared with non-obese subjects [27], and a Mendelian randomization study with a large sample found that a high BMI was strongly associated with a higher risk of depression and likely to have a causal role in the relationship [28].
However, there were some inconsistent results, which suggested that obesity was a protective factor for depression [29, 30]. A meta-analysis conducted by Yu et al. also concluded that older adults who were overweight and obese, defined by BMI, were less likely to be depressed than those with normal weight [31], supporting the "jolly fat" hypothesis. One possible explanation for this inconsistency is the differences in age, socioeconomic status, ethnicity, and culture [32].
An interesting finding in the present study was that obesity was associated with an increased risk of depression in older male adults alone, which was consistent with previous studies that found that older men with obesity had a 31% increase in the risk of depression [33], and no significant associations between depression and obesity based on BMI and WC were observed in Chinese female adults [34]. In older females, adipose tissue is the primary source of estrogen production [35], and the levels of estrogen in obese older women are much higher than those in non-obese women, and estrogen can help decrease the risk of depression in females [36, 37]. A higher level of estrogen may partly offset the risk of depression from obesity, leading to a less pronounced association between obesity and depression in older adults. However, other studies conducted in both American and Korean adults concluded that a positive association between obesity and depression was observed in women but not in men [38, 39], in which the mean age of subjects was < 60 years; therefore, the age differences of participants may elucidate the gender differences in the results of different studies.
We did not observe a relationship between abdominal obesity and worsening depressive symptoms or the incidence of depression, which was consistent with one meta-analysis [31] and a 10-year follow-up study that focused on older adults [40]. Some studies have concluded that abdominal obesity was positively associated with depression; however, majority of these studies were conducted in Western countries [41], perhaps because of ethnic differences that confounded the relationship between depression and abdominal obesity [42].
The current study showed that CRP levels were more likely to be higher in obese older adults, which was consistent with other studies that reported higher levels of CRP in obese people than in normal or lean people [43]. Obesity may cause metabolic disturbances associated with increased levels of subclinical chronic inflammation, such as increased serum CRP levels [44]. CRP was thought to be a candidate biomarker for depression and is commonly elevated in the serum of patients [45]. We found that the risk of high CRP levels did not increase in the overweight group, which partly explains why being overweight was not significantly associated with depression.
Interestingly, we also observed that increased CRP levels were negatively associated with life satisfaction, a specific dimension of depression but not with the overall GDS score. Previous studies have also revealed that increased CRP levels were strongly associated with reduced quality of life [46] and life satisfaction [47] but not with emotional symptoms [15]. Chronic low-grade inflammation may be a biological mechanism underlying depression. Long-term chronic inflammation can lead to damage and dysfunction of neuronal networks [48] and an inflammatory response can result in an overactive hypothalamic-pituitary-adrenal axis and neurodegeneration, leading to depression [49]. However, the relationship between psychiatric disorders and metabolic syndrome is complex [50], and leptin resistance may be another mechanism by which obesity leads to depression [32]. A previous study showed that downregulation of leptin/LepRb signaling may be associated with depression-like behavior in obese rats [51].
The strengths of the current study are as follows. First, this was a 3-year prospective cohort study, which can better explore the relationship between obesity and depression. Second, both general and abdominal obesity were investigated, and many confounding variables were adjusted for. Finally, we investigated the possible role of chronic inflammation in the relationship between obesity and depression. However, there were also several limitations. First, the criteria in China for obesity status were used, meaning that the results could not be generalized to other ethnic groups. Second, depressive symptoms were self-reported using the GDS and not clinically interviewed, which may introduce some recall bias; however, the GDS was widely used in community-dwelling older people and has good reliability. Finally, we had no data on antidepressant drug treatment, whereas obesity was shown to be related to the incidence of depression among those free of depression at baseline, which meant that antidepressant drugs were less likely to be a major source of confounding.
-
Our findings suggest that general obesity, but not abdominal obesity, is associated with worsening depressive symptoms and incident depression, which can be partly explained by the systemic inflammatory response defined by CRP levels. Interventions for obesity and its underlying correlations may be beneficial for the prevention and treatment of depression.
doi: 10.3967/bes2023.059
Obesity is positively Associated with Depression in Older Adults: Role of Systemic Inflammation
-
Abstract:
Objective We aimed to explore the association between obesity and depression and the role of systemic inflammation in older adults. Methods Adults ≥ 65 years old (n = 1,973) were interviewed at baseline in 2018 and 1,459 were followed up in 2021. General and abdominal obesity were assessed, and serum C-reactive protein (CRP) levels were measured at baseline. Depression status was assessed at baseline and at follow-up. Logistic regression was used to analyze the relationship between obesity and the incidence of depression and worsening of depressive symptoms, as well as the relationship between obesity and CRP levels. The associations of CRP levels with the geriatric depression scale, as well as with its three dimensions, were investigated using multiple linear regressions. Results General obesity was associated with worsening depression symptoms and incident depression, with an odds ratio (OR) [95% confidence interval (CI)] of 1.53 (1.13–2.12) and 1.80 (1.23–2.63), especially among old male subjects, with OR (95% CI) of 2.12 (1.25–3.58) and 2.24 (1.22–4.11), respectively; however, no significant relationship was observed between abdominal obesity and depression. In addition, general obesity was associated with high levels of CRP, with OR (95% CI) of 2.58 (1.75–3.81), especially in subjects free of depression at baseline, with OR (95% CI) of 3.15 (1.97–5.04), and CRP levels were positively correlated with a score of specific dimension (life satisfaction) of depression, P < 0.05. Conclusion General obesity, rather than abdominal obesity, was associated with worsening depressive symptoms and incident depression, which can be partly explained by the systemic inflammatory response, and the impact of obesity on depression should be taken more seriously in the older male population. -
Key words:
- Depression /
- Obesity /
- Older adults /
- Body mass index /
- Inflammatory reaction
The authors declare no conflict of interest.
注释:1) AUTHOR CONTRIBUTIONS: 2) CONFLICT OF INTEREST: -
Table 1. Characteristics of study participants by psychological resilience status
Characteristics Total Followed up Lost Male Female P-value No. of subjects 1,459 605 854 514 Age (years), mean (SD) 70.94 (4.24) 71.27 (4.31) 70.70 (4.17) 0.01 71.10 Education years* 0 202 (13.85) 42 (6.94) 160 (18.74) < 0.001 99 (19.26) 1–6 478 (32.76) 185 (30.58) 293 (34.31) 166 (32.30) > 6 779 (53.39) 378 (62.48) 401 (46.96) 249 (48.44) Married 1,118 (76.63) 553 (91.40) 565 (66.16) < 0.001 382 (74.32) Living alone 214 (14.67) 47 (7.77) 167 (19.56) < 0.001 85 (16.54) High income 513 (35.16) 240 (39.67) 273 (31.97) 0.002 164 (31.91) Smoking 190 (13.02) 187 (30.91) 3 (0.35) < 0.001 79 (15.37) Tea drinking 219 (15.01) 147 (24.30) 72 (8.43) < 0.001 61 (11.87) Exercise 1,043 (71.49) 434 (71.74) 609 (71.31) 0.86 372 (72.37) Social activities 1,334 (91.43) 567 (93.72) 767 (89.81) 0.009 465 (90.47) Hypertension 611 (41.88) 221 (36.53) 390 (45.67) 0.0005 203 (39.49) Diabetes 258 (17.68) 101 (16.69) 157 (18.38) 0.40 97 (18.87) Sleep disturbance 772 (52.91) 280 (46.28) 492 (57.61) < 0.001 264 (51.36) General obesity Underweight 30 (2.06) 11 (1.82) 19 (2.22) 0.66 19 (3.70) Normal weight 479 (32.83) 196 (32.40) 283 (33.14) 0.49 172 (33.46) Overweight 650 (44.55) 280 (46.28) 370 (43.33) 215 (41.83) Obesity 300 (20.56) 118 (19.50) 182 (21.31) 108 (21.01) Abdominal obesity 791 (54.22) 323 (53.39) 468 (54.80) 0.59 281 (54.67) Baseline scores GDS* 2 (1, 4) 2 (1, 4) 2 (1, 5) 0.22 3 (1, 5) GDA 0 (0, 1) 0 (0, 1) 0 (0, 2) 0.005 0 (0, 2) LS 1 (1, 1) 1 (1, 1) 1 (1, 1) 0.31 1 (1, 1) W 0 (0, 1) 0 (0, 1) 0 (0, 1) 0.15 1 (0, 1) Follow-up scores GDS 3 (2, 5) 3 (2, 5) 3 (2, 5) 0.34 − GDA 1(0, 2) 1 (0, 2) 1 (0, 2) 0.08 − LS 1 (1.1) 1 (1, 1) 1 (1, 1) 0.40 − W 1 (0.1) 1 (0, 1) 1 (0, 1) 0.60 − Note. Data were shown as n (%) for categorical variables and as x (s) for continuous variables. *The difference between the subjects who were followed up and those lost to follow-up was statistically significant (P < 0.05). The GDS, GDA, LS, and W scores were shown as M (IQR). GDS, geriatric depression scale; GDA, general depressive affect; LS, life satisfaction; W, withdrawal.  下载: 导出CSV
Table 2. Association of obesity with worsen depressive symptom and incident depression
Obesity status Model 1 Model 2 Model 3 Worsen depressive symptoms (n = 1,429) General obesity Normal weight 1.00 (reference) 1.00 (reference) 1.00 (reference) Overweight 1.00 (0.76, 1.30) 0.98 (0.75, 1.29) 0.97 (0.74, 1.29) Obesity 1.53 (1.13, 2.12)** 1.43 (1.03, 1.97)* 1.42 (1.02, 1.98)* Abdominal obesity No 1.00 (reference) 1.00 (reference) 1.00 (reference) Yes 1.13 (0.86, 1.47) 1.08 (0.83, 1.42) 1.10 (0.83, 1.44) Incident depression (n = 1,085) General obesity Normal weight 1.00 (reference) 1.00 (reference) 1.00 (reference) Overweight 1.09 (0.78, 1.51) 1.06 (0.76, 1.49) 1.05 (0.75, 1.48) Obesity 1.80 (1.23, 2.63)** 1.68 (1.14, 2.47)** 1.65 (1.10, 2.47)** Abdominal obesity No 1.00 (reference) 1.00 (reference) 1.00 (reference) Yes 1.05 (0.76, 1.45) 0.99 (0.71, 1.38) 0.99 (0.71, 1.39) Note. *P < 0.05, **P < 0.01. Model 1: adjusted for baseline GDS score alone; Model 2: additionally adjusted for age, sex, education level, marital status, living alone, and home income; and Model 3: further adjusted for smoking, exercise, tea drinking, social activities, diabetes, hypertension, and sleep disturbance.
下载: 导出CSV
Table 3. Association of obesity with worsening depressive symptoms and incident depression among male and female participants
Obesity status Male Female Model 1 Full model Model 1 Full model Worsening depressive symptoms General obesity Normal weight 1.00 (reference) 1.00 (reference) 1.00 (reference) 1.00 (reference) Overweight 1.38 (0.92, 2.08) 1.42 (0.93, 2.19) 0.78 (0.55, 1.10) 0.73 (0.51, 1.06) Obesity 2.08 (1.27, 3.42)** 2.12 (1.25, 3.58)* 1.24 (0.82, 1.89) 1.05 (0.67, 1.64) Abdominal obesity No 1.00 (reference) 1.00 (reference) 1.00 (reference) 1.00 (reference) Yes 1.10 (0.74, 1.63) 1.08 (0.72, 1.63) 1.14 (0.80, 1.63) 1.11 (0.76, 1.62) Incident depression General obesity Normal weight 1.00 (reference) 1.00 (reference) 1.00 (reference) 1.00 (reference) Overweight 1.05 (0.64, 1.74) 1.07 (0.63, 1.81) 1.11 (0.72, 1.72) 1.04 (0.66, 1.65) Obesity 2.12 (1.20, 3.74)** 2.24 (1.22,4.11)** 1.56 (0.93, 2.61) 1.24 (0.71, 2.15) Abdominal obesity No 1.00 (reference) 1.00 (reference) 1.00 (reference) 1.00 (reference) Yes 1.01 (0.63, 1.62) 1.01 (0.62, 1.67) 1.09 (0.70, 1.70) 1.02 (0.64, 1.63) Note. Data were presented as OR (95% CI). Model 1: adjusted for baseline GDS score alone; Full model: additionally adjusted for age, sex, education level, marital status, living alone, home income, smoking, exercise, tea drinking, social activities, diabetes, hypertension, and sleep disturbances. *P < 0.05, **P < 0.01.
下载: 导出CSV
Table 4. Associations of baseline CRP levels with scores of GDS and its dimensions
GDS and
dimensionsScore at follow-up Difference between baseline and follow-up All followed up Free of depression at baseline All followed up Free of depression at baseline GDS 0.003 (−0.02,0.03) 0.001 (−0.03, 0.03) −0.012 (−0.16, 0.13) −0.010 (−0.16, 0.14) GDA −0.002 (−0.03, 0.03) −0.005 (−0.04, 0.03) 0.039 (−0.003, 0.08) 0.034 (−0.009, 0.08) LS 0.015 (0.001, 0.03)* 0.018 (0.002, 0.03)* 0.038 (0.006, 0.07)* 0.039 (0.005, 0.07)* W −0.016 (−0.04, 0.01) −0.022 (-0.05, 0.01) −0.028 (−0.07, 0.02) −0.036 (−0.08, 0.01) Note. GDS, geriatric depression scale; GDA, general depressive affect; LS, life satisfaction; W, withdrawal. Data were shown as β (95% CI). In the linear regression models, CRP level were transformed to log (X) and included as independent variable; and GDS, GDA, LS, and W scores were transformed into log (1+Y) values and included as dependent variable, when scores at follow-up were investigated. *P < 0.05.
下载: 导出CSV
-
[1] World Health Organization. Depression and other common mental disorders: global health estimates. https://www.who.int/publications/i/item/depression-global-health-estimates, (accessed on 2017). [2023-1-7]. [2] Maes M. Effects of age and gender on the classification and phenomenology of unipolar depression. Acta Neuropsychiatr, 2002; 14, 29−35. doi: 10.1034/j.1601-5215.2002.140104.x [3] Ferrari AJ, Charlson FJ, Norman RE, et al. Burden of depressive disorders by country, sex, age, and year: findings from the global burden of disease study 2010. PLoS Med, 2013; 10, e1001547. doi: 10.1371/journal.pmed.1001547 [4] Opie RS, Itsiopoulos C, Parletta N, et al. Dietary recommendations for the prevention of depression. Nutr Neurosci, 2017; 20, 161−71. doi: 10.1179/1476830515Y.0000000043 [5] Slomski A. Even low amounts of physical activity reduce depression risk. JAMA, 2022; 327, 2066. [6] Fulton S, Décarie-Spain L, Fioramonti X, et al. The menace of obesity to depression and anxiety prevalence. Trends Endocrinol Metab, 2022; 33, 18−35. doi: 10.1016/j.tem.2021.10.005 [7] Pan XF, Wang LM, Pan A. Epidemiology and determinants of obesity in China. Lancet Diabetes Endocrinol, 2021; 9, 373−92. doi: 10.1016/S2213-8587(21)00045-0 [8] Goes VF, Wazlawik E, D'orsi E, et al. Severe obesity increases the prevalence but not the incidence of depressive symptoms in the elderly-population-based cohort in Southern Brazil. Int Psychogeriatr, 2017; 29, 1307−16. doi: 10.1017/S1041610216002246 [9] Konttinen H, Kiviruusu O, Huurre T, et al. Longitudinal associations between depressive symptoms and body mass index in a 20-year follow-up. Int J Obes, 2014; 38, 668−74. doi: 10.1038/ijo.2013.151 [10] Huang C, Kogure M, Tomata Y, et al. Association of serum adiponectin levels and body mass index with worsening depressive symptoms in elderly individuals: a 10-year longitudinal study. Aging Ment Health, 2020; 24, 725−31. doi: 10.1080/13607863.2019.1584877 [11] Qian JH, Li NX, Ren XH. Obesity and depressive symptoms among Chinese people aged 45 and over. Sci Rep, 2017; 7, 45637. doi: 10.1038/srep45637 [12] Frank P, Jokela M, Batty GD, et al. Overweight, obesity, and individual symptoms of depression: a multicohort study with replication in UK Biobank. Brain Behav Immun, 2022; 105, 192−200. doi: 10.1016/j.bbi.2022.07.009 [13] Milaneschi Y, Simmons WK, Van Rossum EFC, et al. Depression and obesity: evidence of shared biological mechanisms. Mol Psychiatry, 2019; 24, 18−33. doi: 10.1038/s41380-018-0017-5 [14] Cao MY, Liu D, Zhang XY, et al. Association of C-reactive protein with cardiovascular outcomes: a mendelian randomization study in the Japanese Population. Biomed Environ Sci, 2022; 35, 126−32. [15] Ambrósio G, Kaufmann FN, Manosso L, et al. Depression and peripheral inflammatory profile of patients with obesity. Psychoneuroendocrinology, 2018; 91, 132−41. doi: 10.1016/j.psyneuen.2018.03.005 [16] Frank P, Jokela M, Batty GD, et al. Association between systemic inflammation and individual symptoms of depression: a pooled analysis of 15 population-based cohort studies. Am J Psychiatry, 2021; 178, 1107−18. doi: 10.1176/appi.ajp.2021.20121776 [17] Almeida OP, Almeida SA. Short versions of the geriatric depression scale: a study of their validity for the diagnosis of a major depressive episode according to ICD-10 and DSM-IV. Int J Geriatr Psychiatry, 1999; 14, 858−65. doi: 10.1002/(SICI)1099-1166(199910)14:10<858::AID-GPS35>3.0.CO;2-8 [18] Nyunt MSZ, Fones C, Niti M, et al. Criterion-based validity and reliability of the Geriatric Depression Screening Scale (GDS-15) in a large validation sample of community-living Asian older adults. Aging Ment Health, 2009; 13, 376−82. doi: 10.1080/13607860902861027 [19] Maglione JE, Ancoli-Israel S, Peters KW, et al. Subjective and objective sleep disturbance and longitudinal risk of depression in a cohort of older women. Sleep, 2014; 37, 1179−87. [20] Zhao HF, He JY, Yi JY, et al. Factor structure and measurement invariance across gender groups of the 15-item geriatric depression scale among Chinese Elders. Front Psychol, 2019; 10, 1360. doi: 10.3389/fpsyg.2019.01360 [21] Chen CM, Lu FC. The guidelines for prevention and control of overweight and obesity in Chinese adults. Biomed Environ Sci, 2004; 17 Suppl, 1-36. [22] Ridker PM. Clinical application of C-reactive protein for cardiovascular disease detection and prevention. Circulation, 2003; 107, 363−9. doi: 10.1161/01.CIR.0000053730.47739.3C [23] Chou MH, Yang YK, Wang JD, et al. Elevated C-reactive protein levels modify the effect of magnesium on depressive symptoms: a population-based study. Nutrients, 2023; 15, 1560. doi: 10.3390/nu15071560 [24] Yin ZX, Chen J, Zhang J, et al. Dietary patterns associated with cognitive function among the older people in underdeveloped regions: finding from the NCDFaC study. Nutrients, 2018; 10, 464. doi: 10.3390/nu10040464 [25] Yu CQ, Shi ZM, Lv J, et al. Dietary patterns and insomnia symptoms in Chinese adults: the China Kadoorie Biobank. Nutrients, 2017; 9, 232. doi: 10.3390/nu9030232 [26] Noh JW, Kwon YD, Park J, et al. Body mass index and depressive symptoms in middle aged and older adults. BMC Public Health, 2015; 15, 310. doi: 10.1186/s12889-015-1663-z [27] Pereira-Miranda E, Costa PRF, Queiroz VaO, et al. Overweight and obesity associated with higher depression prevalence in adults: a systematic review and meta-analysis. J Am Coll Nutr, 2017; 36, 223−33. doi: 10.1080/07315724.2016.1261053 [28] Tyrrell J, Mulugeta A, Wood AR, et al. Using genetics to understand the causal influence of higher BMI on depression. Int J Epidemiol, 2019; 48, 834−48. doi: 10.1093/ije/dyy223 [29] Kim E, Song JH, Hwang JY, et al. Obesity and depressive symptoms in elderly Koreans: evidence for the "Jolly Fat" hypothesis from the Ansan Geriatric (AGE) Study. Arch Gerontol Geriatr, 2010; 51, 231−4. doi: 10.1016/j.archger.2009.10.014 [30] Zhang L, Liu K, Li H, et al. Relationship between body mass index and depressive symptoms: the "fat and jolly" hypothesis for the middle-aged and elderly in China. BMC Public Health, 2016; 16, 1201. doi: 10.1186/s12889-016-3864-5 [31] Yu MM, Shi YX, Gu LB, et al. "Jolly fat" or "sad fat": a systematic review and meta-analysis of the association between obesity and depression among community-dwelling older adults. Aging Ment Health, 2022; 26, 13−25. doi: 10.1080/13607863.2020.1857687 [32] Quek YH, Tam WWS, Zhang MWB, et al. Exploring the association between childhood and adolescent obesity and depression: a meta-analysis. Obes Rev, 2017; 18, 742−54. doi: 10.1111/obr.12535 [33] Almeida OP, Calver J, Jamrozik K, et al. Obesity and metabolic syndrome increase the risk of incident depression in older men: the health in men study. Am J Geriatr Psychiatry, 2009; 17, 889−98. doi: 10.1097/JGP.0b013e3181b047e3 [34] Luo HQ, Li JJ, Zhang Q, et al. Obesity and the onset of depressive symptoms among middle-aged and older adults in China: evidence from the CHARLS. BMC Public Health, 2018; 18, 909. doi: 10.1186/s12889-018-5834-6 [35] Hetemäki N, Savolainen-Peltonen H, Tikkanen MJ, et al. Estrogen metabolism in abdominal subcutaneous and visceral adipose tissue in postmenopausal women. J Clin Endocrinol Metab, 2017; 102, 4588−95. doi: 10.1210/jc.2017-01474 [36] Leeners B, Geary N, Tobler PN, et al. Ovarian hormones and obesity. Hum Reprod Update, 2017; 23, 300−21. doi: 10.1093/humupd/dmw045 [37] Albert KM, Newhouse PA. Estrogen, stress, and depression: cognitive and biological interactions. Annu Rev Clin Psychol, 2019; 15, 399−423. doi: 10.1146/annurev-clinpsy-050718-095557 [38] Vittengl JR. Mediation of the bidirectional relations between obesity and depression among women. Psychiatry Res, 2018; 264, 254−9. doi: 10.1016/j.psychres.2018.03.023 [39] Lee JH, Park SK, Ryoo JH, et al. U-shaped relationship between depression and body mass index in the Korean adults. Eur Psychiatry, 2017; 45, 72−80. doi: 10.1016/j.eurpsy.2017.05.025 [40] Ceolin G, Moreira JD, Breda V, et al. Association between adiposity and emergent depressive symptoms in a 10-years prospective cohort of older adults: the EpiFloripa Aging study. J Affect Disord, 2023; 330, 198−205. doi: 10.1016/j.jad.2023.03.009 [41] Alshehri T, Boone S, De Mutsert R, et al. The association between overall and abdominal adiposity and depressive mood: A cross-sectional analysis in 6459 participants. Psychoneuroendocrinology, 2019; 110, 104429. doi: 10.1016/j.psyneuen.2019.104429 [42] Vogelzangs N, Kritchevsky SB, Beekman ATF, et al. Depressive symptoms and change in abdominal obesity in older persons. Arch Gen Psychiatry, 2008; 65, 1386−93. doi: 10.1001/archpsyc.65.12.1386 [43] Sudhakar M, Silambanan S, Chandran AS, et al. C-Reactive Protein (CRP) and leptin receptor in obesity: binding of monomeric CRP to leptin receptor. Front Immunol, 2018; 9, 1167. doi: 10.3389/fimmu.2018.01167 [44] Cobos-Palacios L, Ruiz-Moreno MI, Vilches-Perez A, et al. Metabolically healthy obesity: inflammatory biomarkers and adipokines in elderly population. PLoS One, 2022; 17, e0265362. doi: 10.1371/journal.pone.0265362 [45] Chamberlain SR, Cavanagh J, De Boer P, et al. Treatment-resistant depression and peripheral C-reactive protein. Br J Psychiatry, 2019; 214, 11−9. doi: 10.1192/bjp.2018.66 [46] Nowakowski ACH, Graves KY, Sumerau JE. Mediation analysis of relationships between chronic inflammation and quality of life in older adults. Health Qual Life Outcomes, 2016; 14, 46. doi: 10.1186/s12955-016-0452-4 [47] Fancourt D, Steptoe A. The longitudinal relationship between changes in wellbeing and inflammatory markers: are associations independent of depression? Brain Behav Immun, 2020; 83, 146−52. [48] Leonard BE. Inflammation and depression: a causal or coincidental link to the pathophysiology? Acta Neuropsychiatr, 2018; 30, 1−16. [49] Mikulska J, Juszczyk G, Gawrońska-Grzywacz M, et al. HPA axis in the pathomechanism of depression and schizophrenia: new therapeutic strategies based on its participation. Brain Sci, 2021; 11, 1298. doi: 10.3390/brainsci11101298 [50] Ho CSH, Zhang MWB, Mak A, et al. Metabolic syndrome in psychiatry: advances in understanding and management. Adv Psychiatr Treat, 2014; 20, 101−12. doi: 10.1192/apt.bp.113.011619 [51] Yang JL, Liu DX, Jiang H, et al. The effects of high-fat-diet combined with chronic unpredictable mild stress on depression-like behavior and Leptin/LepRb in male rats. Sci Rep, 2016; 6, 35239. doi: 10.1038/srep35239 -

 点击查看大图
图(1) / 表ll (4)
计量
- 文章访问数: 613
- HTML全文浏览量: 290
- PDF下载量: 66
- 被引次数: 0

 Quick Links