

 下载:
下载:


-
Childhood sexual abuse (CSA) is a widespread and serious public health concern, with long-term impacts on overall health in adulthood. According to a systematic review published in 2018, the prevalence of CSA in China ranges from 11.6% to 20.2%[1]. A longitudinal study from New Zealand demonstrated that CSA negatively influences a broad range of adult developmental outcomes, including mental disorders, psychological wellbeing, sexual risk-taking, physical health, and socioeconomic wellbeing[2]. Therefore, CSA is considered a long-term hazard to the overall health of adults and is associated with poor quality of life (QoL).
The World Health Organization defines QoL as “An individual's perception of their position in life in the context of the culture and value systems in which they live and in relation to their goals, expectations, standards and concerns”. Studies have reported a negative relationship between CSA and QoL in adults. However, these studies did not consider several characteristics of CSA, such as the duration, type, period, and self-perceived impact of CSA. The relationship between CSA and health outcomes varies according to the characteristics of the CSA. For example, students with continuous exposure to CSA victimization are at a higher risk of developing severe post-traumatic stress disorder (PTSD) symptoms[3]. Regarding the sensitive period of CSA, Capretto[4] demonstrated that compared with other developmental periods, early (< 5 years of age) and late (> 13 years of age) CSA experiences were stronger predictors of depression and PTSD symptoms in adulthood. Moreover, the subjective experience of childhood maltreatment is strongly associated with a high risk of psychopathological conditions, highlighting the need to examine the subjective perceptions of CSA[5]. Therefore, understanding the correlation between CSA and QoL considering the various features of CSA is particularly important.
Not all individuals who experience CSA develop physiological or psychiatric diseases. An important factor influencing the outcomes of CSA victimization is resilience, which is conceptualized as the capacity of an individual to adapt to challenges and adverse events that hinder their function and development. Resilience is a relevant protective factor for individuals with childhood maltreatment, as it may mediate the association between childhood trauma and poor health consequences in adulthood[6]. However, the relationship between CSA and QoL and the role of resilience in this relationship remain unclear. A better understanding of the underlying mechanisms of the effects of CSA on QoL may facilitate the development of novel strategies for improving QoL.
The transition from late adolescence to adulthood represents a critical developmental period. Childhood maltreatment is associated with various long-term adverse health and developmental outcomes. Few studies have attempted to analyze the relationship between CSA and QoL in Chinese college students and the mediating effects of resilience in this relationship. In this large-sample study, we examined the relationship between CSA and QoL considering the features of CSA among Chinese college students, with a particular focus on the mediating effects of resilience.
The present study was based on a previous cross-sectional study titled, “Health and Risky Behaviors among University Students in Anhui Province,” which was conducted in Anhui province, China in October 2018. Briefly, a multistage stratified sampling method was used to select 4,060 university students. The detailed sampling procedure is described in our previous study[7]. All participants provided written informed consent. After 26 unqualified questionnaires were excluded, a total of 4,034 valid questionnaires were included in the analysis. Male and female students constituted 58.1% and 41.9% of the total participants, respectively. All procedures performed in this study were in accordance with the ethical standards of the institutional and national research committee and the Declaration of Helsinki.
CSA victimization was evaluated using the Chinese version of the CSA scale. The participants were asked to report their CSA experience based on the following three school stages: primary, junior high, and senior high school. The 12 items on the scale were classified as non-contact and contact CSA (details are presented in our previous study[7]). The duration of CSA was defined as the number of periods in which the CSA occurred (one, two, or three periods). For example, for a participant who experienced CSA in any two of the three periods, the period was recorded as “two periods”. The self-perceived impact of CSA was evaluated based on the following question “To what degree has CSA affected you?” The four responses ranged from “no harm” to “severe harm,” which were dichotomously classified as “no harm” or “some harm” in the subsequent multivariate linear and mediating analyses.
The World Health Organization Quality of Life-Brief (WHOQOL-BREF) was used to assess the QoL of the participants[8]. This scale is comprised of 26 items, mainly including six aspects. Only four aspects were considered in this study: physical health, mental health, social relationships, and environment. Each item of the scale is scored on a 5-point Likert scale, and the total score ranges from 4 to 20 for each dimension. The scores of the four aspects were summed to obtain the total QoL score (general QoL). The retest reliability coefficient for the WHOQOL-BREF used in this study ranged from 0.82 to 0.92.
Resilience was measured using the Chinese version of the Connor-Davidson Resilience Scale (CD-RISC)[9]. The CD-RISC is comprised of 25 items and three factors, namely tenacity, strength, and optimism. Each item is scored on a 5-point Likert scale (not at all, rarely right, sometimes right, often right, and extremely right). The scores of each item were summed to obtain the total score ranging from 0 to 100, with higher scores demonstrating higher resilience. The validity and reliability of the CD-RISC were 0.86 and 0.69, respectively.
QoL was expressed as the mean ± standard deviation and compared between groups using Students
t-test or analysis of variance. Each sociodemographic variable was subjected to bivariate analysis based on the four aspects of the WHOQOL-BREF. Considering the different characteristics of CSA (including the period, type, duration, and self-perceived impact of CSA), the relationship between CSA victimization and QoL was examined via multivariate linear regression analysis by adjusting for sociodemographic variables, including sex, character trait, years of study, academic discipline, only-child status (for individuals without siblings), academic performance, relationship with parents, and number of friends. The SPSS “PROCESS” macro was used to examine the mediating effects of resilience on the association between CSA victimization and QoL in college students and between the self-perceived impact of CSA and QoL. All statistical analyses were performed using SPSS (version 26.0) software (IBM Corp., Armonk, NY, USA). A P-value of < 0.05 was considered statistically significant. No significant between-sex differences were observed in the prevalence of CSA and general QoL scores (13.5% vs. 14.9%; 54.22 ± 9.03 vs. 54.15 ± 8.07; both P > 0.05). The general characteristics of the participants are shown in Supplementary Table S1 (available in www.besjournal.com). Bivariate analysis revealed that the relationship between CSA and QoL among college students varied depending on the characteristics of the CSA (Supplementary Table S2, available in www.besjournal.com). Compared with students without a history of CSA, students who had experienced CSA during primary school had poorer QoL (physical health: β = −0.31, 95% confidence interval (CI): −0.51 to −0.11; mental health: β = −0.37, 95% CI: −0.62 to −0.11; social relationships: β = −0.57, 95% CI: −0.84 to −0.30; environment: β = −0.49, 95% CI: −0.73 to −0.24; general QoL: β = −1.73, 95% CI: −2.57 to −0.89) (Table 1). Similarly, students who experienced CSA during junior and senior high school had poorer QoL than students who did not experience CSA (all P < 0.05). These results suggest that CSA victimization is an adverse childhood experience that contributes to negative outcomes with no specific sensitive period.
Table 1. Multivariate linear regression between different periods, types, duration, and self-perceived impact of child sexual abuse victimization and quality of life
Variables Physical health Mental health Social relationships Environment General QoL Periods of CSA Primary school No 1.00 1.00 1.00 1.00 1.00 Yes −0.31 (−0.51, −0.11)** −0.37 (−0.62, −0.11)** −0.57 (−0.84, −0.30)*** −0.49 (−0.73, −0.24)*** −1.73 (−2.57, −0.89)*** Junior high school No 1.00 1.00 1.00 1.00 1.00 Yes −0.46 (−0.73, −0.18)** −0.74 (−1.10, −0.39)*** −0.56 (−0.93, −0.18)** −0.61 (−0.95, −0.27)*** −2.36 (−3.53, −1.19)*** Senior high school No 1.00 1.00 1.00 1.00 1.00 Yes −0.63 (−0.92, −0.35)*** −0.65 (−1.01, −0.29)*** −0.49 (−0.88, −0.11)* −0.64 (−0.99, −0.30)*** −2.42 (−3.61, −1.23)*** Adjusted R2 0.120 0.146 0.102 0.110 0.147 Types of CSA None 1.00 1.00 1.00 1.00 1.00 Only non-contact CSA −0.30 (−0.51, −0.10)** −0.40 (−0.67, −0.14)** −0.44 (−0.72, −0.16)** −0.38 (−0.63, −0.12)** −1.52 (−2.40, −0.65)** Only contact CSA −0.62 (−1.11, −0.12)* −0.56 (−1.19, 0.08) −0.64 (−1.31, 0.03) −0.18 (−0.79, 0.42) −2.00 (−4.08, 0.83) Contact and non-contact −0.57 (−0.87, −0.27)*** −0.78 (−1.16, −0.40)*** −0.88 (−1.29, −0.48)*** −0.80 (−1.17, −0.43)*** −3.04 (−4.30, −1.78)*** Adjusted R2 0.121 0.147 0.104 0.110 0.148 Numbers of CSA None 1.00 1.00 1.00 1.00 1.00 1 period −0.38 (−0.57, −0.19)*** −0.47 (−0.72, −0.23)*** −0.60 (−0.86, −0.35)*** −0.39 (−0.62, −0.16)** −1.84 (−2.65, −1.04)*** 2 periods −0.32 (−0.71, 0.07) −0.59 (−1.09, −0.09)* −0.31 (−0.84, 0.22) −0.39 (−0.87, 0.09) −1.61 (−3.25, 0.04) 3 periods −0.86 (−1.40, −0.33)** −0.84 (−1.52, −0.16)* −0.92 (−1.64, −0.20)* −1.40 (−2.06, −0.75)*** −4.02 (−6.26, −1.78)** Continuous variable −0.38 (−0.49, −0.26)*** −0.48 (−0.63, −0.33)*** −0.47 (−0.63, −0.32)*** −0.47 (−0.62, −0.33)*** −1.34 (−1.81, −0.86)*** Adjusted R2 0.120 0.147 0.103 0.111 0.148 Self-perceived impact of CSA No harm 1.00 1.00 1.00 1.00 1.00 Some harm −0.42 (−0.62, −0.23)*** −0.60 (−0.85, −0.36)*** −0.61 (−0.88, −0.35)*** -0.44 (−0.67, −0.20)*** −2.08 (−2.90, −1.26)*** Adjusted R2 0.119 0.146 0.101 0.107 0.145 Note. Data is shown as β (95% CI). Adjusted for gender, academic disciplines, only child, character, relationship with mother and father, number of friend and academic performance that were statistically significant in univariate analyses. 95% CI = 95% confidence interval. *P < 0.05, **P < 0.01, ***P < 0.001. Table S1. Demographics of the participants and quality of life
Characteristics N (%) Physical health Mental health Social relationships Environment General QoL Mean ± SD t/F Mean ± SD t/F Mean ± SD t/F Mean ± SD t/F Mean ± SD t/F Gander −0.52 1.64 −2.93** 2.82** 0.26 Male 2,342 (58.1) 12.60 ± 2.06 14.15 ± 2.70 13.62 ± 2.87 13.86 ± 2.55 54.22 ± 9.03 Female 1,692 (41.9) 12.63 ± 1.98 14.01 ± 2.49 13.87 ± 2.45 13.64 ± 2.31 54.15 ± 8.07 Year of study 1.71 3.72*** 1.39 6.12*** 3.02* First 1,070 (26.5) 12.73 ± 2.01 14.31 ± 2.66 13.85 ± 2.75 13.97 ± 2.54 54.85 ± 8.80 Second 1,048 (26) 12.59 ± 2.10 13.96 ± 2.69 13.70 ± 2.84 13.85 ± 2.43 54.11 ± 8.91 Third 936 (23.2) 12.55 ± 2.04 14.07 ± 2.52 13.73 ± 2.64 13.53 ± 2.46 53.89 ± 8.50 Fourth 980 (24.3) 12.56 ± 1.95 14.01 ± 2.57 13.60 ± 2.57 13.68 ± 2.36 53.85 ± 8.26 Type of school 7.59** 6.32*** 3.04** 22.21*** 7.75*** Science 993 (24.6) 12.79 ± 2.00 14.37 ± 2.64 13.91 ± 2.81 14.26 ± 2.48 55.34 ± 8.77 Engineering 961 (23.8) 12.71 ± 2.02 14.04 ± 2.50 13.69 ± 2.47 13.40 ± 2.36 53.84 ± 8.28 Agriculture 1,046 (25.9) 12.40 ± 2.05 13.87 ± 2.71 13.75 ± 2.82 13.75 ± 2.51 53.77 ± 8.98 Medicine 1,034 (25.6) 12.56 ± 2.01 14.10 ± 2.58 13.55 ± 2.70 13.64 ± 2.39 53.84 ± 8.40 Only child 0.97 1.99* 2.66** 4.31*** 2.89** Yes 1,803 (44.7) 12.65 ± 2.10 14.18 ± 2.71 13.85 ± 2.89 13.95 ± 2.58 54.63 ± 9.13 No 2,231 (55.3) 12.58 ± 1.96 14.02 ± 2.54 13.62 ± 2.54 13.61 ± 2.33 53.84 ± 8.21 Character 97.71*** 120.93*** 98.37*** 58.96*** 120.74*** Introvert 1,323 (32.8) 12.06 ± 1.99 13.32 ± 2.58 13.02 ± 2.64 13.28 ± 2.32 51.67 ± 8.21 Moderate 1,506 (37.3) 12.66 ± 1.97 14.14 ± 2.48 13.73 ± 2.61 13.75 ± 2.41 54.21 ± 8.41 Outgoing 1,205 (29.9) 13.16 ± 1.97 14.89 ± 2.58 14.49 ± 2.69 14.32 ± 2.53 56.87 ± 8.57 Academic performance 65.41*** 75.14*** 39.80*** 42.75*** 70.16*** Bad 1,008 (25) 12.01 ± 2.09 13.29 ± 2.77 13.11 ± 2.85 13.19 ± 2.48 51.61 ± 8.88 General 2,155 (53.4) 12.74 ± 1.90 14.22 ± 2.45 13.84 ± 2.57 13.86 ± 2.35 54.67 ± 8.09 Good 871 (21.6) 12.99 ± 2.11 14.09 ± 2.62 14.15 ± 2.74 14.18 ± 2.55 56.02 ± 9.01 Relationship with mother 80.79*** 109.99*** 74.72*** 75.42*** 110.32*** Poor 75 (1.9) 11.41 ± 2.17 12.40 ± 2.92 12.66 ± 2.50 12.46 ± 2.49 48.94 ± 8.84 General 610 (15.1) 11.78 ± 2.01 12.83 ± 2.56 12.58 ± 2.56 12.77 ± 2.27 49.96 ± 8.12 Good 3,349 (83) 12.79 ± 1.98 14.36 ± 2.54 13.95 ± 2.68 13.98 ± 2.43 55.08 ± 8.46 Relationship with father 95.72*** 119.31*** 77.92*** 85.43*** 121.82*** Poor 124 (3.1) 11.40 ± 2.29 12.67 ± 3.04 12.77 ± 2.80 12.66 ± 2.75 49.50 ± 9.53 General 1,095 (27.1) 12.04 ± 1.97 13.22 ± 2.49 12.95 ± 2.55 13.06 ± 2.20 51.27 ± 7.95 Good 2,815 (69.8) 12.89 ± 1.97 14.50 ± 2.54 14.07 ± 2.69 14.09 ± 2.47 55.54 ± 8.51 No. of friends −11.89*** −11.94*** −13.07*** −10.37*** −13.51*** < 3 1,235 (30.6) 12.05 ± 2.07 13.37 ± 2.67 12.90 ± 2.79 13.17 ± 2.46 51.49 ± 8.80 ≥ 3 2,799 (69.4) 12.86 ± 1.95 14.41 ± 2.53 14.09 ± 2.59 14.03 ± 2.41 55.39 ± 8.29 Note. *P < 0.05, **P < 0.01, ***P < 0.001. Table S2. Means, standard deviations, and group comparisons
Variables N (%) Physical health Mental health Social relationships Environment General QoL Mean ± SD t/F Mean ± SD t/F Mean ± SD t/F Mean ± SD t/F Mean ± SD t/F CSA experience 5.90*** 6.01*** 6.07*** 5.87*** 6.78*** Yes 569 (14.1) 12.15 ± 1.97 13.48 ± 2.55 13.09 ± 2.66 13.21 ± 2.42 51.93 ± 8.29 No 3,465 (85.9) 12.69 ± 2.02 14.19 ± 2.61 13.83 ± 2.70 13.86 ± 2.45 54.56 ± 8.64 Gender −1.00 0.82 −3.00** 0.46 0.26 Male (n = 2,342) 317 (13.5) 12.08 ± 2.05 13.56 ± 2.63 12.79 ± 2.75 13.25 ± 2.63 54.22 ± 9.03 Female (n = 1,692) 252 (14.9) 12.24 ± 1.86 13.39 ± 2.44 13.46 ± 2.50 13.15 ± 2.14 54.15 ± 8.07 Periods of CSA Primary school 4.36*** 4.21*** 5.42*** 5.10*** 5.45*** Yes 389 (9.6) 12.19 ± 1.99 13.56 ± 2.56 13.01 ± 2.71 13.16 ± 2.49 51.93 ± 8.45 No 3,645 (90.4) 12.66 ± 2.02 14.15 ± 2.62 13.80 ± 2.70 13.83 ± 2.45 54.43 ± 8.63 Junior high school 4.28*** 5.03*** 3.92*** 4.41*** 4.97*** Yes 189 (4.7) 12.00 ± 1.95 13.16 ± 2.57 12.99 ± 2.61 13.00 ± 2.48 51.15 ± 8.51 No 3,845 (95.3) 12.64 ± 2.02 14.14 ± 2.61 13.76 ± 2.71 13.80 ± 2.45 54.34 ± 8.62 Senior high school 4.42*** 4.68*** 2.51** 3.95*** 4.06*** Yes 182 (4.5) 12.96 ± 2.01 13.40 ± 2.63 13.23 ± 2.84 13.06 ± 2.46 51.65 ± 8.61 No 3,852 (95.5) 12.64 ± 2.02 14.13 ± 2.61 13.75 ± 2.70 13.80 ± 2.45 54.31 ± 8.62 Types of CSA 13.58*** 13.91*** 14.35*** 13.73*** 17.85*** None 3,465 (85.9) 12.69 ± 2.02 14.19 ± 2.61 13.82 ± 2.70 13.86 ± 2.45 54.56 ± 8.64 Only non-contact 350 (8.7) 12.31 ± 1.88 13.67 ± 2.46 13.28 ± 2.50 13.35 ± 2.35 52.61 ± 7.82 Only contact 57 (1.4) 11.99 ± 1.95 13.51 ± 2.54 13.12 ± 2.97 13.50 ± 2.47 52.12 ± 8.88 Contact and non-contact 162 (4.0) 12.86 ± 2.18 13.08 ± 2.12 12.65 ± 2.84 12.79 ± 2.52 50.38 ± 8.90 Number of CSA 12.47*** 12.62*** 12.49*** 13.55*** 16.16*** None 3,465 (85.9) 12.69 ± 2.02 14.19 ± 2.61 13.82 ± 2.70 13.86 ± 2.45 54.56 ± 8.64 1 Period 427 (10.6) 12.21 ± 1.96 13.57 ± 2.51 13.10 ± 2.62 13.31 ± 2.37 52.19 ± 8.10 2 Period 93 (2.3) 12.07 ± 1.87 13.23 ± 2.61 13.18 ± 2.57 13.17 ± 2.53 51.64 ± 8.30 3 Period 49 (1.2) 11.73 ± 2.16 13.25 ± 2.76 12.82 ± 3.16 12.40 ± 2.59 50.20 ± 9.78 Self-perceived impact of CSA 13.86*** 13.90*** 10.52*** 14.36*** 15.85*** No abuse 3,365 (83.42) 12.71 ± 2.01 14.22 ± 2.60 13.86 ± 2.69 13.88 ± 2.45 54.66 ± 8.61 No harm 149 (3.7) 12.43 ± 1.87 13.77 ± 2.38 13.02 ± 2.80 13.76 ± 2.18 52.97 ± 7.93 Mild 289 (7.2) 12.22 ± 1.97 13.65 ± 2.57 13.17 ± 2.65 13.25 ± 2.49 52.29 ± 8.31 Moderate 88 (2.2) 12.01 ± 1.78 13.13 ± 2.13 13.18 ± 2.24 12.64 ± 2.20 50.96 ± 7.25 Severe 43 (1.0) 11.01 ± 2.30 12.12 ± 3.24 12.56 ± 3.00 12.14 ± 2.68 47.83 ± 10.12 Note. *P < 0.05, **P < 0.01, ***P < 0.001. Both “only non-contact CSA” and combined types of CSA were significantly associated with all four aspects of QoL (Table 1). Notably, the β coefficients for the association between QoL and combined types of CSA were higher than those for the association between QoL and only non-contact CSA. No significant correlation was observed between “only contact CSA” and QoL, except for physical health, which was significantly correlated with CSA (β = −0.62, 95% CI = −1.11, −0.12). Compared with non-contact CSA, contact CSA appeared to result in more severe adverse health outcomes. A study from Ethiopia indicated that adolescents who experienced contact CSA were more likely to develop psychological distress [odds ratio (OR) = 2.37] than adolescents who experienced non-contact CSA (OR = 1.91)[10]. However, a significant correlation was not observed between contact CSA and QoL in our study, possibly owing to the limited number of participants with a history of contact CSA (N = 57). These results suggest that combined types of CSA may have the highest impact on QoL among college students. Notably, “less severe” non-contact CSA also had negative effects on QoL and therefore warrants substantial attention.
Experiencing CSA for one or three periods was significantly associated with all four aspects of QoL (Table 1). Furthermore, an accumulative effect was observed between the duration of CSA and QoL (Table 1). This finding is consistent with that of a previous study, indicating that individuals with exposure to CSA for a longer duration are more likely to develop severe PTSD symptoms[3]. Additionally, students who reported a self-perceived impact of CSA had poorer QoL than students who reported no harm from their CSA experiences (Table 1). This finding suggests that positive subjective appraisal of CSA may attenuate the poor QoL resulting from the objective CSA experience, highlighting the important role of perceived harm in assessing QoL.
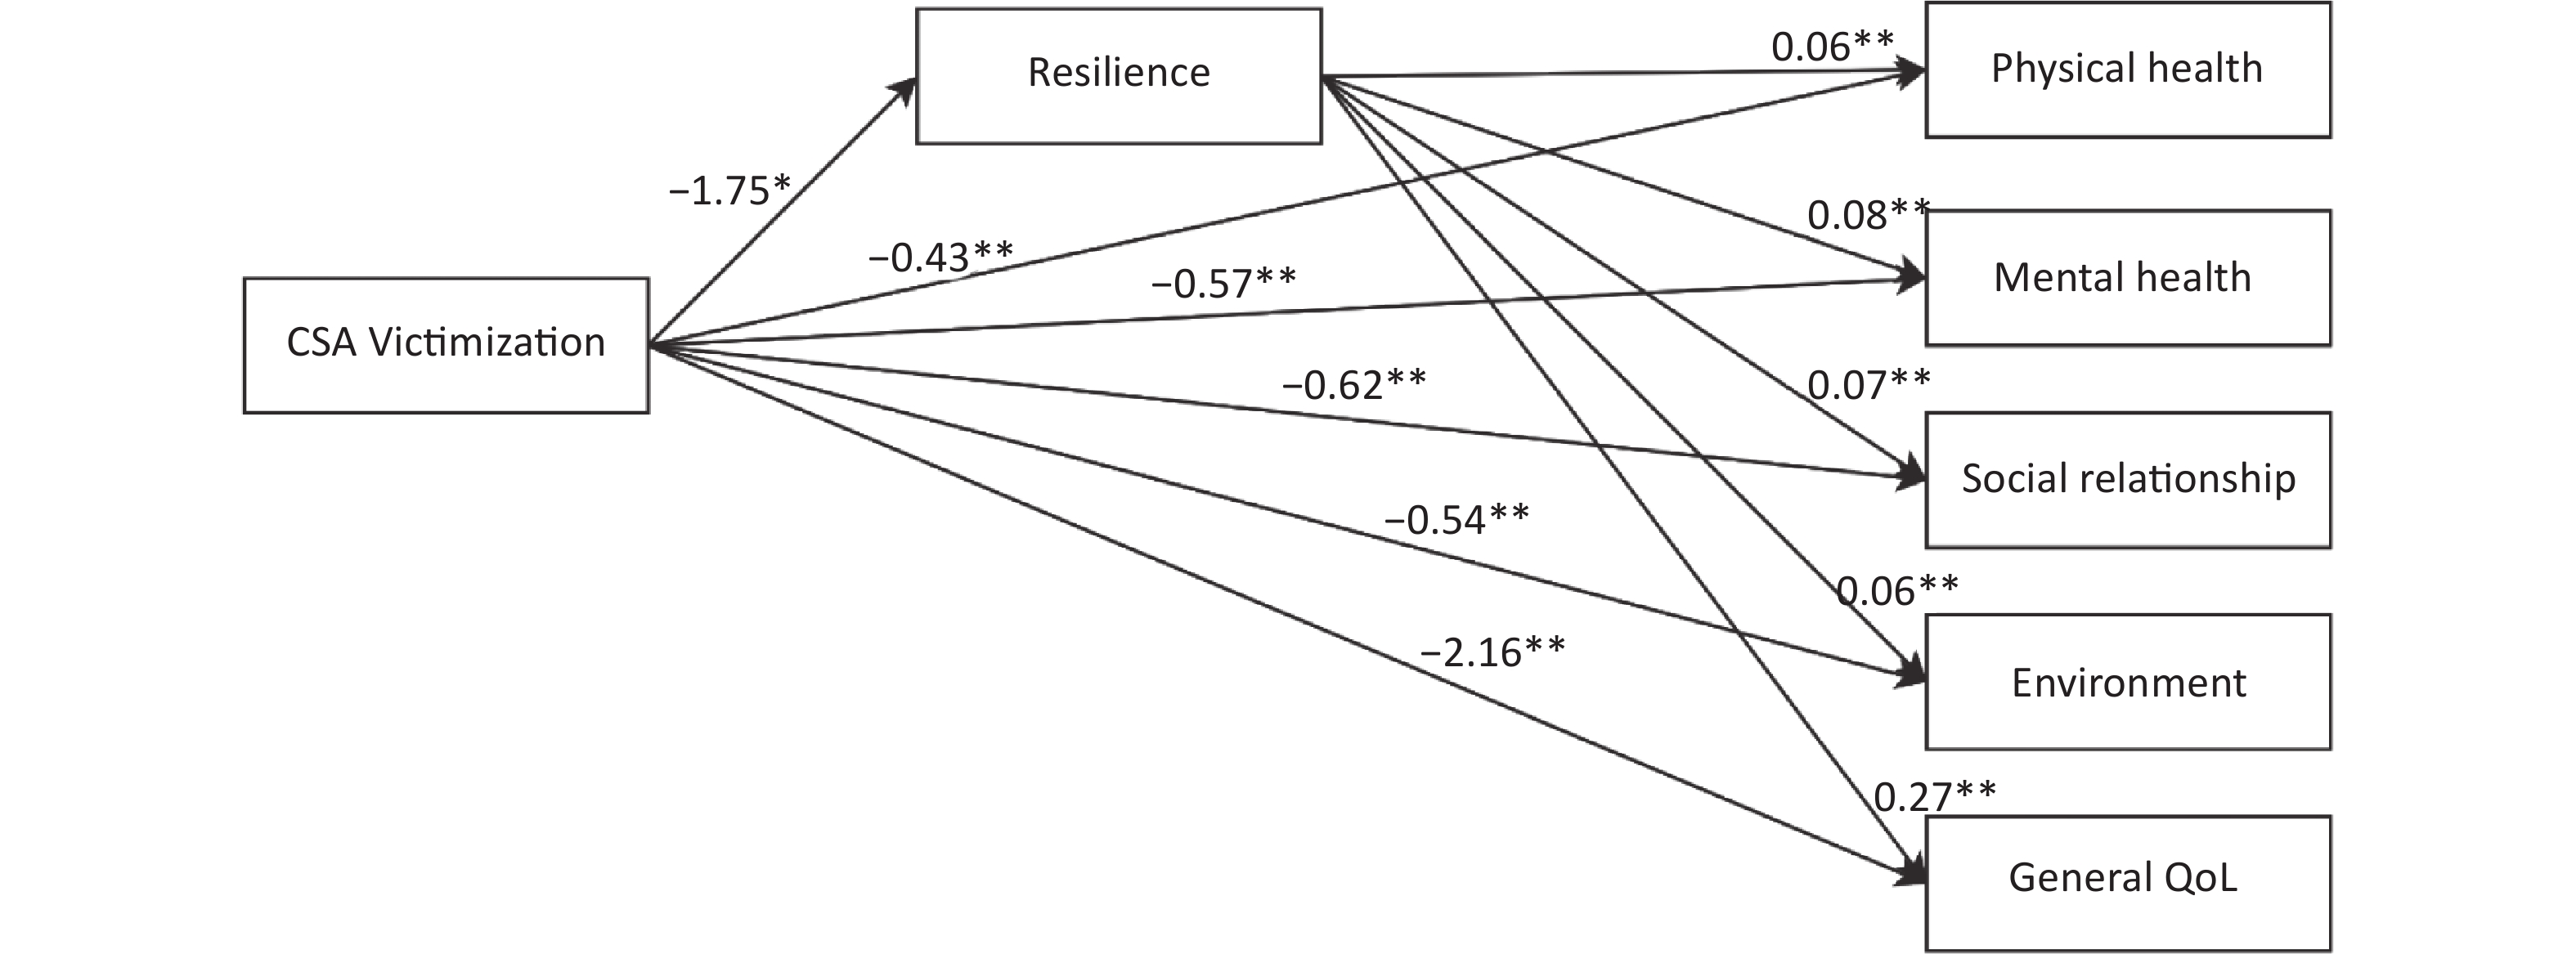
Another important finding of this study was that both CSA victimization and the self-perceived harm of CSA were negatively correlated with resilience, whereas resilience was positively correlated with QoL (Supplementary Figures S1 and S2, available in www.besjournal.com). Table 2 demonstrates the mediating effects of resilience on the relationship between CSA and QoL. The direct effects of CSA on all four aspects of QoL remained significant, although were weakened when resilience was considered in the mediating model (physical health: β = −0.11, 95% CI: −0.20 to −0.01; mental health: β = −0.14, 95% CI: −0.27 to −0.02; social relationships: β = −0.12, 95% CI: −0.22 to −0.01; environment: β = −0.11, 95% CI: −0.20 to −0.02; general QoL: β = −0.47, 95% CI: −0.90 to −0.07). The mediating effect of resilience considering the total effect of CSA on QoL was observed in 18.0% of the participants. These results suggest that resilience plays a partial mediating role in the relationship between CSA and QoL. Similarly, previous studies have demonstrated that resilience serves as a mediating factor between CSA and poor health outcomes in adolescence or adulthood. Resilience plays an important role in adapting to childhood trauma and protects adults from developing depressive symptoms[6]. Exposure to CSA can reduce resilience and increase the risk of psychological damage and other behavior problems. Therefore, enhancing resilience can minimize the adverse impacts of CSA on long-term QoL in emerging adulthood.
Table 2. Direct and indirect effects of CSA victimization on QoL
Model path (X→M→Y) Direct effect Indirect effect Effect size (%) β (95% CI) β (95% CI) CSA→resilience→Physical health −0.43 (−0.58, −0.28)** −0.11 (−0.20, −0.01)* 19.7 CSA→resilience→Mental health −0.57 (−0.77, −0.37)** −0.14 (−0.27, −0.02)* 19.9 CSA→resilience→Social relationships −0.62 (−0.84, −0.41)** −0.12 (−0.22, −0.01)* 16.0 CSA→resilience→Environment −0.54 (−0.74, −0.35)** −0.11 (−0.20, −0.02)* 16.8 CSA→resilience→General QoL −2.16 (−2.80, −1.52)** −0.47 (−0.90, −0.07)* 18.0 Note. Effect size was the proportion of the mediating effect accounts for the total effect. 95% CI = 95% confidence interval. *P < 0.05, **P < 0.01. CSA, childhood sexual abuse; QoL, poor quality of life. 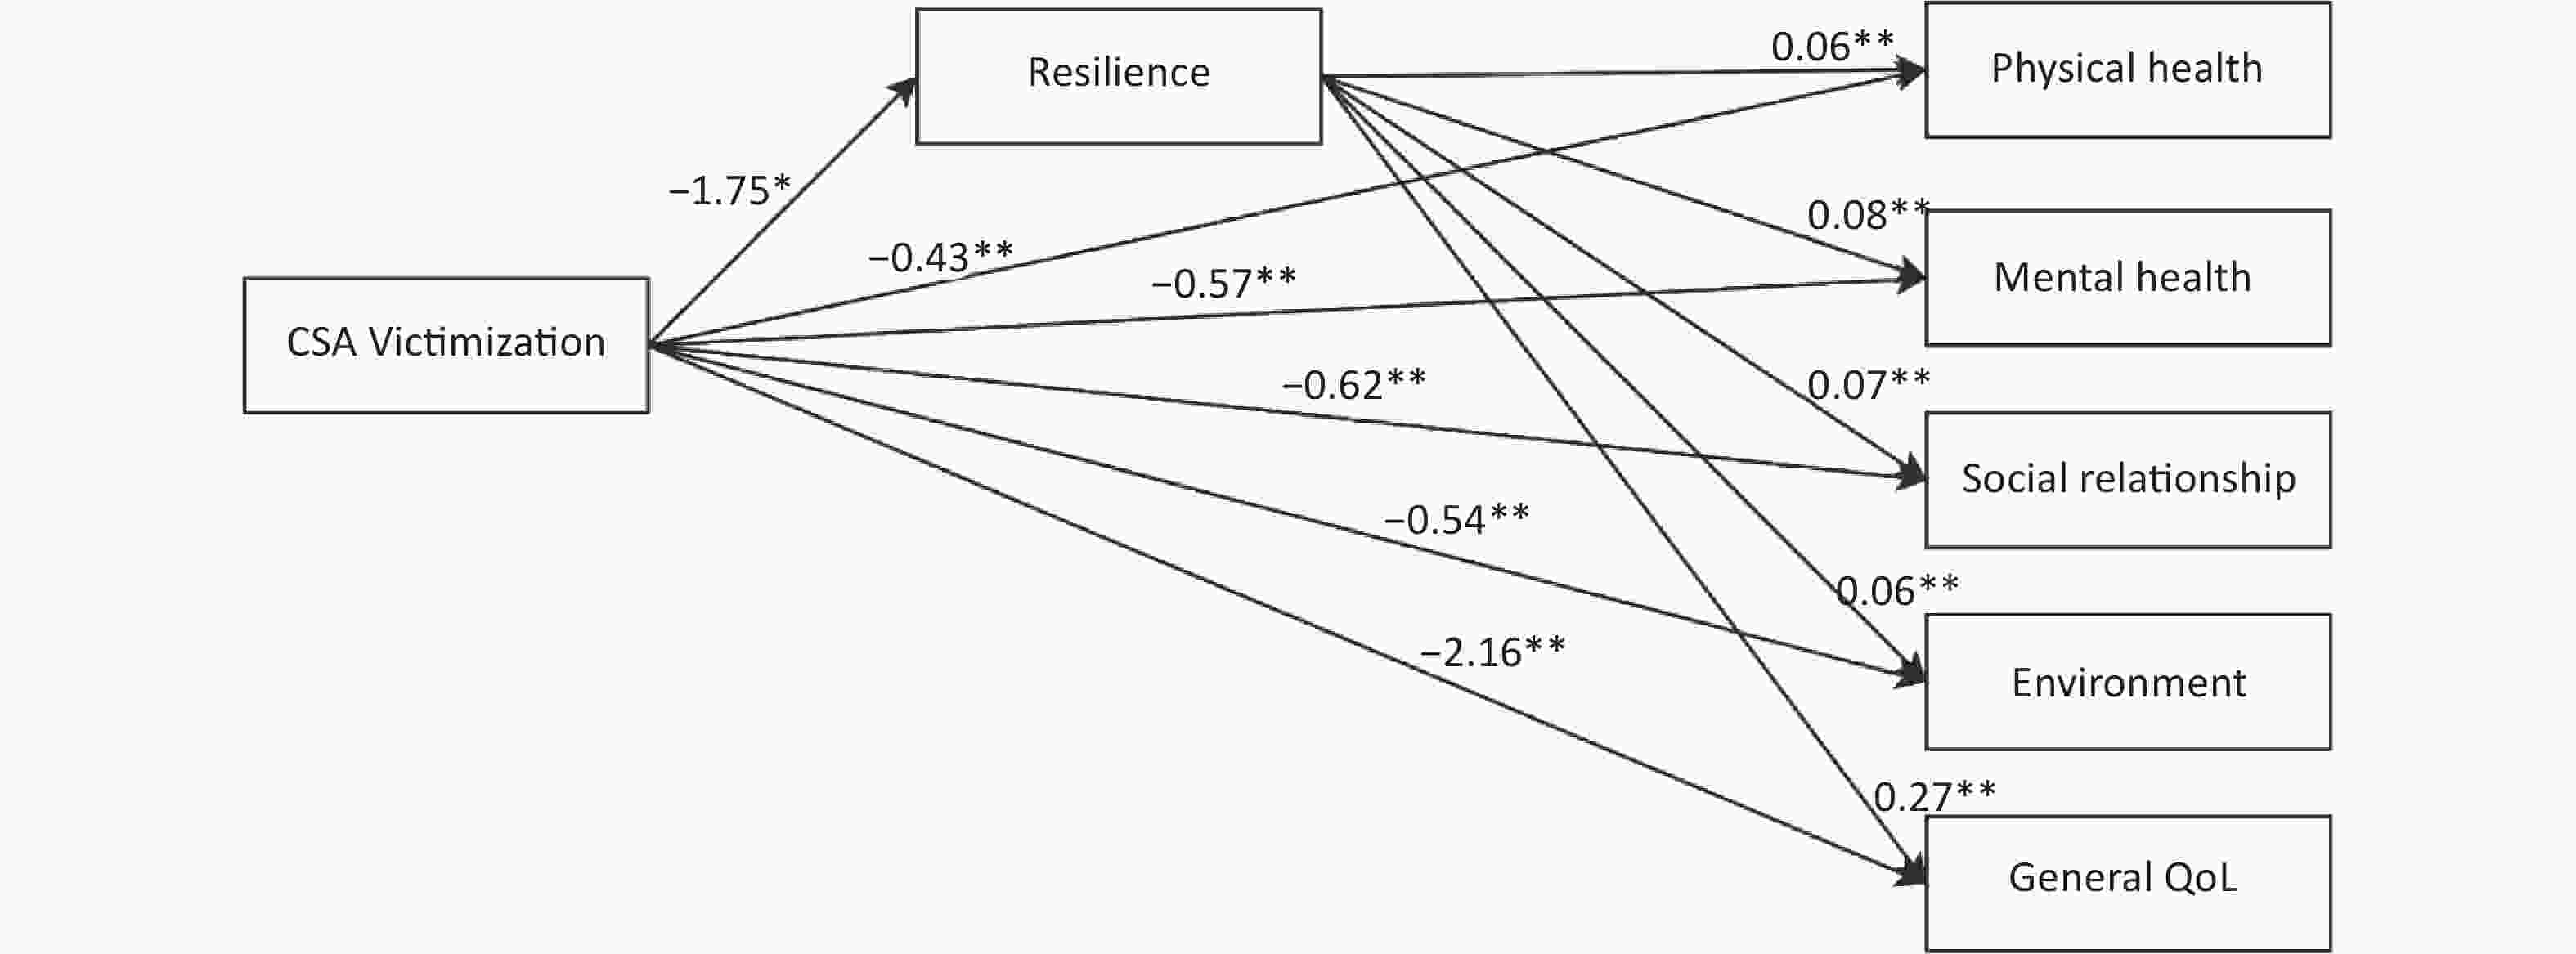
Figure S1. Mediation model of resilience on the association between the child sexual abuse and quality of life.
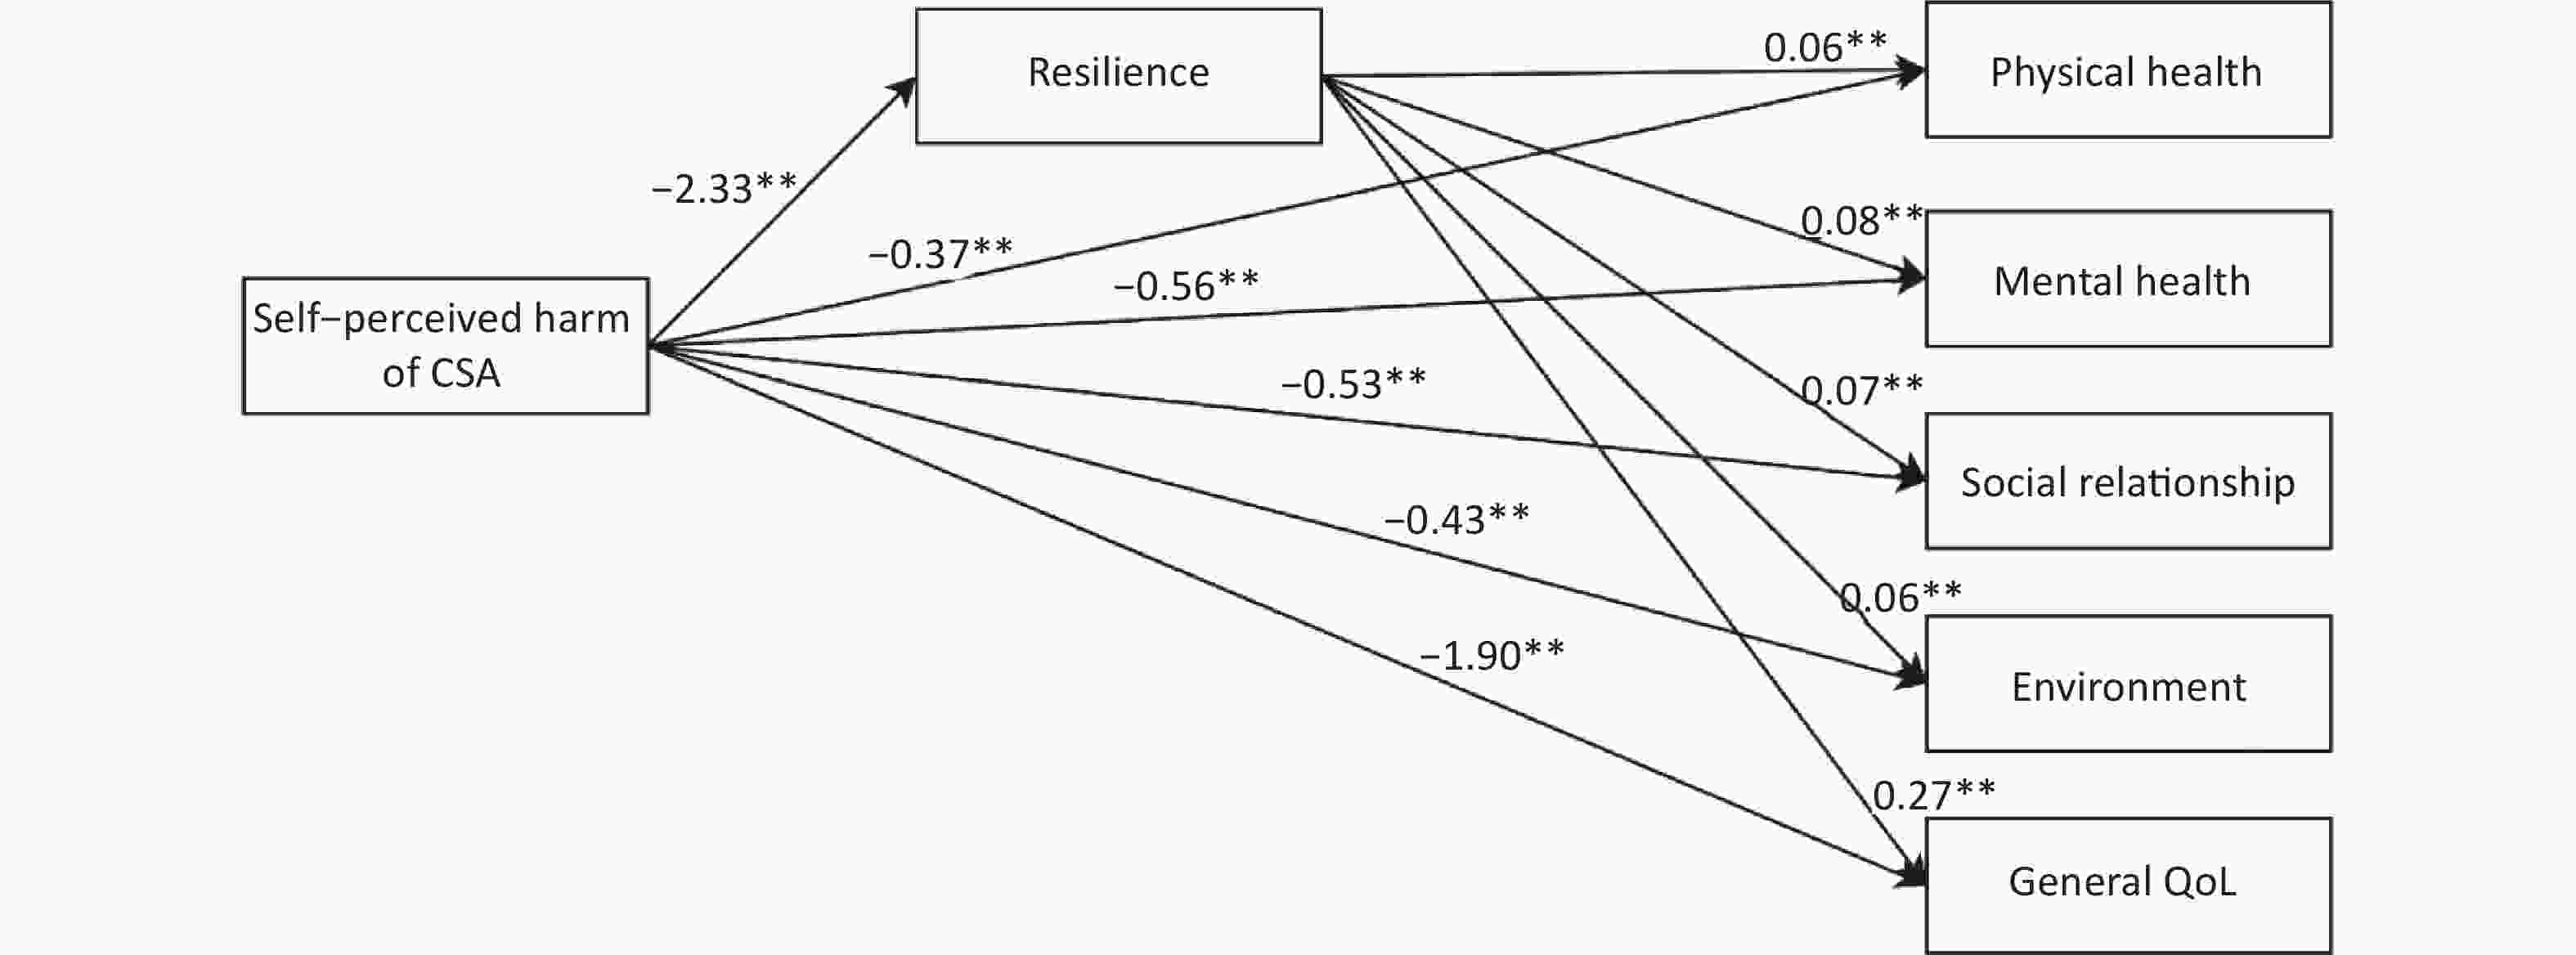
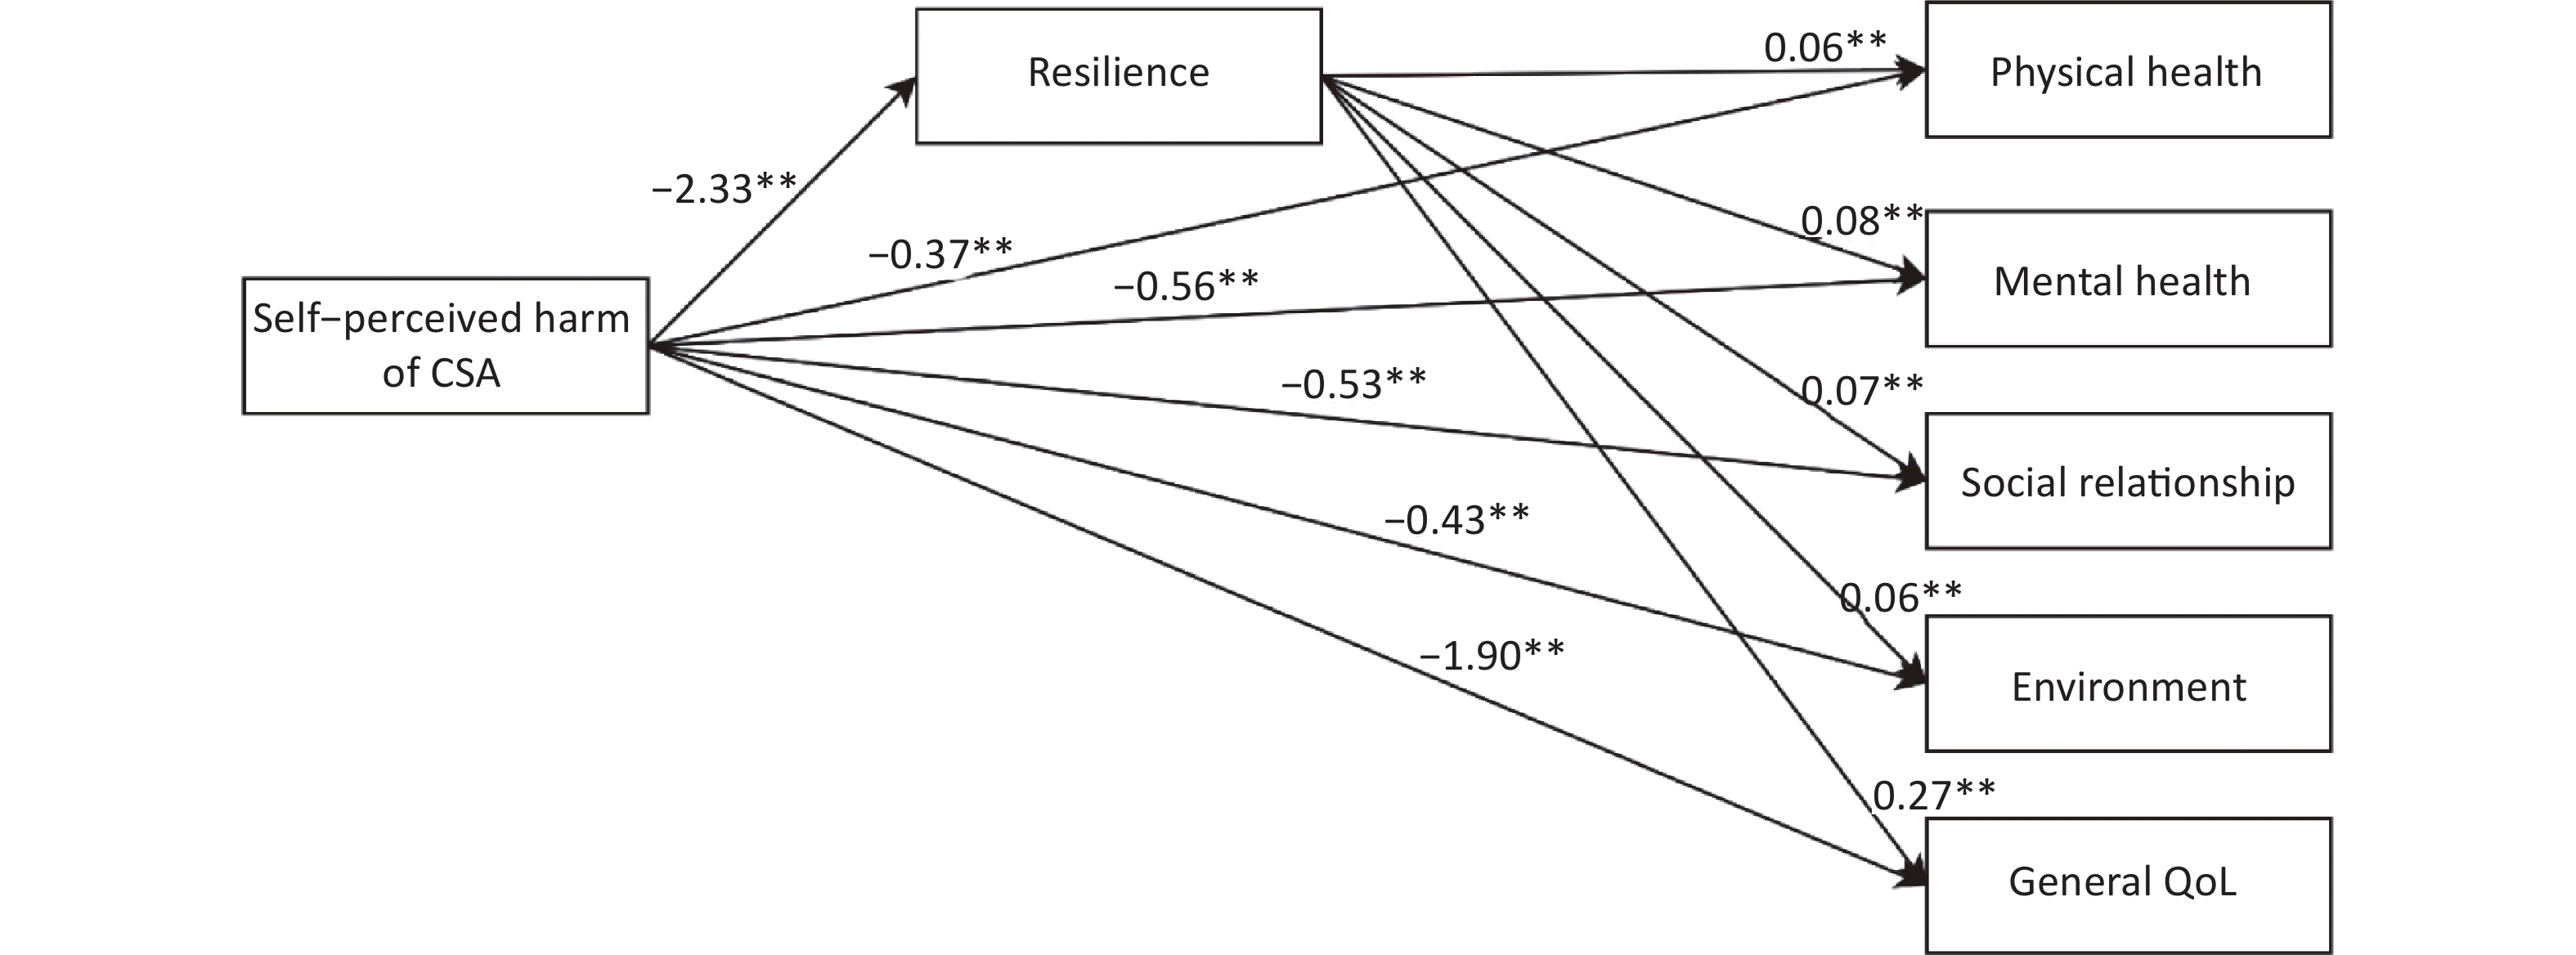
Figure S2. Mediation model of resilience on the association between the self-perceived harm of CSA and quality of life.
As shown in Table 3, resilience was also identified as a mediator between the self-perceived harm of CSA and QoL. The indirect effects of the self-perceived harm of CSA on QoL considering resilience were significant (all P < 0.05 ). Therefore, attention should be focused on individuals with a history of CSA with self-perceived harm because they have a poorer QoL than individuals with a history of CSA without percived harm. The mediating effects of resilience suggest that resilience-oriented interventions can improve the QoL of college students with a history of CSA and self-perceived harm. The mediating effect of resilience considering the total effect of the perceived impact of CSA on QoL was observed in 25.0% of the participants.
Table 3. Direct and indirect effects of the self-perceived impact of CSA on QoL
Model path (X→M→Y) Direct effect Indirect effect Effect size (%) β (95% CI) β (95% CI) Perceived impact of CSA →resilience→Physical health −0.37 (−0.54, −0.19)** −0.14 (−0.24, −0.04)* 27.8 Perceived impact of CSA →resilience→Mental health −0.56 (−0.78, −0.34)** −0.19 (−0.33, −0.05)* 25.1 Perceived impact of CSA →resilience→Social relationships −0.53 (−0.78, −0.29)** −0.16 (−0.28, −0.04)* 22.8 Perceived impact of CSA →resilience→Environment −0.44 (−0.66, −0.21)** −0.15 (−0.25, −0.04)* 25.0 Perceived impact of CSA →resilience→General QoL −1.90 (−2.63, −1.16)** −0.63 (−1.11, −0.16)* 25.0 Note. Effect size was the proportion of the mediating effect accounts for the total effect. 95% CI = 95% confidence interval. *P < 0.05, **P < 0.01. CSA, childhood sexual abuse; QoL, poor quality of life. This study has several limitations that should be acknowledged. First, this study had a cross-sectional design; therefore, a causal inference could not be drawn. Second, the self-report method used for defining CSA victimization may have resulted in information bias. Third, this study analyzed the mediating effects of resilience on CSA and QoL using the broad concept of resilience. Therefore, future studies should examine the differences among various resiliency resources, such as emotional regulation, interpersonal assistance, and social support. Finally, all participants in this study were selected from universities in Hefei, and their representativeness should be considered when interpreting the results. Longitudinal studies should be conducted to verify our results.
In conclusion, this study demonstrated that CSA was negatively associated with the QoL of Chinese college students. The relationship between CSA and QoL varied depending on the characteristics of the CSA, including the type, period, duration, and self-perceived harm of CSA. In addition, resilience played a partially mediating role in the relationship between CSA and QoL and between the self-perceived harm of CSA and QoL. Altogether, this study highlights the promising role of resilience-based interventions in improving the poor QoL resulting from CSA victimization in college students.
doi: 10.3967/bes2023.095
Childhood Sexual Abuse and Quality of Life in Chinese Undergraduates: the Mediating Role of Resilience
-
Conceptualization and design: PS and GW. Acquisition of data: XW, YL, YL, JC, MY, LC and SW. Analysis and interpretation of data: XW and YL. Revising the manuscript for intellectual content: WX, YL, PS and GW. Obtained funding: PS and GW. Final approval of the completed article: all authors. All authors had full access to all data in this study and take responsibility for the integrity of the data and the accuracy of the data analysis.
The authors declare that they have no known competing financial interests or personal relationships that could have appeared to influence the work reported in this paper.
&These authors contributed equally to this work.
注释:1) Author Contributions: 2) Conflict of Interest: -
S1. Mediation model of resilience on the association between the child sexual abuse and quality of life.
*P < 0.05, **P < 0.01.
S2. Mediation model of resilience on the association between the self-perceived harm of CSA and quality of life.
*P < 0.05, **P < 0.01.
Table 1. Multivariate linear regression between different periods, types, duration, and self-perceived impact of child sexual abuse victimization and quality of life
Variables Physical health Mental health Social relationships Environment General QoL Periods of CSA Primary school No 1.00 1.00 1.00 1.00 1.00 Yes −0.31 (−0.51, −0.11)** −0.37 (−0.62, −0.11)** −0.57 (−0.84, −0.30)*** −0.49 (−0.73, −0.24)*** −1.73 (−2.57, −0.89)*** Junior high school No 1.00 1.00 1.00 1.00 1.00 Yes −0.46 (−0.73, −0.18)** −0.74 (−1.10, −0.39)*** −0.56 (−0.93, −0.18)** −0.61 (−0.95, −0.27)*** −2.36 (−3.53, −1.19)*** Senior high school No 1.00 1.00 1.00 1.00 1.00 Yes −0.63 (−0.92, −0.35)*** −0.65 (−1.01, −0.29)*** −0.49 (−0.88, −0.11)* −0.64 (−0.99, −0.30)*** −2.42 (−3.61, −1.23)*** Adjusted R2 0.120 0.146 0.102 0.110 0.147 Types of CSA None 1.00 1.00 1.00 1.00 1.00 Only non-contact CSA −0.30 (−0.51, −0.10)** −0.40 (−0.67, −0.14)** −0.44 (−0.72, −0.16)** −0.38 (−0.63, −0.12)** −1.52 (−2.40, −0.65)** Only contact CSA −0.62 (−1.11, −0.12)* −0.56 (−1.19, 0.08) −0.64 (−1.31, 0.03) −0.18 (−0.79, 0.42) −2.00 (−4.08, 0.83) Contact and non-contact −0.57 (−0.87, −0.27)*** −0.78 (−1.16, −0.40)*** −0.88 (−1.29, −0.48)*** −0.80 (−1.17, −0.43)*** −3.04 (−4.30, −1.78)*** Adjusted R2 0.121 0.147 0.104 0.110 0.148 Numbers of CSA None 1.00 1.00 1.00 1.00 1.00 1 period −0.38 (−0.57, −0.19)*** −0.47 (−0.72, −0.23)*** −0.60 (−0.86, −0.35)*** −0.39 (−0.62, −0.16)** −1.84 (−2.65, −1.04)*** 2 periods −0.32 (−0.71, 0.07) −0.59 (−1.09, −0.09)* −0.31 (−0.84, 0.22) −0.39 (−0.87, 0.09) −1.61 (−3.25, 0.04) 3 periods −0.86 (−1.40, −0.33)** −0.84 (−1.52, −0.16)* −0.92 (−1.64, −0.20)* −1.40 (−2.06, −0.75)*** −4.02 (−6.26, −1.78)** Continuous variable −0.38 (−0.49, −0.26)*** −0.48 (−0.63, −0.33)*** −0.47 (−0.63, −0.32)*** −0.47 (−0.62, −0.33)*** −1.34 (−1.81, −0.86)*** Adjusted R2 0.120 0.147 0.103 0.111 0.148 Self-perceived impact of CSA No harm 1.00 1.00 1.00 1.00 1.00 Some harm −0.42 (−0.62, −0.23)*** −0.60 (−0.85, −0.36)*** −0.61 (−0.88, −0.35)*** -0.44 (−0.67, −0.20)*** −2.08 (−2.90, −1.26)*** Adjusted R2 0.119 0.146 0.101 0.107 0.145 Note. Data is shown as β (95% CI). Adjusted for gender, academic disciplines, only child, character, relationship with mother and father, number of friend and academic performance that were statistically significant in univariate analyses. 95% CI = 95% confidence interval. *P < 0.05, **P < 0.01, ***P < 0.001.  下载: 导出CSV
S1. Demographics of the participants and quality of life
Characteristics N (%) Physical health Mental health Social relationships Environment General QoL Mean ± SD t/F Mean ± SD t/F Mean ± SD t/F Mean ± SD t/F Mean ± SD t/F Gander −0.52 1.64 −2.93** 2.82** 0.26 Male 2,342 (58.1) 12.60 ± 2.06 14.15 ± 2.70 13.62 ± 2.87 13.86 ± 2.55 54.22 ± 9.03 Female 1,692 (41.9) 12.63 ± 1.98 14.01 ± 2.49 13.87 ± 2.45 13.64 ± 2.31 54.15 ± 8.07 Year of study 1.71 3.72*** 1.39 6.12*** 3.02* First 1,070 (26.5) 12.73 ± 2.01 14.31 ± 2.66 13.85 ± 2.75 13.97 ± 2.54 54.85 ± 8.80 Second 1,048 (26) 12.59 ± 2.10 13.96 ± 2.69 13.70 ± 2.84 13.85 ± 2.43 54.11 ± 8.91 Third 936 (23.2) 12.55 ± 2.04 14.07 ± 2.52 13.73 ± 2.64 13.53 ± 2.46 53.89 ± 8.50 Fourth 980 (24.3) 12.56 ± 1.95 14.01 ± 2.57 13.60 ± 2.57 13.68 ± 2.36 53.85 ± 8.26 Type of school 7.59** 6.32*** 3.04** 22.21*** 7.75*** Science 993 (24.6) 12.79 ± 2.00 14.37 ± 2.64 13.91 ± 2.81 14.26 ± 2.48 55.34 ± 8.77 Engineering 961 (23.8) 12.71 ± 2.02 14.04 ± 2.50 13.69 ± 2.47 13.40 ± 2.36 53.84 ± 8.28 Agriculture 1,046 (25.9) 12.40 ± 2.05 13.87 ± 2.71 13.75 ± 2.82 13.75 ± 2.51 53.77 ± 8.98 Medicine 1,034 (25.6) 12.56 ± 2.01 14.10 ± 2.58 13.55 ± 2.70 13.64 ± 2.39 53.84 ± 8.40 Only child 0.97 1.99* 2.66** 4.31*** 2.89** Yes 1,803 (44.7) 12.65 ± 2.10 14.18 ± 2.71 13.85 ± 2.89 13.95 ± 2.58 54.63 ± 9.13 No 2,231 (55.3) 12.58 ± 1.96 14.02 ± 2.54 13.62 ± 2.54 13.61 ± 2.33 53.84 ± 8.21 Character 97.71*** 120.93*** 98.37*** 58.96*** 120.74*** Introvert 1,323 (32.8) 12.06 ± 1.99 13.32 ± 2.58 13.02 ± 2.64 13.28 ± 2.32 51.67 ± 8.21 Moderate 1,506 (37.3) 12.66 ± 1.97 14.14 ± 2.48 13.73 ± 2.61 13.75 ± 2.41 54.21 ± 8.41 Outgoing 1,205 (29.9) 13.16 ± 1.97 14.89 ± 2.58 14.49 ± 2.69 14.32 ± 2.53 56.87 ± 8.57 Academic performance 65.41*** 75.14*** 39.80*** 42.75*** 70.16*** Bad 1,008 (25) 12.01 ± 2.09 13.29 ± 2.77 13.11 ± 2.85 13.19 ± 2.48 51.61 ± 8.88 General 2,155 (53.4) 12.74 ± 1.90 14.22 ± 2.45 13.84 ± 2.57 13.86 ± 2.35 54.67 ± 8.09 Good 871 (21.6) 12.99 ± 2.11 14.09 ± 2.62 14.15 ± 2.74 14.18 ± 2.55 56.02 ± 9.01 Relationship with mother 80.79*** 109.99*** 74.72*** 75.42*** 110.32*** Poor 75 (1.9) 11.41 ± 2.17 12.40 ± 2.92 12.66 ± 2.50 12.46 ± 2.49 48.94 ± 8.84 General 610 (15.1) 11.78 ± 2.01 12.83 ± 2.56 12.58 ± 2.56 12.77 ± 2.27 49.96 ± 8.12 Good 3,349 (83) 12.79 ± 1.98 14.36 ± 2.54 13.95 ± 2.68 13.98 ± 2.43 55.08 ± 8.46 Relationship with father 95.72*** 119.31*** 77.92*** 85.43*** 121.82*** Poor 124 (3.1) 11.40 ± 2.29 12.67 ± 3.04 12.77 ± 2.80 12.66 ± 2.75 49.50 ± 9.53 General 1,095 (27.1) 12.04 ± 1.97 13.22 ± 2.49 12.95 ± 2.55 13.06 ± 2.20 51.27 ± 7.95 Good 2,815 (69.8) 12.89 ± 1.97 14.50 ± 2.54 14.07 ± 2.69 14.09 ± 2.47 55.54 ± 8.51 No. of friends −11.89*** −11.94*** −13.07*** −10.37*** −13.51*** < 3 1,235 (30.6) 12.05 ± 2.07 13.37 ± 2.67 12.90 ± 2.79 13.17 ± 2.46 51.49 ± 8.80 ≥ 3 2,799 (69.4) 12.86 ± 1.95 14.41 ± 2.53 14.09 ± 2.59 14.03 ± 2.41 55.39 ± 8.29 Note. *P < 0.05, **P < 0.01, ***P < 0.001.
下载: 导出CSV
S2. Means, standard deviations, and group comparisons
Variables N (%) Physical health Mental health Social relationships Environment General QoL Mean ± SD t/F Mean ± SD t/F Mean ± SD t/F Mean ± SD t/F Mean ± SD t/F CSA experience 5.90*** 6.01*** 6.07*** 5.87*** 6.78*** Yes 569 (14.1) 12.15 ± 1.97 13.48 ± 2.55 13.09 ± 2.66 13.21 ± 2.42 51.93 ± 8.29 No 3,465 (85.9) 12.69 ± 2.02 14.19 ± 2.61 13.83 ± 2.70 13.86 ± 2.45 54.56 ± 8.64 Gender −1.00 0.82 −3.00** 0.46 0.26 Male (n = 2,342) 317 (13.5) 12.08 ± 2.05 13.56 ± 2.63 12.79 ± 2.75 13.25 ± 2.63 54.22 ± 9.03 Female (n = 1,692) 252 (14.9) 12.24 ± 1.86 13.39 ± 2.44 13.46 ± 2.50 13.15 ± 2.14 54.15 ± 8.07 Periods of CSA Primary school 4.36*** 4.21*** 5.42*** 5.10*** 5.45*** Yes 389 (9.6) 12.19 ± 1.99 13.56 ± 2.56 13.01 ± 2.71 13.16 ± 2.49 51.93 ± 8.45 No 3,645 (90.4) 12.66 ± 2.02 14.15 ± 2.62 13.80 ± 2.70 13.83 ± 2.45 54.43 ± 8.63 Junior high school 4.28*** 5.03*** 3.92*** 4.41*** 4.97*** Yes 189 (4.7) 12.00 ± 1.95 13.16 ± 2.57 12.99 ± 2.61 13.00 ± 2.48 51.15 ± 8.51 No 3,845 (95.3) 12.64 ± 2.02 14.14 ± 2.61 13.76 ± 2.71 13.80 ± 2.45 54.34 ± 8.62 Senior high school 4.42*** 4.68*** 2.51** 3.95*** 4.06*** Yes 182 (4.5) 12.96 ± 2.01 13.40 ± 2.63 13.23 ± 2.84 13.06 ± 2.46 51.65 ± 8.61 No 3,852 (95.5) 12.64 ± 2.02 14.13 ± 2.61 13.75 ± 2.70 13.80 ± 2.45 54.31 ± 8.62 Types of CSA 13.58*** 13.91*** 14.35*** 13.73*** 17.85*** None 3,465 (85.9) 12.69 ± 2.02 14.19 ± 2.61 13.82 ± 2.70 13.86 ± 2.45 54.56 ± 8.64 Only non-contact 350 (8.7) 12.31 ± 1.88 13.67 ± 2.46 13.28 ± 2.50 13.35 ± 2.35 52.61 ± 7.82 Only contact 57 (1.4) 11.99 ± 1.95 13.51 ± 2.54 13.12 ± 2.97 13.50 ± 2.47 52.12 ± 8.88 Contact and non-contact 162 (4.0) 12.86 ± 2.18 13.08 ± 2.12 12.65 ± 2.84 12.79 ± 2.52 50.38 ± 8.90 Number of CSA 12.47*** 12.62*** 12.49*** 13.55*** 16.16*** None 3,465 (85.9) 12.69 ± 2.02 14.19 ± 2.61 13.82 ± 2.70 13.86 ± 2.45 54.56 ± 8.64 1 Period 427 (10.6) 12.21 ± 1.96 13.57 ± 2.51 13.10 ± 2.62 13.31 ± 2.37 52.19 ± 8.10 2 Period 93 (2.3) 12.07 ± 1.87 13.23 ± 2.61 13.18 ± 2.57 13.17 ± 2.53 51.64 ± 8.30 3 Period 49 (1.2) 11.73 ± 2.16 13.25 ± 2.76 12.82 ± 3.16 12.40 ± 2.59 50.20 ± 9.78 Self-perceived impact of CSA 13.86*** 13.90*** 10.52*** 14.36*** 15.85*** No abuse 3,365 (83.42) 12.71 ± 2.01 14.22 ± 2.60 13.86 ± 2.69 13.88 ± 2.45 54.66 ± 8.61 No harm 149 (3.7) 12.43 ± 1.87 13.77 ± 2.38 13.02 ± 2.80 13.76 ± 2.18 52.97 ± 7.93 Mild 289 (7.2) 12.22 ± 1.97 13.65 ± 2.57 13.17 ± 2.65 13.25 ± 2.49 52.29 ± 8.31 Moderate 88 (2.2) 12.01 ± 1.78 13.13 ± 2.13 13.18 ± 2.24 12.64 ± 2.20 50.96 ± 7.25 Severe 43 (1.0) 11.01 ± 2.30 12.12 ± 3.24 12.56 ± 3.00 12.14 ± 2.68 47.83 ± 10.12 Note. *P < 0.05, **P < 0.01, ***P < 0.001.
下载: 导出CSV
Table 2. Direct and indirect effects of CSA victimization on QoL
Model path (X→M→Y) Direct effect Indirect effect Effect size (%) β (95% CI) β (95% CI) CSA→resilience→Physical health −0.43 (−0.58, −0.28)** −0.11 (−0.20, −0.01)* 19.7 CSA→resilience→Mental health −0.57 (−0.77, −0.37)** −0.14 (−0.27, −0.02)* 19.9 CSA→resilience→Social relationships −0.62 (−0.84, −0.41)** −0.12 (−0.22, −0.01)* 16.0 CSA→resilience→Environment −0.54 (−0.74, −0.35)** −0.11 (−0.20, −0.02)* 16.8 CSA→resilience→General QoL −2.16 (−2.80, −1.52)** −0.47 (−0.90, −0.07)* 18.0 Note. Effect size was the proportion of the mediating effect accounts for the total effect. 95% CI = 95% confidence interval. *P < 0.05, **P < 0.01. CSA, childhood sexual abuse; QoL, poor quality of life.
下载: 导出CSV
Table 3. Direct and indirect effects of the self-perceived impact of CSA on QoL
Model path (X→M→Y) Direct effect Indirect effect Effect size (%) β (95% CI) β (95% CI) Perceived impact of CSA →resilience→Physical health −0.37 (−0.54, −0.19)** −0.14 (−0.24, −0.04)* 27.8 Perceived impact of CSA →resilience→Mental health −0.56 (−0.78, −0.34)** −0.19 (−0.33, −0.05)* 25.1 Perceived impact of CSA →resilience→Social relationships −0.53 (−0.78, −0.29)** −0.16 (−0.28, −0.04)* 22.8 Perceived impact of CSA →resilience→Environment −0.44 (−0.66, −0.21)** −0.15 (−0.25, −0.04)* 25.0 Perceived impact of CSA →resilience→General QoL −1.90 (−2.63, −1.16)** −0.63 (−1.11, −0.16)* 25.0 Note. Effect size was the proportion of the mediating effect accounts for the total effect. 95% CI = 95% confidence interval. *P < 0.05, **P < 0.01. CSA, childhood sexual abuse; QoL, poor quality of life.
下载: 导出CSV
-
[1] Fu HL, Feng TJ, Qin JB, et al. Reported prevalence of childhood maltreatment among Chinese college students: a systematic review and meta-analysis. PLoS One, 2018; 13, e0205808. doi: 10.1371/journal.pone.0205808 [2] Fergusson DM, McLeod GFH, Horwood LJ. Childhood sexual abuse and adult developmental outcomes: findings from a 30-year longitudinal study in New Zealand. Child Abuse Negl, 2013; 37, 664−74. doi: 10.1016/j.chiabu.2013.03.013 [3] Batchelder AW, Safren SA, Coleman JN, et al. Indirect effects from childhood sexual abuse severity to PTSD: the role of avoidance coping. J Interpers Violence, 2021; 36, NP5476−95. doi: 10.1177/0886260518801030 [4] Jaye Capretto J. Developmental timing of childhood physical and sexual maltreatment predicts adult depression and post-traumatic stress symptoms. J Interpers Violence, 2020; 35, 2558−82. doi: 10.1177/0886260517704963 [5] Danese A, Widom CS. Objective and subjective experiences of child maltreatment and their relationships with psychopathology. Nat Hum Behav, 2020; 4, 811−8. doi: 10.1038/s41562-020-0880-3 [6] Mętel D, Arciszewska A, Daren A, et al. Resilience and cognitive biases mediate the relationship between early exposure to traumatic life events and depressive symptoms in young adults. J Affect Disord, 2019; 254, 26−33. doi: 10.1016/j.jad.2019.05.008 [7] Chen LR, Wang GF, Xie GD, et al. Association between sexual abuse victimization during the life course and suicidal behaviors in male and female college students in China: timing, duration, types and patterns. J Affect Disord, 2021; 280, 30−8. doi: 10.1016/j.jad.2020.11.048 [8] Chen YY, Huang JH. Precollege and in-college bullying experiences and health-related quality of life among college students. Pediatrics, 2015; 135, 18−25. doi: 10.1542/peds.2014-1798 [9] Yu XN, Lau JTF, Mak WWS, et al. Factor structure and psychometric properties of the connor-davidson resilience scale among Chinese adolescents. Compr Psychiatry, 2011; 52, 218−24. doi: 10.1016/j.comppsych.2010.05.010 [10] Gebremedhin HT, Bifftu BB, Lebessa MT, et al. Prevalence and associated factors of psychological distress among secondary school students in Mekelle City, tigray region, ethiopia: cross-sectional study. Psychol Res Behav Manag, 2020; 13, 473−80. doi: 10.2147/PRBM.S252779 -
 22437+Supplementary Materials.pdf

-

 点击查看大图
计量
- 文章访问数: 259
- HTML全文浏览量: 126
- PDF下载量: 16
- 被引次数: 0

 Quick Links