

 下载:
下载:

-
Asthma is a common chronic inflammatory disorder that is more prevalent in children than in adults. China has seen an increasing prevalence of childhood asthma in recent decades[1]. Earlier studies have shown that air particulate matter (PM), particularly fine particulate matter (PM2.5)[2], is an important factor triggering childhood asthma. Since national PM2.5 data were not available until 2013, the effects of PM2.5 on childhood asthma are less known, and most of the related research has been conducted primarily in some metropolises in China. Moreover, the majority of these studies focus on the impact of a unit increase (1 or 10 μg/m3) or an interquartile range increase in PM2.5 on childhood asthma based on the same pollutant background concentrations. Assessment of the impact of air quality grades (AQGs) based on PM2.5 concentration related to health effects is rarely considered[3]. Thus, the purpose of this study is to confirm the effects of PM2.5 on daily outpatient visits for childhood asthma in Shijiazhuang, a heavily polluted city with a high prevalence of childhood asthma in China, for the period 2013-2015, and to evaluate the association between PM2.5 exposure in different national AQGs and outpatient visits for childhood asthma in this city.
Data on daily outpatient visits, emergency department visits included, were collected from January 2013 to December 2015 from the Children's Hospital of Hebei Province, the largest comprehensive children's hospital in Shijiazhuang and Hebei Province. We excluded repeated visits in the same day and patients with incomplete information. Two physicians (LLP and CXW) confirmed and selected individuals with a primary diagnosis of asthma according to the International Classification of Disease codes (ICD-10 code: J45-J46). Only patients aged 0-14 years and living in the urban area of Shijiazhuang were involved. The daily air pollutant concentrations (PM2.5, SO2, NO2, CO, and O3) and meteorological data [air temperature (T, ℃), atmospheric pressure (P, hPa), mean wind speed (W, m/s), and relative humidity (RH, %)] in Shijiazhuang for the same period were obtained from the Hebei Environment Monitoring Center and Hebei Meteorological Information Center, respectively. All of the data were subjected to quality control before release by the professional agencies, and the daily average values for each factor were used in the analyses.
According to China's Ambient Air Quality standards (GB 9137-88) and Technical Regulation on Ambient Air Quality Index (HJ 633-2012), six AQGs were classified according to the daily mean concentration of PM2.5: Grade Ⅰ: excellent (PM2.5 < 35 μg/m3); Grade Ⅱ: good (35 μg/m3 ≤ PM2.5 < 75 μg/m3); Grade Ⅲ: light pollution (75 μg/m3 ≤ PM2.5 < 115 μg/m3); Grade Ⅳ: moderate pollution (115 μg/m3 ≤ PM2.5 < 150 μg/m3); Grade Ⅴ: heavy pollution (150 μg/m3 ≤ PM2.5 < 250 μg/m3); and Grade Ⅵ: severe pollution (PM2.5 ≥ 250 μg/m3). To assess the impact of PM2.5 on childhood asthma visits in Shijiazhuang, Poisson generalized additive models were constructed to calculate the relative risk (RR) and 95% confidence intervals (CIs) for PM2.5 exposure in different AQGs[3, 4]. All RRs of PM2.5 exposure in different AQGs for childhood asthma outpatient visits were estimated using Grade Ⅰ as the reference. To consider the delayed effect of PM2.5 in different grades, we calculated the RRs for the current day (lag0) of outpatient visits and for the moving average concentration of PM2.5 up to 7 days (lag07) before outpatient visits[4]. In addition, we evaluated associations stratified by sex and age (0-6 years as preschoolers in China, 7-14 years as school-aged children) for asthma. All data analyses were conducted using R 3.3.3 with the mgcv package.
A detailed summary of the statistical distribution of daily outpatient visits for childhood asthma, air pollutants, and meteorological factors is shown in Supplementary Table S1 (available in www.besjournal.com). A total of 31, 907 outpatient visits for childhood asthma were recorded in our study. Among these visits, 70.6% were boys and 83.5% were under 6 years old (preschoolers) (Supplementary Table S2 available in www.besjournal.com). The mean daily outpatient visits of the total population totaled 32.0, while those of preschoolers and school-aged children were 26.8 and 5.2, respectively.
Table Supplementary Table S1. Summary Statistics of Daily Outpatient Visits for Childhood Asthma, Air Pollutants and Meteorological Factors in Shijiazhuang, China (2013-2015)
Daily Data Mean SD Min P25 Median P75 Max Outpatient visits for childhood asthma All 32.0 19.0 1.0 20.0 27.0 39.0 136.0 Preschoolers 26.8 19.3 1.0 14.0 20.0 33.0 132.0 School-age children 5.2 4.0 0.0 2.0 4.0 7.0 24.0 Boys 22.6 13.4 0.0 14.0 19.0 28.0 93.0 Girls 9.4 6.8 0.0 5.0 8.0 11.0 49.0 Air pollutants (μg/m3) PM2.5 117.4 101.6 5.0 51.3 87.2 148.6 755.9 SO2 64.9 70.8 1.3 19.0 40.0 87.1 516.0 NO2 50.2 32.7 4.4 27.4 47.0 67.0 203.0 CO 1.6 1.4 0.1 0.7 1.1 1.7 12.6 O3 104.4 66.5 2.0 53.0 95.0 143.0 357.0 Meteorological factors T (℃) 15.6 10.6 -8.1 6.7 18.0 24.9 35.5 P (hPa) 1003.3 9.6 982.0 995.0 1003.0 1011.0 1030.0 RH (%) 58.7 19.7 12.0 44.0 59.0 74.0 99.0 W (m/s) 1.6 0.8 0.3 1.1 1.5 2.0 6.4 Note. Preschoolers, children under 6 years old; School-age children, children aged 7 to 14 years. SD, standard deviation; Px, x-th percentiles; Min, minimum; Max, maximum; T, mean temperature; P, mean atmospheric pressure; W, mean wind speed; RH, relative humidity. Table Supplementary Table S2. Association between an Increase of 10 μg/m3 in PM2.5 Exposure and the RRs of Outpatient Visits for Childhood Asthma in Shijiazhuang, China (2013-2015)
Population Number (%) Relative Risk
(95% Confidence Intervals)All 31, 907 (100) 1.015 (1.011, 1.020) Preschoolers (0-6 years) 26, 649 (83.5) 1.016 (1.012, 1.021) School-age children (7-14 years) 5, 258 (16.5) 1.008 (0.997, 1.018) Boys 22, 539 (70.6) 1.014 (1.009, 1.020) Girls 9, 368 (29.4) 1.018 (1.010, 1.026) Note. The model was adjusted for long-term time trends, season, effect of holidays, day of week, daily mean temperature (T), mean wind speed (W), relative humidity (RH), SO2, and NO2 (Model 3). Table 1 shows the estimated RRs of PM2.5 in different AQGs for all outpatient visits for childhood asthma and days in different AQGs. Considering the influence of other covariates, three models were initially used in our study, comparisons of which are also summarized in Table 1. In the studied three years, most days featured light to more serious air pollution in Shijiazhuang. We also evaluated the effect of an increase of 10 μg/m3 in PM2.5 on childhood asthma (Supplementary Table S2). In general, exposure to PM2.5 was significantly associated with a high RR of outpatient visits for childhood asthma, which is in line with previous studies in both the West[2] and China[5-7]. After full adjustment (Model 3), the RRs of Grades Ⅱ, Ⅲ, Ⅳ, Ⅴ, and Ⅵ for outpatient visits of all children were 1.139 (95% CI: 1.098, 1.181), 1.168 (95% CI: 1.121, 1.217), 1.169 (95% CI: 1.112, 1.228), and 1.147 (95% CI: 1.077, 1.222), respectively. Although the estimated effect varied slightly among the three models, we can confidently determine the impact of PM2.5 exposures in different grades on childhood asthma because the covariates had no intrinsic effect on the assessment. Therefore, to take full account of the influence of covariates, Model 3 was adopted in the following analysis.
Table 1. Association between PM2.5 Exposure in Different Air Quality Grades and Relative Risk of Outpatient Visits for Childhood Asthma in Shijiazhuang, China (2013-2015)
Air Quality Grades,
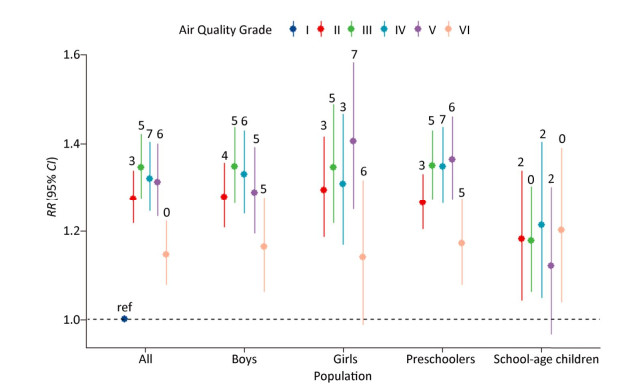
Concentration of PM2.5, μg/m3Days (%) Relative Risk and 95% Confidence Intervals Model 1 Model 2 Model 3 Grade Ⅰ, (< 35) 168 (15.3) 1 (ref) 1 (ref) 1 (ref) Grade Ⅱ, (35, 75) 286 (26.1) 1.176 (1.135, 1.218) 1.166 (1.126, 1.209) 1.139 (1.098, 1.181) Grade Ⅲ, (75, 115) 225 (20.5) 1.192 (1.148, 1.238) 1.192 (1.146, 1.240) 1.168 (1.121, 1.217) Grade Ⅳ, (115, 150) 135 (12.3) 1.210 (1.156, 1.266) 1.195 (1.139, 1.253) 1.169 (1.112, 1.228) Grade Ⅴ, (150, 250) 160 (14.6) 1.226 (1.173, 1.280) 1.210 (1.155, 1.267) 1.197 (1.138, 1.259) Grade Ⅵ, (≥ 250) 121 (11.1) 1.203 (1.144, 1.265) 1.186 (1.123, 1.252) 1.147 (1.077, 1.222) Note. Model 1 was adjusted for long-term time trends, season, effect of holidays, and day of week; Model 2 was additionally adjusted for mean temperature (T), mean wind speed (W), and relative humidity (RH) based on Model 1; Model 3 was additionally adjusted for SO2 and NO2 based on Model 2. Figure 1 shows the effects of PM2.5 in different AQGs on childhood asthma stratified by sex and age. For all patients, the number of outpatient visits increased by approximately 19.7% (RR: 1.197, 95% CI: 1.138-1.259) in response to heavy air pollution (Grade Ⅴ) with the highest RR. Likewise, the highest RRs of outpatient visits were also observed in preschoolers (RR: 1.221, 95% CI: 1.155-1.291) and girls (RR: 1.222, 95% CI: 1.114-1.341) in the same AQG. The highest RRs of childhood asthma associated with PM2.5 in school-aged children (RR: 1.201, 95% CI: 1.038-1.390) and boys (RR: 1.190, 95% CI: 1.134-1.249) were found in the most severe pollution (Ⅵ) and light pollution (Ⅲ) grades, respectively. The associations observed were stronger among boys than girls in Grades Ⅱ, Ⅲ, and Ⅵ, which is also in line with previous studies[7, 8]. The effects of PM2.5 on childhood asthma were stronger in preschoolers than in school-aged children with increases in AQGs (except in Grade Ⅲ), which contrasts some previous studies[5, 7]. Unfortunately, the analysis of associations between PM2.5 and childhood asthma was not stratified by age and sex in other similar studies in China, and the controversial results could not be confirmed[9]. We believe that preschoolers may be more susceptible to the harmful effects of PM2.5 than school-aged children because of the former's less-developed respiratory and immune system compared with that of older subjects. Studies with larger sample sizes are needed to confirm these findings.
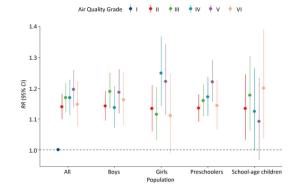
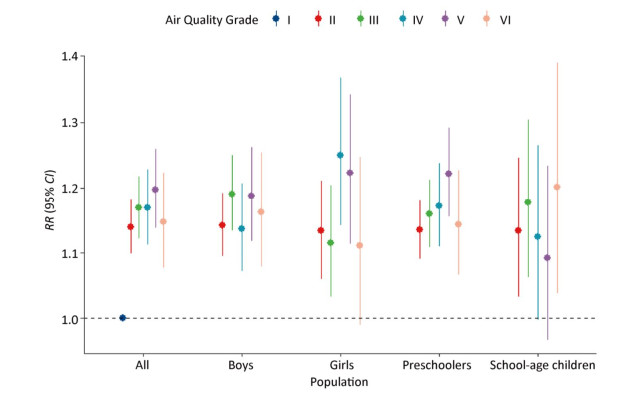
Figure 1. Association between PM2.5 exposure in different air quality grades and the RRs of outpatient visits for childhood asthma in Shijiazhuang, China (2013-2015). The model was adjusted for long-term time trends, season, effect of holidays, day of week, daily mean temperature (T), mean wind speed (W), relative humidity (RH), SO2, and NO2 (Model 3).
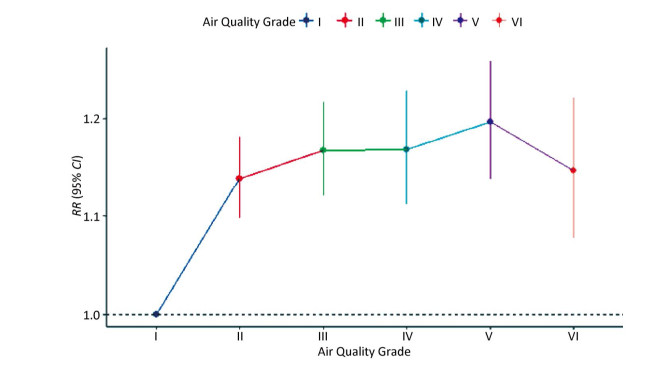
A nonlinear increasing trend of RRs with increasing PM2.5 grade was found. RRs increased rapidly from Grades Ⅰ to Ⅲ, which indicates that, for childhood asthma, children were more sensitive from good air quality to pollution (Supplementary Figure S1 available in www.besjournal.com). While the RR in Grade Ⅳ was more stable than that in Grade Ⅲ, a rising trend in Grade Ⅴ was noted. PM2.5 of a moderate grade may also trigger childhood asthma, particularly in boys. Even with good air quality in China (Grade Ⅱ), significant associations between PM2.5 exposure and outpatient visits in different population groups were observed. A similar research supported that exposure to the national air quality standard (Grade Ⅱ) could increase the risk of respiratory diseases in Beijing[3]. Moreover, an investigation in the United States of America suggested that each unit increase in PM2.5 may be associated with an increase in the prevalence of asthma symptoms, even at levels as low as 4.00-7.06 μg/m3[10]. In addition, considering that Grades Ⅱ–Ⅲ account for the majority of the days studied (Table 1), prevention of childhood asthma should be focused on these AQGs. Compared with evaluations of the effects of a unit increase in PM2.5 on asthma, this type of estimation could be more convenient for health impact assessments of environmental pollution forecast and generally easier to use than other estimates.
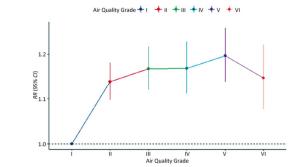
Figure Supplementary Figure S1. Association between PM2.5 exposure in different air quality grades and the RRs of outpatient visits for all childhood asthma in Shijiazhuang, China (2013-2015). The model was adjusted for long-term time trends, season, effect of holidays, day of week, daily mean temperature (T), mean wind speed (W), relative humidity (RH), SO2, and NO2 (Model 3).
Figure 2 portrays the highest estimated lag day effects of PM2.5 exposure in different AQGs on outpatient visits for childhood asthma. In general, the effects of PM2.5 on outpatient visits for childhood asthma increased from lag01 to higher lags in different grades for all population groups (Supplementary Table S3 available in www.besjournal.com). Compared with those in higher AQGs, the lag effects in Grade Ⅱ revealed rapid responses, and the estimated RRs were largest at lags02-04 in different age and gender groups. However, in higher AQGs, the greatest effects were likely to be found at lag days 05-07, except in school-aged children (greatest at the current day or at lag02). The effects of 10 μg/m3 increases in PM2.5 exposure were highest at the current day (date not shown). The estimated RR of all childhood asthma patients was greatest at lag03 with increasing grade, which is consistent with previous studies in China[5, 7, 9]. The estimated RRs of different patient groups ranged from lag03 to lag06 at different grade levels. A possible explanation for the observed cumulative effects may involve the accumulation of fine particles in the respiratory tract and lung, as the body's immune system requires some time to remove these particles.
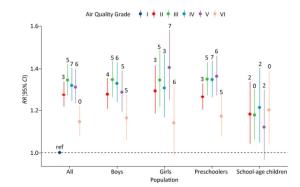
Figure 2. Highest estimated lag day effects of PM2.5 exposure in different air quality grades on outpatient visits for childhood asthma in Shijiazhuang, China (2013-2015). Labels indicate the corresponding average lag days of the highest estimated effect (lag0-lag07) for different AQGs. The model was adjusted for long-term time trends, season, effect of holidays, day of week, daily mean temperature (T), mean wind speed (W), relative humidity (RH), SO2, and NO2 (Model 3).
Table Supplementary Table S3. Estimated Relative Risks (RRs) on Childhood Asthma Outpatient Visits Associated with PM2.5 Exposure in Different Air Quality Grades in the Considered Lags in Shijiazhuang, China (2013-2015)
Population PM2.5(μg/m3) Relative Risks (RRs) and 95% Confidence Intervals (95% CIs) Lag 0 Lag 01 Lag 02 Lag 03 Lag 04 Lag 05 Lag 06 Lag 07 All < 35 1 (ref) 1 (ref) 1 (ref) 1 (ref) 1 (ref) 1 (ref) 1 (ref) 1 (ref) ≥ 35, < 75 1.139 1.115 1.236 1.276 (1.217, 1.264 1.233 1.217 1.191 (1.098, 1.181) (1.072, 1.161) (1.183, 1.292) 1.338) (1.203, 1.328) (1.172, 1.297) (1.157, 1.281) (1.131, 1.253) ≥ 75, < 115 1.168 1.123 1.227 1.267 (1.205, 1.305 1.346 1.317 1.285 (1.121, 1.217) (1.075, 1.174) (1.170, 1.286) 1.333) (1.238, 1.375) (1.275, 1.422) (1.248, 1.391) (1.217, 1.357) ≥ 115, < 150 1.169 1.123 1.229 1.299 (1.227, 1.238 1.272 1.306 1.321 (1.112, 1.228) (1.066, 1.183) (1.161, 1.300) 1.376) (1.167, 1.313) (1.198, 1.351) (1.229, 1.387) (1.244, 1.403) ≥ 150, < 250 1.197 1.095 1.165 1.224 (1.152, 1.274 1.310 1.313 1.269 (1.138, 1.259) (1.038, 1.154) (1.100, 1.235) 1.300) (1.197, 1.355) (1.228, 1.397) (1.232, 1.399) (1.191, 1.353) ≥ 250 1.147 0.998 1.054 1.095 (1.019, 1.128 1.130 1.133 1.093 (1.077, 1.222) (0.934, 1.067) (0.982, 1.131) 1.178) (1.046, 1.216) (1.045, 1.222) (1.048, 1.226) (1.010, 1.183) Preschoolers < 35 1 (ref) 1 (ref) 1 (ref) 1 (ref) 1 (ref) 1 (ref) 1 (ref) 1 (ref) ≥ 35, < 75 1.135 1.111 1.224 1.265 (1.203, 1.248 1.220 1.204 1.179 (1.091, 1.180) (1.064, 1.160) (1.167, 1.283) 1.330) (1.185, 1.315) (1.156, 1.288) (1.141, 1.271) (1.117, 1.245) ≥ 75, < 115 1.159 1.120 1.220 1.279 (1.211, 1.310 1.350 1.326 1.285 (1.108, 1.212) (1.068, 1.175) (1.159, 1.284) 1.351) (1.239, 1.386) (1.274, 1.430) (1.251, 1.405) (1.213, 1.362) ≥ 115, < 150 1.172 1.134 1.208 1.289 (1.212, 1.251 1.308 1.341 1.348 (1.110, 1.238) (1.071, 1.201) (1.136, 1.285) 1.371) (1.175, 1.333) (1.227, 1.395) (1.257, 1.431) (1.263, 1.438) ≥ 150, < 250 1.221 1.096 1.163 1.240 (1.161, 1.284 1.336 1.364 1.316 (1.155, 1.291) (1.034, 1.162) (1.091, 1.239) 1.324) (1.201, 1.373) (1.246, 1.432) (1.273, 1.461) (1.228, 1.410) ≥ 250 1.143 0.999 1.049 1.112 (1.027, 1.162 1.172 1.168 1.127 (1.066, 1.226) (0.928, 1.076) (0.971, 1.133) 1.204) (1.071, 1.261) (1.077, 1.276) (1.072, 1.272) (1.033, 1.229) School-age children < 35 1 (ref) 1 (ref) 1 (ref) 1 (ref) 1 (ref) 1 (ref) 1 (ref) 1 (ref) ≥ 35, < 75 1.134 1.054 1.181 1.161 1.113 1.062 1.087 1.059 (1.032, 1.245) (0.947, 1.173) (1.042, 1.338) (1.009, 1.336) (0.953, 1.299) (0.904, 1.247) (0.926, 1.277) (0.902, 1.244) ≥ 75, < 115 1.177 1.047 1.142 1.040 1.050 1.074 1.067 1.068 (1.062, 1.303) (0.935, 1.173) (1.003, 1.301) (0.898, 1.204) (0.894, 1.232) (0.909, 1.268) (0.903, 1.260) (0.905, 1.261) ≥ 115, < 150 1.124 1.012 1.212 1.158 0.993 0.939 1.006 1.053 (0.998, 1.265) (0.889, 1.152) (1.047, 1.403) (0.989, 1.355) (0.836, 1.181) (0.786, 1.120) (0.844, 1.199) (0.885, 1.254) ≥ 150, < 250 1.092 1.037 1.121 1.053 1.066 1.044 0.997 0.962 (0.967, 1.233) (0.908, 1.183) (0.966, 1.301) (0.895, 1.239) (0.894, 1.270) (0.872, 1.251) (0.833, 1.193) (0.804, 1.152) ≥ 250 1.201 1.004 1.059 0.966 0.894 (0.728, 0.885 0.977 0.936 (1.038, 1.390) (0.855, 1.180) (0.888, 1.263) (0.800, 1.168) 1.099) (0.714, 1.098) (0.792, 1.205) (0.761, 1.153) Boys < 35 1 (ref) 1 (ref) 1 (ref) 1 (ref) 1 (ref) 1 (ref) 1 (ref) 1 (ref) ≥ 35, < 75 1.142 1.151 1.240 1.269 1.280 1.241 1.212 1.179 (1.094, 1.192) (1.098, 1.207) (1.177, 1.307) (1.200, 1.342) (1.208, 1.357) (1.168, 1.318) (1.141, 1.287) (1.110, 1.252) ≥ 75, < 115 1.190 1.139 1.232 1.265 1.311 1.348 1.312 1.275 (1.134, 1.249) (1.080, 1.200) (1.165, 1.303) (1.191, 1.343) (1.232, 1.396) (1.263, 1.438) (1.230, 1.398) (1.195, 1.359) ≥ 115, < 150 1.136 1.127 1.212 1.290 1.279 1.312 1.331 1.327 (1.071, 1.206) (1.058, 1.199) (1.133, 1.297) (1.206, 1.381) (1.193, 1.372) (1.222, 1.409) (1.239, 1.429) (1.236, 1.425) ≥ 150, < 250 1.187 1.115 1.172 1.220 1.272 1.289 1.275 1.214 (1.118, 1.261) (1.047, 1.188) (1.094, 1.256) (1.136, 1.310) (1.181, 1.369) (1.194, 1.391) (1.182, 1.375) (1.126, 1.310) ≥ 250 1.162 1.025 1.073 1.118 1.179 1.164 1.131 1.082 (1.078, 1.253) (0.946, 1.110) (0.987, 1.167) (1.025, 1.219) (1.078, 1.290) (1.061, 1.278) (1.030, 1.241) (0.985, 1.189) Girls < 35 1 (ref) 1 (ref) 1 (ref) 1 (ref) 1 (ref) 1 (ref) 1 (ref) 1 (ref) ≥ 35, < 75 1.133 1.033 1.227 1.296 1.225 1.216 1.231 1.224 (1.059, 1.211) (0.960, 1.112) 0. (1.130, 1.333) (1.186, 1.415) (1.119, 1.342) (1.106, 1.337) (1.119, 1.355) (1.111, 1.348) ≥ 75, < 115 1.115 1.088 1.216 1.278 1.292 1.346 1.336 1.315 (1.033, 1.204) (1.004, 1.180) (1.114, 1.328) (1.162, 1.405) (1.173, 1.424) (1.217, 1.489) (1.207, 1.478) (1.188, 1.456) ≥ 115, < 150 1.249 1.114 1.270 1.325 1.144 1.182 1.248 1.309 (1.142, 1.367) (1.012, 1.225) (1.144, 1.409) (1.192, 1.474) (1.026, 1.276) (1.057, 1.323) (1.115, 1.397) (1.168, 1.466) ≥ 150, < 250 1.222 1.048 1.147 1.233 1.275 1.356 1.404 1.406 (1.114, 1.341) (0.951, 1.155) (1.031, 1.277) (1.102, 1.379) (1.137, 1.429) (1.205, 1.526) (1.248, 1.579) (1.249, 1.583) ≥ 250 1.111 0.937 1.008 1.043 1.013 1.054 1.141 1.122 (0.990, 1.247) (0.829, 1.058) (0.885, 1.147) (0.913, 1.193) (0.882, 1.164) (0.912, 1.217) (0.987, 1.318) (0.969, 1.299) Note. Preschoolers, children under 6 years old; School-age children, children aged 7 to 14 years. The model was adjusted for long-term time trends, season, effect of holidays, day of week, daily mean temperature (T), mean wind speed (W), relative humidity (RH), SO2, and NO2 (Model 3). We performed sensitivity analyses to test whether the regression results would qualitatively change if different covariates were used. Changes in covariates did not substantially affect the estimated effects of PM2.5 in different AQGs, thereby suggesting that our findings are relatively robust in this respect (Supplementary Table S4 available in www.besjournal.com).
Table Supplementary Table S4. Sensitivity Analyses of All Outpatient Visits for Childhood Asthma for PM2.5 Exposure in Different Air Quality Grades in Shijiazhuang, China (2013-2015)
Air Quality Grades, Concentration of PM2.5, μg/m3 Model 2
(95% CI)Model 2 + SO2
(95% CI)Model 2 + NO2
(95% CI)Model 2 + SO2 + NO2
(95% CI)Grade Ⅰ, (< 35) 1 (ref) 1 (ref) 1 (ref) 1 (ref) Grade Ⅱ, (35, 75) 1.166 (1.126, 1.209) 1.201 (1.159, 1.245) 1.135 (1.095, 1.177) 1.139 (1.098, 1.181) Grade Ⅲ, (75, 115) 1.192 (1.146, 1.240) 1.264 (1.214, 1.316) 1.140 (1.094, 1.188) 1.168 (1.121, 1.217) Grade Ⅳ, (115, 150) 1.195 (1.139, 1.253) 1.301 (1.240, 1.366) 1.124 (1.069, 1.181) 1.169 (1.112, 1.228) Grade Ⅴ, (150, 250) 1.210 (1.155, 1.267) 1.379 (1.314, 1.447) 1.110 (1.055, 1.169) 1.197 (1.138, 1.259) Grade Ⅵ, (≥ 250) 1.186 (1.123, 1.252) 1.461 (1.379, 1.548) 1.033 (0.969, 1.102) 1.147 (1.077, 1.222) Note. Model 2 was adjusted for long-term time trends, season, effect of holidays, day of week, daily mean temperature (T), mean wind speed (W), and relative humidity (RH). Figures are presented as RRs and 95% CIs. This study, to our best knowledge, is the first to evaluate the effects of different national AQGs divided by the daily average concentrations of PM2.5 on outpatient visits for childhood asthma in China. However, several limitations should be acknowledged. First, similar to other ecological studies, we used city-wide average concentrations of air pollutants rather than personal exposure measures, which may cause exposure misclassification. In addition, only one general hospital was examined, which may limit the generalizability of our results. Multi-center and larger-sized studies, as well as mechanism studies on the harmful health effects of PM2.5 related to childhood asthma, are warranted.
In summary, our study results reveal that low PM2.5 concentrations may lead to childhood asthma outpatient visits. In particular, a nonlinear rapidly rising trend was found in RRs for childhood asthma from good-air quality to polluted environments. Prevention of childhood asthma should focus on AQGs of Grades Ⅱ and Ⅲ. Outpatient visits were more related to PM2.5 among children under 6 years old (preschoolers) than in the 7-14 Years old group. This population should thus be considered as a sensitive target in prevention programs requiring more specific care. The findings provide novel information on the influence of air quality on pediatric asthma patients in Shijiazhuang. Compared with the WHO Air Quality Guidelines, the PM2.5 concentration threshold in local child disease prevention and control centers and hospitals should be adjusted to < 35 μg/m3 to prevent childhood asthma.
Thanks to all the participants in this study. We would like to thank Dr. NING Gui Cai and Prof. LUO Bin for their guidance on our drawing and manuscript.
doi: 10.3967/bes2018.120
Effects of PM2.5 Exposure in Different Air Quality Grades on Daily Outpatient Visits for Childhood Asthma in Shijiazhuang, China
-
-
Figure 1. Association between PM2.5 exposure in different air quality grades and the RRs of outpatient visits for childhood asthma in Shijiazhuang, China (2013-2015). The model was adjusted for long-term time trends, season, effect of holidays, day of week, daily mean temperature (T), mean wind speed (W), relative humidity (RH), SO2, and NO2 (Model 3).
Supplementary Figure S1. Association between PM2.5 exposure in different air quality grades and the RRs of outpatient visits for all childhood asthma in Shijiazhuang, China (2013-2015). The model was adjusted for long-term time trends, season, effect of holidays, day of week, daily mean temperature (T), mean wind speed (W), relative humidity (RH), SO2, and NO2 (Model 3).
Figure 2. Highest estimated lag day effects of PM2.5 exposure in different air quality grades on outpatient visits for childhood asthma in Shijiazhuang, China (2013-2015). Labels indicate the corresponding average lag days of the highest estimated effect (lag0-lag07) for different AQGs. The model was adjusted for long-term time trends, season, effect of holidays, day of week, daily mean temperature (T), mean wind speed (W), relative humidity (RH), SO2, and NO2 (Model 3).
Supplementary Table S1. Summary Statistics of Daily Outpatient Visits for Childhood Asthma, Air Pollutants and Meteorological Factors in Shijiazhuang, China (2013-2015)
Daily Data Mean SD Min P25 Median P75 Max Outpatient visits for childhood asthma All 32.0 19.0 1.0 20.0 27.0 39.0 136.0 Preschoolers 26.8 19.3 1.0 14.0 20.0 33.0 132.0 School-age children 5.2 4.0 0.0 2.0 4.0 7.0 24.0 Boys 22.6 13.4 0.0 14.0 19.0 28.0 93.0 Girls 9.4 6.8 0.0 5.0 8.0 11.0 49.0 Air pollutants (μg/m3) PM2.5 117.4 101.6 5.0 51.3 87.2 148.6 755.9 SO2 64.9 70.8 1.3 19.0 40.0 87.1 516.0 NO2 50.2 32.7 4.4 27.4 47.0 67.0 203.0 CO 1.6 1.4 0.1 0.7 1.1 1.7 12.6 O3 104.4 66.5 2.0 53.0 95.0 143.0 357.0 Meteorological factors T (℃) 15.6 10.6 -8.1 6.7 18.0 24.9 35.5 P (hPa) 1003.3 9.6 982.0 995.0 1003.0 1011.0 1030.0 RH (%) 58.7 19.7 12.0 44.0 59.0 74.0 99.0 W (m/s) 1.6 0.8 0.3 1.1 1.5 2.0 6.4 Note. Preschoolers, children under 6 years old; School-age children, children aged 7 to 14 years. SD, standard deviation; Px, x-th percentiles; Min, minimum; Max, maximum; T, mean temperature; P, mean atmospheric pressure; W, mean wind speed; RH, relative humidity.  下载: 导出CSV
Supplementary Table S2. Association between an Increase of 10 μg/m3 in PM2.5 Exposure and the RRs of Outpatient Visits for Childhood Asthma in Shijiazhuang, China (2013-2015)
Population Number (%) Relative Risk
(95% Confidence Intervals)All 31, 907 (100) 1.015 (1.011, 1.020) Preschoolers (0-6 years) 26, 649 (83.5) 1.016 (1.012, 1.021) School-age children (7-14 years) 5, 258 (16.5) 1.008 (0.997, 1.018) Boys 22, 539 (70.6) 1.014 (1.009, 1.020) Girls 9, 368 (29.4) 1.018 (1.010, 1.026) Note. The model was adjusted for long-term time trends, season, effect of holidays, day of week, daily mean temperature (T), mean wind speed (W), relative humidity (RH), SO2, and NO2 (Model 3).
下载: 导出CSV
Table 1. Association between PM2.5 Exposure in Different Air Quality Grades and Relative Risk of Outpatient Visits for Childhood Asthma in Shijiazhuang, China (2013-2015)
Air Quality Grades,
Concentration of PM2.5, μg/m3Days (%) Relative Risk and 95% Confidence Intervals Model 1 Model 2 Model 3 Grade Ⅰ, (< 35) 168 (15.3) 1 (ref) 1 (ref) 1 (ref) Grade Ⅱ, (35, 75) 286 (26.1) 1.176 (1.135, 1.218) 1.166 (1.126, 1.209) 1.139 (1.098, 1.181) Grade Ⅲ, (75, 115) 225 (20.5) 1.192 (1.148, 1.238) 1.192 (1.146, 1.240) 1.168 (1.121, 1.217) Grade Ⅳ, (115, 150) 135 (12.3) 1.210 (1.156, 1.266) 1.195 (1.139, 1.253) 1.169 (1.112, 1.228) Grade Ⅴ, (150, 250) 160 (14.6) 1.226 (1.173, 1.280) 1.210 (1.155, 1.267) 1.197 (1.138, 1.259) Grade Ⅵ, (≥ 250) 121 (11.1) 1.203 (1.144, 1.265) 1.186 (1.123, 1.252) 1.147 (1.077, 1.222) Note. Model 1 was adjusted for long-term time trends, season, effect of holidays, and day of week; Model 2 was additionally adjusted for mean temperature (T), mean wind speed (W), and relative humidity (RH) based on Model 1; Model 3 was additionally adjusted for SO2 and NO2 based on Model 2.
下载: 导出CSV
Supplementary Table S3. Estimated Relative Risks (RRs) on Childhood Asthma Outpatient Visits Associated with PM2.5 Exposure in Different Air Quality Grades in the Considered Lags in Shijiazhuang, China (2013-2015)
Population PM2.5(μg/m3) Relative Risks (RRs) and 95% Confidence Intervals (95% CIs) Lag 0 Lag 01 Lag 02 Lag 03 Lag 04 Lag 05 Lag 06 Lag 07 All < 35 1 (ref) 1 (ref) 1 (ref) 1 (ref) 1 (ref) 1 (ref) 1 (ref) 1 (ref) ≥ 35, < 75 1.139 1.115 1.236 1.276 (1.217, 1.264 1.233 1.217 1.191 (1.098, 1.181) (1.072, 1.161) (1.183, 1.292) 1.338) (1.203, 1.328) (1.172, 1.297) (1.157, 1.281) (1.131, 1.253) ≥ 75, < 115 1.168 1.123 1.227 1.267 (1.205, 1.305 1.346 1.317 1.285 (1.121, 1.217) (1.075, 1.174) (1.170, 1.286) 1.333) (1.238, 1.375) (1.275, 1.422) (1.248, 1.391) (1.217, 1.357) ≥ 115, < 150 1.169 1.123 1.229 1.299 (1.227, 1.238 1.272 1.306 1.321 (1.112, 1.228) (1.066, 1.183) (1.161, 1.300) 1.376) (1.167, 1.313) (1.198, 1.351) (1.229, 1.387) (1.244, 1.403) ≥ 150, < 250 1.197 1.095 1.165 1.224 (1.152, 1.274 1.310 1.313 1.269 (1.138, 1.259) (1.038, 1.154) (1.100, 1.235) 1.300) (1.197, 1.355) (1.228, 1.397) (1.232, 1.399) (1.191, 1.353) ≥ 250 1.147 0.998 1.054 1.095 (1.019, 1.128 1.130 1.133 1.093 (1.077, 1.222) (0.934, 1.067) (0.982, 1.131) 1.178) (1.046, 1.216) (1.045, 1.222) (1.048, 1.226) (1.010, 1.183) Preschoolers < 35 1 (ref) 1 (ref) 1 (ref) 1 (ref) 1 (ref) 1 (ref) 1 (ref) 1 (ref) ≥ 35, < 75 1.135 1.111 1.224 1.265 (1.203, 1.248 1.220 1.204 1.179 (1.091, 1.180) (1.064, 1.160) (1.167, 1.283) 1.330) (1.185, 1.315) (1.156, 1.288) (1.141, 1.271) (1.117, 1.245) ≥ 75, < 115 1.159 1.120 1.220 1.279 (1.211, 1.310 1.350 1.326 1.285 (1.108, 1.212) (1.068, 1.175) (1.159, 1.284) 1.351) (1.239, 1.386) (1.274, 1.430) (1.251, 1.405) (1.213, 1.362) ≥ 115, < 150 1.172 1.134 1.208 1.289 (1.212, 1.251 1.308 1.341 1.348 (1.110, 1.238) (1.071, 1.201) (1.136, 1.285) 1.371) (1.175, 1.333) (1.227, 1.395) (1.257, 1.431) (1.263, 1.438) ≥ 150, < 250 1.221 1.096 1.163 1.240 (1.161, 1.284 1.336 1.364 1.316 (1.155, 1.291) (1.034, 1.162) (1.091, 1.239) 1.324) (1.201, 1.373) (1.246, 1.432) (1.273, 1.461) (1.228, 1.410) ≥ 250 1.143 0.999 1.049 1.112 (1.027, 1.162 1.172 1.168 1.127 (1.066, 1.226) (0.928, 1.076) (0.971, 1.133) 1.204) (1.071, 1.261) (1.077, 1.276) (1.072, 1.272) (1.033, 1.229) School-age children < 35 1 (ref) 1 (ref) 1 (ref) 1 (ref) 1 (ref) 1 (ref) 1 (ref) 1 (ref) ≥ 35, < 75 1.134 1.054 1.181 1.161 1.113 1.062 1.087 1.059 (1.032, 1.245) (0.947, 1.173) (1.042, 1.338) (1.009, 1.336) (0.953, 1.299) (0.904, 1.247) (0.926, 1.277) (0.902, 1.244) ≥ 75, < 115 1.177 1.047 1.142 1.040 1.050 1.074 1.067 1.068 (1.062, 1.303) (0.935, 1.173) (1.003, 1.301) (0.898, 1.204) (0.894, 1.232) (0.909, 1.268) (0.903, 1.260) (0.905, 1.261) ≥ 115, < 150 1.124 1.012 1.212 1.158 0.993 0.939 1.006 1.053 (0.998, 1.265) (0.889, 1.152) (1.047, 1.403) (0.989, 1.355) (0.836, 1.181) (0.786, 1.120) (0.844, 1.199) (0.885, 1.254) ≥ 150, < 250 1.092 1.037 1.121 1.053 1.066 1.044 0.997 0.962 (0.967, 1.233) (0.908, 1.183) (0.966, 1.301) (0.895, 1.239) (0.894, 1.270) (0.872, 1.251) (0.833, 1.193) (0.804, 1.152) ≥ 250 1.201 1.004 1.059 0.966 0.894 (0.728, 0.885 0.977 0.936 (1.038, 1.390) (0.855, 1.180) (0.888, 1.263) (0.800, 1.168) 1.099) (0.714, 1.098) (0.792, 1.205) (0.761, 1.153) Boys < 35 1 (ref) 1 (ref) 1 (ref) 1 (ref) 1 (ref) 1 (ref) 1 (ref) 1 (ref) ≥ 35, < 75 1.142 1.151 1.240 1.269 1.280 1.241 1.212 1.179 (1.094, 1.192) (1.098, 1.207) (1.177, 1.307) (1.200, 1.342) (1.208, 1.357) (1.168, 1.318) (1.141, 1.287) (1.110, 1.252) ≥ 75, < 115 1.190 1.139 1.232 1.265 1.311 1.348 1.312 1.275 (1.134, 1.249) (1.080, 1.200) (1.165, 1.303) (1.191, 1.343) (1.232, 1.396) (1.263, 1.438) (1.230, 1.398) (1.195, 1.359) ≥ 115, < 150 1.136 1.127 1.212 1.290 1.279 1.312 1.331 1.327 (1.071, 1.206) (1.058, 1.199) (1.133, 1.297) (1.206, 1.381) (1.193, 1.372) (1.222, 1.409) (1.239, 1.429) (1.236, 1.425) ≥ 150, < 250 1.187 1.115 1.172 1.220 1.272 1.289 1.275 1.214 (1.118, 1.261) (1.047, 1.188) (1.094, 1.256) (1.136, 1.310) (1.181, 1.369) (1.194, 1.391) (1.182, 1.375) (1.126, 1.310) ≥ 250 1.162 1.025 1.073 1.118 1.179 1.164 1.131 1.082 (1.078, 1.253) (0.946, 1.110) (0.987, 1.167) (1.025, 1.219) (1.078, 1.290) (1.061, 1.278) (1.030, 1.241) (0.985, 1.189) Girls < 35 1 (ref) 1 (ref) 1 (ref) 1 (ref) 1 (ref) 1 (ref) 1 (ref) 1 (ref) ≥ 35, < 75 1.133 1.033 1.227 1.296 1.225 1.216 1.231 1.224 (1.059, 1.211) (0.960, 1.112) 0. (1.130, 1.333) (1.186, 1.415) (1.119, 1.342) (1.106, 1.337) (1.119, 1.355) (1.111, 1.348) ≥ 75, < 115 1.115 1.088 1.216 1.278 1.292 1.346 1.336 1.315 (1.033, 1.204) (1.004, 1.180) (1.114, 1.328) (1.162, 1.405) (1.173, 1.424) (1.217, 1.489) (1.207, 1.478) (1.188, 1.456) ≥ 115, < 150 1.249 1.114 1.270 1.325 1.144 1.182 1.248 1.309 (1.142, 1.367) (1.012, 1.225) (1.144, 1.409) (1.192, 1.474) (1.026, 1.276) (1.057, 1.323) (1.115, 1.397) (1.168, 1.466) ≥ 150, < 250 1.222 1.048 1.147 1.233 1.275 1.356 1.404 1.406 (1.114, 1.341) (0.951, 1.155) (1.031, 1.277) (1.102, 1.379) (1.137, 1.429) (1.205, 1.526) (1.248, 1.579) (1.249, 1.583) ≥ 250 1.111 0.937 1.008 1.043 1.013 1.054 1.141 1.122 (0.990, 1.247) (0.829, 1.058) (0.885, 1.147) (0.913, 1.193) (0.882, 1.164) (0.912, 1.217) (0.987, 1.318) (0.969, 1.299) Note. Preschoolers, children under 6 years old; School-age children, children aged 7 to 14 years. The model was adjusted for long-term time trends, season, effect of holidays, day of week, daily mean temperature (T), mean wind speed (W), relative humidity (RH), SO2, and NO2 (Model 3).
下载: 导出CSV
Supplementary Table S4. Sensitivity Analyses of All Outpatient Visits for Childhood Asthma for PM2.5 Exposure in Different Air Quality Grades in Shijiazhuang, China (2013-2015)
Air Quality Grades, Concentration of PM2.5, μg/m3 Model 2
(95% CI)Model 2 + SO2
(95% CI)Model 2 + NO2
(95% CI)Model 2 + SO2 + NO2
(95% CI)Grade Ⅰ, (< 35) 1 (ref) 1 (ref) 1 (ref) 1 (ref) Grade Ⅱ, (35, 75) 1.166 (1.126, 1.209) 1.201 (1.159, 1.245) 1.135 (1.095, 1.177) 1.139 (1.098, 1.181) Grade Ⅲ, (75, 115) 1.192 (1.146, 1.240) 1.264 (1.214, 1.316) 1.140 (1.094, 1.188) 1.168 (1.121, 1.217) Grade Ⅳ, (115, 150) 1.195 (1.139, 1.253) 1.301 (1.240, 1.366) 1.124 (1.069, 1.181) 1.169 (1.112, 1.228) Grade Ⅴ, (150, 250) 1.210 (1.155, 1.267) 1.379 (1.314, 1.447) 1.110 (1.055, 1.169) 1.197 (1.138, 1.259) Grade Ⅵ, (≥ 250) 1.186 (1.123, 1.252) 1.461 (1.379, 1.548) 1.033 (0.969, 1.102) 1.147 (1.077, 1.222) Note. Model 2 was adjusted for long-term time trends, season, effect of holidays, day of week, daily mean temperature (T), mean wind speed (W), and relative humidity (RH). Figures are presented as RRs and 95% CIs.
下载: 导出CSV
-
[1] Bai J, Zhao J, Shen KL, et al. Current trends of the prevalence of childhood asthma in three Chinese cities:a multicenter epidemiological survey. Biomed Environ Sci, 2010; 23, 453-7. doi: 10.1016/S0895-3988(11)60007-X [2] Tetreault LF, Doucet M, Gamache P, et al. Childhood Exposure to Ambient Air Pollutants and the Onset of Asthma:An Administrative Cohort Study in Quebec. Environ Health Perspect, 2016; 124, 1276-82. doi: 10.1289/ehp.1509838 [3] Li X, Jiang Y, Yin L, et al. Evaluation of the environmental epidemiologic data and methodology for the air quality standard in Beijing. Int J Biometeorol, 2017; 61, 1511-7. doi: 10.1007/s00484-017-1330-4 [4] Wang MZ, Zheng S, He SL, et al. The association between diurnal temperature range and emergency room admissions for cardiovascular, respiratory, digestive and genitourinary disease among the elderly:a time series study. Sci Total Environ, 2013; 456-457, 370-5. doi: 10.1016/j.scitotenv.2013.03.023 [5] Hua J, Yin Y, Peng L, et al. Acute effects of black carbon and PM2.5 on children asthma admissions:a time-series study in a Chinese city. Sci Total Environ, 2014; 481, 433-8. doi: 10.1016/j.scitotenv.2014.02.070 [6] Cai J, Zhao A, Zhao J, et al. Acute effects of air pollution on asthma hospitalization in Shanghai, China. Environ Pollut, 2014; 191, 139-44. doi: 10.1016/j.envpol.2014.04.028 [7] Ding L, Zhu D, Peng D, et al. Air pollution and asthma attacks in children:A case-crossover analysis in the city of Chongqing, China. Environ Pollut, 2017; 220, 348-53. doi: 10.1016/j.envpol.2016.09.070 [8] Alhanti BA, Chang HH, Winquist A, et al. Ambient air pollution and emergency department visits for asthma:a multi-city assessment of effect modification by age. J Expo Sci Environ Epidemiol, 2016; 26, 180-8. doi: 10.1038/jes.2015.57 [9] Zhao Y, Wang S, Lang L, et al. Ambient fine and coarse particulate matter pollution and respiratory morbidity in Dongguan, China. Environ Pollut, 2017; 222, 126-31. doi: 10.1016/j.envpol.2016.12.070 [10] Mirabelli MC, Vaidyanathan A, Flanders WD, et al. Outdoor PM2.5, Ambient Air Temperature, and Asthma Symptoms in the Past 14 Days among Adults with Active Asthma. Environ Health Perspect, 2016; 124, 1882-90. doi: 10.1289/EHP92 -

 点击查看大图
计量
- 文章访问数: 1867
- HTML全文浏览量: 422
- PDF下载量: 63
- 被引次数: 0

 Quick Links