

 下载:
下载:


-
Due to an increasing life expectancy and decreasing fertility rate, China officially entered a stage of increased ageing in 2011[1]. According to China’s seventh national census, 2019, the country’s overall population was 1.44 billion, and this included eighteen per cent of people over 60 (13.5% of people exceeding 65 years old). Generally, the ageing population gives rise to challenges around healthcare and socioeconomics for policymakers and caregivers. According to recent estimates, the population will increase to approximately 483 million by 2050, with 108 million people over the age of 80. Under such circumstances, improving the quality of life of those in this demographic is urgent and will play a vital role in social stability.
The critical contribution of the neighborhood environment to the quality of life of the ageing population was recognized many years ago, and since this time extensive research has been conducted on the health of older adults in China[2]. Elderly people living in pedestrian areas that are in a good condition (e.g., those that include safe streets and public spaces, strong connectivity and so on) are more likely to exhibit positive behaviors and experience positive physical and mental health outcomes[3-4].
The impact of the built environment on physical health is complex, and there is an inseparable relationship between them. Physical activity is one of the bridges that connects the built environment and physical health. Although the link between the built environment, behaviors, and health has long been known, most studies have focused on a specific location, and only a few empirical investigations have considered older individuals.
Diet and socializing are also major metavariables contributing to the relationship between the built environment and individuals’ health. Studies have indicated that the opening of a grocery establishment alone may not impact consumption and BMI. The built environment can affect social outcomes by providing open spaces, increasing traffic and road quality, and land use mix. Additionally, better access to transportation can reduce social exclusion and social isolation[5]. However, current studies fail to discuss three behaviors at the same time. Instead, many of them focus on just one area. In addition, studies focusing on older age groups are limited.
Chinese Longitudinal Healthy Longevity Survey (CLHLS; 1998-2018; officially released in 2020: https://www.icpsr.umich.edu/web/NACDA/series/487) is the earliest and longest social science survey in China. The Healthy Aging and Development Research Center and National Development Academy of Peking University conducted the follow-up survey. The survey covered 23 provinces and autonomous regions across China. Data from this tracking survey was acquired from older adults over 65 years old. The survey included basic personal information, family structure and financial support, health status, physical measurement, medical services, health insurance, work, retirement and pensions, income, consumption, assets, and essential community information. After deleting the sample data that included missing values, we still had over 4,000 samples for analysis conducted in the current study.
Table A1 shows the descriptive statistics of the variables (details are given in the Supplementary Table S1, available in www.besjournal.com). For the current study’s focus, six socio-demographic variables were chosen to explore the socio-demographic factors affecting physical activity among the elderly, including age, sex, family size, family income (total household income for the past year), ethnicity, and school age. As guided by other scholars and the theoretical model of environments and health outcomes, six built-environment characteristics were chosen. Therefore, the variables used in the current study are living location, population density, greenness rate, distance from the city centre (we use distance from the city centre as a reference for destination accessibility), the flatness of the land, and standard area of environmental noise. The physical health outcomes were measured using the body mass index (BMI), instrumental activity of daily living (IADL), and chronic diseases.
Table 1. Model results of behaviors and physical health
Behaviours Chronic Diseases IADL BMI RF XGBoost Stacking RF XGBoost Stacking RF XGBoost Stacking Dietary intake 0.3495 0.3833 0.3700 0.2575 0.0117 0.0609 0.2575 0.2815 0.3433 Social interaction 0.0828 0.1826 0.1427 0.6337 0.9270 0.8683 0.6337 0.2436 0.1778 Physical activity 0.5677 0.4342 0.4876 0.1088 0.0612 0.0708 0.1088 0.4748 0.4789 Model evaluation index Mean Absolute Error 0.1538 0.2548 0.1149 0.2701 0.4057 0.1513 0.0914 0.1786 0.0785 Root Mean Squared Error 0.3922 0.3569 0.2658 0.3746 0.1832 0.1465 0.1529 0.1756 0.0847 Note. RF, Random forest; XGBoost, eXtreme gradient boosting; IADL, Instrumental activities of daily living; BMI, Body mass index. Table S1. Descriptive statistics of all study variables (i.e., socio-demographic variables, built environment, physical condition, and behavior; after data cleaning)
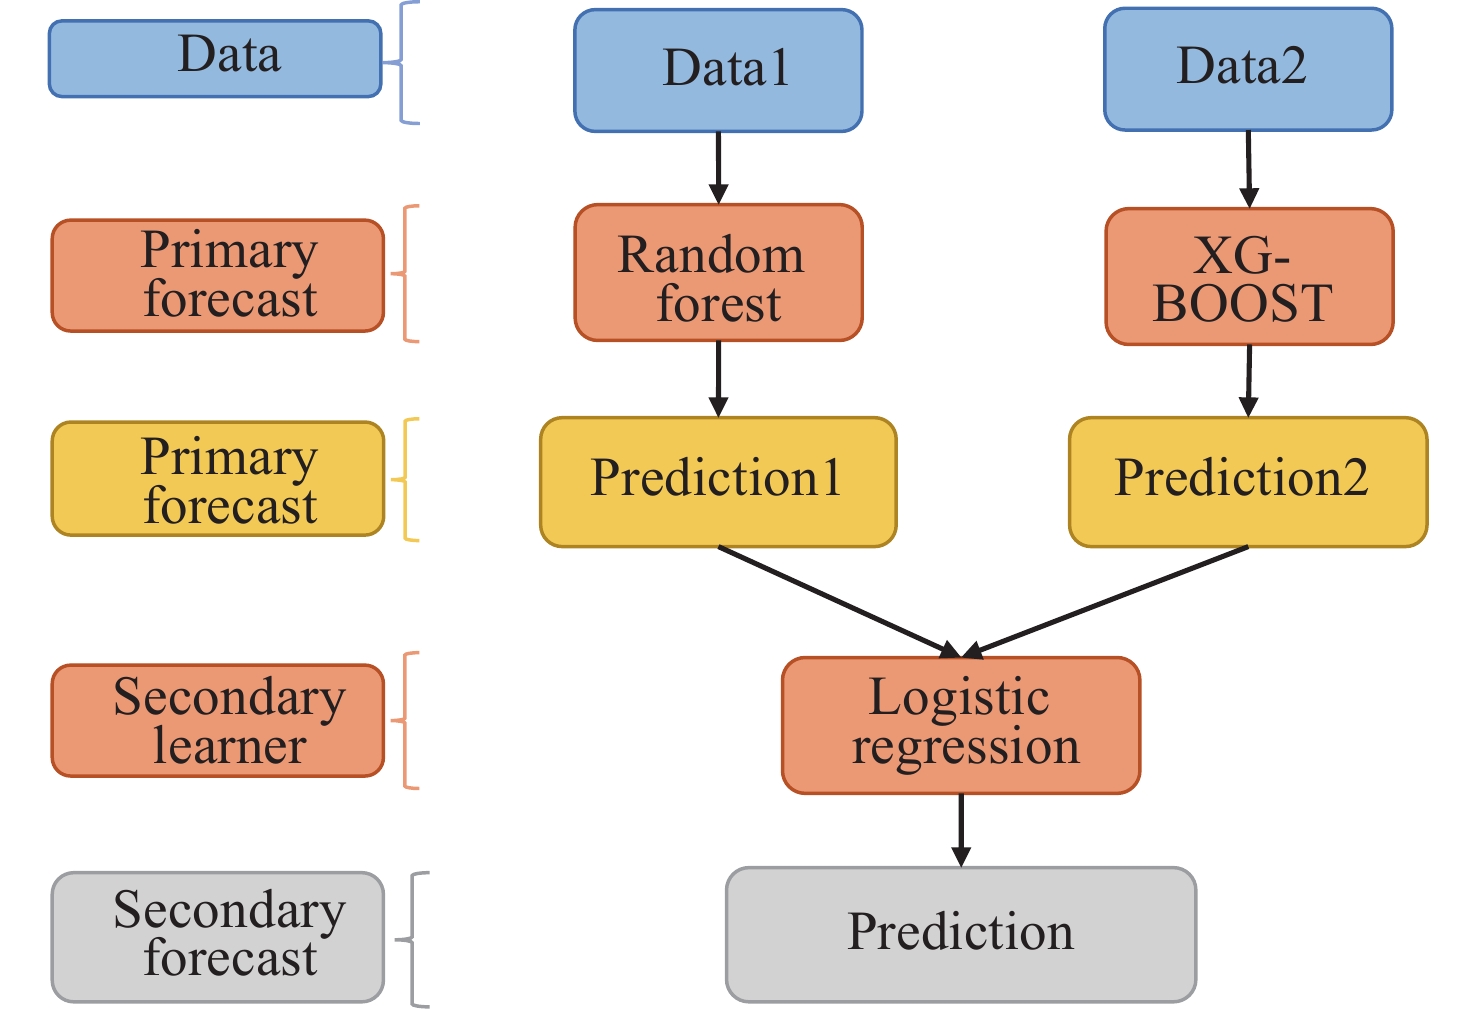
Characteristics Description Mean/N Std. /Dev. Socio-demographic variables Age Age of the elderly 85.31 10.77 Sex Sex of the elderly Male 3,316 Female 3,876 Household size People in the house 2.66 5.73 Household income Total family income last year 33,547 31,959.01 School-age Years of study 2.52 4.68 Built-environment variables Flatness of land Flat area of land as a percentage of the total area 49.97 35.72 Population density Population density within the neighborhood (unit:1/km2) 634.72 474.953 Greenness rate Density of green area within the neighborhood (unit:1/km2) 720.27 1,721.72 Living location Living in a city or rural area City 3,222 Rural 3,980 Standard area of noise Standard area of environmental noise (km2) 59.19 69.41 Access to the city centre Distance from the home to the nearest city centre 170.57 126.72 Physical condition Chronic disease Disease information was self-rated and instrumentally measured in questionnaires 0.008 Have no chronic disease 655 Have chronic disease 6,537 BMI Body mass index 22.654 IDAL IDAL to assess the independent living skills of older adults 2.694 Fully care 5,549 A mild disability 864 Moderate disability 627 Severe disability 152 Intermediate variables Physical activity (a week) Have been physically active in the past week Have exercise regularly 1,841 Have not regularly exercise 5,051 Dietary Intake (a week) To investigate the daily dietary habits of the elderly group per week Normal (more than 400 g) 461 Unnormal 6,731 Social Interaction (a week) Whether to participate in social activities regularly per week Take part in organised social activities regularly 1,200 Otherwise 5,829 Sample size 7,100 In this study, the author divided the data into 75% of the training set and 25% of the testing set, and then used the results of Random Forest[6] and XG-Boost[7] as inputs to import logistic regression. The output results of the logistic regression constituted the final research results. This model is referred to as the Stacking model[8] (Figure 1). The authors performed 5-fold CV when using the Random Forest model as well as the XGBoost model. In essence, logistic regression is linear regression, and the special feature is that a layer of logical function g(z) is a sigmoid function and is added to the mapping of features onto the results. Therefore, logistic regression = linear regression + the sigmoid function.
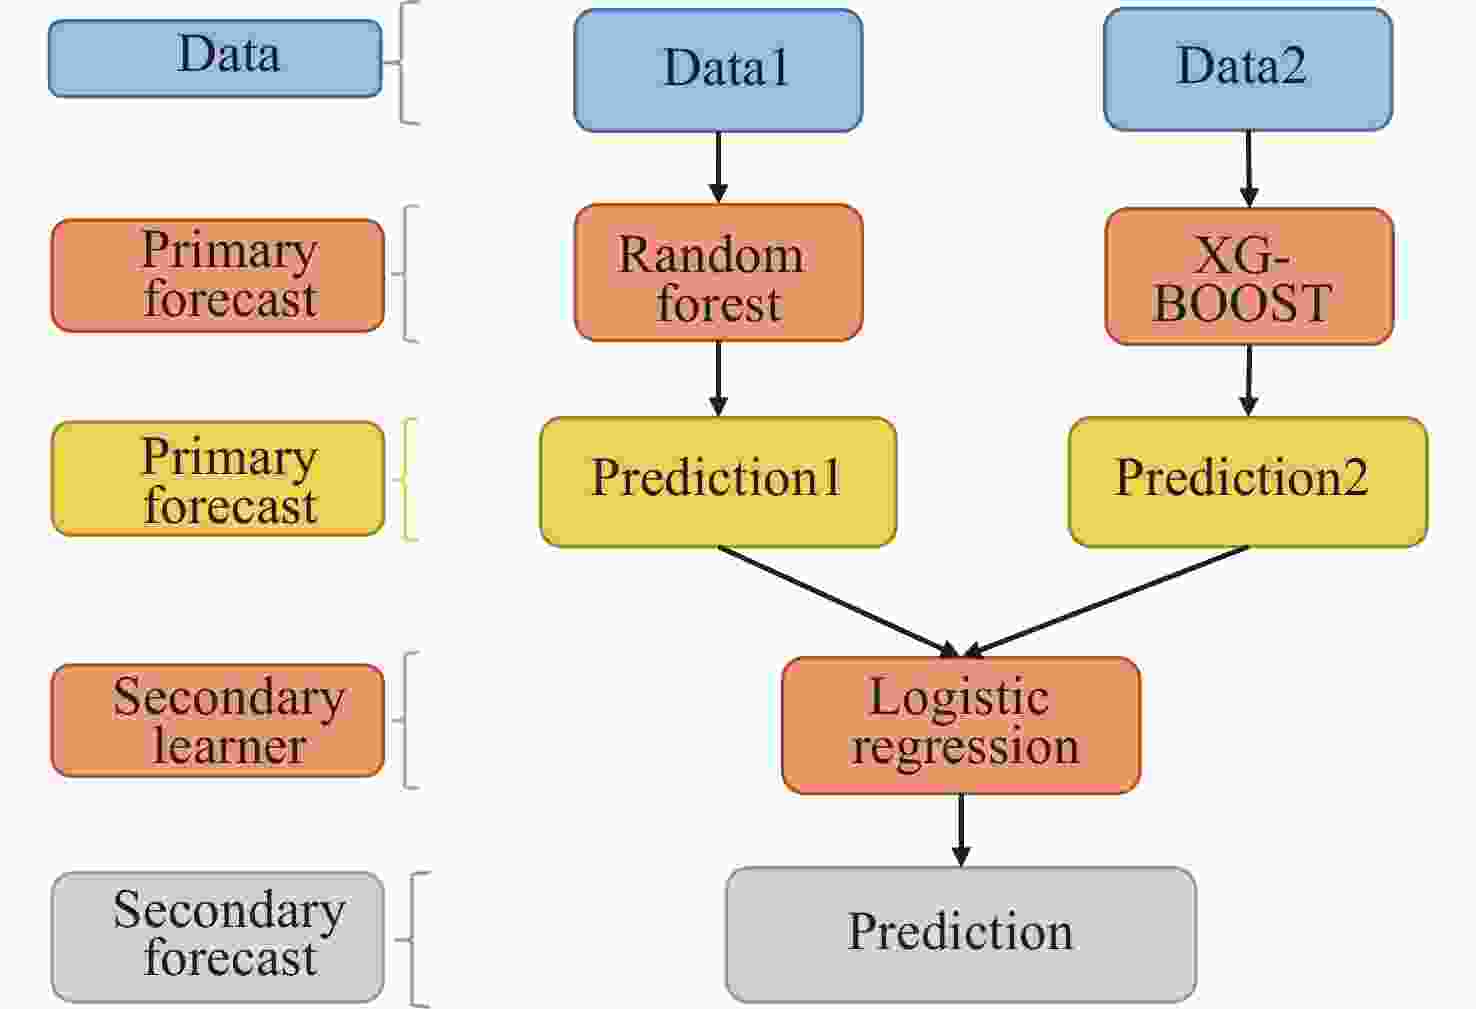
Figure 1. Principle of the Stacking model.
The formula of logistic regression:
$$ \pi \left(x\right)=\frac{1}{1+{e}^{{-w}^{T}x}} $$ (1) The term Stacking refers to modelling the stacking of raw data to fit a given model. It first learns raw data through a base learner, then outputs raw data through these base learners, and then stacks the output of these models into columns to form new data in the dimensions of (m, p). m represents the number of samples, p represents the number of base learners, and then the new sample data is given to the second layer model for fitting.
The results are presented in Table 2. They demonstrate the relationship between physical activity, dietary intake, and social interaction with health (BMI index, IADL index, and chronic diseases). The results were all implemented using the Random Forest model and placed in supplementary files (Table 1). For chronic diseases, physical activity (0.4876) and dietary intake (0.370) were highly correlated, but dietary intake was found to be less influential. The BMI index was also seriously affected by physical activity and dietary intake, while social interaction was not highly correlated. The results in the figure show that IADL was highly correlated with social interaction. In general, physical activity was more important in elderly people’s health than social interaction or dietary intake, whereby it had a significant effect on chronic diseases and BMI in this study.
Table 2. Importance and rank of the built-environment and social-demographic variables
Variables Variable Exercise (%) Food intake (%) Social interaction (%) Socio-demographic variables Age 11.21 9.57 34.10 Gender 4.05 6.13 3.26 Family size 5.08 5.93 6.36 Annual Household Income 8.65 9.14 9.61 School ages 10.02 6.68 6.28 Total 39.73 37.44 46.51 Built-environment variables Living location 11.95 6.51 8.09 Population density 9.01 10.02 8.82 Greenness rate 8.42 8.53 8.74 Standard of noise 9.02 12.68 7.14 Distance from the city centre 8.69 11.50 8.82 Flatness of land 7.60 9.14 6.65 Total 60.27 62.56 53.49 The socio-demographic variables occupied 39.73% of total physical activity, while the built-environment variables held 60.27%. The outcome testified to the finding that activity depends on the surrounding environment[9]. This robust evidence supports notions that the built environment directly affects the level of physical activity of the elderly. The living location (11.05%) and population density (9.01%) were the strongest factors that influence exercise activity. This may be because the areas with high population density tend to have high regional connectivity, a high population density and street connectivity[10]. Further, other selected environment variables such as greenness rate (8.42%), distance from the city centre (8.69%) and flatness of land (7.60%) also weighed more heavily than family size (5.08%) and being male (4.05%). This indicates that the characteristics of family size and most sociodemographic variables have little effect on physical activity. However, the impact of age and income on physical activity cannot be underestimated. Age was the second most important variable and family income was found to be at 8.65%.
As for food intake, the top five factors that had the greatest impact were noise standard area (12.68%), distance from the city centre (11.50%), population density (10.20%), age (9.57%), and flatness of land (9.14%). This also sheds light on the environmental impact on dietary intake in the older age group. The results revealed that the social interaction of the aged group is closely related to demographic variables and environmental variables, accounting for almost half of their importance. Among them, the most important environmental factors affecting the social interaction of the elderly were population density (8.82%), distance from the city centre (8.82%), and greening rate (8.74%). The model of the evaluation results is shown in Table 2. In this paper, six evaluation indexes were used to evaluate the accuracy of the model. The mean absolute error, mean squared error, root mean squared error, R-square, and kappa value of the model were found to be 0.021801, 0.001744, 0.083692, 0.986192, 0.994933, and 0.983952, respectively. This indicates the superior performance of the Stacking model in terms of improving accuracy.
Considering China’s rapidly ageing population, it is necessary explore the impact of the built environment on the activities and health of the elderly. Therefore, we evaluated the relationship between the built environment and health using innovative machine-learning techniques and statistical methods. The results of this study revealed that 1) physical activity had a more prominent impact on health in older adults than social interaction, and dietary intake, and had a positive effect on health; 2) the built environment, followed by socio-demographic characteristics, was the most important factor influencing the physical activity and dietary intake of older people; 3) distance from the city centre and the flatness of the land were the most important variables affecting the behaviors of elderly people in this study; and 4) age and education level were found to be non-negligible variables affecting the activities of the elderly group among the socio-demographic factors evaluated.
The results revealed the different effects of the built environment on the physical activity, eating habits and social interactions of the elderly, culminating in the effects of these three factors on the physical health of this group. The current study contributes information regarding the quality of life of humans and provides insight into the factors affecting global ageing. The Chinese government should take measures to enhance noise management as well as accessibility to individuals’ daily destinations. At the same time, the government should pay more attention to the physical activity behaviors of the elderly population as physical activity greatly benefits the health of this cohort. In addition, the social background attributes of the elderly population should not be ignored in policy formulation, and targeted policies should be customized for different groups. Future research should aim to determine the specific impact of the built environment on the elderly using geographic information systems (GIS) and more objective data for analysis.
doi: 10.3967/bes2023.125
Machine-learning-assisted Investigation into the Relationship between the Built Environment, Behavior, and Physical Health of the Elderly in China
-
-
Table 1. Model results of behaviors and physical health
Behaviours Chronic Diseases IADL BMI RF XGBoost Stacking RF XGBoost Stacking RF XGBoost Stacking Dietary intake 0.3495 0.3833 0.3700 0.2575 0.0117 0.0609 0.2575 0.2815 0.3433 Social interaction 0.0828 0.1826 0.1427 0.6337 0.9270 0.8683 0.6337 0.2436 0.1778 Physical activity 0.5677 0.4342 0.4876 0.1088 0.0612 0.0708 0.1088 0.4748 0.4789 Model evaluation index Mean Absolute Error 0.1538 0.2548 0.1149 0.2701 0.4057 0.1513 0.0914 0.1786 0.0785 Root Mean Squared Error 0.3922 0.3569 0.2658 0.3746 0.1832 0.1465 0.1529 0.1756 0.0847 Note. RF, Random forest; XGBoost, eXtreme gradient boosting; IADL, Instrumental activities of daily living; BMI, Body mass index.  下载: 导出CSV
S1. Descriptive statistics of all study variables (i.e., socio-demographic variables, built environment, physical condition, and behavior; after data cleaning)
Characteristics Description Mean/N Std. /Dev. Socio-demographic variables Age Age of the elderly 85.31 10.77 Sex Sex of the elderly Male 3,316 Female 3,876 Household size People in the house 2.66 5.73 Household income Total family income last year 33,547 31,959.01 School-age Years of study 2.52 4.68 Built-environment variables Flatness of land Flat area of land as a percentage of the total area 49.97 35.72 Population density Population density within the neighborhood (unit:1/km2) 634.72 474.953 Greenness rate Density of green area within the neighborhood (unit:1/km2) 720.27 1,721.72 Living location Living in a city or rural area City 3,222 Rural 3,980 Standard area of noise Standard area of environmental noise (km2) 59.19 69.41 Access to the city centre Distance from the home to the nearest city centre 170.57 126.72 Physical condition Chronic disease Disease information was self-rated and instrumentally measured in questionnaires 0.008 Have no chronic disease 655 Have chronic disease 6,537 BMI Body mass index 22.654 IDAL IDAL to assess the independent living skills of older adults 2.694 Fully care 5,549 A mild disability 864 Moderate disability 627 Severe disability 152 Intermediate variables Physical activity (a week) Have been physically active in the past week Have exercise regularly 1,841 Have not regularly exercise 5,051 Dietary Intake (a week) To investigate the daily dietary habits of the elderly group per week Normal (more than 400 g) 461 Unnormal 6,731 Social Interaction (a week) Whether to participate in social activities regularly per week Take part in organised social activities regularly 1,200 Otherwise 5,829 Sample size 7,100
下载: 导出CSV
Table 2. Importance and rank of the built-environment and social-demographic variables
Variables Variable Exercise (%) Food intake (%) Social interaction (%) Socio-demographic variables Age 11.21 9.57 34.10 Gender 4.05 6.13 3.26 Family size 5.08 5.93 6.36 Annual Household Income 8.65 9.14 9.61 School ages 10.02 6.68 6.28 Total 39.73 37.44 46.51 Built-environment variables Living location 11.95 6.51 8.09 Population density 9.01 10.02 8.82 Greenness rate 8.42 8.53 8.74 Standard of noise 9.02 12.68 7.14 Distance from the city centre 8.69 11.50 8.82 Flatness of land 7.60 9.14 6.65 Total 60.27 62.56 53.49
下载: 导出CSV
-
[1] Feng QS, Yeung WJJ, Wang ZL, et al. Age of retirement and human capital in an aging China, 2015–2050. Eur J Popul, 2019; 35, 29−62. doi: 10.1007/s10680-018-9467-3 [2] Yen IH, Michael YL, Perdue L. Neighborhood environment in studies of health of older adults: a systematic review. Am J Prev Med, 2009; 37, 455−63. doi: 10.1016/j.amepre.2009.06.022 [3] Kassavou A, French DP, Chamberlain K. How do environmental factors influence walking in groups? A walk-along study. J Health Psychol, 2015; 20, 1328−39. doi: 10.1177/1359105313511839 [4] Michael YL, Nagel CL, Gold R, et al. Does change in the neighborhood environment prevent obesity in older women?. Soc Sci Med, 2014; 102, 129−37. doi: 10.1016/j.socscimed.2013.11.047 [5] Garrett JK, White MP, Elliott LR, et al. Urban nature and physical activity: Investigating associations using self-reported and accelerometer data and the role of household income. Environ Res, 2020; 190, 109899. doi: 10.1016/j.envres.2020.109899 [6] Breiman L. Random forests. Mach Learn, 2001; 45, 5−32. doi: 10.1023/A:1010933404324 [7] Chen TQ, Guestrin C. XGBoost: A scalable tree boosting system. In: Proceedings of the 22nd ACM SIGKDD International Conference on Knowledge Discovery and Data Mining. ACM, 2016; 785−94. [8] Wolpert DH. Stacked generalization. Neural Netw, 1992; 5, 241−59. doi: 10.1016/S0893-6080(05)80023-1 [9] Ye JZ, He CZ, Liu J, et al. Left-behind elderly: shouldering a disproportionate share of production and reproduction in supporting China’s industrial development. J Peasant Stud, 2017; 44, 971−99. doi: 10.1080/03066150.2016.1186651 [10] Guerra E, Dong XX, Kondo M. Do denser neighborhoods have safer streets? population density and traffic safety in the Philadelphia Region. J Plan Educ Res, 2019; 0739456X19845043. -
 23102+Supplementary Materials.pdf

-

 点击查看大图
图(1) / 表ll (3)
计量
- 文章访问数: 181
- HTML全文浏览量: 82
- PDF下载量: 12
- 被引次数: 0

 Quick Links