

 下载:
下载:


-
Hand, foot, and mouth disease (HFMD) is an acute infection caused by enteroviruses that is commonly seen in children[1]. High infectivity, large number of asymptomatic infections, complex transmission routes, and rapid spread make it difficult to control HFMD. Since 2008, China has reported > 23 million HFMD cases, including > 0.15 million severe cases[2]. HFMD tops the list of notifiable infectious diseases in terms of case number and incidence rate, leading to a huge disease burden[3]. Timely and accurate assessment of HFMD epidemics is essential for a holistic understanding of the outbreaks and for effective prevention and control strategies. Currently, there are no quantitative indicators to determine the duration and intensity of HFMD epidemics in Beijing.
In 2013, Vega et al.[4] proposed the moving epidemic method (MEM) to establish influenza epidemic thresholds. This method was later adopted for assessing the intensity of influenza epidemics[5]. The European Centre for Disease Prevention and Control has achieved favorable results by using MEM for influenza surveillance and early warning in European countries[6]. Because the sensitivity, specificity, Youden’s index, and other quantitative indicators of the MEM model can be calculated, the fitting effect of the model can be directly evaluated. At the same time, the model has the advantages of simple operation, fast application, and ease of understanding. In recent years, it has also been used in China, and shows good results in terms of sensitivity and specificity[7]. In this study, MEM was used to model the HFMD surveillance data from Beijing as a baseline. The study aimed to explore the feasibility of using MEM for early warning of HFMD epidemics in Beijing, assess HFMD epidemic intensity in Beijing in 2020, and evaluate the reliability of the surveillance data and effectiveness of the MEM model. The results of this study may provide a reference for epidemic threshold development and intensity assessment for HFMD in Beijing.
The number of HFMD cases in Beijing was obtained from the National Notifiable Infectious Disease Reporting Information System in China between 2011 and 2020. Population data were obtained from the National Bureau of Statistics of China (http://www.stats.gov.cn/). The reported incidence of HFMD (per 100,000 individuals) was calculated as the reported number of HFMD cases / number of permanent residents in a given year × 100,000. The MEM model is typically used for surveillance during the epidemic season characterized by a unimodal pattern. However, HFMD incidence in Beijing has shown a primary peak between April and July in the previous years, with occasional smaller sub-peaks between September and November[8]. As a result, the MEM model cannot be directly applied to HFMD in Beijing. Therefore, we focused on the primary HFMD peak during weeks 5–36 for modeling and early warning.
MEM uses historical HFMD surveillance data for modelling and computes graded intensity thresholds, allowing assessment of the HFMD epidemic status and intensity during the target surveillance year[4,5]. The epidemic thresholds in different urban and suburban areas of Beijing were explored through modeling analysis. The urban areas included Dongcheng, Xicheng, Chaoyang, Haidian, Fengtai, and Shijingshan districts, while the suburban areas included Daxing, Tongzhou, Shunyi, Changping, Mentougou, Fangshan, Huairou, Pinggu, Miyun, and Yanqing districts.
The pre-epidemic, epidemic, and post-epidemic periods were classified based on the maximum accumulated rates percentage (MAP) function of the HFMD surveillance indicator. The n largest surveillance indicator values for all pre-pandemic periods were included in the analysis (n = 30/N, where N is the number of surveillance years included in the analysis, ranging between 5 to 10[5]). One-sided 95% confidence intervals were calculated for the arithmetic means of these values, and the upper limit of the confidence interval was taken as the epidemic start threshold. Similarly, the epidemic end threshold was calculated using the data from post-pandemic periods. Meanwhile, the n largest surveillance indicator values for all epidemic periods were analyzed (n = 30/N), and one-sided 50%, 90%, and 95% confidence intervals were calculated for their geometric means. The upper limits of these confidence intervals were used as the medium, high, and very high epidemic intensity thresholds, respectively. The MAP curve reflects the changes in the surveillance indicator over r consecutive weeks. The MAP curve rises with the increasing r value, although the rate gradually slows down.
$$ {p}_{j}^{r} =\dfrac{{t}_{j}^{r}}{{t}_{j}^{S}} $$ (1) $$ {t}_{j}^{r}=\begin{array}{c}max\\ k=1,\dots ,S-r+1\end{array}\left\{\sum _{i=k}^{k+r-1}{t}_{i,j}\right\} $$ (2) $$ {t}_{j}^{S}=\sum _{i=1}^{S}{t}_{i,j} $$ (3) where $ {p}_{j}^{r} $ is the relative maximum percentage of the accumulated sum of the surveillance indicator over $ r $ consecutive weeks of the $ j $th surveillance year in the total accumulated sum, $ {t}_{j}^{r} $ is the relative maximum accumulated sum of the surveillance indicator over $ r $ consecutive weeks of the $ j $th surveillance year, $ {t}_{j}^{S} $ is the total accumulated sum of the surveillance indicator in the jth surveillance year, $ {t}_{i,j} $ is the surveillance indicator in the $ i $th week of the $ j $th surveillance year, $ S $ is the total number of weeks in the $ j $th surveillance year, $ k $ is the first week of $ r $ consecutive weeks, and $ k+r-1 $ is the last week.
The MEM model uses $ \delta $ as an empirical parameter to determine the length of the epidemic period. A smoothing process is first implemented on the function $ {p}_{j}^{r} $ to obtain the function $ {\check{p}}_{j}^{r} $, which reduces the influence of weekly surveillance indicator instability. Then, the increments $ \Delta {\check{p}}_{j}^{r} $ over $ r+1 $ and $ r $ consecutive weeks are compared, and when $ \Delta {\check{p}}_{j}^{r} $ becomes < δ for the first time, the corresponding r value is taken as the length of the epidemic period. Based on the range of δ values recommended by Vega et al.[4], the trial and error method was used to select δ values between 1.0% and 5.0% at 0.1% intervals in this study. The δ value was chosen as an optimal parameter when Youden’s index reached its maximum value. For parameters with the same Youden’s index, the parameter with higher sensitivity was given preference. If both parameters had the same sensitivity, the one with the lower δ value was chosen.
HFMD epidemic intensity during the target surveillance year was assessed using the epidemic start and end thresholds, as well as medium, high, and very high epidemic intensity thresholds. Baseline epidemic intensity was defined as weekly surveillance indicator values ≤ epidemic start/end thresholds. Low epidemic intensity was defined as epidemic start threshold < weekly surveillance indicator values ≤ medium epidemic intensity threshold. Medium epidemic intensity was defined as medium epidemic intensity threshold < weekly surveillance indicator values ≤ high epidemic intensity threshold. High epidemic intensity was defined as high epidemic intensity threshold < weekly surveillance indicator values ≤ very high epidemic intensity threshold. Very high epidemic intensity was defined as very high epidemic intensity threshold < weekly surveillance indicator values.
Based on the epidemic period defined by the MEM model, weekly surveillance indicator values obtained from the actual surveillance were compared with the epidemic thresholds obtained from the model. The sensitivity, specificity, Youden’s index, and positive and negative predictive values were calculated to evaluate and validate the model. Sensitivity was defined as the number of weeks above the epidemic threshold divided by the total number of epidemic weeks defined by the MEM algorithm. Specificity was defined as the number of MEM non-epidemic weeks below the epidemic threshold divided by the number of MEM non-epidemic weeks. Positive predictive value was obtained by dividing the number of MEM epidemic weeks above the threshold by the number of weeks above the threshold, while negative predictive value was calculated as the number of MEM non-epidemic weeks below the threshold divided by the number of weeks below the threshold. The Youden’s index (sensitivity + specificity −1) was used to measure the performance of the model.
Data were analyzed using the Excel 2013 software (Microsoft Corp., Redmond, WA, USA). The ‘mem’ package in R 4.2.2 software (https://www.R-project.org/; The R foundation, Vienna, Austria) was used for modeling analysis.
The number of historical seasons included and the choice of δ value affect the determination of epidemic periods. In a study of influenza, it was recommended to include 5–10 epidemic seasons and to exclude outlier years to avoid bias caused by model data instability[5]. China included HFMD among the notifiable infectious diseases in May 2008. After excluding the years with unstable data, the HFMD incidence data from Beijing between 2011 and 2019 were used for fitting. The optimal MEM model achieved a sensitivity of 89.60% and a Youden’s index of 75.63% with the parameter value of δ set as 2.0. However, the optimal δ value varied slightly when Beijing was further subdivided into urban and suburban areas. In the urban areas of Beijing, the optimal model yielded a sensitivity of 90.63% and Youden’s index of 73.44% with the parameter value of δ set as 1.6. In the suburban areas of Beijing, the optimal model had a sensitivity of 88.90% and a Youden’s index of 73.56% with the parameter value of δ set as 1.9 (Supplementary Table S1, available in www.besjournal.com).
Table S1. MEM model screening results of parameter δ value, Beijing, China
δ value Total Urban Suburban Sensitivity
(%)Specificity
(%)Youden’s index
(%)Sensitivity
(%)Specificity
(%)Youden’s index
(%)Sensitivity
(%)Specificity
(%)Youden’s index
(%)1.0 98.15 66.73 64.88 97.05 69.56 66.61 98.41 67.16 65.56 1.1 97.63 69.52 67.15 96.94 72.06 69.00 97.98 71.24 69.22 1.2 95.43 72.14 67.57 96.25 73.41 69.66 96.69 73.98 70.66 1.3 94.97 74.97 69.94 93.98 74.68 68.65 94.35 77.11 71.46 1.4 93.21 77.33 70.54 92.69 78.10 70.79 94.23 77.66 71.89 1.5 92.77 77.60 70.36 92.69 78.10 70.79 94.23 77.66 71.89 1.6 91.00 80.60 71.60 90.63 82.81 73.44 92.94 79.76 72.70 1.7 90.66 82.24 72.89 90.63 82.81 73.44 91.71 81.27 72.98 1.8 90.66 82.24 72.89 87.96 84.37 72.33 91.07 82.02 73.09 1.9 90.39 84.59 74.98 87.96 84.37 72.33 88.90 84.66 73.56 2.0 89.60 86.03 75.63 87.21 84.37 71.59 88.90 84.66 73.56 2.1 86.00 87.96 73.96 82.39 86.67 69.07 84.63 86.84 71.47 2.2 81.97 88.34 70.31 82.39 86.67 69.07 83.43 88.39 71.82 2.3 80.21 88.76 68.97 80.52 87.64 68.16 80.30 89.61 69.91 2.4 77.80 89.92 67.73 74.14 91.17 65.31 77.89 90.78 68.67 2.5 77.80 89.92 67.73 72.88 91.38 64.26 76.47 91.51 67.98 2.6 73.66 90.88 64.54 71.52 92.14 63.66 72.36 92.56 64.93 2.7 68.57 92.33 60.90 70.06 92.82 62.88 70.10 93.23 63.33 2.8 68.57 92.33 60.90 66.73 94.47 61.20 70.10 93.23 63.33 2.9 65.19 94.59 59.78 67.21 94.23 61.44 70.10 93.23 63.33 3.0 63.59 95.16 58.75 62.60 94.77 57.37 65.53 93.89 59.42 3.1 64.20 95.03 59.23 62.60 94.77 57.37 63.64 94.87 58.51 3.2 64.20 95.03 59.23 59.79 95.56 55.35 62.72 95.38 58.10 3.3 61.85 95.60 57.45 60.24 95.31 55.55 62.72 95.38 58.10 3.4 59.85 95.82 55.67 56.84 96.24 53.08 62.16 96.18 58.34 3.5 58.67 96.10 54.78 56.48 96.58 53.05 54.86 97.12 51.98 3.6 58.67 96.10 54.78 54.82 97.08 51.90 55.57 97.08 52.65 3.7 57.61 97.12 54.73 54.82 97.08 51.90 52.84 97.99 50.83 3.8 50.12 98.44 48.56 52.51 97.67 50.18 52.84 97.99 50.83 3.9 50.54 98.16 48.70 52.51 97.67 50.18 50.95 98.33 49.28 4.0 50.54 98.16 48.70 46.36 98.16 44.52 50.95 98.33 49.28 4.1 50.12 98.44 48.56 42.00 98.91 40.90 48.21 98.61 46.82 4.2 44.85 98.44 43.29 41.36 99.00 40.36 45.65 99.03 44.67 4.3 44.10 98.44 42.54 41.36 99.00 40.36 47.84 98.93 46.77 4.4 41.20 98.54 39.73 41.36 99.00 40.36 44.92 99.06 43.97 4.5 39.32 98.87 38.19 39.87 99.00 38.87 43.38 99.06 42.44 4.6 39.32 98.87 38.19 38.38 99.00 37.38 43.38 99.06 42.44 4.7 39.32 98.87 38.19 37.94 99.27 37.21 41.85 99.06 40.90 4.8 38.72 98.99 37.71 37.94 99.27 37.21 41.85 99.06 40.90 4.9 38.20 99.20 37.40 37.94 99.27 37.21 39.54 99.06 38.60 5.0 34.75 99.47 34.22 36.45 99.27 35.72 33.57 99.20 32.77 Note. MEM, moving epidemic method. Based on historical data, the MEM model performance was cross-validated to determine its stability. The sensitivity, specificity, positive predictive value, negative predictive value, and Youden’s index for model fitting were 89.60%, 86.03%, 84.42%, 90.73%, and 75.63%, respectively. Its reliability was superior to that of the MEM model for HFMD used in the southern regions of China, including Shanghai, Chongqing, and Zhejiang[7].
The sensitivity was as high as 100.00% during 2012–2014 and 2018, and was > 95.00% during 2011 and 2015–2016. The specificity, positive predictive value, and negative predictive value ranged between 68.85% and 100.00% during 2011–2019. The Youden’s index was > 80.00% during 2011–2012, 2015–2016, and 2018, and reached 71.28% in 2013. Due to the Beijing municipality initiating vaccination for children aged between 0.5 and 5 years with the EV-A71 vaccine in August 2016, and considering the influence of meteorological factors such as temperature and humidity, the incidence of HFMD was low in odd years. As a result, there was a downward trend in the incidence of HFMD in 2017 and 2019[8]. The sensitivity and Youden’s index were relatively poor in 2017 (both 53.00%) and 2019 (both 61.56%). This suggests that the data from these two years may be considered outliers compared to the other years, and should be considered with caution for developing the epidemic thresholds. However, after excluding and adjusting the data, the fitting performance for the historical years did not show any significant changes. Therefore, the optimal model was still constructed using data from 2011 to 2019 for the assessment of HFMD epidemic intensity (Table 1).
Table 1. MEM model performance evaluation by cross-validation of weekly HFMD incidence in Beijing, China (2011–2019)
Year Sensitivity (%) Specificity (%) Positive predictive value (%) Negative predictive value (%) Youden’s index (%) 2011 99.11 86.61 88.10 98.98 85.72 2012 100.00 80.15 78.15 100.00 80.15 2013 100.00 71.28 72.43 100.00 71.28 2014 100.00 68.85 72.86 100.00 68.85 2015 99.05 87.39 87.39 99.05 86.44 2016 95.41 93.04 92.86 95.54 88.46 2017 53.00 100.00 100.00 70.44 53.00 2018 100.00 88.89 87.50 100.00 88.89 2019 61.56 100.00 100.00 75.57 61.56 Total 89.60 86.03 84.42 90.73 75.63 Note. MEM, moving epidemic method; HFMD, hand, foot, and mouth disease. The modeling results for urban areas showed that the sensitivity, specificity, positive predictive value, negative predictive value, and Youden’s index for model fitting were 90.63%, 82.81%, 82.12%, 91.03%, and 73.44%, respectively. For the suburban data, the sensitivity, specificity, positive predictive value, negative predictive value, and Youden’s index for model fitting were 88.90%, 84.66%, 82.72%, 90.03%, and 73.56%, respectively. Further analysis revealed that the model fitting performance was also satisfactory in the urban and suburban areas of Beijing. This demonstrates that the proposed method can identify the intensity of HFMD epidemics in a timely and accurate manner, and can be used for the surveillance and early warning of HFMD in Beijing.
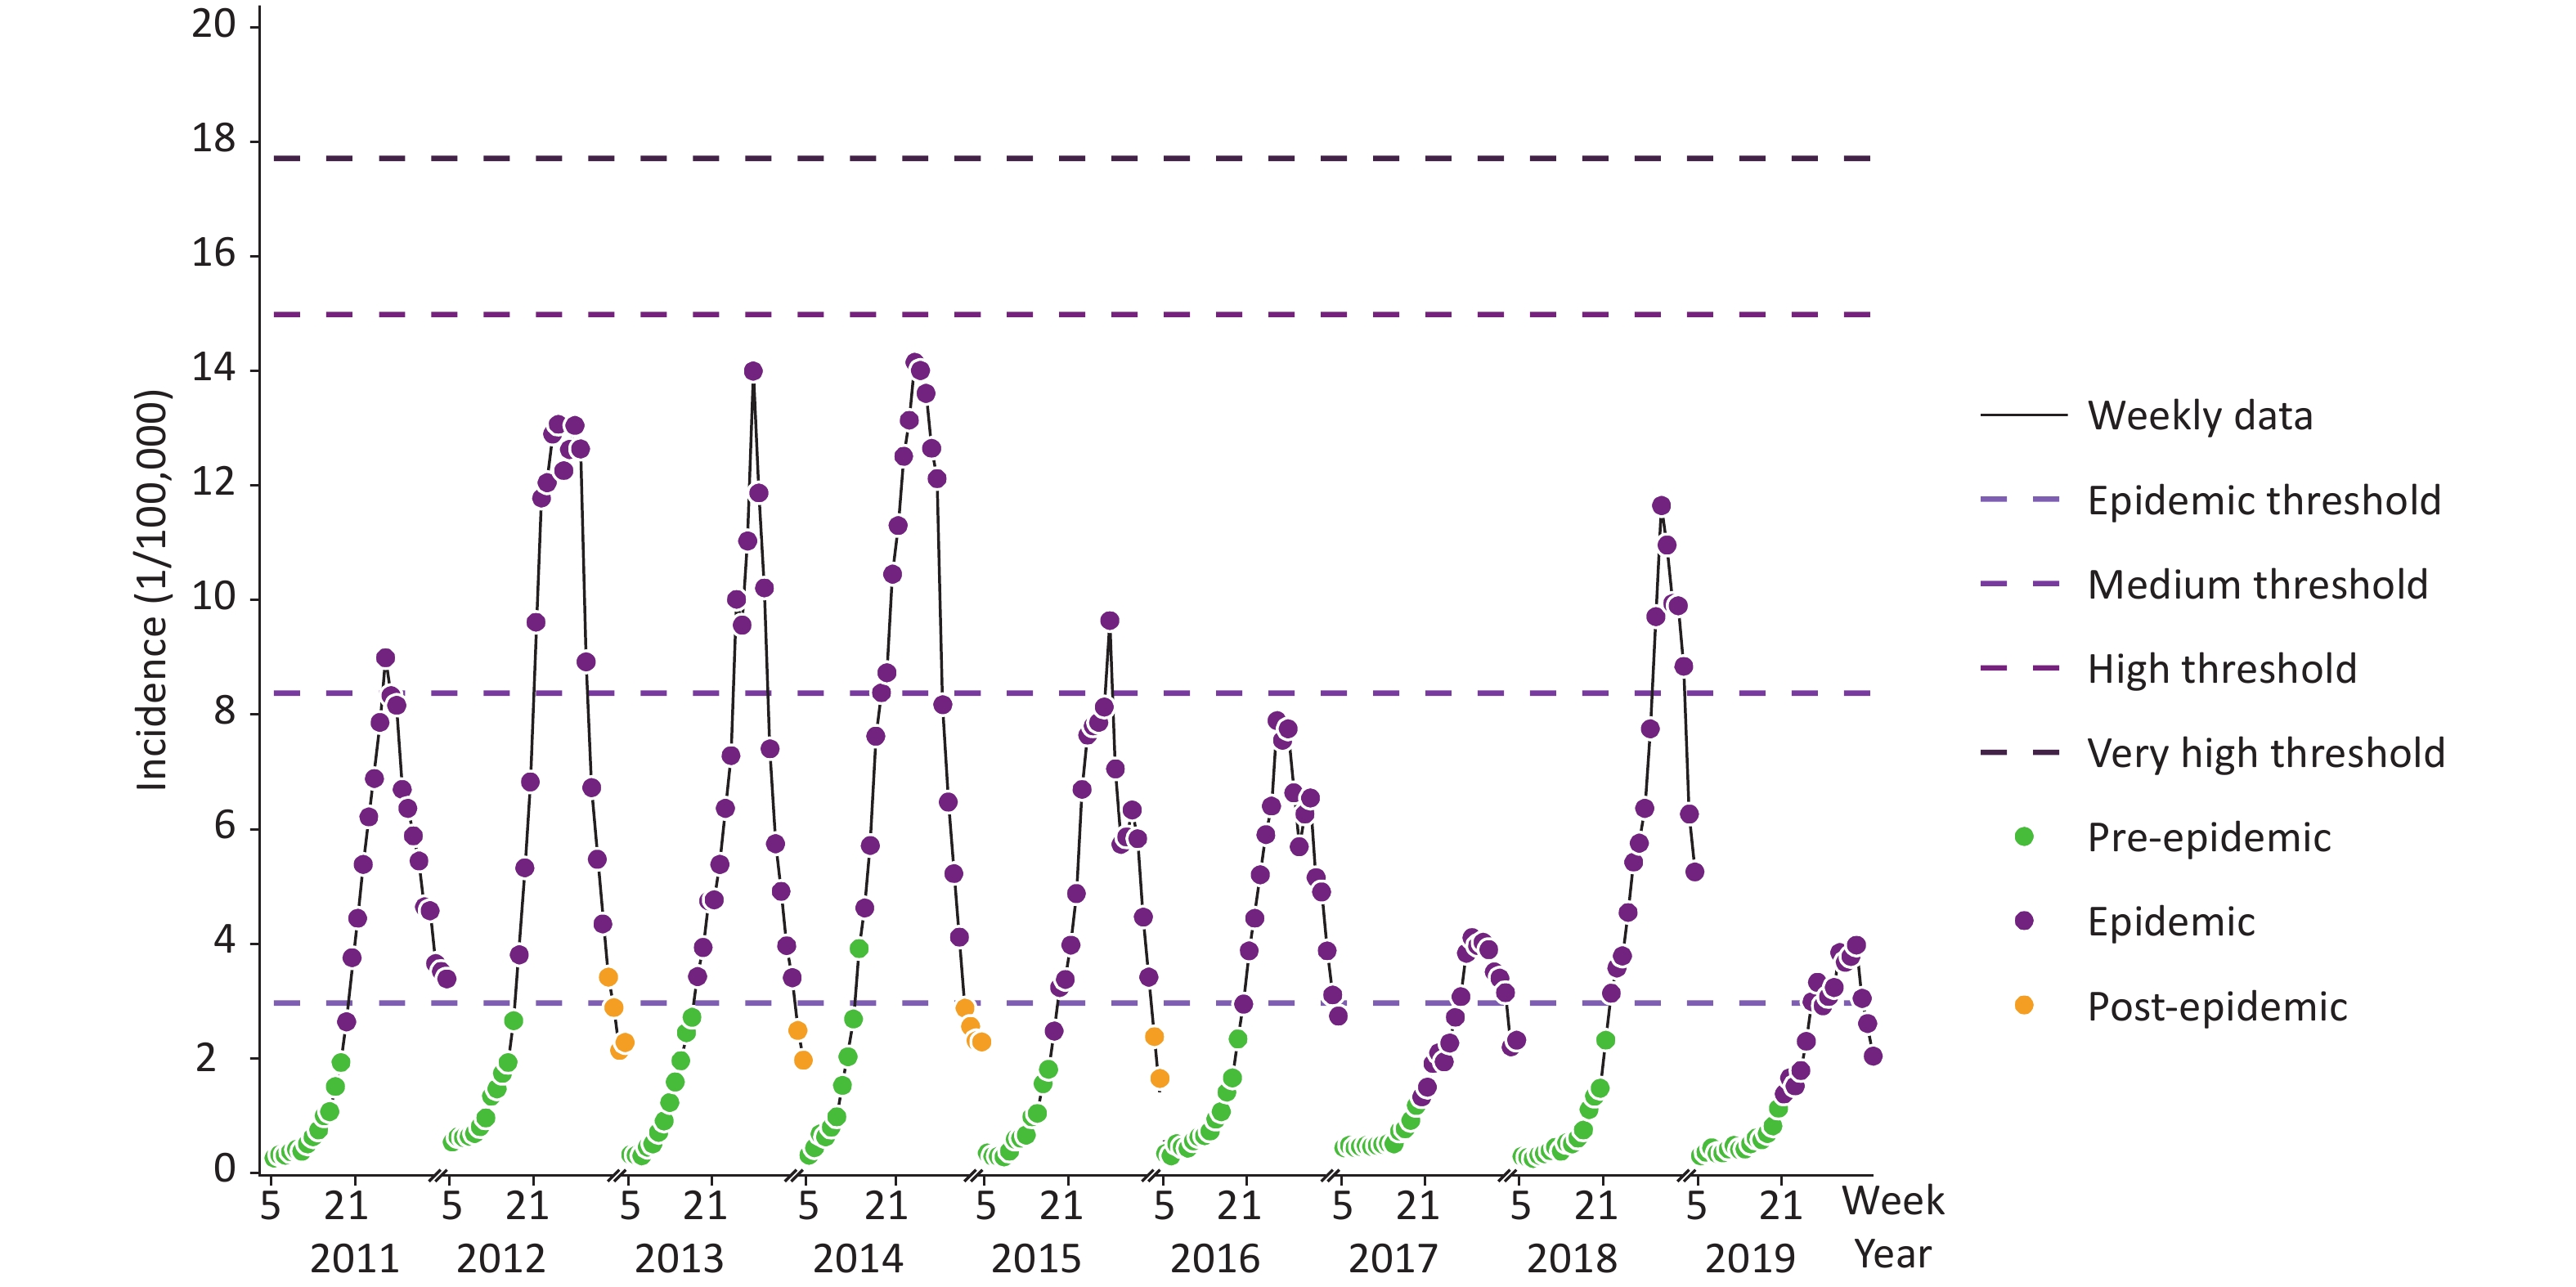
The HFMD epidemic start threshold, estimated using the MEM model, was 2.75/100,000, while the epidemic end threshold was 3.09/100,000, in Beijing during weeks 5–36 of 2020. The medium, high, and very high epidemic intensity thresholds were 8.16/100,000, 15.00/100,000, and 17.82/100,000, respectively (Figure 1). When the weekly reported incidence of HFMD exceeded a certain intensity threshold, the corresponding early warning signal was generated. Epidemic intensity assessment showed that the weekly reported incidence was < 2.75/100,000 in Beijing during this period. HFMD activity never exceeded the epidemic threshold, and no epidemic periods emerged (Figure 2). This was consistent with the findings of Zheng et al.[9], who reported that HFMD activity decreased significantly on a national scale during the COVID-19 pandemic of 2020. This also indicates that HFMD transmission can be effectively interrupted through non-pharmacological interventions, such as limiting population mobility, hand hygiene, wearing masks, and social distancing[10]. Cities with dense and mobile populations may control HFMD transmission by enhancing the non-pharmacological interventions during future HFMD epidemics.
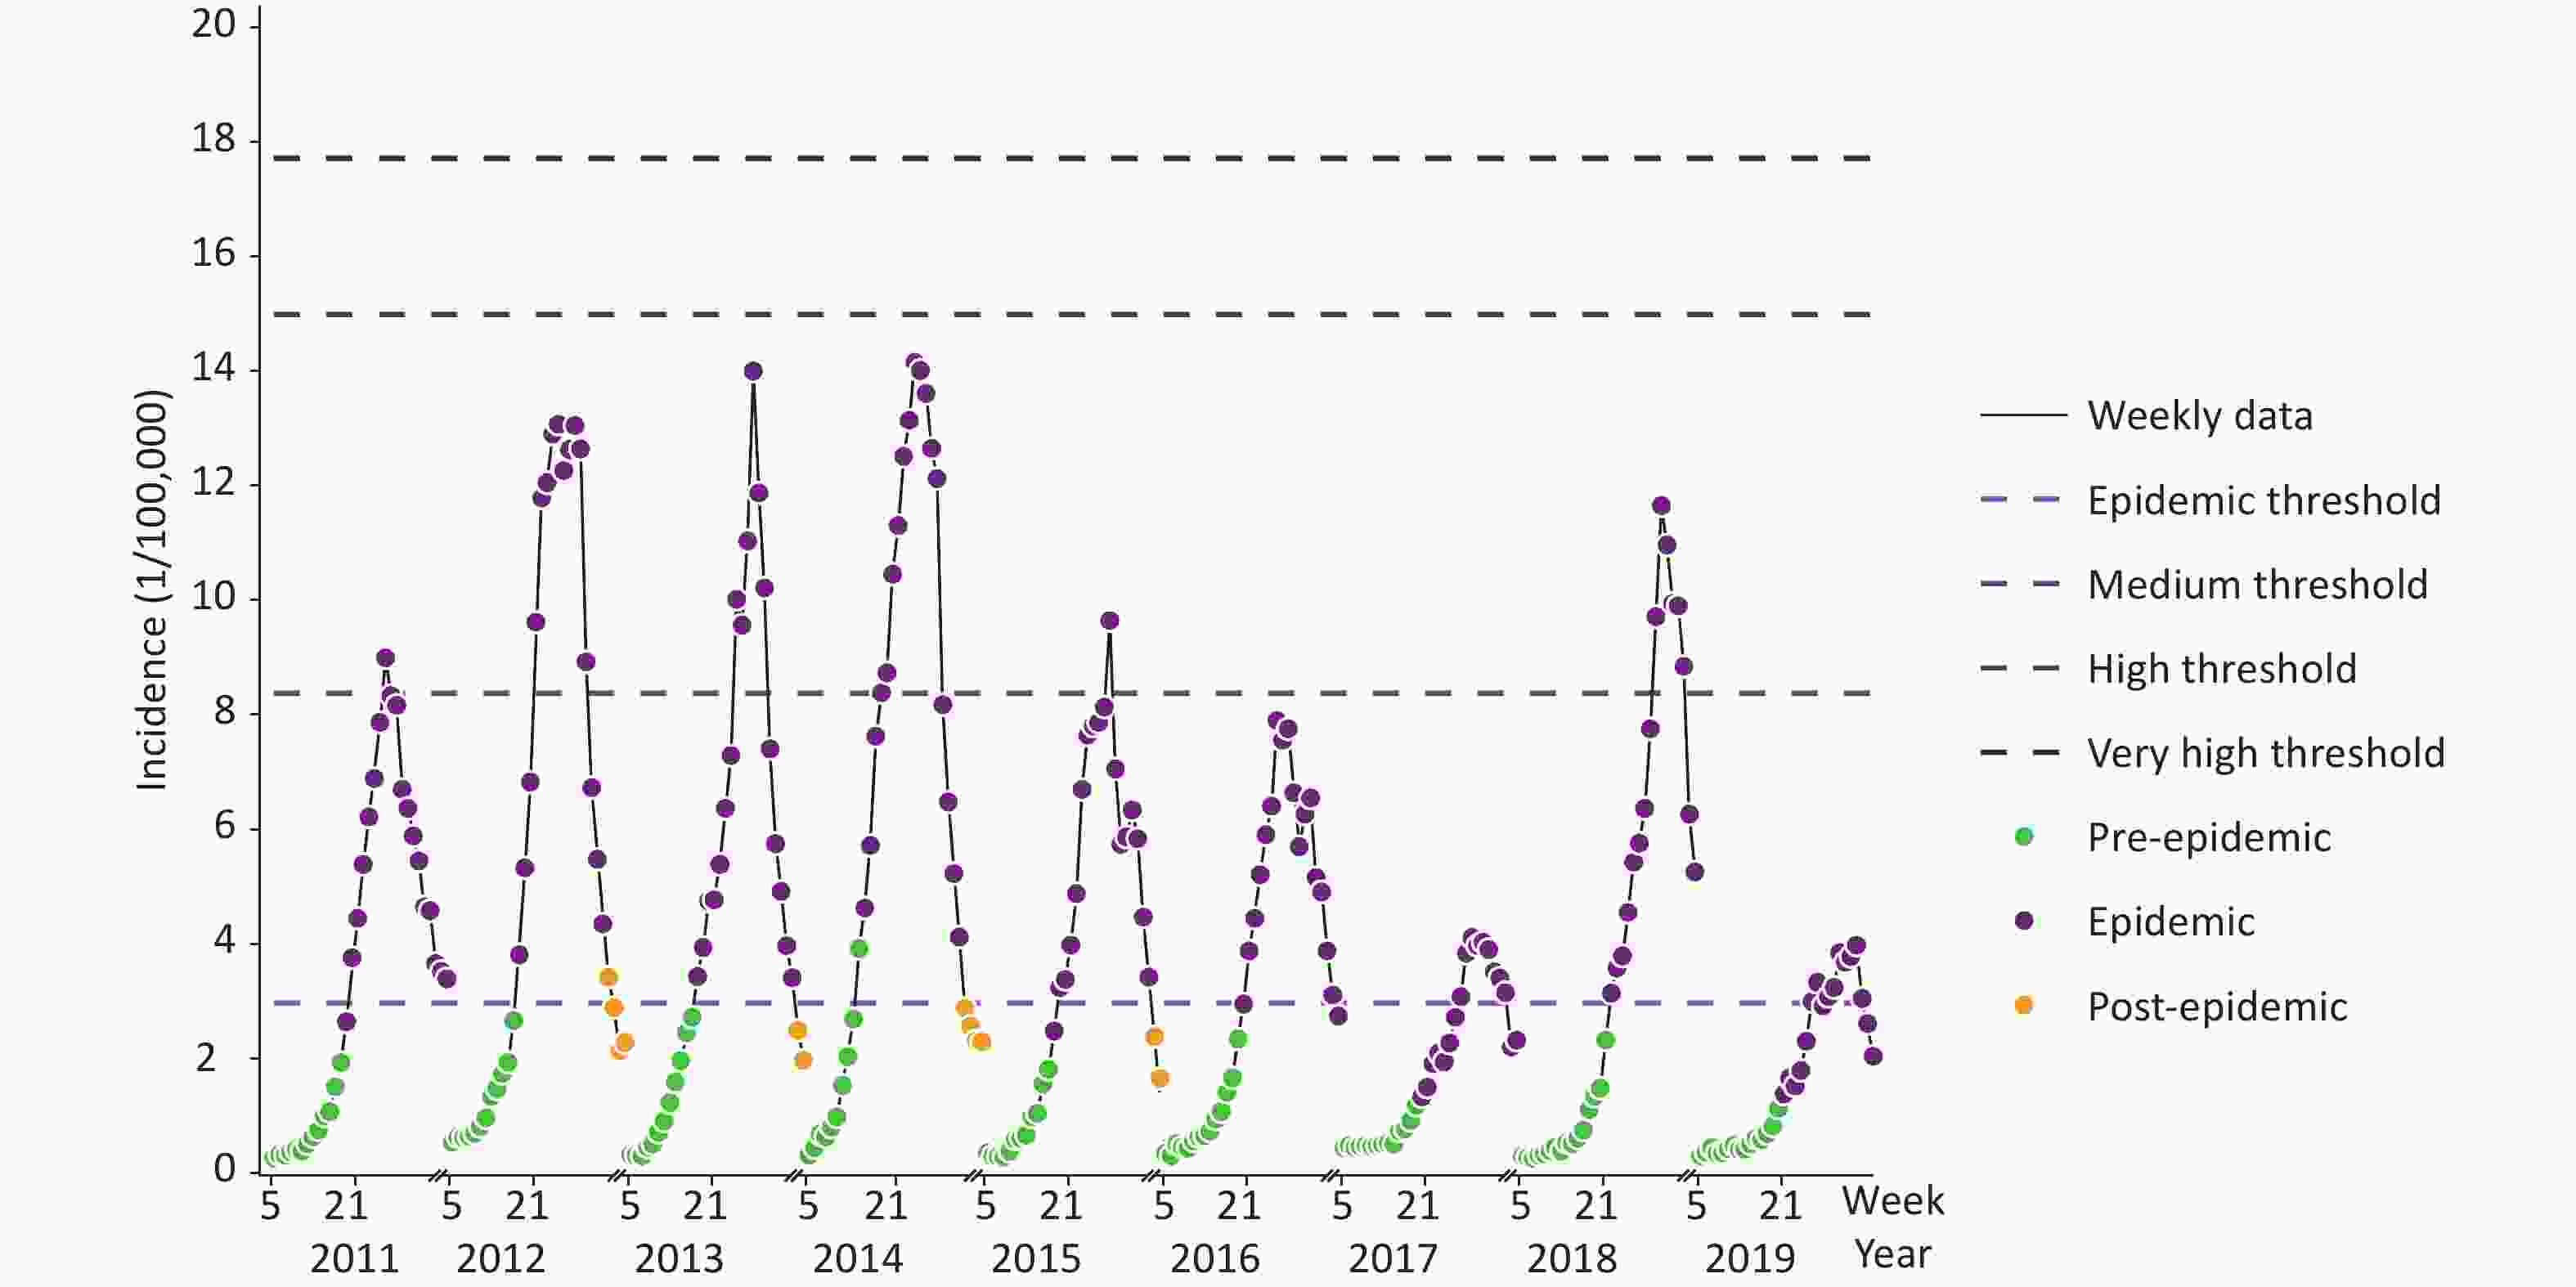
Figure 1. Determination of the start and end weeks of HFMD epidemic, and estimation of the incidence thresholds for early warning during the 2020 epidemic season.
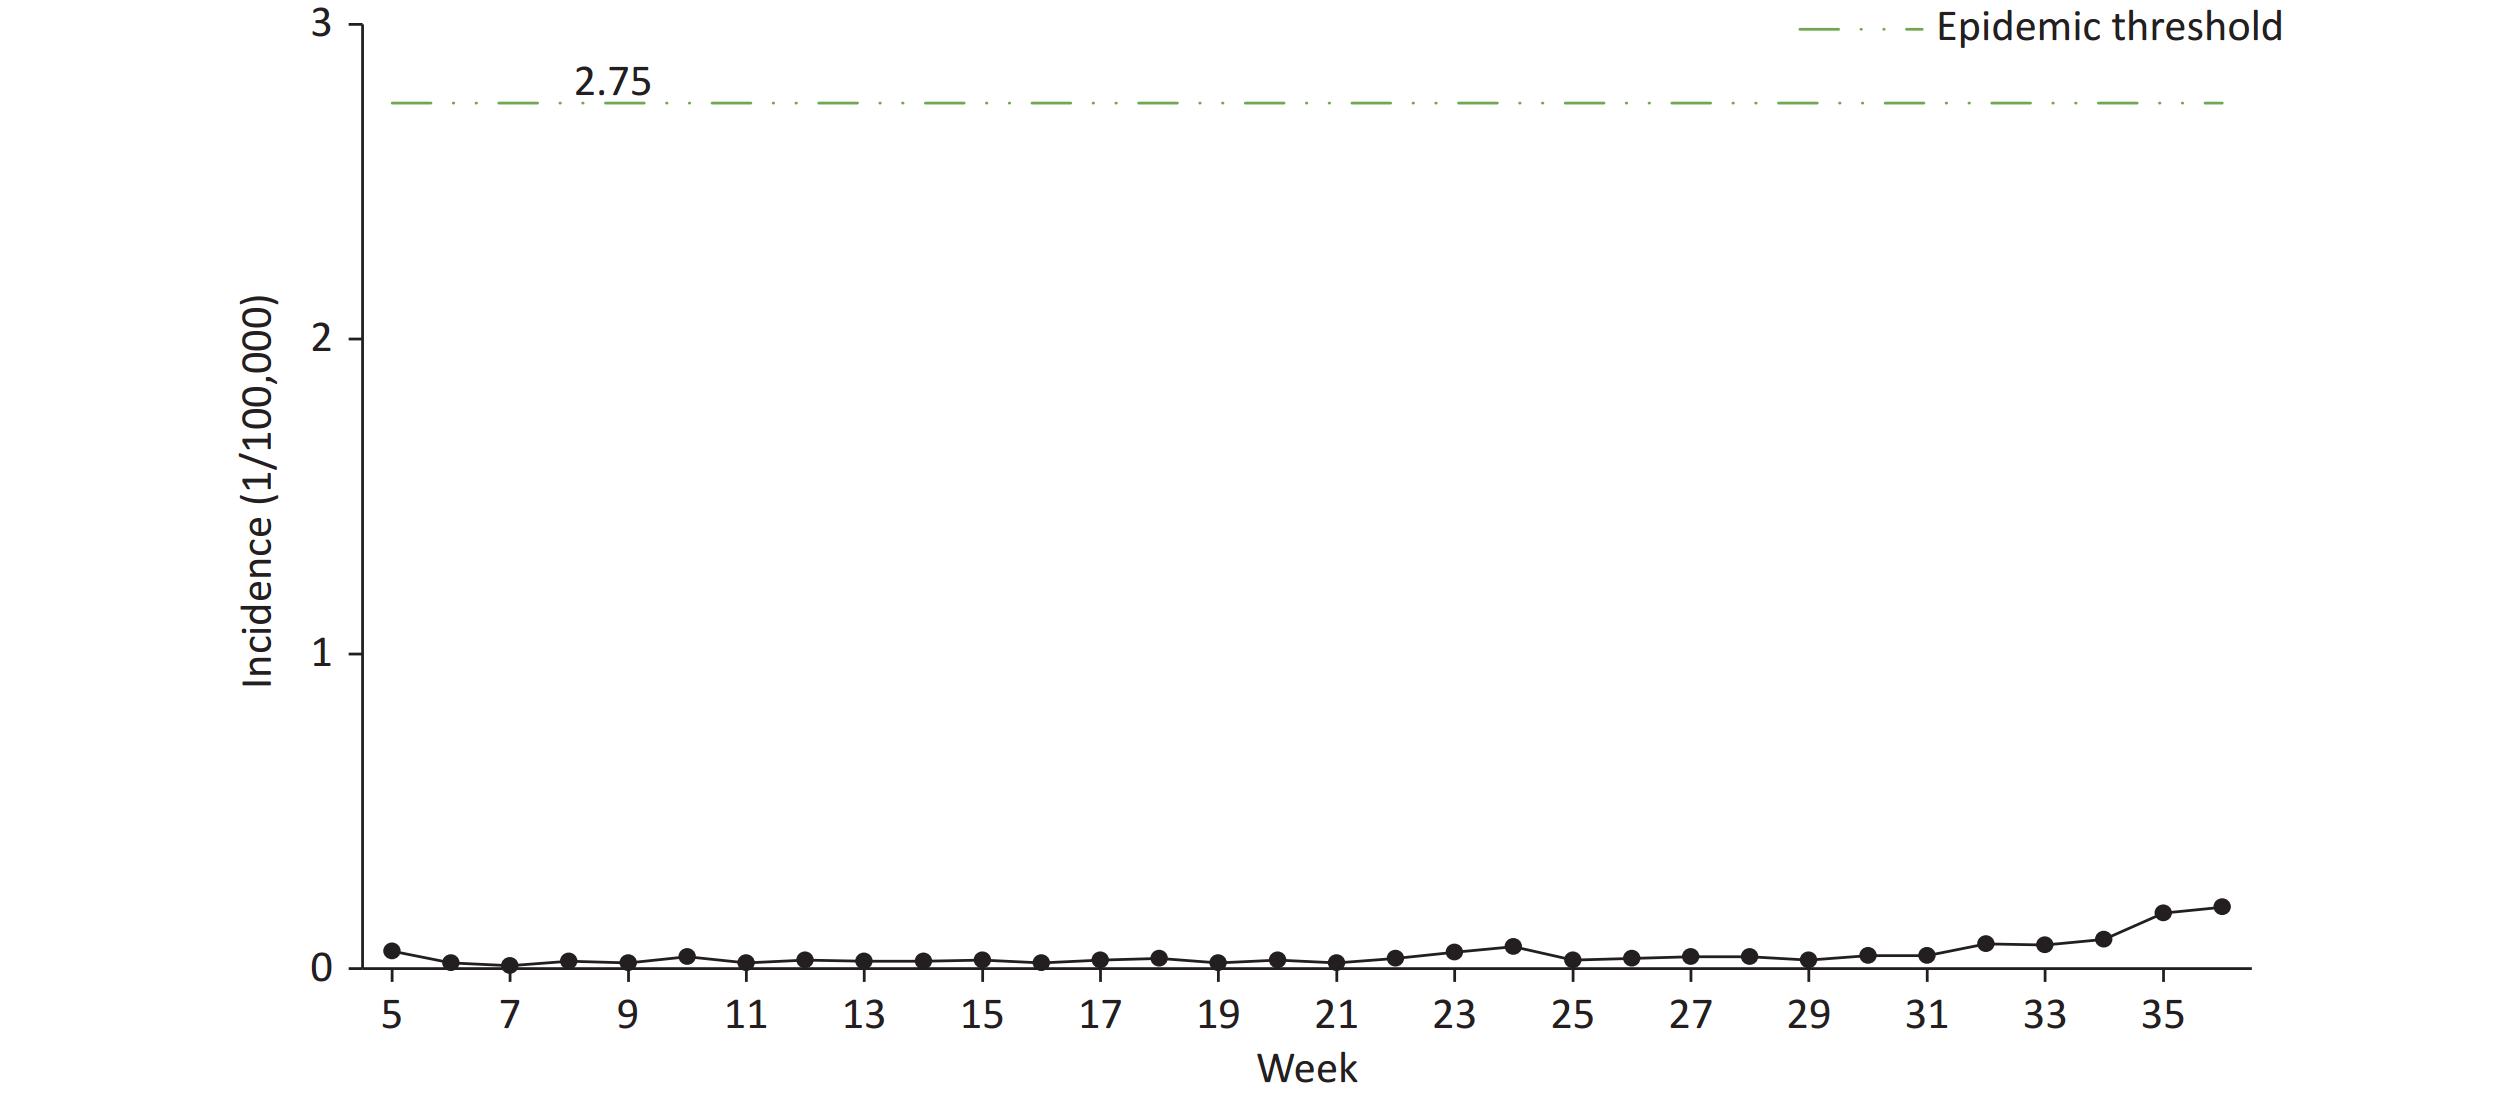
Figure 2. Weekly HFMD incidence and MEM model epidemic intensity assessment during the 2020 epidemic season in Beijing, China.
HFMD epidemics varied greatly in different regions, which is related to the vaccine inoculation rate, meteorological factors, socioeconomic status, and so on, and varied greatly across different years due to the virus variation, so this disease is difficult to predict. In the future, it may be necessary to develop intelligent early warning multi-point trigger mechanisms, and to improve the multi-channel surveillance and early warning mechanisms.
In summary, the MEM model had a high sensitivity, specificity, and Youden’s index, and provided reliable results. Therefore, this method may be used for early warning of HFMD epidemics in Beijing. The year 2020 was a non-epidemic period, possibly because of the influence of the COVID-19 pandemic. This suggests that non-pharmacological interventions may be effective in the prevention and control of HFMD epidemics.
doi: 10.3967/bes2023.151
Moving Epidemic Method for Surveillance and Early Warning of Hand, Foot, and Mouth Disease in Beijing, China
-
-
Figure 1. Determination of the start and end weeks of HFMD epidemic, and estimation of the incidence thresholds for early warning during the 2020 epidemic season.
Based on the data of the incidence of hand, foot, mouth disease in the 5–36 week epidemic season from 2011 to 2019 in Beijing, the MEM model was used to draw Figure 1. Gray line represents the weekly surveillance data of HFMD, green spots, purple spots and yellow spots represent the pre-epidemic, epidemic, and post-epidemic periods, respectively. Purple line from light to deep are the threshold of epidemic, medium epidemic, high epidemic and very high epidemic. MEM, moving epidemic method.
Figure 2. Weekly HFMD incidence and MEM model epidemic intensity assessment during the 2020 epidemic season in Beijing, China.
The green line represents the epidemic start threshold (2.75/100,000) by the MEM model. The epidemic curve represents the incidence of HFMD in the 5–36 week of 2020. When the weekly reported incidence of HFMD exceeded 2.75/100,000, an early warning signal for the epidemic was generated. However, HFMD incidence did not exceeded the epidemic threshold in 2020. MEM, moving epidemic method; HFMD, hand, foot, and mouth disease.
S1. MEM model screening results of parameter δ value, Beijing, China
δ value Total Urban Suburban Sensitivity
(%)Specificity
(%)Youden’s index
(%)Sensitivity
(%)Specificity
(%)Youden’s index
(%)Sensitivity
(%)Specificity
(%)Youden’s index
(%)1.0 98.15 66.73 64.88 97.05 69.56 66.61 98.41 67.16 65.56 1.1 97.63 69.52 67.15 96.94 72.06 69.00 97.98 71.24 69.22 1.2 95.43 72.14 67.57 96.25 73.41 69.66 96.69 73.98 70.66 1.3 94.97 74.97 69.94 93.98 74.68 68.65 94.35 77.11 71.46 1.4 93.21 77.33 70.54 92.69 78.10 70.79 94.23 77.66 71.89 1.5 92.77 77.60 70.36 92.69 78.10 70.79 94.23 77.66 71.89 1.6 91.00 80.60 71.60 90.63 82.81 73.44 92.94 79.76 72.70 1.7 90.66 82.24 72.89 90.63 82.81 73.44 91.71 81.27 72.98 1.8 90.66 82.24 72.89 87.96 84.37 72.33 91.07 82.02 73.09 1.9 90.39 84.59 74.98 87.96 84.37 72.33 88.90 84.66 73.56 2.0 89.60 86.03 75.63 87.21 84.37 71.59 88.90 84.66 73.56 2.1 86.00 87.96 73.96 82.39 86.67 69.07 84.63 86.84 71.47 2.2 81.97 88.34 70.31 82.39 86.67 69.07 83.43 88.39 71.82 2.3 80.21 88.76 68.97 80.52 87.64 68.16 80.30 89.61 69.91 2.4 77.80 89.92 67.73 74.14 91.17 65.31 77.89 90.78 68.67 2.5 77.80 89.92 67.73 72.88 91.38 64.26 76.47 91.51 67.98 2.6 73.66 90.88 64.54 71.52 92.14 63.66 72.36 92.56 64.93 2.7 68.57 92.33 60.90 70.06 92.82 62.88 70.10 93.23 63.33 2.8 68.57 92.33 60.90 66.73 94.47 61.20 70.10 93.23 63.33 2.9 65.19 94.59 59.78 67.21 94.23 61.44 70.10 93.23 63.33 3.0 63.59 95.16 58.75 62.60 94.77 57.37 65.53 93.89 59.42 3.1 64.20 95.03 59.23 62.60 94.77 57.37 63.64 94.87 58.51 3.2 64.20 95.03 59.23 59.79 95.56 55.35 62.72 95.38 58.10 3.3 61.85 95.60 57.45 60.24 95.31 55.55 62.72 95.38 58.10 3.4 59.85 95.82 55.67 56.84 96.24 53.08 62.16 96.18 58.34 3.5 58.67 96.10 54.78 56.48 96.58 53.05 54.86 97.12 51.98 3.6 58.67 96.10 54.78 54.82 97.08 51.90 55.57 97.08 52.65 3.7 57.61 97.12 54.73 54.82 97.08 51.90 52.84 97.99 50.83 3.8 50.12 98.44 48.56 52.51 97.67 50.18 52.84 97.99 50.83 3.9 50.54 98.16 48.70 52.51 97.67 50.18 50.95 98.33 49.28 4.0 50.54 98.16 48.70 46.36 98.16 44.52 50.95 98.33 49.28 4.1 50.12 98.44 48.56 42.00 98.91 40.90 48.21 98.61 46.82 4.2 44.85 98.44 43.29 41.36 99.00 40.36 45.65 99.03 44.67 4.3 44.10 98.44 42.54 41.36 99.00 40.36 47.84 98.93 46.77 4.4 41.20 98.54 39.73 41.36 99.00 40.36 44.92 99.06 43.97 4.5 39.32 98.87 38.19 39.87 99.00 38.87 43.38 99.06 42.44 4.6 39.32 98.87 38.19 38.38 99.00 37.38 43.38 99.06 42.44 4.7 39.32 98.87 38.19 37.94 99.27 37.21 41.85 99.06 40.90 4.8 38.72 98.99 37.71 37.94 99.27 37.21 41.85 99.06 40.90 4.9 38.20 99.20 37.40 37.94 99.27 37.21 39.54 99.06 38.60 5.0 34.75 99.47 34.22 36.45 99.27 35.72 33.57 99.20 32.77 Note. MEM, moving epidemic method.  下载: 导出CSV
Table 1. MEM model performance evaluation by cross-validation of weekly HFMD incidence in Beijing, China (2011–2019)
Year Sensitivity (%) Specificity (%) Positive predictive value (%) Negative predictive value (%) Youden’s index (%) 2011 99.11 86.61 88.10 98.98 85.72 2012 100.00 80.15 78.15 100.00 80.15 2013 100.00 71.28 72.43 100.00 71.28 2014 100.00 68.85 72.86 100.00 68.85 2015 99.05 87.39 87.39 99.05 86.44 2016 95.41 93.04 92.86 95.54 88.46 2017 53.00 100.00 100.00 70.44 53.00 2018 100.00 88.89 87.50 100.00 88.89 2019 61.56 100.00 100.00 75.57 61.56 Total 89.60 86.03 84.42 90.73 75.63 Note. MEM, moving epidemic method; HFMD, hand, foot, and mouth disease.
下载: 导出CSV
-
[1] Zhang J, Sun JL, Chang ZR, et al. Characterization of hand, foot, and mouth disease in China between 2008 and 2009. Biomed Environ Sci, 2011; 24, 214−21. [2] Dong SB, Wang XL, Huo D, et al. Epidemiological characteristics of hand, foot and mouth disease among people aged 6 and over in Beijing, 2011-2020. Chin J Epidemiol, 2022; 43, 207−12. (In Chinese [3] Zheng YM, Jit M, Wu JT, et al. Economic costs and health-related quality of life for hand, foot and mouth disease (HFMD) patients in China. PLoS One, 2017; 12, e0184266. doi: 10.1371/journal.pone.0184266 [4] Vega T, Lozano JE, Meerhoff T, et al. Influenza surveillance in Europe: establishing epidemic thresholds by the moving epidemic method. Influenza Other Resp Viruses, 2013; 7, 546−58. doi: 10.1111/j.1750-2659.2012.00422.x [5] Vega T, Lozano JE, Meerhoff T, et al. Influenza surveillance in Europe: comparing intensity levels calculated using the moving epidemic method. Influenza Other Resp Viruses, 2015; 9, 234−46. doi: 10.1111/irv.12330 [6] Rakocevic B, Grgurevic A, Trajkovic G, et al. Influenza surveillance: determining the epidemic threshold for influenza by using the Moving Epidemic Method (MEM), Montenegro, 2010/11 to 2017/18 influenza seasons. Euro Surveill, 2019; 24, 1800042. [7] Nie TR, Cui JZ, Ren MR, et al. Application of moving epidemic method in establishing epidemic intensity threshold of hand, foot, and mouth disease in southern China. Chin J Epidemiol, 2020; 41, 1047−53. (In Chinese [8] Wang XL. Study on the burden of hand, foot, and mouth disease and the effectiveness evaluation of the EV-A71 vaccination program in Beijing. Chinese Center for Disease Control and Prevention, 2019. (In Chinese [9] Zhao Z, Zheng CJ, Qi HC, et al. Impact of the coronavirus disease 2019 interventions on the incidence of hand, foot, and mouth disease in mainland China. Lancet Reg Health West Pac, 2022; 20, 100362. doi: 10.1016/j.lanwpc.2021.100362 [10] Hu CY, Tang YW, Su QM, et al. Public health measures during the COVID-19 pandemic reduce the spread of other respiratory infectious diseases. Front Public Health, 2021; 9, 771638. doi: 10.3389/fpubh.2021.771638 -

 点击查看大图
计量
- 文章访问数: 218
- HTML全文浏览量: 99
- PDF下载量: 24
- 被引次数: 0

 Quick Links