

 下载:
下载:


-
The International Diabetes Federation’s most recent data indicates that the prevalence of diabetes worldwide is projected to rise to 12.2% by 2025, with 783 million people affected[1]. The prevalence of diabetes in China has risen from 9.3% in 2011 to 13.04% in 2021[1]. A cross-sectional study in China showed that the prevalence of diabetes among Tibetans was 6.5% and it was 6.3% among the Hui people in 2018, while the incidence of diabetes in the Inner Mongolia Autonomous Region was as high as 19.9%, ranking first in the country[2]. The Mongolian population has a diet structured around meat and milk, supplemented by pasta, rice and vegetables, and foods such as homemade yogurt and bacon are often consumed. Such a unique diet may have contributed to a high incidence of diabetes among the Mongolian people.
Adipocytokines are bioactive substances that are secreted by adipose tissue and frequently play a role in disorders associated with obesity. Adiponectin, leptin, and other adipocytokines are significantly altered in obese type 2 diabetes mellitus (T2DM) patients. The adiponectin gene (ADIPOQ), which is located on chromosome 3Q27, encodes the adipocytokine adiponectin. Vaspin is a novel adipocytokine associated with obesity, glucose regulation, and insulin resistance. Serum vaspin levels were found to be elevated in patients with T2DM compared to healthy controls[3]. Leptin is a hormone that is mainly secreted by fat cells and increased leptin levels have been linked to the development of T2DM and insulin resistance[4]. Additionally, high genetic heterogeneity is a characteristic of T2DM[2]. Previous research showed that T2DM in the Mongolian population was correlated with polymorphisms in the ADIPOQ and leptin receptor (LEPR) genes. In a study of Han Chinese people, it was found that the single nucleotide polymorphism (SNP) rs2236242 in the vaspin gene (VASPIN) is associated with obesity and T2DM[5]. Finding the genetic and environmental causes of T2DM and understanding the possible etiology behind these causes may inspire fresh approaches in the treatment and prevention of the disease. However, the associations of SNPs in ADIPOQ, adiponectin receptor 2 gene (ADIPOR2), LEPR, and VASPIN with environmental factors in patients with T2DM remain to be fully clarified. The purpose of this study was to ascertain whether environmental variables, T2DM, and ADIPOQ, ADIPOR2, LEPR, and VASPIN SNPs in Mongolians are related. Additionally, gene-gene and gene-environment interactions.
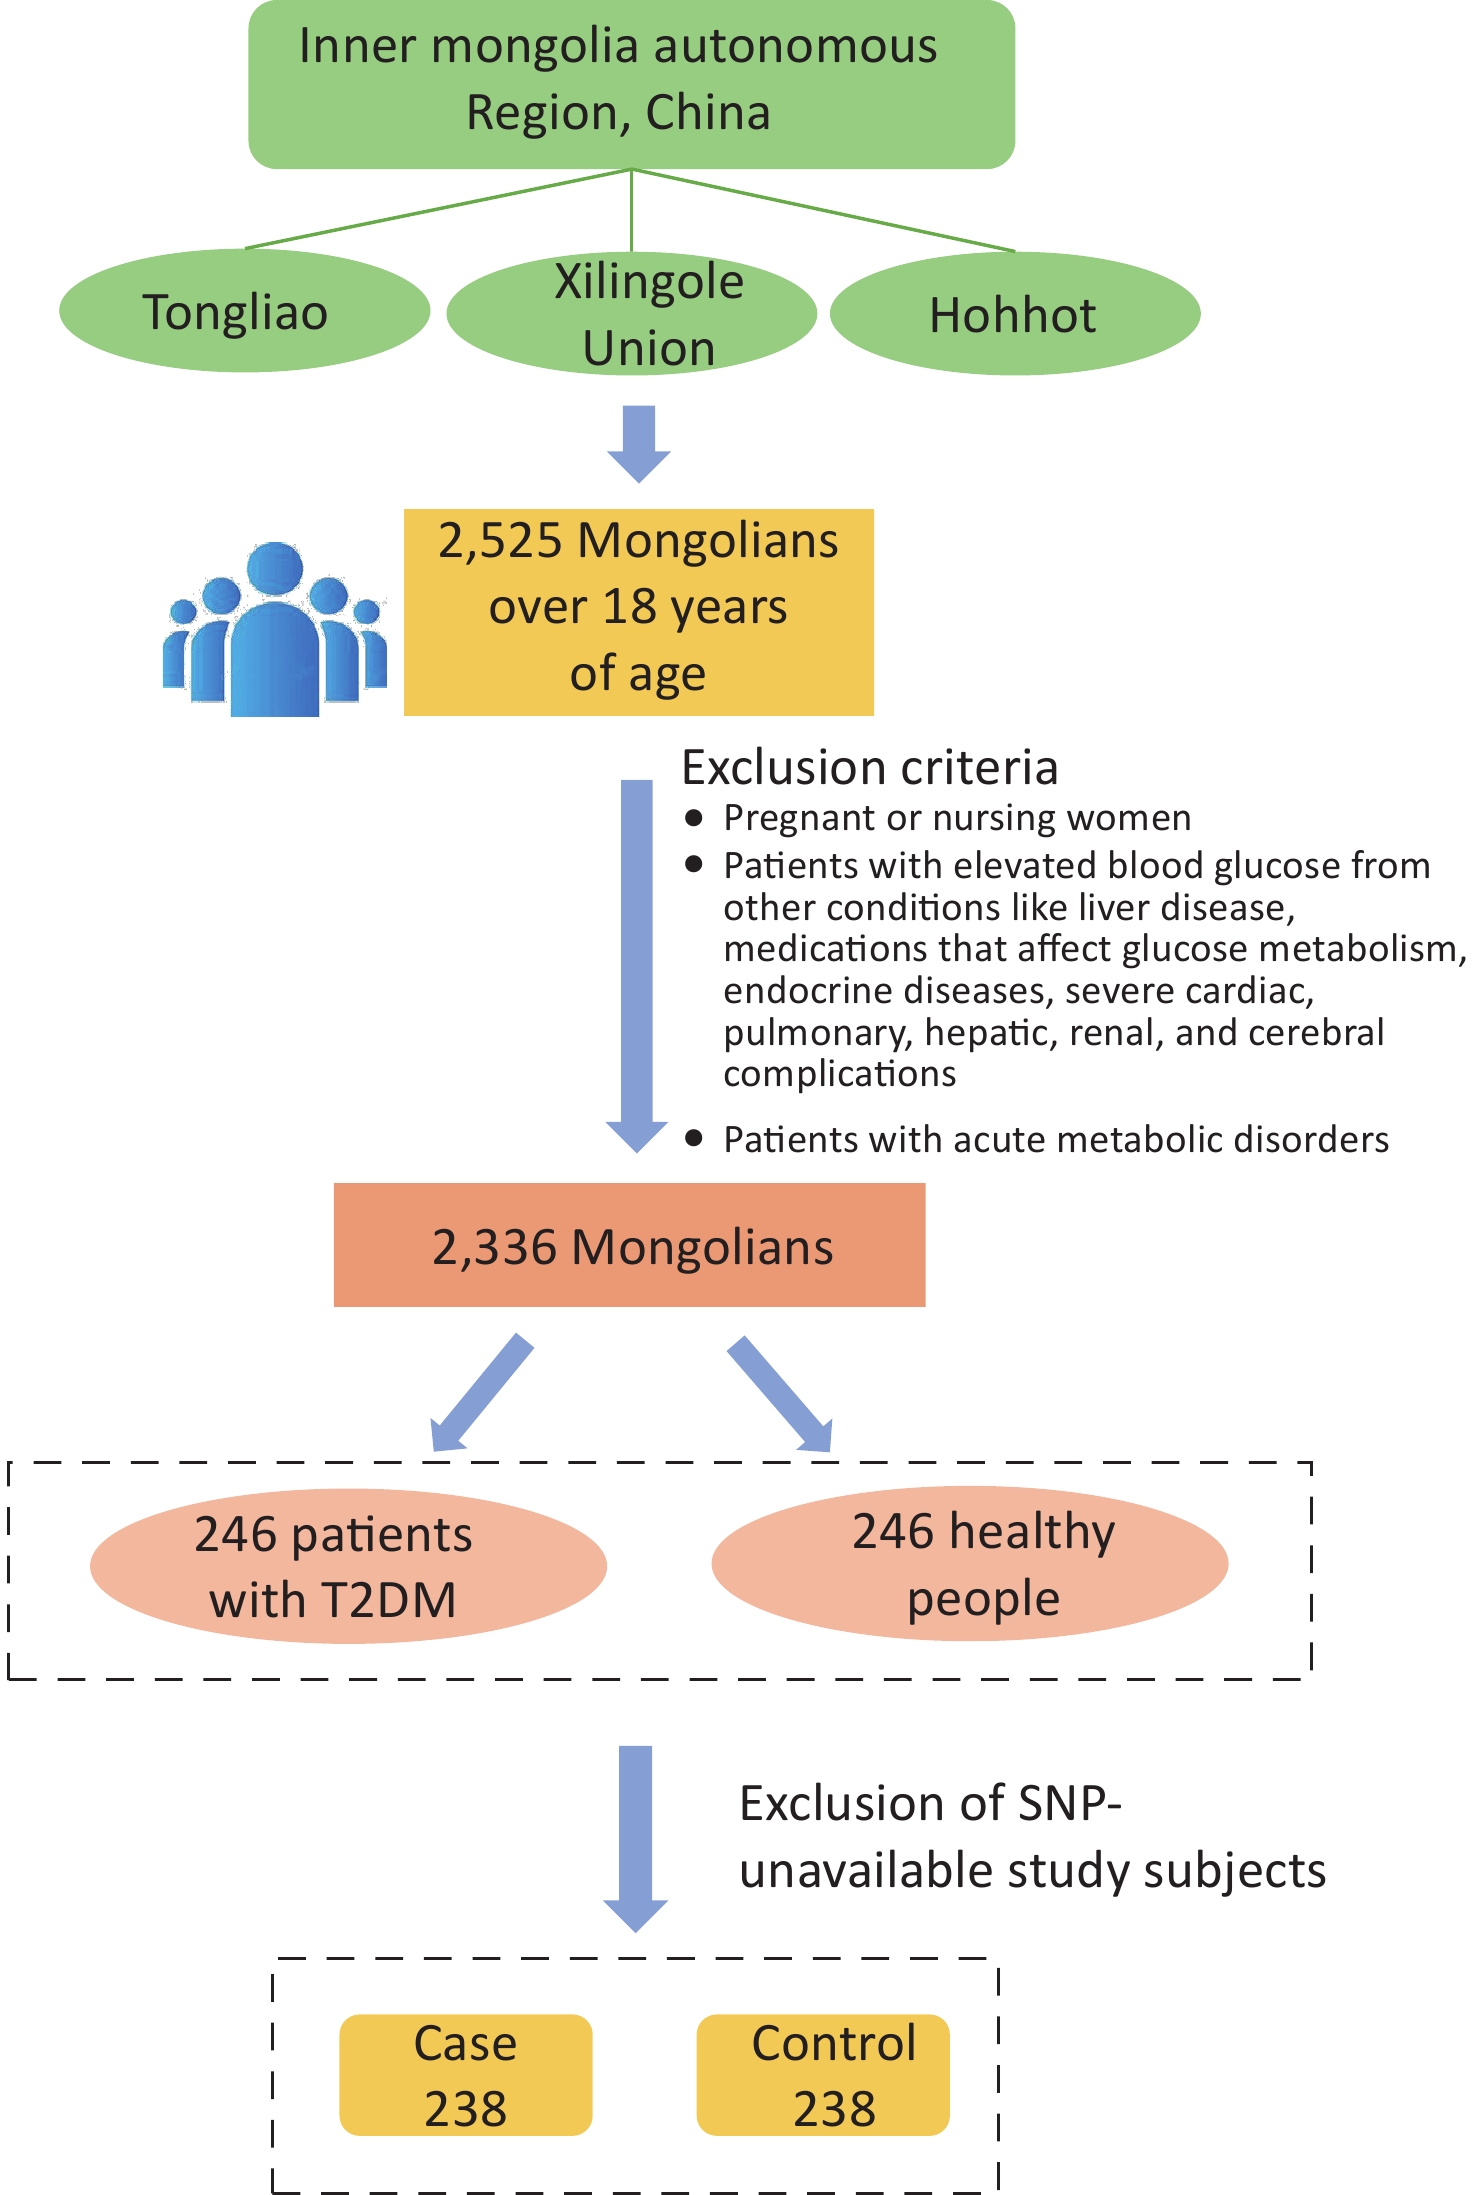
The study population was chosen from participants in a preliminary cross-sectional survey. Using multistage whole-cluster random sampling by population proportion, we conducted on-site epidemiologic surveys on the Mongolian populations in Tongliao, Xilingole Union, and Hohhot, in the Inner Mongolia Autonomous Region, from 2018 to 2020, and the current study focused on T2DM patients within the study population. Using the method of frequency matching, healthy people were selected as a control group in the cross-sectional survey population based on the condition of similar age ratio and sex ratio to the case group. The sample size was calculated by referring to the case-control sample size formula: $ n=\dfrac{\left(u_{\alpha/2}\sqrt{2pq}\ +u_{\beta}\sqrt{p_0q_0+p_1q_1}\right)^2}{\left(p_1-p_0\right)^2} $, where α = 0.05, β = 0.1. A query of PubMed showed that in the SNPs selected for study, the smallest minimal allele frequency is the SNP locus rs822393 of ADIPOQ at 0.369, which gives P0 = 0.369 and an odds ratio (OR) = 1.84, from which the sample size is calculated[6]. The sample size for this case-control study was calculated as 231 cases in the case and control groups, respectively. In the final analysis, 238 patients with T2DM and 238 healthy controls were included, with an age range of 26–80 years (57.20 ± 10.25) in the case group and 27–80 years [57.00 (13.00)] in the control group (Figure 1). All subjects signed an informed consent form prior to enrollment.
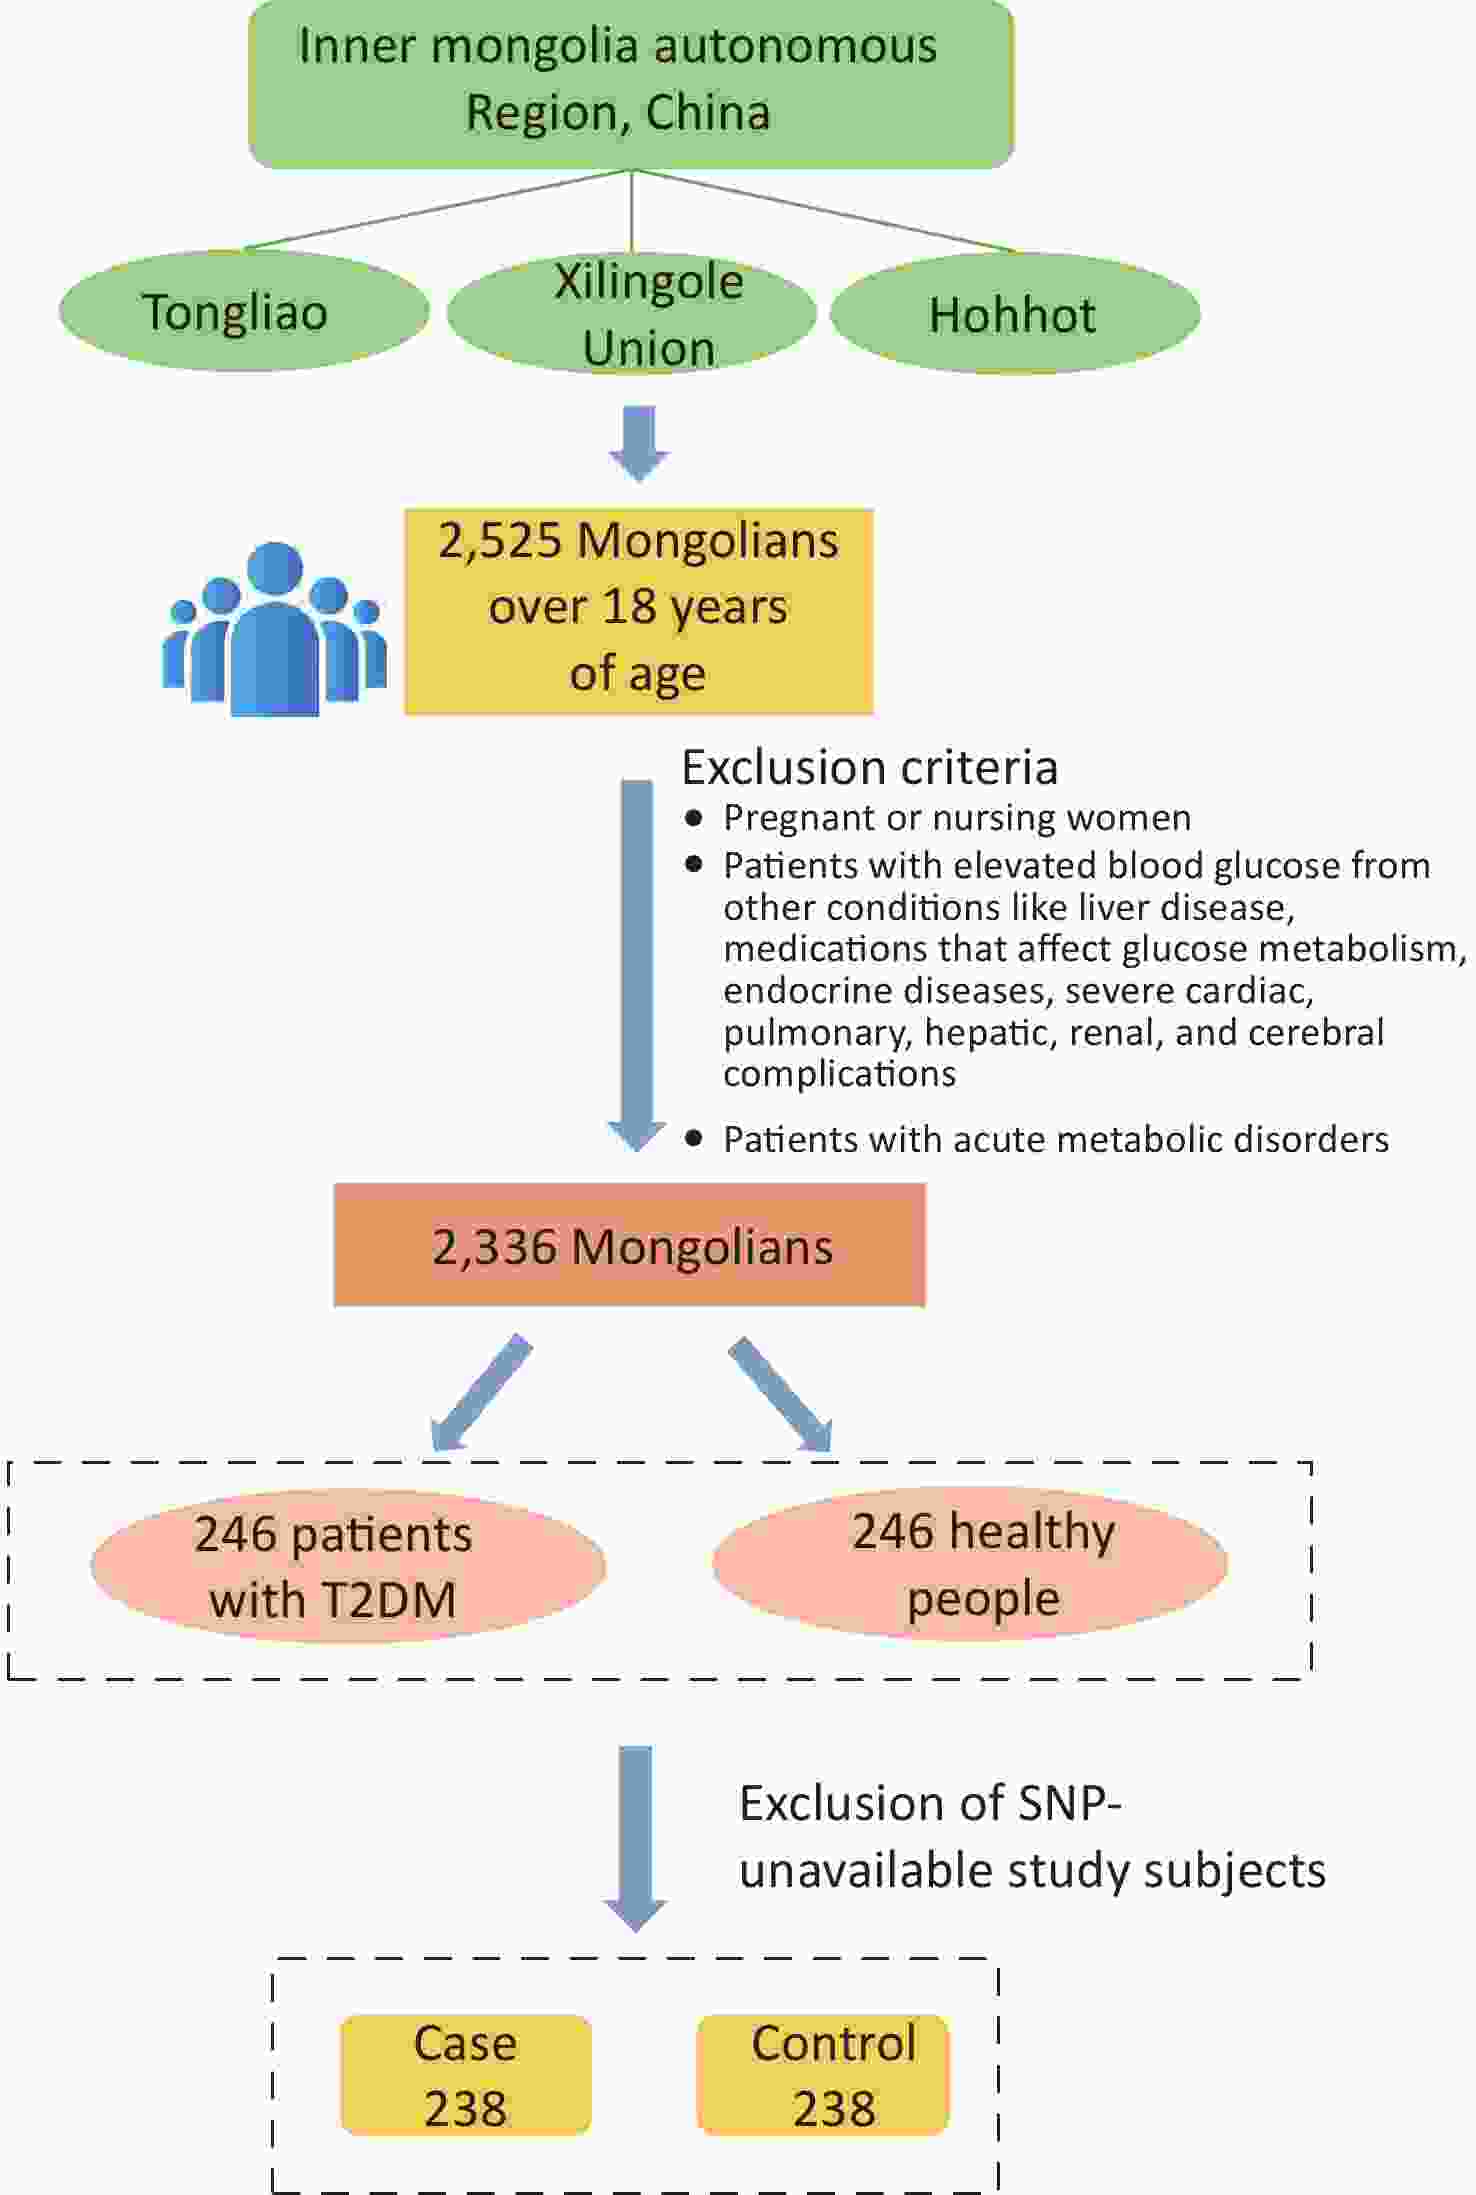
Figure 1. The flowchart of the study sample.
The questionnaires covered general demographics, family history, life behavioral patterns and other items. Blood samples were used to measure fasting blood glucose, total cholesterol (TC), triglycerides (TG), high-density lipoprotein cholesterol (HDL-C), and low-density lipoprotein cholesterol (LDL-C). Serum leptin and adiponectin levels were measured by enzyme-linked immunosorbent assays commissioned by SinoBest Bio (Shanghai, China).
Genomic DNA was isolated from the blood samples using a Blood Genome DNA Extraction Kit (TIANGEN Bio Company, Beijing, China), following the manufacturer’s instructions. To assess the quality, DNA concentrations and purity were measured using ultraviolet-visible spectrophotometry (NanoDrop 2000c Spectrophotometer; Thermo Fisher Scientific, Wilmington, DE, USA), with ultrapure water used as a negative control.
By adding 2,000 bp to the 3' and 5' ends of the genes, the data for the genes were retrieved using the public 1,000 Genomes database. The gene Tag SNPs were obtained by Haploview software (version 4.2; Broad Institute of MIT and Harvard) by setting the following selection criteria: minimum allele frequency > 0.05 and linkage disequilibrium r2 > 0.8. The PubMed database was searched for studies on ADIPOQ, ADIPOR2, LEPR, and VASPIN gene polymorphisms and T2DM. Combining the results of the literature search, eight loci were screened in this study, including ADIPOQ (rs822396, rs822393, rs10937273), ADIPOR2 (rs11061971), LEPR (rs2211651, rs3790433, rs12037879), and VASPIN (rs2236242).
PCR amplification primers and multiple single-base extension primers were designed by Genesky Biotechnologies Inc. (Shanghai, China) as shown in Supplementary Table S1 (available in www.besjournal.com), and multiple high-temperature ligase detection reaction technology was used for genotyping experiments. The collected original data were analyzed by GeneMapper 4.1 software (Applied Biosystems, Foster City, CA, USA).
Table S1. SNP information
ID Gene Chromosome position Functional consequence Allele (major/minor) PCR primers rs822396 ADIPOQ 186566877 intron1 G/A F: CCCAGGCTGATCGCACCTATTA R: ATAAAGGGTGACGGGGGGCTTA rs822393 ADIPOQ 186566326 intron1 C/T F: TCTGACTTCCAAATCGGTGAGCTTT R: GTCGCTAGCATCTTGCGCTCTC rs10937273 ADIPOQ 186549695 5'-flanking G/A F: CACAGCCCGAAGCACTCTCAAT R: GGGACAGCACCCCAGAAACATC rs2236242 VASPIN 94960052 intron4 A/T F: GAAGGAGGTGCCCTGGAAGAGA R: TCCTCACAGGGACCCAGGATAAC rs2211651 LEPR 66156021 3'-flanking G/T F: TGTAGAGGGATGACGAAGGCTCTC R: TGCAACTGCTTGGTTGCCTCTC rs3790433 LEPR 65894342 intron2 C/T F: TGGAATGGGAGGCTTTCATTAGTGT R: AACTGTTTTCCTCCCAAATTTCAACAT rs12037879 LEPR 65942707 intron2 G/A F: CACACAAGCACACATATGCAGAACA R: CAGGGAATGGAGGTGGGTAAGG rs11061971 ADIPOR2 1863728 intron2 T/A F: GGCTCAGAAAAGGGCACCAACT R: ACAAATGTGCAAGTTTCCTTCTTACCA For this study, we used SPSS 25.0 software (IBM, New York, NY, USA) to conduct the statistical analyses. Values of P < 0.05 were considered statistically significant. The associations between genotype frequency and loci in the dominant and stealth models and T2DM were evaluated by multiple logistic regression analysis. Haploview software was used to determine the Hardy-Weinberg equilibrium (HWE), linkage disequilibrium (LD), and haplotype of the gene loci. We screened the best gene-gene and gene-environment interaction patterns by generalized multifactor dimensionality reduction (GMDR). The optimal model with maximum cross-consistency was selected.
The biochemical and basic demographic characteristics of the 238 patients and 238 healthy controls are shown in Table 1. Compared with the healthy controls, the T2DM patients had higher body mass index (BMI), waist-to-hip ratio (WHR), fasting blood glucose, TC, TG, systolic blood pressure, and diastolic blood pressure, but lower HDL-C (P < 0.05). Patients with a history of hypertension and hyperlipidemia and a family history of diabetes were more frequent in the patient group compared with the healthy control group (P < 0.05).
Table 1. General characteristics of the study subjects
Parameter Case (n = 238) Control (n = 238) z (χ2) P Gender (male%) 122 (51.26) 121 (50.84) 0.218 0.975 Age (years) 57.23 ± 10.32 57.00 (13.00) −0.573 0.567 BMI1 (kg/m2) 28.06 (5.24) 25.09 (5.47) −7.349 < 0.001* WHR2 0.93 (0.07) 0.89 (0.08) −6.286 < 0.001* Fasting blood glucose (mmol/L) 6.70 (3.54) 5.31 (0.79) −10.424 < 0.001* Total cholesterol (mmol/L) 4.26 (2.23) 4.01 (2.49) −2.061 0.044* Triglyceride (mmol/L) 3.10 (3.43) 1.99 (3.51) −4.305 < 0.001* HDL-C3 (mmol/L) 1.35 (0.51) 1.43 (0.50) −3.870 < 0.001* LDL-C4 (mmol/L) 2.80 (1.13) 2.76 (1.00) −1.398 0.162 Uric Acid (μmol/L) 329.9 (125.43) 318.75 (126.73) −1.024 0.306 Systolic blood pressure (mmHg) 135.00 (26.00) 128.50 (27.00) −4.079 < 0.001* Diastolic blood pressure (mmHg) 86.00 (16.00) 84.02 ± 12.35 −2.354 0.019* Serum adiponectin (ng/mL) 58.80 (27.34) 58.20 (24.91) −0.185 0.853 Serum leptin (ng/mL) 11.72 (3.86) 11.66 (4.28) −0.237 0.813 Employment status (%) 175 (73.53) 186 (78.15) 1.387 0.239 History of hypertension (%) 145 (60.92) 85 (35.71) 30.286 < 0.001* History of hyperlipidemia (%) 89 (37.39) 41 (17.23) 24.382 < 0.001* Family history of diabetes mellitus (%) 53 (22.27) 33 (13.87) 5.617 0.017* Degree of education (%) ≤ Junior high school 196 (82.35) 205 (86.13) 1.282 0.258 ≥ Senior high school 42 (17.65) 33 (13.87) Marital status (%) Bachelordom 5 (2.10) 3 (1.26) 0.574 0.750 Get married /shack up 207 (86.97) 207 (87.97) Bereft of one’s spouse/divorce 26 (10.92) 28 (11.76) Physical activity (%) High 48 (20.17) 52 (21.85) 1.659 0.436 Middle 157 (65.97) 162 (68.07) Low 33 (13.87) 24 (10.08) Smoke (%) Yes 71 (29.83) 71 (29.83) 0.000 1.000 No 167 (70.17) 167 (70.17) Drink (%) Yes 66 (27.73) 64 (26.89) 0.042 0.837 No 172 (72.27) 174 (73.12) Note. 1BMI, body mass index; 2WHR, waist-to-hip ratio; 3HDL-C, high-density lipoprotein cholesterol; 4LDL-C, low-density lipoprotein cholesterol. *Statistical significance was attributed as P < 0.05. As shown in Supplementary Table S2 (available in www.besjournal.com), the eight SNPs in the two groups basically met HWE (P > 0.05). As in Supplementary Table S3 (available in www.besjournal.com), allele frequencies at the gene loci did not differ statistically significantly between the two groups (P > 0.05). The relationship between T2DM and the SNPs in ADIPOQ, VASPIN, LEPR, and ADIPOR2 was examined using dominant and invisible models of the genes. There were no significant relationships between the genetic patterns and T2DM (Supplementary Table S4, available in www.besjournal.com).
Table S2. Comparison of the allele frequencies between the case and control groups
dbSNPID Genotypes, n (%) χ2 P MAF (%) HWE-P rs822396 AA GA GG 1.398 0.497 10.50 0.19 Case 194 (81.51) 42 (17.65) 2 (0.84) Control 189 (79.41) 44 (18.49) 5 (2.10) rs822393 CC CT TT 3.710 0.156 37.39 0.50 Case 52 (21.85) 130 (54.62) 56 (23.53) Control 68 (28.57) 111 (46.64) 59 (24.79) rs10937273 AA GA GG 0.254 0.881 39.81 0.59 Case 36 (15.13) 120 (50.42) 82 (34.45) Control 36 (15.13) 115 (48.32) 87 (36.55) rs2236242 AA AT TT 1.261 0.532 27.32 1.00 Case 21 (8.82) 96 (40.33) 120 (50.42) Control 15 (6.30) 95 (39.91) 128 (53.78) rs2211651 GG GT TT 0.990 0.610 27.63 0.26 Case 2 (0.84) 58 (24.37) 178 (74.79) Control 1 (0.42) 66 (27.73) 171 (71.85) rs3790433 CC CT TT 0.668 0.716 12.39 0.88 Case 184 (77.31) 49 (20.58) 5 (2.10) Control 182 (76.47) 53 (22.27) 3 (1.26) rs12037879 AA GA GG 0.650 0.722 20.06 1.00 Case 8 (3.36) 79 (33.19) 151 (63.45) Control 11(4.62) 74 (31.09) 153 (64.29) rs11061971 AA TA TT 1.323 0.516 36.87 0.57 Case 38 (15.97) 103 (43.28) 97 (40.76) Control 30 (12.60) 112 (47.06) 96 (40.34) Table S3. Association of allele frequency with T2DM
SNPID Alleles Case, n (%) Control, n (%) χ2 P OR ( 95% CI) rs822393 C 233 (48.90) 249 (52.30) 1.075 0.299 0.874 (0.678, 1.127) T 243 (51.10) 227 (47.70) rs822396 A 429 (90.10) 423 (88.90) 0.402 0.526 1.142 (0.755, 1.731) G 47 (9.90) 53 (11.10) rs10937273 A 192 (40.30) 187 (39.30) 0.110 0.741 1.045 (0.806, 1.354) G 284 (59.70) 289 (60.70) rs2236242 A 143 (30.00) 124 (26.10) 1.879 0.171 1.219 (0.918, 1.618) T 333 (70.00) 352 (73.90) rs2211651 G 62 (13.00) 69 (14.50) 0.434 0.510 0.883 (0.610, 1.278) T 414 (87.00) 407 (85.50) rs3790433 C 418 (87.80) 417 (87.60) 0.010 0.921 1.020 (0.692, 1.501) T 58 (12.20) 59 (12.40) rs12037879 A 95 (20.00) 95 (20.00) 0.000 1.000 1.000 (0.728, 1.374) G 381 (80.00) 381 (80.00) rs11061971 A 182 (38.20) 172 (36.10) 0.450 0.503 1.094 (0.841, 1.423) T 294 (61.80) 304 (63.90) Note. CI, confidence interval; OR, odds ratio. Table S4. Association of genetic models with T2DM
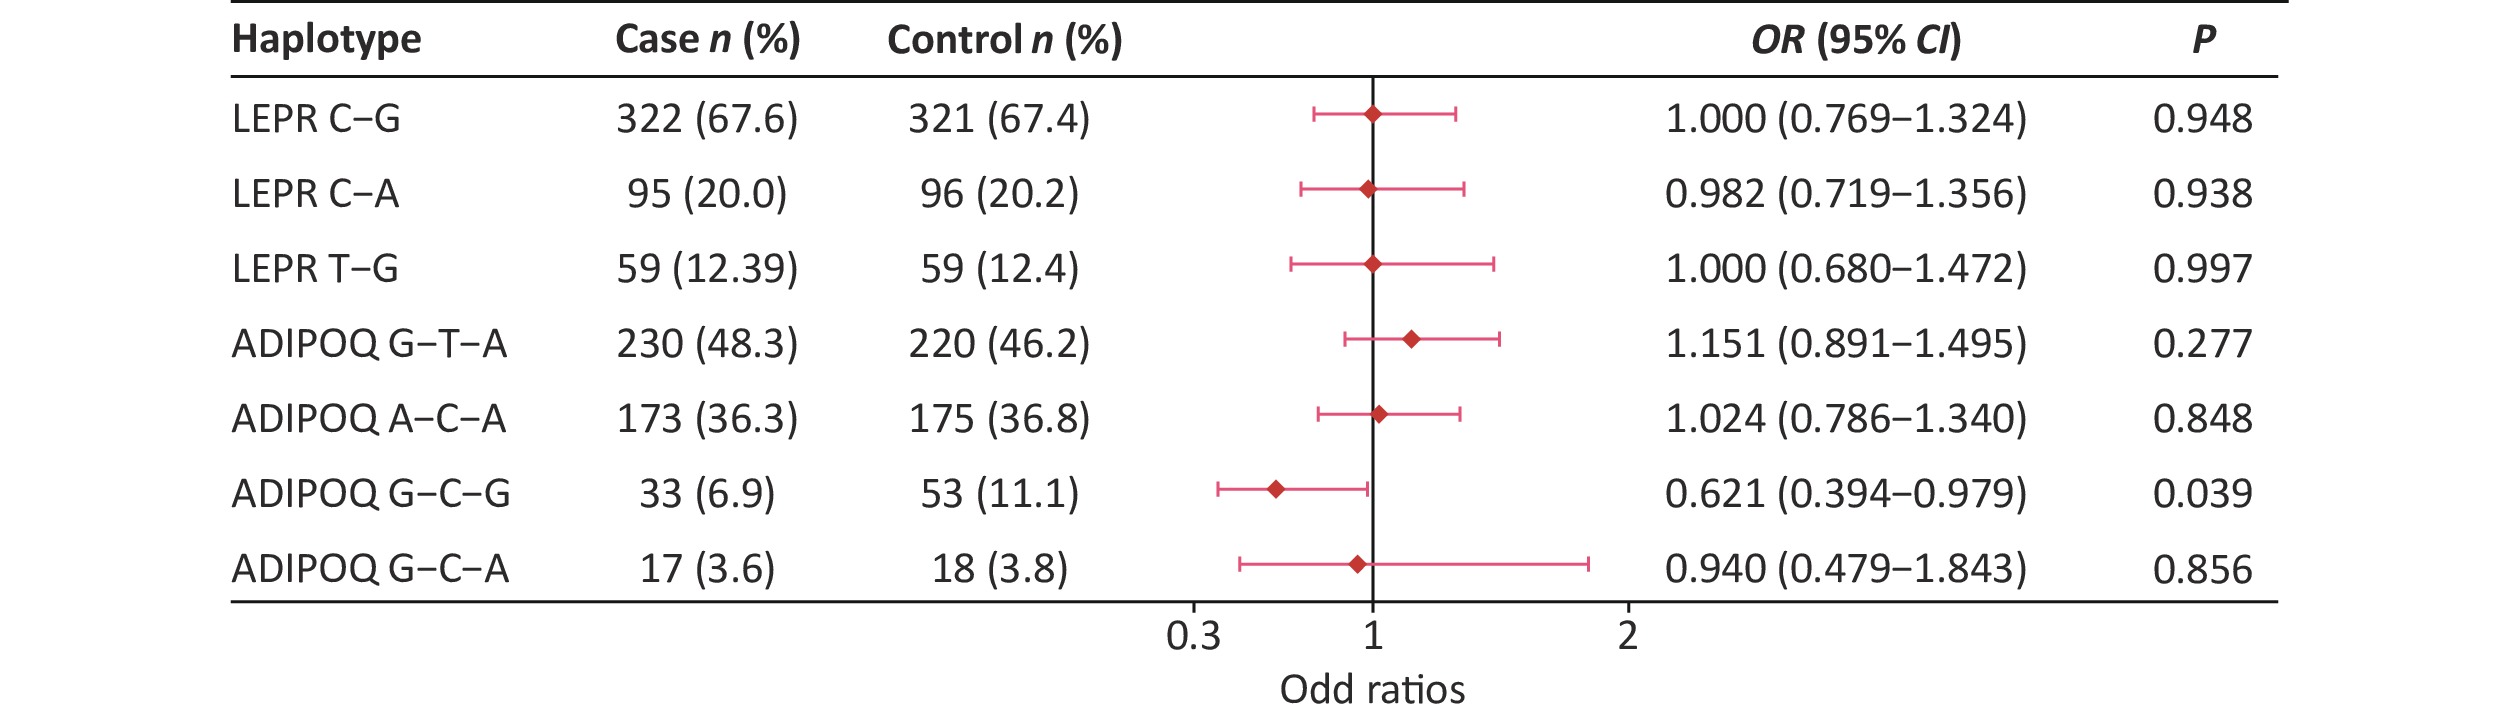
SNPs Genetic models P OR (95% CI) Adjusted OR (95% CI) rs822396 AA vs. GA+GG 0.563 1.143 (0.726, 1.799) 0.783 (0.506, 1.212) GG vs. GA+AA 0.253 0.395 (0.076, 2.056) 0.823 (0.526, 1.289) rs822393 CC vs. CT+TT 0.091 0.699 (0.461, 1.060) 0.889 (0.551, 1.436) TT vs. CT+CC 0.748 0.934 (0.613, 1.421) 0.441 (0.077, 2.522) rs10937273 AA vs. GA+GG 1.000 1.000 (0.606, 1.651) 0.946 (0.561, 1.594) GG vs. GA+AA 0.632 0.912 (0.627, 1.328) 0.826 (0.556, 1.229) rs2236242 AA vs. AT+TT 0.292 1.445 (0.726, 2.877) 1.639 (0.806, 3.335) TT vs. AT+AA 0.492 0.881 (0.615, 1.264) 0.799 (0.548, 1.167) rs2211651 GG vs. GT+TT 0.562 2.008 (0.181, 22.300) 2.445 (0.218, 27.486) TT vs. GT+GG 0.468 1.162 (0.774, 1.746) 1.066 (0.696, 1.632) rs3790433 CC vs. CT+TT 0.828 1.048 (0.685, 1.606) 1.066 (0.681, 1.669) TT vs. CT+CC 0.476 1.681 (0.397, 7.115) 1.733 (0.381, 7.877) rs12037879 AA vs. GA+GG 0.482 0.718 (0.283, 1.817) 0.533 (0.196, 1.450) GG vs. GA+AA 0.849 0.964 (0.663, 1.402) 0.888 (0.599, 1.315) rs11061971 AA vs. AT+TT 0.295 1.317 (0.786, 2.208) 1.081 (0.628, 1.862) TT vs. AT+AA 0.926 1.018 (0.706, 1.467) 1.074 (0.731, 1.578) Note. Adjusted for BMI; CI, confidence interval; OR, odds ratio. The LD between rs3790433 and rs12037879 and between rs10937273, rs822396, and rs822393 was strong in the two groups (Supplementary Table S5, available in www.besjournal.com). Haplotype analysis showed that the ADIPOQ rs10937273G-rs822393C-rs822396G haplotype showed a significant difference between the two groups (P < 0.05). Furthermore, this haplotype was negatively associated with T2DM, with an OR of 0.621 (0.394–0.979) (Supplementary Figure S1, available in www.besjournal.com).
Table S5. Linkage disequilibrium analyses of the eight SNP Loci
SNP D’ r2 rs822396-rs822393 0.968 0.108 rs822396-rs10937273 0.632 0.031 rs822393-rs10937273 0.896 0.520 rs2211651-rs3790433 0.399 0.142 rs2211651-rs12037879 0.424 0.007 rs12037879-rs3790433 1.000 0.036 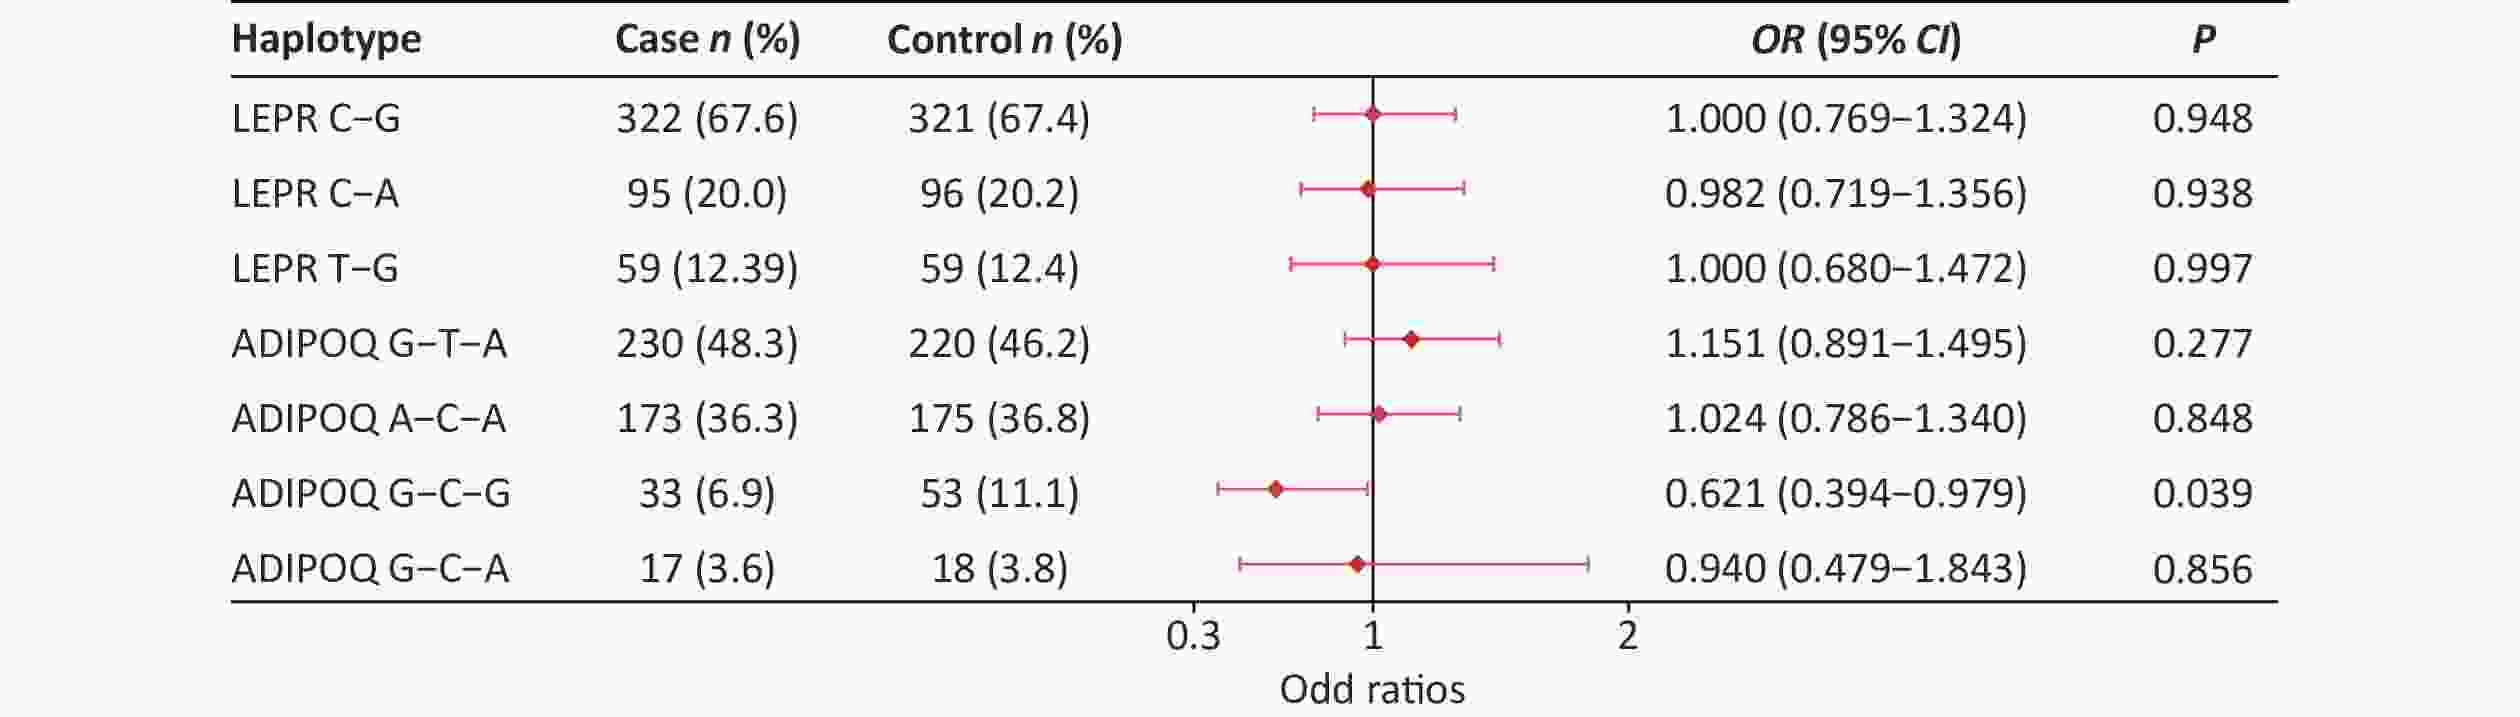
Figure S1. Haplotype distribution of the Gene SNPs.
Environmental risk factors associated with T2DM were included in interaction analysis models in which eight SNP loci, BMI, history of hypertension, and WHR yielded several significant interaction models associated with T2DM (Table 2). Regarding the gene-gene interactions, ADIPOQ rs822393 and VASPIN rs2236242 (OR = 2.412, 95% confidence interval (CI) = 1.372, 4.239, P = 0.011), and LEPR rs3790433 and ADIPOR2 rs11061971 (OR = 1.442, 95% CI = 0.834, 2.491, P = 0.011) were selected as the optimal interaction models. Other significant two-locus models indicated potential SNP-environment interactions. The optimal interaction models were rs12037879-hypertension (OR = 2.639, 95% CI = 1.519, 4.584, P = 0.001) and rs822396-hypertension (OR = 2.615, 95% CI = 1.506, 4.541, P = 0.001). The gene-environment interaction analysis also showed that the optimal model was the rs2236242-BMI (OR = 3.156, 95% CI = 1.789, 5.569, P = 0.011) interaction model. In addition, in the interaction with WHR, the optimal model was rs822396-WHR (OR = 2.670, 95% CI = 1.454, 4.905, P = 0.011).
Table 2. Gene-environment interaction models
Locus no Best combination Training Bal.Acc Testing Bal.Acc Cross-validation consistency P SNP-SNP interaction rs822393 0.603 0.599 10/10 0.011* rs2236242 rs3790433 0.544 0.539 10/10 0.011* rs11061971 SNP-environment interaction Gene-hypertension interaction rs822393-hypertension 0.618 0.617 9/10 0.001* rs822396-hypertension 0.618 0.618 10/10 0.001* rs2211651-hypertension 0.620 0.615 8/10 0.001* rs3790433-hypertension 0.619 0.609 7/10 0.001* rs12037879-hypertension 0.619 0.609 10/10 0.001* Gene-BMI interaction rs2236242-BMI 0.636 0.602 10/10 0.011* rs822393-BMI 0.640 0.595 7/10 0.011* Gene-WHR interaction rs822396-WHR 0.601 0.593 10/10 0.011* rs2236242-WHR 0.612 0.555 8/10 0.172 Note. *Statistical significance was attributed as P < 0.05. In the development of T2DM, genetic factors and environmental factors often have mutual effects on one another. Although genetic factors cannot directly lead to the occurrence of T2DM, they can indirectly affect environmental factors and thus affect the development of T2DM[7]. GMDR is a statistical analysis method to examine gene-gene and gene-environment interactions by modeling disease susceptibility classification. We used GMDR software to construct interaction models for gene-gene and gene-environment interactions. The gene-gene interaction analysis revealed that the SNPs rs822393 of ADIPOQ interacted with the rs2236242 of VASPIN, and SNPs rs3790433 of LEPR interacted with the rs11061971 of ADIPOR2. The gene-environment interaction analysis showed that the SNPs of ADIPOQ and LEPR had interactions with a history of hypertension, while the SNPs of VASPIN and ADIPOQ had interactions with BMI and the SNPs of VASPIN and ADIPOQ had interactions with WHR. These interactions were associated with T2DM in Mongolian people.
Adiponectin, leptin, and vaspin are all adipocytokines associated with T2DM. A study on an Indian population showed that the association between ADIPOQ SNP rs822393 and T2DM was mediated by obesity, and that the association disappeared after adjustment for BMI[6]. In our study, although there were no significant differences in genotype frequencies for rs822393, the patient group had significantly higher BMI and WHR compared with the healthy controls. This result can also explain the above point indirectly. In addition, adiponectin has a variety of metabolic effects, including inhibiting cell death, anti-inflammatory effects, and insulin sensitization, and it is inversely associated with obesity and insulin resistance[6]. As a newly discovered adipocytokine, increased serum vaspin has been found to be associated with changes in insulin sensitivity. Adiponectin and vaspin had similar effects on insulin resistance, consistent with the synergistic effect between the two genes on T2DM observed in the gene-gene interaction analysis. Adiponectin performs its cellular and metabolic functions by binding to two receptor subtypes. Adiponectin receptor 2 (AdipoR2) is only expressed in the liver and mediated sensitization of adiponectin to insulin in different organs[8]. Leptin effects were reported to be associated with improved hepatic steatosis[4], and leptin replacement therapy was found to improve insulin resistance by inhibiting liver gluconeogenesis and lipolysis[4]. This may be the reason for the synergistic effect of the SNPs in LEPR and ADIPOR2 on T2DM observed in the present study.
In the present study, 60.9% of T2DM patients had hypertension, which was significantly higher than the control group. The interaction analysis results showed that the ADIPOQ and LEPR SNPs both interacted with a history of hypertension. The reasons for these findings may be as follows. First, obesity is the main cause of cardiovascular diseases, T2DM, hypertension, and other chronic diseases, and an imbalance of adipocytokines may mediate the adverse effects of obesity. Adiponectin level may affect the risk of T2DM and hypertension. Second, adiponectin levels are jointly affected by ADIPOQ SNPs and environmental factors, including lifestyle, obesity, hypertension, and the presence of other cardiovascular diseases. In addition, the interaction model between ADIPOQ and VASPIN SNPs and BMI and WHR was statistically significant, and the interaction increased the risk of T2DM in Mongolians. BMI can indirectly reflect the influence of obesity on T2DM as being overweight or obese is associated with an increased T2DM risk[2]. However, the specific mechanism by which the gene-environment interaction affects the disease development of T2DM in Mongolian people is not clear and needs to be further determined by further studies.
Multiple studies have consistently indicated that obesity was closely related to the development of diabetes, and that physical activity, dietary habits, and cytokines can all lead to obesity. Lifestyle changes, including reducing fat intake, eating a healthy diet, and adding physical activity, are still among the most effective strategies for treatment of T2DM[7]. Regarding the diet structure of Mongolian people, intake of fat should be reduced, and consumption of vegetables, fruits, and whole grains should be increased[9,10]. To prevent the onset of T2DM, blood glucose should be actively monitored in hypertensive patients to achieve early detection and treatment.
The present study has some limitations, and the design could be improved. First, the sample size was small, which may underrepresent the effects of genetic and environmental factors on T2DM in the Mongolian population. Second, because the study was a case-control study, selection bias and survivor bias were prone to occur in the sample selection. Third, the duration of T2DM in the patient participants was unclear, and some patients had taken certain control measures after receiving their diagnosis, conferring bias on the results of the questionnaire survey. Finally, the mechanism for the influence of adipocytokines on T2DM remains to be clarified. We need to enlarge the sample size and conduct a more in-depth study on the gene-environment interactions of adipocytokines.
In the present study, we analyzed the interactions between ADIPOQ, LEPR, VASPIN, and ADIPOR2 SNPs and environmental factors on T2DM in a Mongolian population. The results showed that a haplotype of ADIPOQ (10937273G-rs822393C-rs822396G) had a protective effect against T2DM. The gene-gene interaction analysis showed that ADIPOQ rs822393 and VASPIN rs2236242 interacted, as did LEPR rs3790433 and ADIPOR2 rs11061971. The gene-environment interaction analysis showed an interaction of hypertension with the ADIPOQ rs822396 and LEPR rs12037879 SNPs, and the interaction of BMI with VASPIN rs2236242 and WHR with ADIPOQ rs822396 were associated with T2DM in Mongolian people.
The author declares no conflicts of interests.
We thank all the researchers for the data and blood samples collected, and all the study participants for their participation and contributions. ZHAO Ling Yan conceived the idea. ZHANG Li Hong, PANG Hui, ZHENG Hai Fang and DONG Jia Hui collected the data. ZHANG Li Hong and ZHAO Yan Ping input data. LI Na did the statistical analyses and wrote the manuscript. GAO Yu Min and LI Hai Ling conducted project supervision and data monitoring. LI Wu Yun Ta Na controlled experimental quality. All authors have read and agreed to the published version of the manuscript.
doi: 10.3967/bes2023.155
Adipocytokine Gene SNPs and Type 2 Diabetes in Mongolians: A Gene-Gene and Gene-Environment Interaction Study
-
&These authors contributed equally to this work.
注释: -
S1. SNP information
ID Gene Chromosome position Functional consequence Allele (major/minor) PCR primers rs822396 ADIPOQ 186566877 intron1 G/A F: CCCAGGCTGATCGCACCTATTA R: ATAAAGGGTGACGGGGGGCTTA rs822393 ADIPOQ 186566326 intron1 C/T F: TCTGACTTCCAAATCGGTGAGCTTT R: GTCGCTAGCATCTTGCGCTCTC rs10937273 ADIPOQ 186549695 5'-flanking G/A F: CACAGCCCGAAGCACTCTCAAT R: GGGACAGCACCCCAGAAACATC rs2236242 VASPIN 94960052 intron4 A/T F: GAAGGAGGTGCCCTGGAAGAGA R: TCCTCACAGGGACCCAGGATAAC rs2211651 LEPR 66156021 3'-flanking G/T F: TGTAGAGGGATGACGAAGGCTCTC R: TGCAACTGCTTGGTTGCCTCTC rs3790433 LEPR 65894342 intron2 C/T F: TGGAATGGGAGGCTTTCATTAGTGT R: AACTGTTTTCCTCCCAAATTTCAACAT rs12037879 LEPR 65942707 intron2 G/A F: CACACAAGCACACATATGCAGAACA R: CAGGGAATGGAGGTGGGTAAGG rs11061971 ADIPOR2 1863728 intron2 T/A F: GGCTCAGAAAAGGGCACCAACT R: ACAAATGTGCAAGTTTCCTTCTTACCA  下载: 导出CSV
Table 1. General characteristics of the study subjects
Parameter Case (n = 238) Control (n = 238) z (χ2) P Gender (male%) 122 (51.26) 121 (50.84) 0.218 0.975 Age (years) 57.23 ± 10.32 57.00 (13.00) −0.573 0.567 BMI1 (kg/m2) 28.06 (5.24) 25.09 (5.47) −7.349 < 0.001* WHR2 0.93 (0.07) 0.89 (0.08) −6.286 < 0.001* Fasting blood glucose (mmol/L) 6.70 (3.54) 5.31 (0.79) −10.424 < 0.001* Total cholesterol (mmol/L) 4.26 (2.23) 4.01 (2.49) −2.061 0.044* Triglyceride (mmol/L) 3.10 (3.43) 1.99 (3.51) −4.305 < 0.001* HDL-C3 (mmol/L) 1.35 (0.51) 1.43 (0.50) −3.870 < 0.001* LDL-C4 (mmol/L) 2.80 (1.13) 2.76 (1.00) −1.398 0.162 Uric Acid (μmol/L) 329.9 (125.43) 318.75 (126.73) −1.024 0.306 Systolic blood pressure (mmHg) 135.00 (26.00) 128.50 (27.00) −4.079 < 0.001* Diastolic blood pressure (mmHg) 86.00 (16.00) 84.02 ± 12.35 −2.354 0.019* Serum adiponectin (ng/mL) 58.80 (27.34) 58.20 (24.91) −0.185 0.853 Serum leptin (ng/mL) 11.72 (3.86) 11.66 (4.28) −0.237 0.813 Employment status (%) 175 (73.53) 186 (78.15) 1.387 0.239 History of hypertension (%) 145 (60.92) 85 (35.71) 30.286 < 0.001* History of hyperlipidemia (%) 89 (37.39) 41 (17.23) 24.382 < 0.001* Family history of diabetes mellitus (%) 53 (22.27) 33 (13.87) 5.617 0.017* Degree of education (%) ≤ Junior high school 196 (82.35) 205 (86.13) 1.282 0.258 ≥ Senior high school 42 (17.65) 33 (13.87) Marital status (%) Bachelordom 5 (2.10) 3 (1.26) 0.574 0.750 Get married /shack up 207 (86.97) 207 (87.97) Bereft of one’s spouse/divorce 26 (10.92) 28 (11.76) Physical activity (%) High 48 (20.17) 52 (21.85) 1.659 0.436 Middle 157 (65.97) 162 (68.07) Low 33 (13.87) 24 (10.08) Smoke (%) Yes 71 (29.83) 71 (29.83) 0.000 1.000 No 167 (70.17) 167 (70.17) Drink (%) Yes 66 (27.73) 64 (26.89) 0.042 0.837 No 172 (72.27) 174 (73.12) Note. 1BMI, body mass index; 2WHR, waist-to-hip ratio; 3HDL-C, high-density lipoprotein cholesterol; 4LDL-C, low-density lipoprotein cholesterol. *Statistical significance was attributed as P < 0.05.
下载: 导出CSV
S2. Comparison of the allele frequencies between the case and control groups
dbSNPID Genotypes, n (%) χ2 P MAF (%) HWE-P rs822396 AA GA GG 1.398 0.497 10.50 0.19 Case 194 (81.51) 42 (17.65) 2 (0.84) Control 189 (79.41) 44 (18.49) 5 (2.10) rs822393 CC CT TT 3.710 0.156 37.39 0.50 Case 52 (21.85) 130 (54.62) 56 (23.53) Control 68 (28.57) 111 (46.64) 59 (24.79) rs10937273 AA GA GG 0.254 0.881 39.81 0.59 Case 36 (15.13) 120 (50.42) 82 (34.45) Control 36 (15.13) 115 (48.32) 87 (36.55) rs2236242 AA AT TT 1.261 0.532 27.32 1.00 Case 21 (8.82) 96 (40.33) 120 (50.42) Control 15 (6.30) 95 (39.91) 128 (53.78) rs2211651 GG GT TT 0.990 0.610 27.63 0.26 Case 2 (0.84) 58 (24.37) 178 (74.79) Control 1 (0.42) 66 (27.73) 171 (71.85) rs3790433 CC CT TT 0.668 0.716 12.39 0.88 Case 184 (77.31) 49 (20.58) 5 (2.10) Control 182 (76.47) 53 (22.27) 3 (1.26) rs12037879 AA GA GG 0.650 0.722 20.06 1.00 Case 8 (3.36) 79 (33.19) 151 (63.45) Control 11(4.62) 74 (31.09) 153 (64.29) rs11061971 AA TA TT 1.323 0.516 36.87 0.57 Case 38 (15.97) 103 (43.28) 97 (40.76) Control 30 (12.60) 112 (47.06) 96 (40.34)
下载: 导出CSV
S3. Association of allele frequency with T2DM
SNPID Alleles Case, n (%) Control, n (%) χ2 P OR ( 95% CI) rs822393 C 233 (48.90) 249 (52.30) 1.075 0.299 0.874 (0.678, 1.127) T 243 (51.10) 227 (47.70) rs822396 A 429 (90.10) 423 (88.90) 0.402 0.526 1.142 (0.755, 1.731) G 47 (9.90) 53 (11.10) rs10937273 A 192 (40.30) 187 (39.30) 0.110 0.741 1.045 (0.806, 1.354) G 284 (59.70) 289 (60.70) rs2236242 A 143 (30.00) 124 (26.10) 1.879 0.171 1.219 (0.918, 1.618) T 333 (70.00) 352 (73.90) rs2211651 G 62 (13.00) 69 (14.50) 0.434 0.510 0.883 (0.610, 1.278) T 414 (87.00) 407 (85.50) rs3790433 C 418 (87.80) 417 (87.60) 0.010 0.921 1.020 (0.692, 1.501) T 58 (12.20) 59 (12.40) rs12037879 A 95 (20.00) 95 (20.00) 0.000 1.000 1.000 (0.728, 1.374) G 381 (80.00) 381 (80.00) rs11061971 A 182 (38.20) 172 (36.10) 0.450 0.503 1.094 (0.841, 1.423) T 294 (61.80) 304 (63.90) Note. CI, confidence interval; OR, odds ratio.
下载: 导出CSV
S4. Association of genetic models with T2DM
SNPs Genetic models P OR (95% CI) Adjusted OR (95% CI) rs822396 AA vs. GA+GG 0.563 1.143 (0.726, 1.799) 0.783 (0.506, 1.212) GG vs. GA+AA 0.253 0.395 (0.076, 2.056) 0.823 (0.526, 1.289) rs822393 CC vs. CT+TT 0.091 0.699 (0.461, 1.060) 0.889 (0.551, 1.436) TT vs. CT+CC 0.748 0.934 (0.613, 1.421) 0.441 (0.077, 2.522) rs10937273 AA vs. GA+GG 1.000 1.000 (0.606, 1.651) 0.946 (0.561, 1.594) GG vs. GA+AA 0.632 0.912 (0.627, 1.328) 0.826 (0.556, 1.229) rs2236242 AA vs. AT+TT 0.292 1.445 (0.726, 2.877) 1.639 (0.806, 3.335) TT vs. AT+AA 0.492 0.881 (0.615, 1.264) 0.799 (0.548, 1.167) rs2211651 GG vs. GT+TT 0.562 2.008 (0.181, 22.300) 2.445 (0.218, 27.486) TT vs. GT+GG 0.468 1.162 (0.774, 1.746) 1.066 (0.696, 1.632) rs3790433 CC vs. CT+TT 0.828 1.048 (0.685, 1.606) 1.066 (0.681, 1.669) TT vs. CT+CC 0.476 1.681 (0.397, 7.115) 1.733 (0.381, 7.877) rs12037879 AA vs. GA+GG 0.482 0.718 (0.283, 1.817) 0.533 (0.196, 1.450) GG vs. GA+AA 0.849 0.964 (0.663, 1.402) 0.888 (0.599, 1.315) rs11061971 AA vs. AT+TT 0.295 1.317 (0.786, 2.208) 1.081 (0.628, 1.862) TT vs. AT+AA 0.926 1.018 (0.706, 1.467) 1.074 (0.731, 1.578) Note. Adjusted for BMI; CI, confidence interval; OR, odds ratio.
下载: 导出CSV
S5. Linkage disequilibrium analyses of the eight SNP Loci
SNP D’ r2 rs822396-rs822393 0.968 0.108 rs822396-rs10937273 0.632 0.031 rs822393-rs10937273 0.896 0.520 rs2211651-rs3790433 0.399 0.142 rs2211651-rs12037879 0.424 0.007 rs12037879-rs3790433 1.000 0.036
下载: 导出CSV
Table 2. Gene-environment interaction models
Locus no Best combination Training Bal.Acc Testing Bal.Acc Cross-validation consistency P SNP-SNP interaction rs822393 0.603 0.599 10/10 0.011* rs2236242 rs3790433 0.544 0.539 10/10 0.011* rs11061971 SNP-environment interaction Gene-hypertension interaction rs822393-hypertension 0.618 0.617 9/10 0.001* rs822396-hypertension 0.618 0.618 10/10 0.001* rs2211651-hypertension 0.620 0.615 8/10 0.001* rs3790433-hypertension 0.619 0.609 7/10 0.001* rs12037879-hypertension 0.619 0.609 10/10 0.001* Gene-BMI interaction rs2236242-BMI 0.636 0.602 10/10 0.011* rs822393-BMI 0.640 0.595 7/10 0.011* Gene-WHR interaction rs822396-WHR 0.601 0.593 10/10 0.011* rs2236242-WHR 0.612 0.555 8/10 0.172 Note. *Statistical significance was attributed as P < 0.05.
下载: 导出CSV
-
[1] International Diabetes Federation. IDF diabetes atlas, International Diabetes Federation, 10th edition, 2021. https://diabetesatlas.org/data/en/country/42/cn.html. [2023-09-15 [2] Li YZ, Teng D, Shi XG, et al. Prevalence of diabetes recorded in mainland China using 2018 diagnostic criteria from the American Diabetes Association: national cross sectional study. BMJ, 2020; 369, m997. [3] Vinitha R, Yogalakshmi R, Rajeswari A, et al. Serum and salivary adipokines in type 2 diabetes - Results of a pilot study in India. Diabetes Metab Syndr, 2022; 16, 102536. doi: 10.1016/j.dsx.2022.102536 [4] Picó C, Palou M, Pomar CA, et al. Leptin as a key regulator of the adipose organ. Rev Endocr Metab Disord, 2022; 23, 13−30. doi: 10.1007/s11154-021-09687-5 [5] Li J, Li Q, Zhu YC, et al. Association of vaspin rs2236242 gene variants with type 2 diabetes and obesity in a Chinese population: a prospective, single-center study. J Cell Physiol, 2019; 234, 16097−101. doi: 10.1002/jcp.28267 [6] Ramya K, Ayyappa KA, Ghosh S, et al. Genetic association of ADIPOQ gene variants with type 2 diabetes, obesity and serum adiponectin levels in south Indian population. Gene, 2013; 532, 253−62. doi: 10.1016/j.gene.2013.09.012 [7] Zheng Y, Ley SH, Hu FB. Global aetiology and epidemiology of type 2 diabetes mellitus and its complications. Nat Rev Endocrinol, 2018; 14, 88−98. doi: 10.1038/nrendo.2017.151 [8] Zhao YX, Sun N, Song X, et al. A novel small molecule AdipoR2 agonist ameliorates experimental hepatic steatosis in hamsters and mice. Free Radic Biol Med, 2023; 203, 69−85. doi: 10.1016/j.freeradbiomed.2023.04.001 [9] Pokharel P, Kyrø C, Olsen A, et al. Vegetable, but not potato, intake is associated with a lower risk of type 2 diabetes in the Danish diet, cancer and health cohort. Diabetes Care, 2023; 46, 286−96. doi: 10.2337/dc22-0974 [10] Zhang SM, Stubbendorff A, Olsson K, et al. Adherence to the EAT-Lancet diet, genetic susceptibility, and risk of type 2 diabetes in Swedish adults. Metabolism, 2023; 141, 155401. doi: 10.1016/j.metabol.2023.155401 -
 23178+Supplementary Materials.pdf

-

 点击查看大图
图(2) / 表ll (7)
计量
- 文章访问数: 144
- HTML全文浏览量: 61
- PDF下载量: 12
- 被引次数: 0

 Quick Links