

 下载:
下载:


-
Pneumoconiosis is a group of heterogeneous fibrotic lung diseases caused by inorganic mineral dust and includes coal workers’ pneumoconiosis and silicosis. Silicosis involves diffuse or nodular interstitial pulmonary fibrosis caused by exposure to asbestos or silica dust. China is thought to have the highest number of silicosis cases, with 6,000 new cases reported annually[1]. Currently, the clinical diagnosis and monitoring of silicosis relies mainly on a history of occupational exposure and radiological abnormalities[2]. Therefore, determining further indicators is crucial to reflect the severity of silicosis.
Malnutrition is generally associated with immune dysfunction—inflammatory processes that directly increase the incidence of complications. Nutritional assessment tools such as the Prognostic Nutritional Index (PNI), Nutritional Risk Index (NRI), and Geriatric Nutritional Risk Index have shown promise as prognostic indicators for various diseases. The PNI, calculated using the serum albumin level and total lymphocyte count in the peripheral blood, was originally proposed to assess the perioperative immunonutritional status and surgical risk of patients undergoing gastrointestinal surgery[3]. The severity of silicosis as a chronic wasting disease may also be related to nutritional status. A previous study conducted by the authors of this study showed that neutrophil-to-lymphocyte ratio (NLR) and platelet-to-lymphocyte ratio (PLR) can be used as indicators of inflammatory state and severity in the clinical prognosis of patients with silicosis[4]. Therefore, this study intends to explore the value of PNI in evaluating prognosis in silicosis and efficiently facilitating risk stratification to guide treatment decisions among clinicians.
This was a case-control study of silicosis patients evaluated at the Hunan Prevention and Treatment Institute for Occupational Diseases from January to December 2022. Body mass index (BMI) is the ratio between body weight in kilograms and squared body height in meters (kg/m2). The diagnosis of silicosis was based on the diagnosis of occupational pneumoconiosis (GBZ70-2015)[5]. The diagnostic criteria of silicosis define the stage of silicosis as consistent with the severity of silicosis, with higher staging corresponding to more severe disease. Furthermore, silicosis is divided into three phases: silicosis stages I, II, or III. A total of 166 patients (male) diagnosed with silicosis were included in the study. All patients were coal mine workers in Hunan Province and over 75 years old. Those with lung cancer, pulmonary tuberculosis, pulmonary heart disease, and lung diseases unrelated to silicosis were excluded. The control group included 100 age and sex-matched volunteers without comorbidities who worked in dust-related occupations.
Fasting blood samples were collected from silicosis patients and occupational health examiners in the morning. After, samples underwent 3500 r/min centrifugation for 5 minutes. After separating the serum, the Sysmex XN-2000 Haematology Analyzer (Sysmex, Milton Keynes, UK) measured leukocytes (WBC), mean platelet volume (MPV), neutrophils (N), lymphocytes (L) and platelets (PLT). Total protein (TP) and albumin (ALB) were evaluated using the Hitachi 7600 Automatic Biochemistry Analyzer (Hitachi, Ltd). Pulmonary function tests were performed using the Spirometer MSA99 (M&B Co). The PNI score was calculated using the following formula: serum albumin value [g/L]) + (5 × lymphocyte count [109/L])[3].
Statistical analysis was conducted using an online statistics tool (http://dxonline.deepwise.com/) and R software (Version 4.0.1) with pROC and Rattle package. Multifactor regression analysis was used to screen for risk factors of silicosis. Following the results of multifactor regression, the machine learning method was used to build a column-line model to predict the risk of silicosis. A receiver operating characteristics (ROC) curve was used to evaluate the diagnostic value. A two-tailed P value of less than 0.05 was considered statistically significant[6].
Table 1 describes the clinical and biochemical characteristics of the study participants. No difference was observed in age (P = 0.724) and BMI (P = 0.945) among the four groups. Serum N%, N, L%, L, PLT, TP, ALB, forced vital capacity (FVC), and ratio of forced expiratory flow in 1 second to forced vital capacity (FEV1/FVC) levels differed significantly difference among the four groups (P < 0.001). Meanwhile, the silicosis III group had lower L%, N%, N, PLT, and FVC levels than the silicosis I and control groups. Furthermore, the silicosis II group had lower N%, L, and FEV1/FVC levels than those of the control and lower N%, TP, ALB, and FVC levels compared with those of the silicosis I group. The silicosis I group had lower N%, L%, L, and FEV1/FVC levels compared with those of the control group.
Table 1. Clinical and biochemical characteristics of the study participants
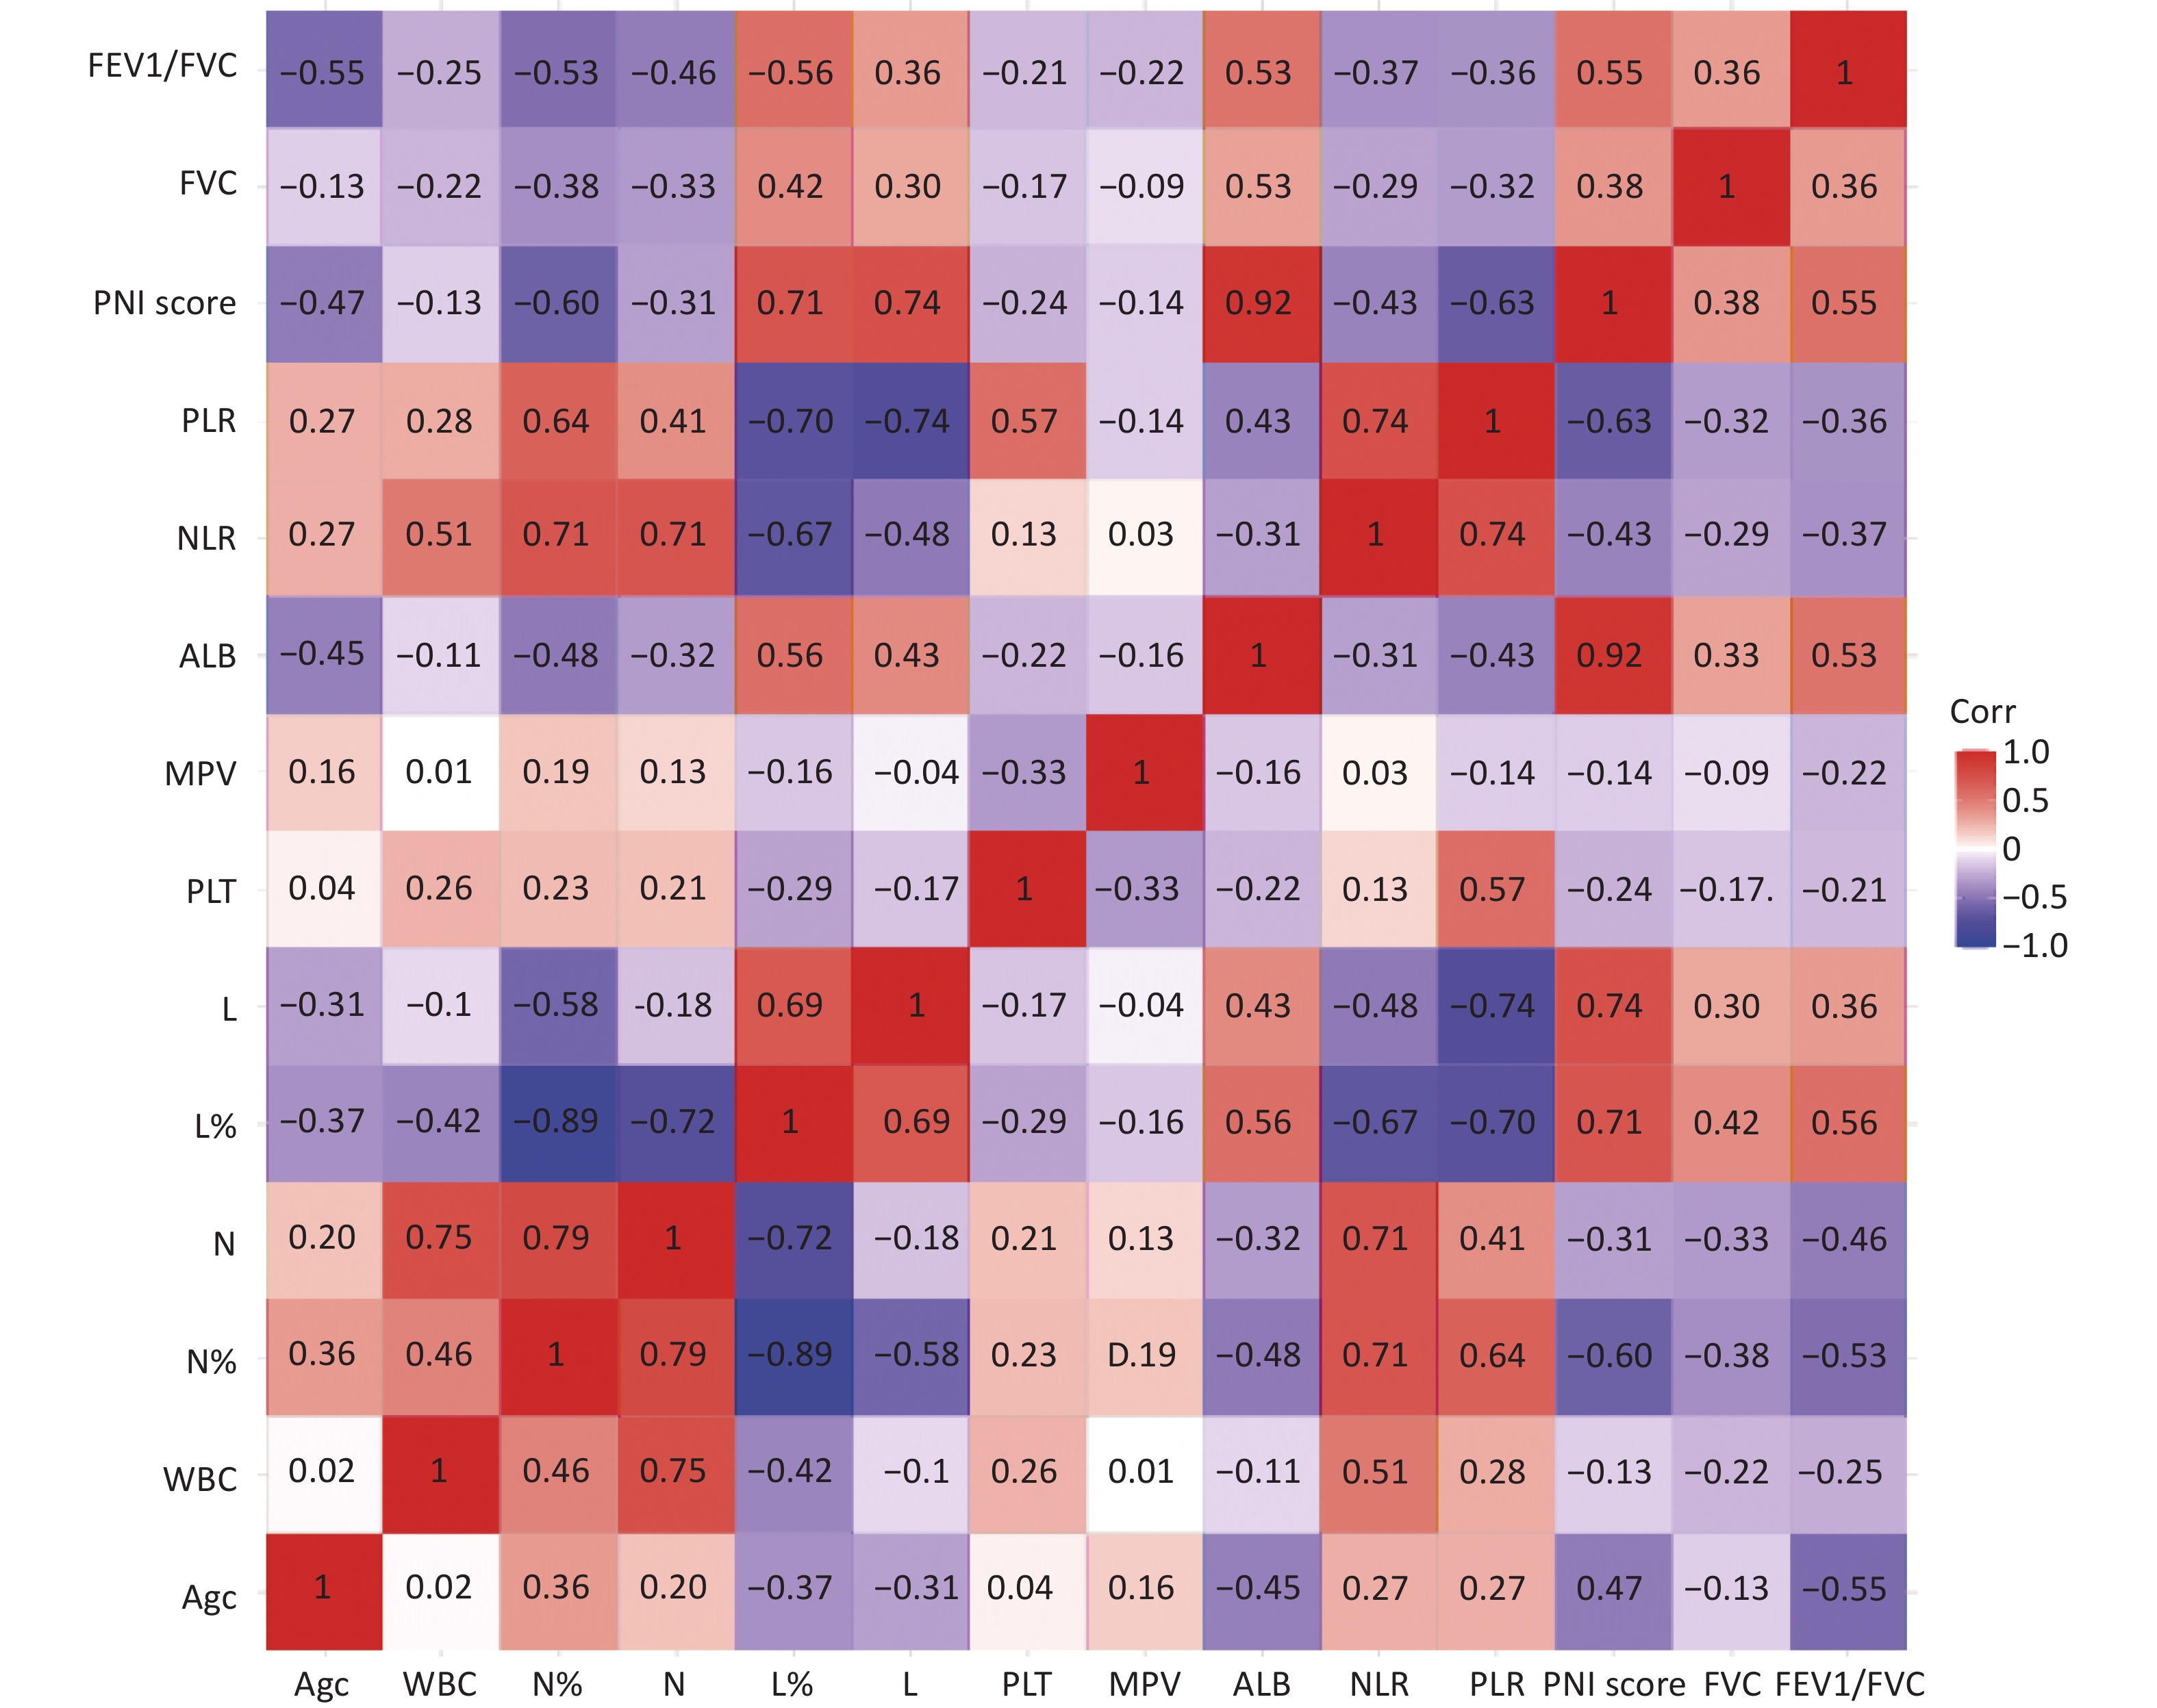
Variables Healthy controls Silicosis I group Silicosis II group Silicosis III group P value Participants, n 100 53 55 58 Age (years) 57 ± 10 58 ± 8 54 ± 13 55 ± 9 0.724 BMI (kg/m2) 21.4 22.4 22.5 22.6 0.945 Time to Diagnosis 11.91 ± 1.91 6.32 ± 2.95 5.61 ± 2.76 bb 0.000 Dust time 20.25 times 18.90 timesbb 17.14 timesbb 0.000 N% 55.25 ± 3.45 62.37 ± 10.54aa 65.94 ± 10.43aab 67.67 ± 11.49aabbcc 0.000 N (109/L) 3.45 ± 0.91 4.17 ± 1.59 4.78 ± 2.50 5.77 ± 3.00aabbcc 0.000 L% 33.86 ± 3.55 27.46 ± 9.38a 22.51 ± 7.51 21.78 ± 9.48aabb 0.000 L (109/L) 2.10 ± 0.51 1.71 ± 0.54aa 1.48 ± 0.46aa 1.65 ± 0.68aa 0.000 PLT (109/L) 222.43 ± 44.37 220.17 ± 55.68 237.04 ± 89.29 272.11 ± 70.35abbc 0.010 ALB (g/L) 47.24 ± 1.87 41.43 ± 4.13 39.15 ± 4.25b 39.82 ± 4.53 0.000 TP (g/L) 67.24 ± 2.87 65.40 ± 5.50 64.49 ± 6.13 b 66.91 ± 7.26 0.000 FVC 86.48 ± 12.04 91.23 ± 25.37 78.70 ± 21.21b 70.56 ± 21.02aabbc 0.000 FEV1/FVC 92.53 ± 7.49 66.40 ± 13.23aa 68.93 ± 15.03aa 62.43 ± 17.80aa 0.000 NLR 1.65 ± 0.17 3.51 ± 1.03 4.10 ± 2.01a 4.91 ± 2.64aab 0.000 PLR 114.89 ± 44.68 144.28 ± 68.88 180.72 ± 71.35a 204.64 ± 61.01aab 0.001 PNI 57.75 ± 3.10 50.00 ± 5.36aa 46.55 ± 5.12aab 48.66 ± 8.39 aa 0.291 COPD, n 0 8 8 29 Hypertension 0 2 1 10 Diabetes 0 6 1 3 Note. Data mean ± SD. N: neutrophil; L: lymphocytes; ALB: albumin; PLT: platelet; TP: total protein, NLR: neutrophil/lymphocyte ratio; PLR: platelet/lymphocyte ratio; PNI: 10 * serum albumin value (g/dL)+ 0.005* peripheral lymphocyte count (/mm3); FVC, forced vital capacity; FEV1/FVC forced expiratory flow in 1 s/ forced vital capacity; COPD, chronic obstructive pulmonary disease. P value comparisons among four groups by one-way ANOVA, avs. Healthy control group, aP < 0.05, aaP < 0.01. bvs. Silicosis stage I phase group, bP < 0.05, bbP < 0.01, cvs. Silicosis stage II group, cP < 0.05, ccP < 0.01. Figure 1 illustrates the correlation of all indicators in this study, focusing on the correlation between the most important nutritional indicator—PNI— and other indicators. PNI was significantly associated with all variables except MPV and is significantly correlated with L, N, and ALB. Meanwhile, PNI negatively correlated with age, WBC, PLT, NLR, and PLR and positively correlated with FVC and FEV1/FVC. These results suggest that nutritional status may be related to silicosis.
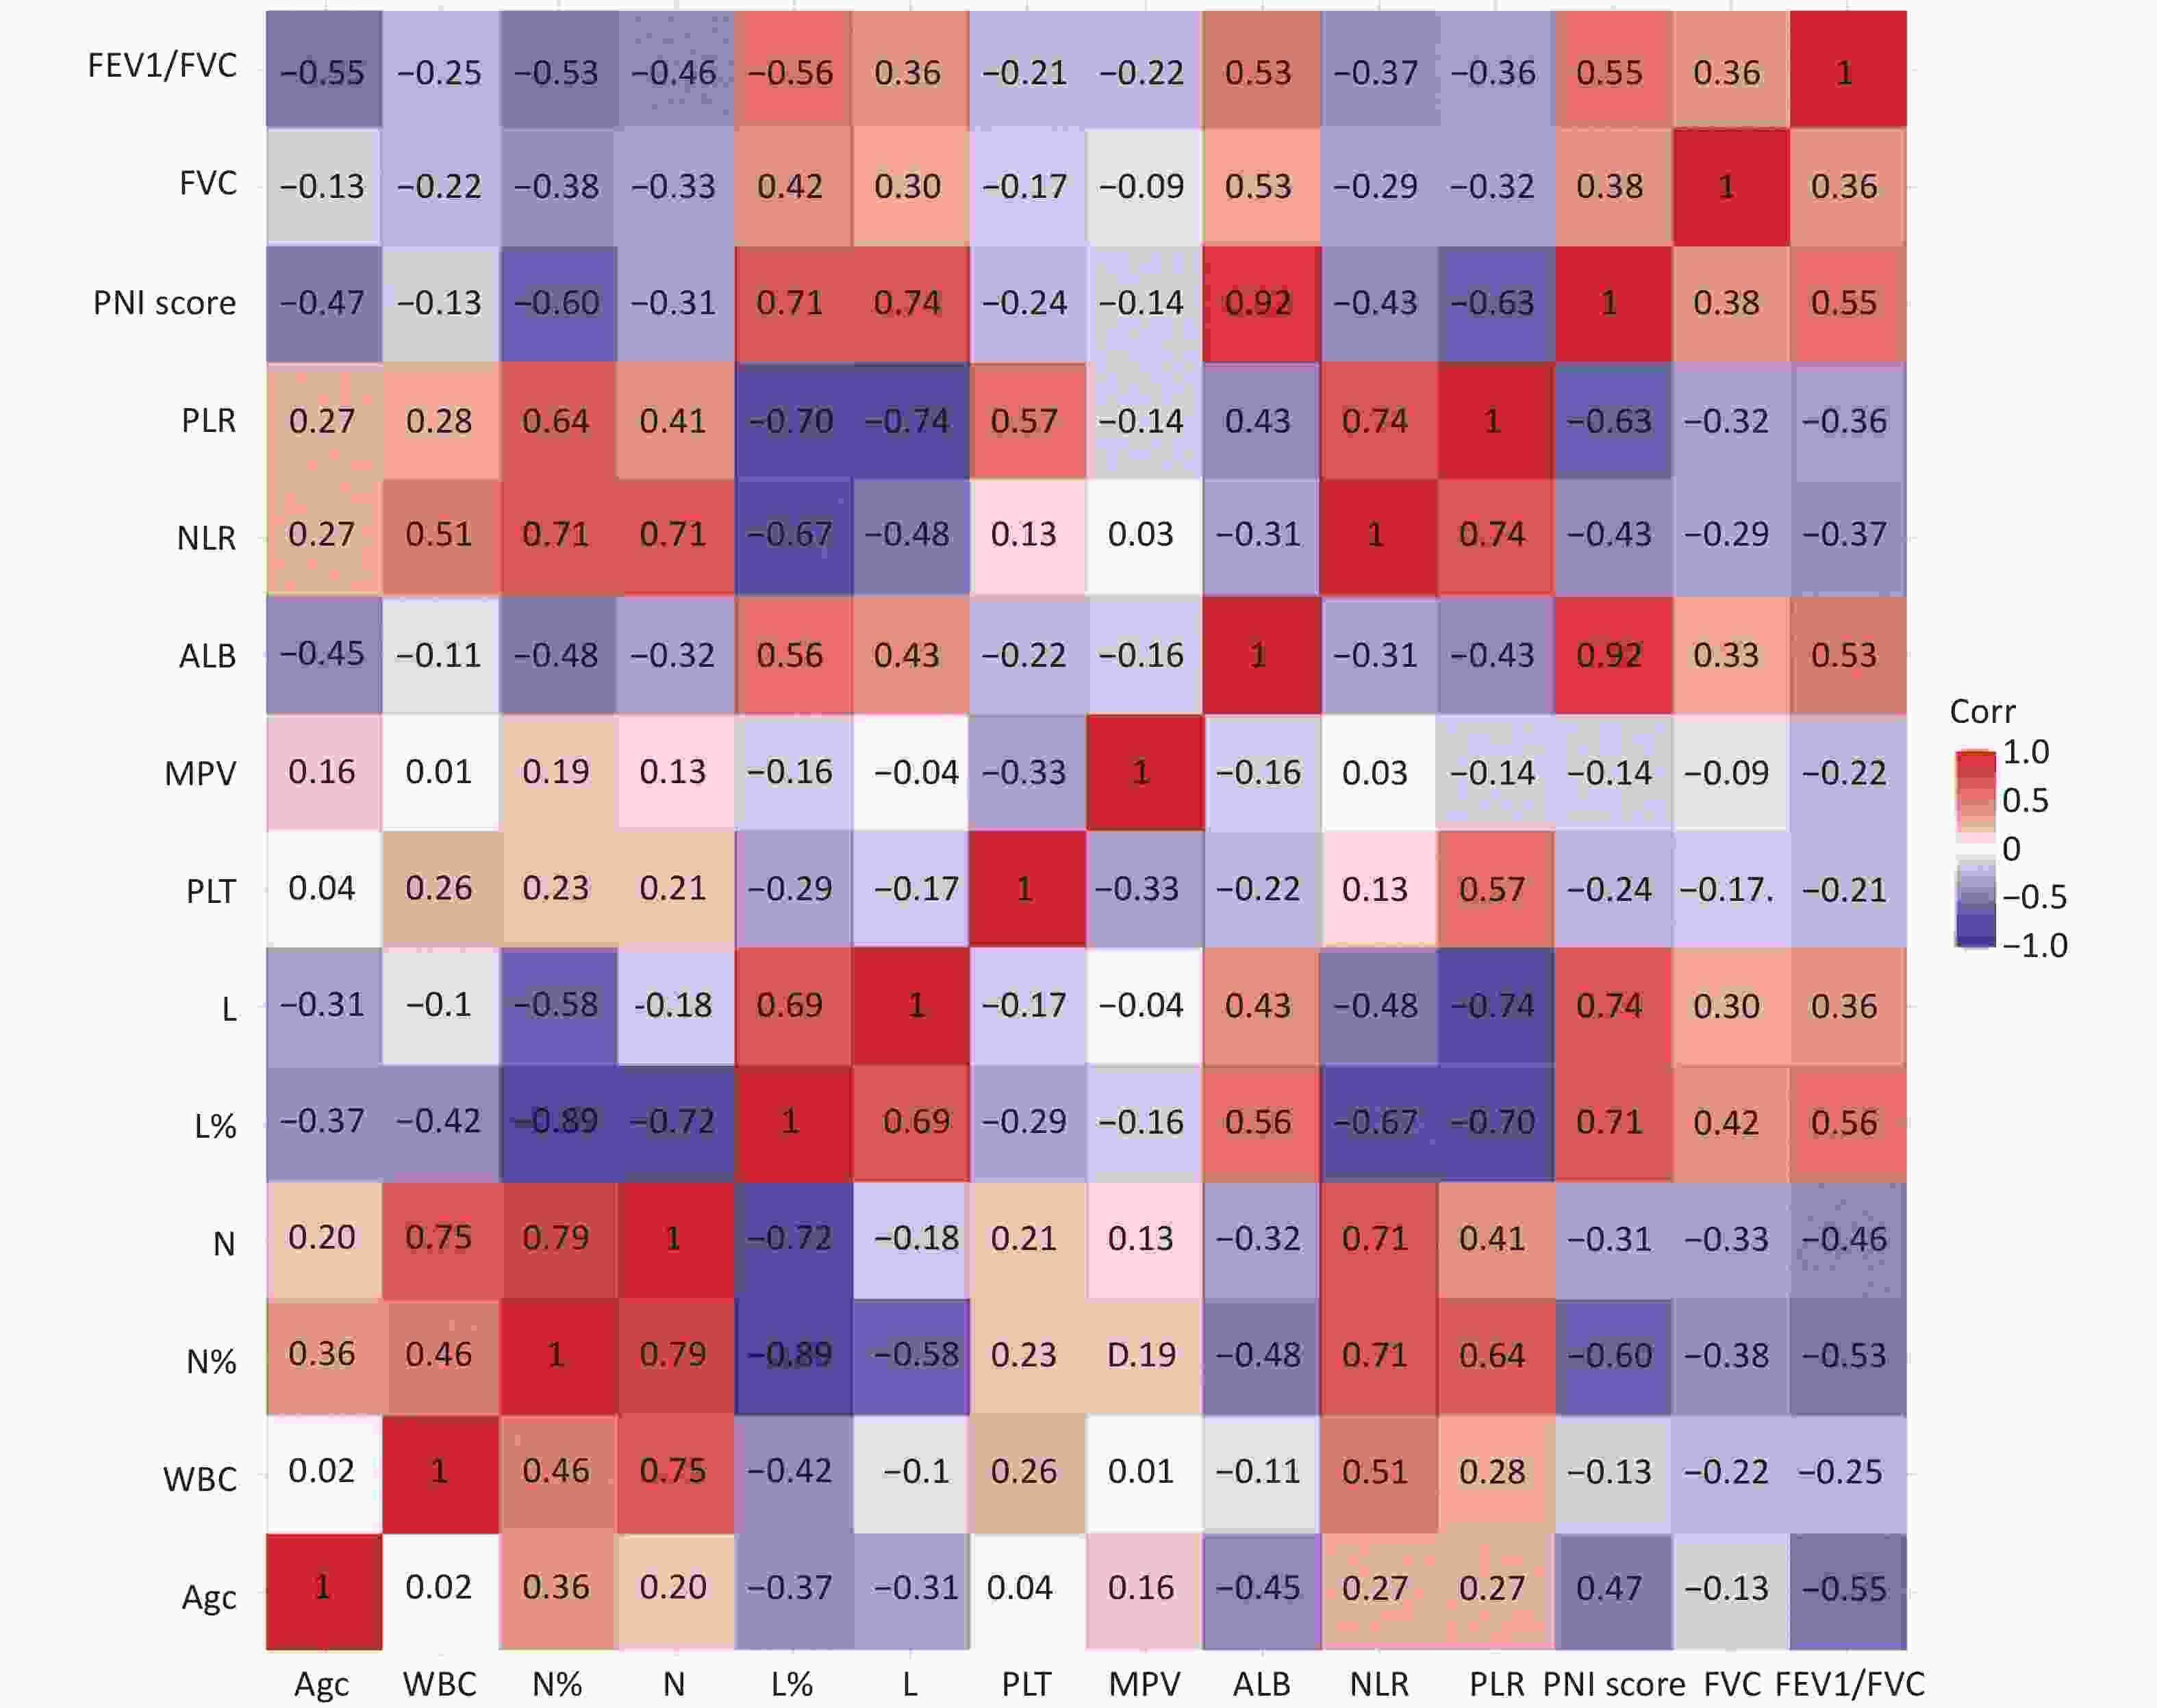
Figure 1. Correlation analysis heat map with differential indicators.
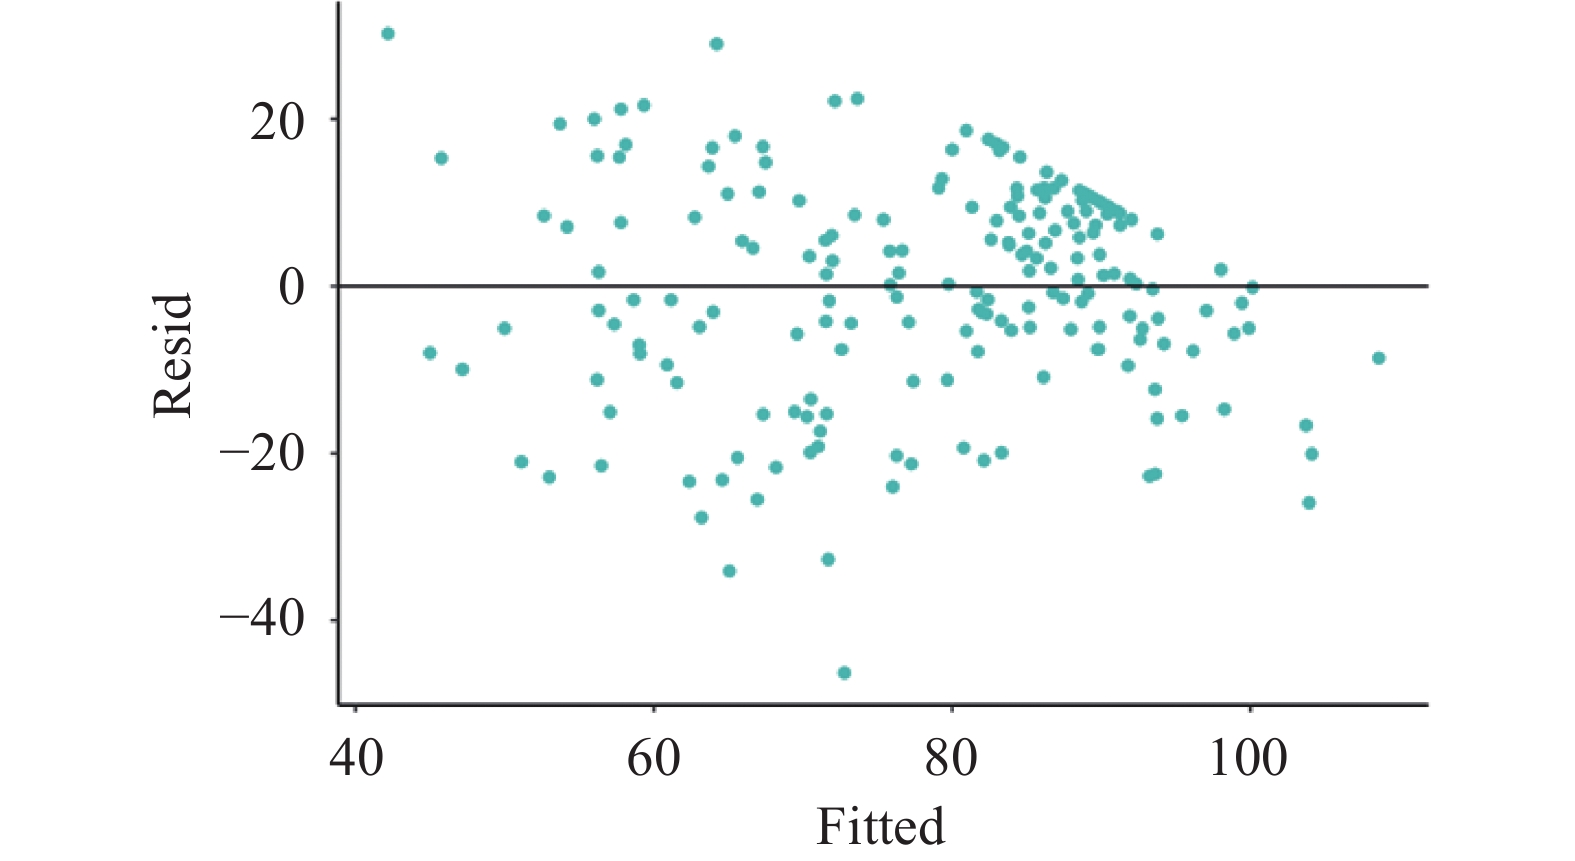
FEV1/FVC, the most important indicator of lung function, was designated the independent variable; other indicators were designated dependent variables during multiple linear regression analysis. As shown in the regression residual scatter plot (Supplementary Figure S1, available in www.besjournal.com) and multiple linear regression of FEV1/FVC (Supplementary Table S1, available in www.besjournal.com), the residuals are randomly distributed near the center line, indicating that the errors are randomly distributed when the regression model is well-fitted. The R2 value of the model was 0.523, indicating that the indicators included in the model accounted for 52.3% of the total influencing factors of FEV1/FVC in patients. As such, PNI and other indicators have a crucial impact on lung function in silicosis patients.
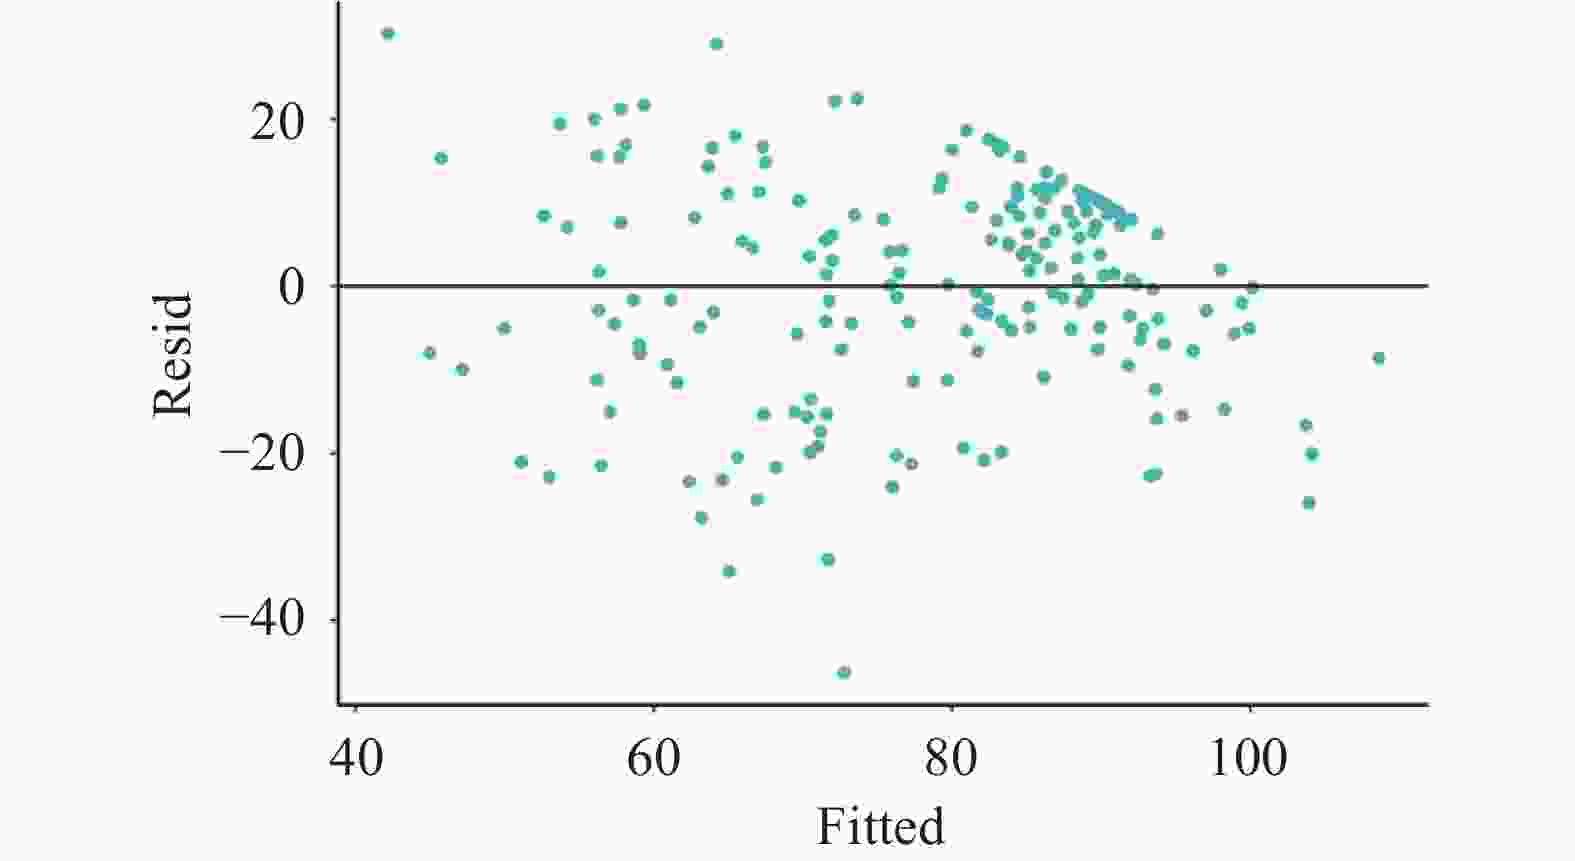
Figure S1. Regression residual scatter plot.
Table S1. Multiple linear regression of FEV1/FVC
Dependent variable Variables coefficient standard coefficient SE St P FEV1/FVC constant 87.096 18.341 4.749 0.000** Age −0.625 −0.34 0.105 −5.951 0.000** L% 0.586 0.274 0.192 3.044 0.003** PLT −0.1 −0.337 0.023 −4.393 0.000** MPV −1.738 −0.122 0.808 −2.152 0.033* NLR −1.353 −0.29 0.454 −2.979 0.003** PLR 0.096 0.484 0.025 3.826 0.000** PNI score 0.719 0.276 0.218 3.293 0.001** Note.*P < 0.05,**P < 0.01. As shown in Supplementary Table S2 (available in www.besjournal.com), a single factor plus multiple factor logistic regression analysis was conducted to screen the risk factors of silicosis, with the disease as the dependent variable and the other variables as the independent variable. The indices with significant differences in the univariate analysis were included in the multivariate analysis. After excluding collinearity, the multivariate regression model showed that the increase in NLR and decrease in FEV1/FVC and PNI scores were independent risk factors for silicosis.
Table S2. Univariate and multifactorial logistic regression analysis of silicosis
Variables Univariate regression Multiple regression W/t P OR OR 95% CI P Age 2174.5 0.000** N% 1,895 0.000** N 2,608 0.000** L% 8,766 0.000** L 6.104 0.000** PLT 3940.5 0.005** MPV 2655.5 0.000** ALB 9562.5 0.000** NLR 1,368 0.000** 7.183 1.191−43.322 0.032* PLR 2,747 0.000** 0.99 0.972−1.007 0.243 PNI score 9,262 0.000** 0.829 0.693−0.992 0.041* FVC 6399.5 0.002** FEV1/FVC 9,737 0.000** 0.806 0.741−0.877 0.00** Note. *P < 0.05,**P < 0.01. Based on the indicators screened by multivariate analysis, a warning model was established through machine learning. The probability of PNI, PLR, NLR, and FEV1/FVC were estimated using the nomogram (Supplementary Figure S2, available in www.besjournal.com). The clinical indicators were located on each variable axis, and a vertical line was drawn from that value to the top point scale to calculate the score for each predictor. The AUC of the warning model was 0.980. The area under the ROC curve of NLR, PLR, FEV1/FVC, and PNI for silicosis were 0.866, 0.731, 0.955, and 0.908, respectively (Figure 2). In summary, PNI combined with PLR, NLR, and FEV1/FVC is a better model for predicting the risk of silicosis.
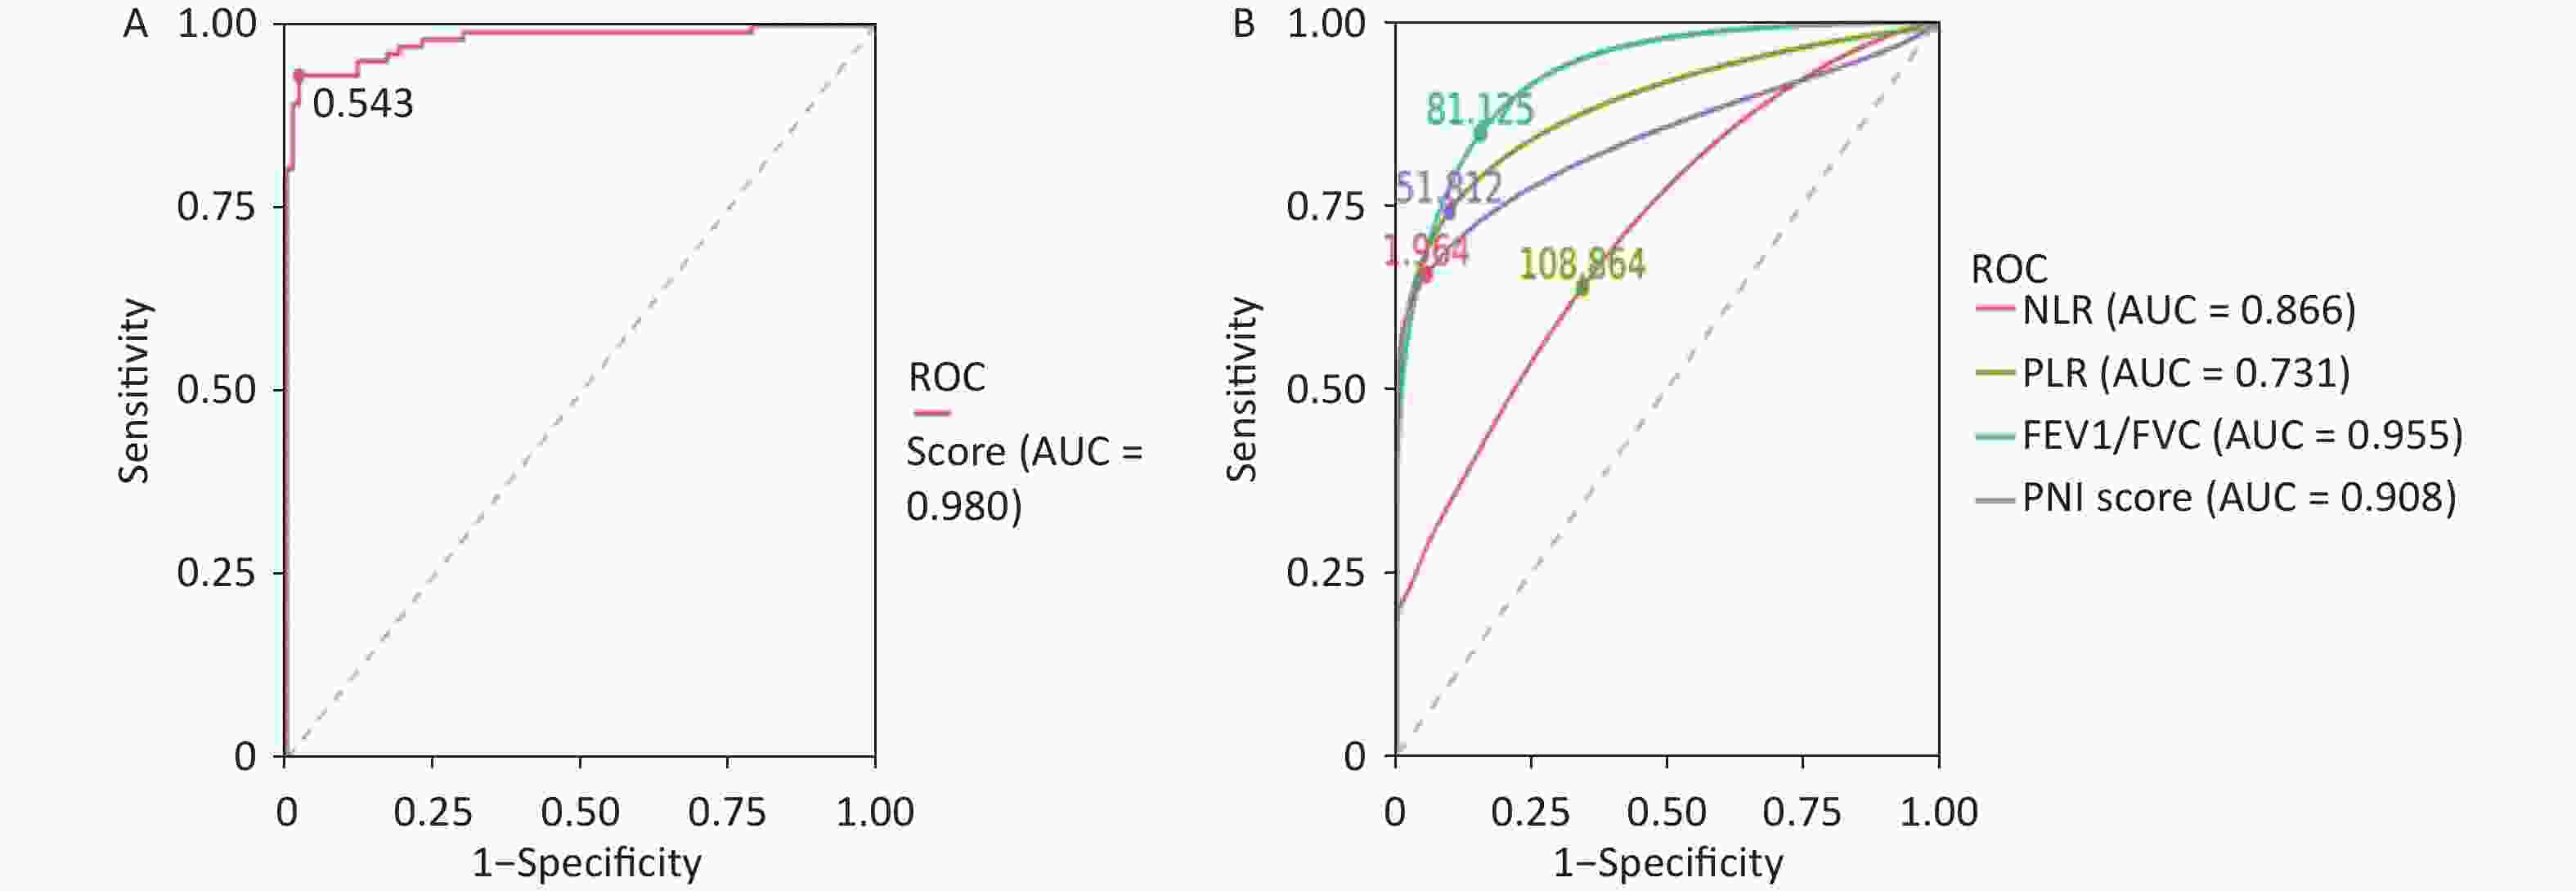
Figure 2. ROC curve of multivariate joint prediction of silicosis (A) and NLR, PLR, FEV1/FVC, and PNI evaluating disease activity in patients with silicosis (B), respectively.
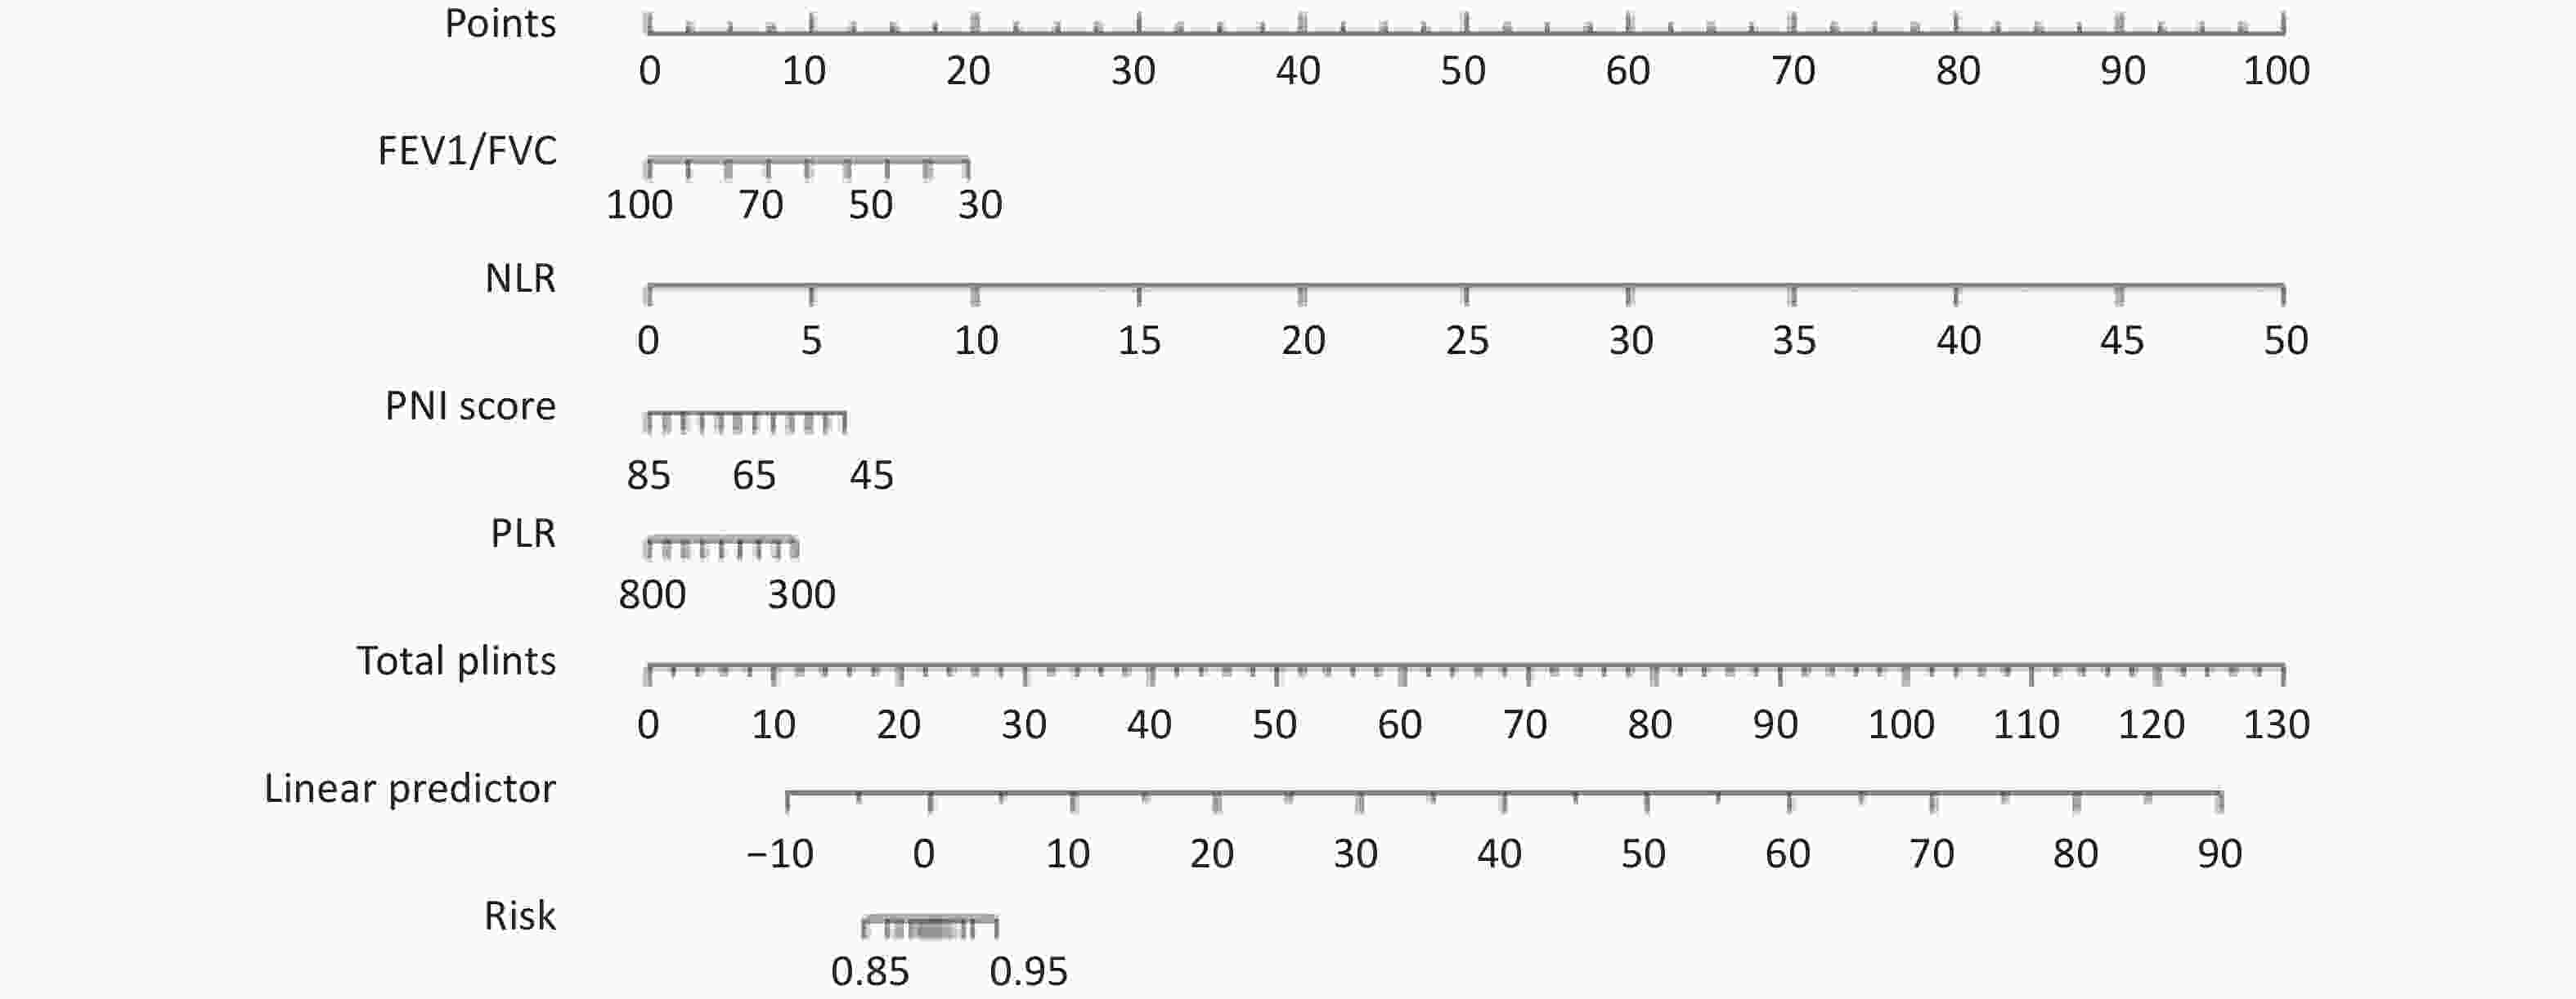
Figure S2. Nomogram of the warning model.
Silicosis is a chronic, progressive, incurable lung disease characterized by the accumulation of fibroblasts and chronic inflammation. NLR and PLR have been consistently validated worldwide as measures of the inflammatory response[7]. This study revealed the characteristics of PNI and other common clinical inflammatory indicators in silicosis patients.
In this study, the levels of L%, L, ALB, FVC, and FEV1/FVC in silicosis patients were significantly lower than in the control group (P < 0.05), suggesting that silicosis is a chronic wasting disease. Further, the lung function of silicosis patients is worse than those in the control group. This is consistent with previous results of the authors of this study[4]. Further correlation analysis revealed that PNI was significantly associated with all variables except MPV. PNI is significantly correlated with L, N, and ALB; it is negatively correlated with age, WBC, PLT, NLR, and PLR and positively correlated with FVC and FEV1/ FVC. These results suggest that nutritional status may be related to silicosis. Further, multiple linear regression analysis revealed that PNI and other indicators have a more substantial impact on lung function in silicosis patients. The multivariate regression model showed that the increase in NLR and the decrease in FEV1/FVC and PNI scores were independent risk factors for silicosis. A warning model relying on machine learning suggests that PNI combined with other clinical indicators is a better model for predicting the risk of silicosis.
The role of PNI as an indicator of disease is consistent with the results of many studies[8-9]. In clinical work, judging the severity of disease in silicosis patients is comprehensive and complex. Silicosis is a chronic wasting disease caused by long-term exposure to dust. PNI as an indicator to evaluate the degree of nutrition can be a good assessment of the severity of silicosis.
In summary, PNI can be used as an indicator of clinical prognosis and severity of silicosis patients.
doi: 10.3967/bes2024.012
Prognostic Nutritional Index Associates with the Severity of Silicosis: A Study from a Tertiary Class A Prevention and Treatment Institute for Occupational Diseases in China
-
HE La Gu designed the study and wrote the manuscript. LIANG Yun Lai examined the data and revised the manuscript. YANG Lu Qi collected and analyzed the data. YUAN Hua Min supervised the participants and revised the manuscript.
The authors declare no conflict of interest.
&These authors contributed equally to this work.
注释:1) Author Contributiom: 2) Conflict of Interest: -
Figure 2. ROC curve of multivariate joint prediction of silicosis (A) and NLR, PLR, FEV1/FVC, and PNI evaluating disease activity in patients with silicosis (B), respectively.
Table 1. Clinical and biochemical characteristics of the study participants
Variables Healthy controls Silicosis I group Silicosis II group Silicosis III group P value Participants, n 100 53 55 58 Age (years) 57 ± 10 58 ± 8 54 ± 13 55 ± 9 0.724 BMI (kg/m2) 21.4 22.4 22.5 22.6 0.945 Time to Diagnosis 11.91 ± 1.91 6.32 ± 2.95 5.61 ± 2.76 bb 0.000 Dust time 20.25 times 18.90 timesbb 17.14 timesbb 0.000 N% 55.25 ± 3.45 62.37 ± 10.54aa 65.94 ± 10.43aab 67.67 ± 11.49aabbcc 0.000 N (109/L) 3.45 ± 0.91 4.17 ± 1.59 4.78 ± 2.50 5.77 ± 3.00aabbcc 0.000 L% 33.86 ± 3.55 27.46 ± 9.38a 22.51 ± 7.51 21.78 ± 9.48aabb 0.000 L (109/L) 2.10 ± 0.51 1.71 ± 0.54aa 1.48 ± 0.46aa 1.65 ± 0.68aa 0.000 PLT (109/L) 222.43 ± 44.37 220.17 ± 55.68 237.04 ± 89.29 272.11 ± 70.35abbc 0.010 ALB (g/L) 47.24 ± 1.87 41.43 ± 4.13 39.15 ± 4.25b 39.82 ± 4.53 0.000 TP (g/L) 67.24 ± 2.87 65.40 ± 5.50 64.49 ± 6.13 b 66.91 ± 7.26 0.000 FVC 86.48 ± 12.04 91.23 ± 25.37 78.70 ± 21.21b 70.56 ± 21.02aabbc 0.000 FEV1/FVC 92.53 ± 7.49 66.40 ± 13.23aa 68.93 ± 15.03aa 62.43 ± 17.80aa 0.000 NLR 1.65 ± 0.17 3.51 ± 1.03 4.10 ± 2.01a 4.91 ± 2.64aab 0.000 PLR 114.89 ± 44.68 144.28 ± 68.88 180.72 ± 71.35a 204.64 ± 61.01aab 0.001 PNI 57.75 ± 3.10 50.00 ± 5.36aa 46.55 ± 5.12aab 48.66 ± 8.39 aa 0.291 COPD, n 0 8 8 29 Hypertension 0 2 1 10 Diabetes 0 6 1 3 Note. Data mean ± SD. N: neutrophil; L: lymphocytes; ALB: albumin; PLT: platelet; TP: total protein, NLR: neutrophil/lymphocyte ratio; PLR: platelet/lymphocyte ratio; PNI: 10 * serum albumin value (g/dL)+ 0.005* peripheral lymphocyte count (/mm3); FVC, forced vital capacity; FEV1/FVC forced expiratory flow in 1 s/ forced vital capacity; COPD, chronic obstructive pulmonary disease. P value comparisons among four groups by one-way ANOVA, avs. Healthy control group, aP < 0.05, aaP < 0.01. bvs. Silicosis stage I phase group, bP < 0.05, bbP < 0.01, cvs. Silicosis stage II group, cP < 0.05, ccP < 0.01.  下载: 导出CSV
S1. Multiple linear regression of FEV1/FVC
Dependent variable Variables coefficient standard coefficient SE St P FEV1/FVC constant 87.096 18.341 4.749 0.000** Age −0.625 −0.34 0.105 −5.951 0.000** L% 0.586 0.274 0.192 3.044 0.003** PLT −0.1 −0.337 0.023 −4.393 0.000** MPV −1.738 −0.122 0.808 −2.152 0.033* NLR −1.353 −0.29 0.454 −2.979 0.003** PLR 0.096 0.484 0.025 3.826 0.000** PNI score 0.719 0.276 0.218 3.293 0.001** Note.*P < 0.05,**P < 0.01.
下载: 导出CSV
S2. Univariate and multifactorial logistic regression analysis of silicosis
Variables Univariate regression Multiple regression W/t P OR OR 95% CI P Age 2174.5 0.000** N% 1,895 0.000** N 2,608 0.000** L% 8,766 0.000** L 6.104 0.000** PLT 3940.5 0.005** MPV 2655.5 0.000** ALB 9562.5 0.000** NLR 1,368 0.000** 7.183 1.191−43.322 0.032* PLR 2,747 0.000** 0.99 0.972−1.007 0.243 PNI score 9,262 0.000** 0.829 0.693−0.992 0.041* FVC 6399.5 0.002** FEV1/FVC 9,737 0.000** 0.806 0.741−0.877 0.00** Note. *P < 0.05,**P < 0.01.
下载: 导出CSV
-
[1] Rees D, Murray J. Silica. In: Taylor A N, Cullinan P, Blanc P, et al. Parkes’ Occupational Lung Disorders. 4th ed. CRC Press. 2016, 187-205. [2] Castranova V, Vallyathan V. Silicosis and coal workers’ pneumoconiosis. Environ Health Perspect, 2000; 108, 675−84. [3] Nozoe T, Kohno M, Iguchi T, et al. The prognostic nutritional index can be a prognostic indicator in colorectal carcinoma. Surg Today, 2012; 42, 532−5. doi: 10.1007/s00595-011-0061-0 [4] He LG, Wu PF, Peng YH, et al. Modified Glasgow prognostic score, and neutrophil/lymphocyte and platelet/lymphocyte ratios in different stages of silicosis. Biomed Environ Sci, 2019; 32, 376−9. [5] National Health and Family Planning Commission of PRC. Diagnosis of occupational pneumoconiosis (GBZ 70-2015). 2016. (In Chinese [6] Cham S, Chen L, St. Clair CM, et al. Development and validation of a risk-calculator for adverse perioperative outcomes for women with ovarian cancer. Am J Obstet Gynecol, 2019; 220, 571.e1−8. doi: 10.1016/j.ajog.2019.02.019 [7] Mayne KJ, Lees JS, Rutherford E, et al. Neutrophil-to-lymphocyte and platelet-to-lymphocyte ratios: associations with mortality in a haemodialysis cohort. Clin Kidney J, 2022; 16, 512−20. [8] Arslan B, Kinik AH, Gonultas S, et al. Predictive value of Controlling Nutritional Status score and Prognostic Nutritional Index for systemic inflammatory response syndrome/sepsis after percutaneous nephrolithotomy. Int Urol Nephrol, 2023; 55, 1101−7. doi: 10.1007/s11255-023-03559-4 [9] Wang HB, Xu XT, Tian MX, et al. Prognostic values of the prognostic nutritional index, geriatric nutritional risk index, and systemic inflammatory indexes in patients with stage IIB-III cervical cancer receiving radiotherapy. Front Nutr, 2023; 10, 1000326. doi: 10.3389/fnut.2023.1000326 -
 23234+Supplementary Materials.pdf

-

 点击查看大图
图(4) / 表ll (3)
计量
- 文章访问数: 93
- HTML全文浏览量: 39
- PDF下载量: 8
- 被引次数: 0

 Quick Links