

 下载:
下载:


-
Occupational exposure to organic solvents and the resulting health damage caused by organic solvent-induced occupational diseases (OSODs) have raised concern[1], as they have accounted for more than 70% of occupational-poisoning cases in Guangdong province[2,3]. However, there have been limited longitudinal studies examining OSOD patterns and temporal trends with a large sample in Guangdong. Therefore, we initially performed this study using the National Occupational Disease and Occupational Health Information Monitoring System (NODOHIMS) [4] to explore the patterns and temporal trends in major OSODs in Guangdong from 2006 to 2015. Whereas our study provided valuable information for the control and prevention of OSODs in Guangdong province, it also provided a reference for the prevention and control of occupational organic solvent hazards in developing countries at the stage of rapid industrialization.
Information on OSOD cases from 2006 to 2015 in Guangdong province was obtained from the NODOHIMS. Occupational disease cases were confirmed by state-authorized diagnostic institutes for occupational diseases, gathered through the hierarchies of occupational health authorities in the reporting system, and finally compiled by the Chinese Centre for Disease Control and Prevention (CDC). Occupational diseases were classified based on the List of Occupational Diseases of China. We studied the development of occupational diseases by analyzing changes in case numbers, the distribution of cases between industrial sectors, vulnerable work populations, enterprises with high risks, and major hazardous factors.
A descriptive analysis was performed to explore the characteristics of the OSODs reported in Guangdong from 2006 to 2015, including annual changes in reported occupational disease cases, distribution of disease categories, regional distribution, average working age of onset, and the overall annual change in trend of onset age. Moreover, a linear trend test was conducted for the number of cases, median working age of onset, and median age of onset with the curve fit method, using the diagnosis year as the independent variable. A trend test was conducted using the Chi-square test for the distribution of major OSODs according to industry type, ownership type, and enterprise scale. All data cleaning and analyses were conducted using SPSS 20.0 software (SPSS lnc., Chicago, IL, USA).
The annual trends of the 7 major OSODs in Guangdong are shown in Table 1. The minimum number of OSOD cases was 65 in 2007, while the maximum was 205 in 2012; the annual trends in the number of cases of the 7 major OSODs did not show statistical significance (P > 0.05). Benzolism and benzene-induced leukemia accounted for 63.9% of all cases. The fitted trend curve of benzolism and benzene-induced leukemia from 2006 to 2015 exhibited an exponential increase in new cases (R2 = 0.663 and 0.706, respectively; P < 0.01). However, annual trends in the numbers of OSOD cases did not show statistical significance.
Table 1. Annual trends for new cases of OSODs in Guangdong province, 2006–2015, n (%)
OSODs 2006 2007 2008 2009 2010 2011 2012 2013 2014 2015 Total Benzolism 38
(6.4)40
(6.8)26
(4.4)41
(6.9)50
(8.4)65
(11.0)76
(12.8)72
(12.2)121
(20.4)63
(10.6)592
(100.0)Benzene-induced leukemia 2
(0.9)6
(2.6)6
(2.6)12
(5.2)34
(14.7)43
(18.5)36
(15.5)23
(9.9)39
(16.8)31
(13.4)232
(100.0)N-hexane poisoning 26
(12.6)5
(2.4)32
(15.5)0
(0.0)44
(21.4)10
(4.9)48
(23.3)11
(5.3)23
(11.2)7
(3.4)206
(100.0)Trichloroethylene-induced
medicamentosa-like dermatitis23
(24.5)5
(5.3)6
(6.4)2
(2.1)9
(9.6)8
(8.5)2
(2.1)12
(12.8)14
(14.9)13
(13.8)94
(100.0)1,2-michloroethane poisoning 0
(0.0)0
(0.0)0
(0.0)5
(7.7)12
(18.5)12
(18.5)34
(52.3)1
(1.5)1
(1.5)0
(0.0)65
(100.0)Trichloromethane poisoning 1
(1.9)5
(9.6)0
(0.0)31
(59.6)3
(5.8)2
(3.8)9
(17.3)1
(1.9)0
(0.0)0
(0.0)52.0
(100.0)Dimethyl formamide
poisoning36
(73.5)4
(8.2)0
(0.0)1
(2.0)1
(2.0)3
(6.1)0
(0.0)0
(0.0)2
(4.1)2
(4.1)49
(100.0)Total 126
(9.8)65
(5.0)70
(5.4)92
(7.1)153
(11.9)143
(11.1)205
(15.9)120
(9.3)200
(15.5)116
(9.0)1,290
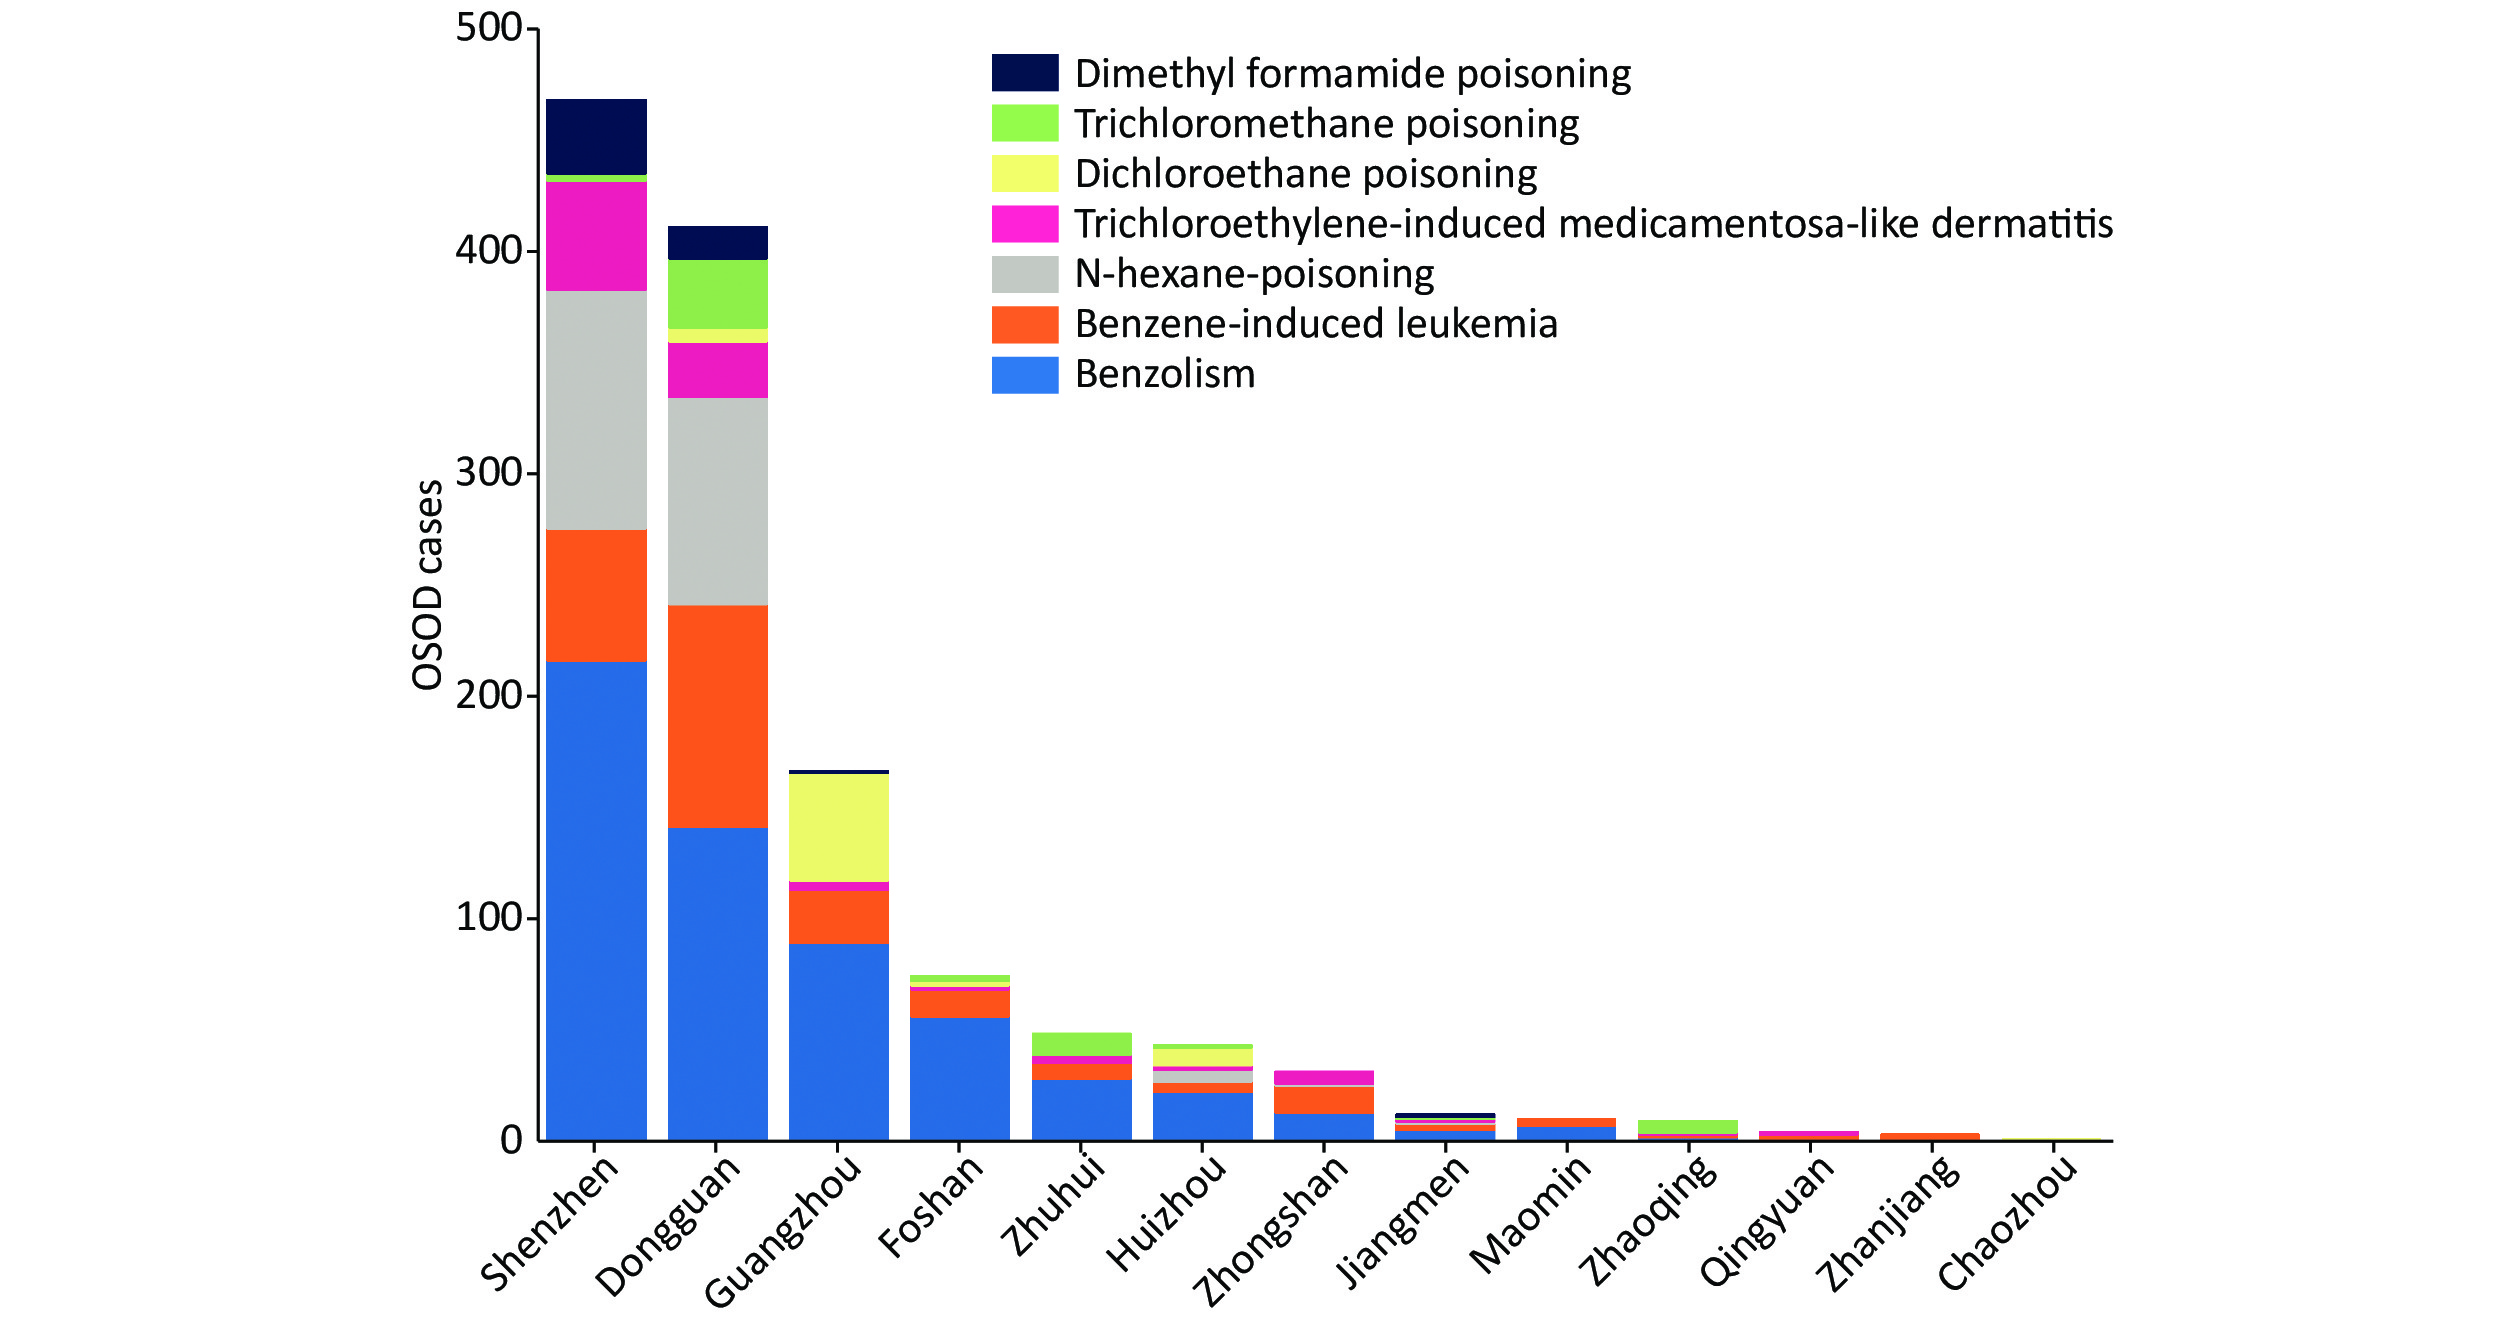
(100.0)Note. OSODs, organic solvent-induced occupational diseases. As shown in Figure 1, the three cities reporting the highest number of OSOD cases were Shenzhen (36.3%), Dongguan (31.9%), and Guanghzhou (12.9%). Heyuan, Meizhou, Shantou, Shanwei, Shaoguan, Yangjiang, and Yunfu reported no OSOD cases. Benzolism and benzene-induced leukemia were predominantly distributed in the three cities of Shenzhen, Dongguan, and Guangzhou. There were slightly more males than females with regard to sex distribution, while fewer males experienced n-hexane poisoning than females did (47 cases vs. 159 cases) (Supplementary Figure S1 available in www.besjournal.com).
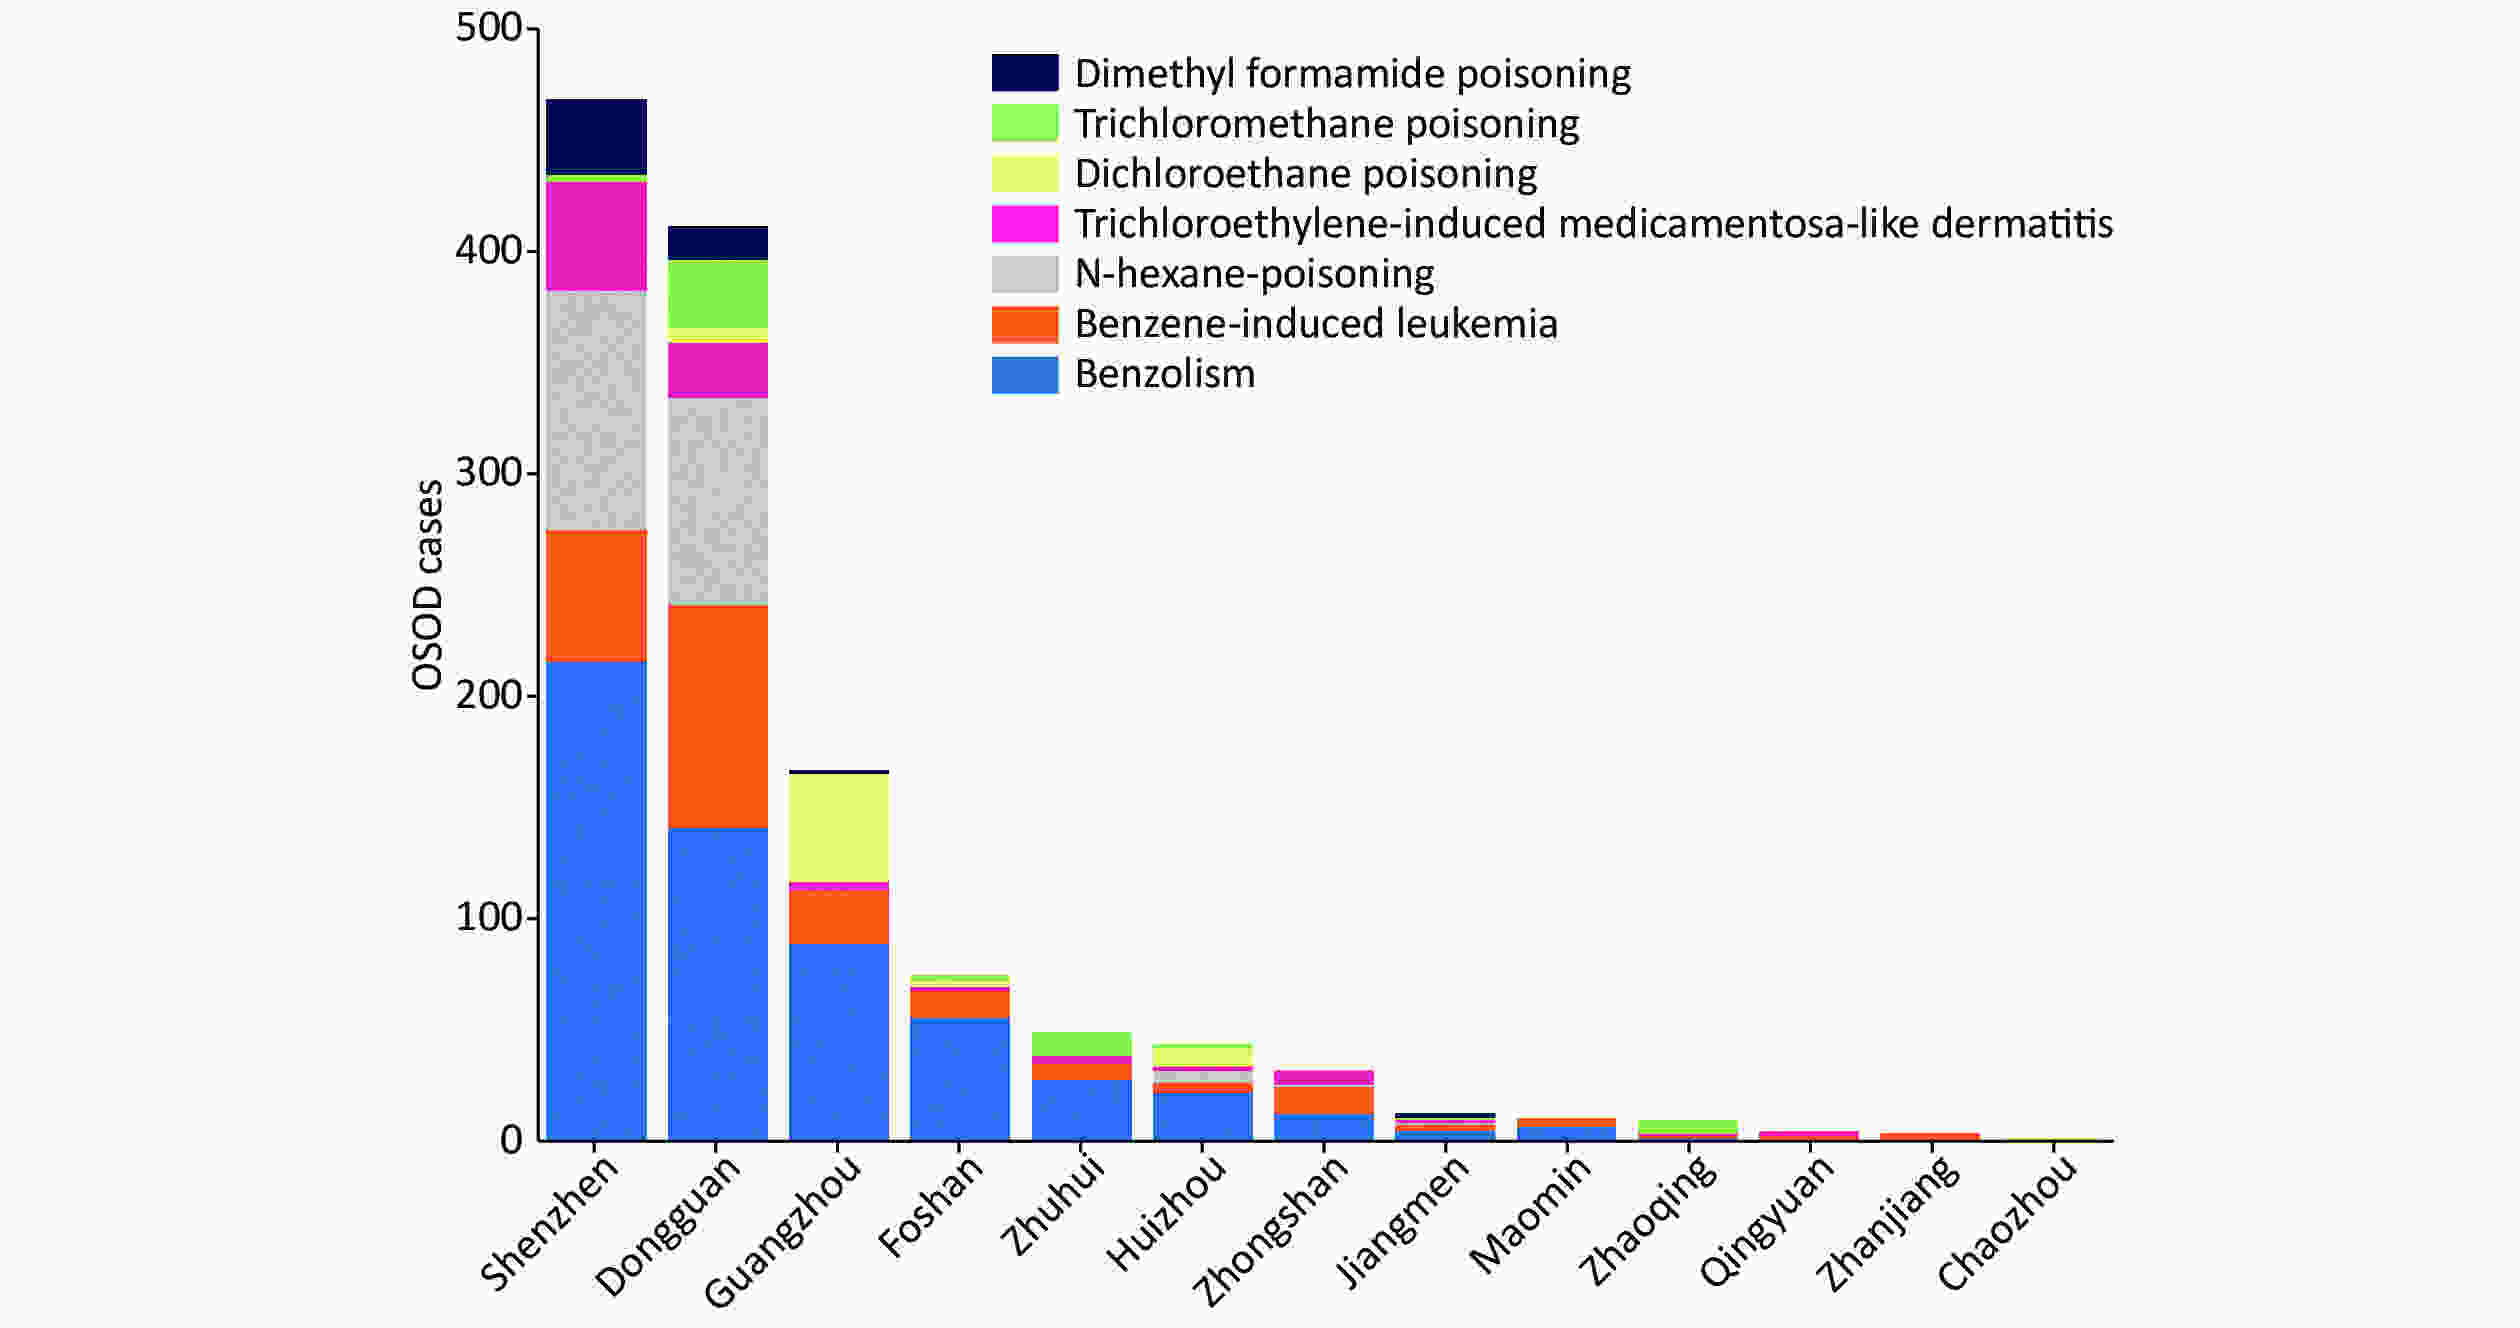
Figure 1. Distribution of the 7 major OSODs in the cities of Guangdong province, China, 2006–2015
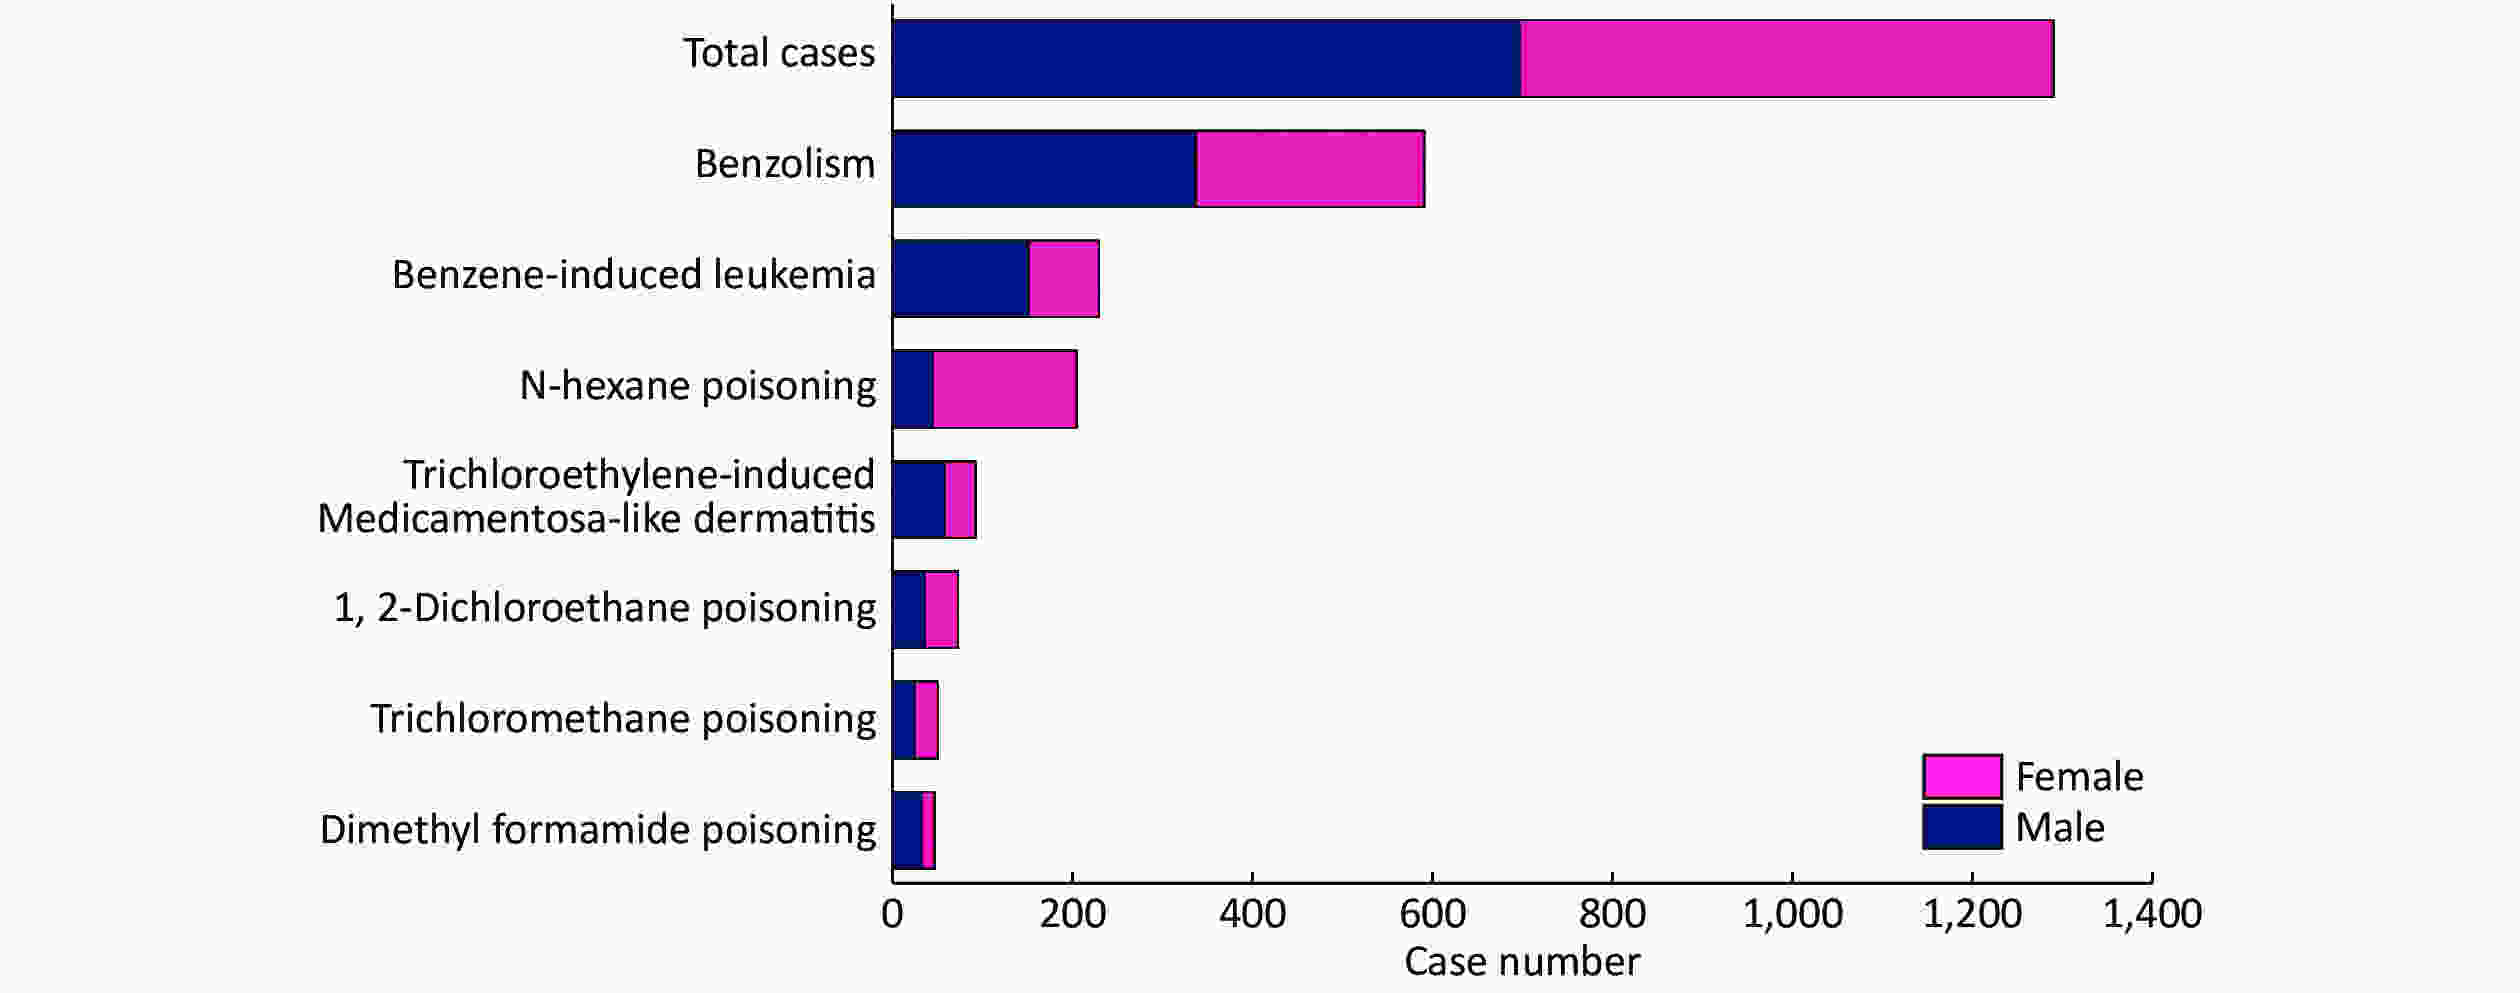
Figure S1. Sex Distribution of 7 Major OSODs in Guangdong Province, China, 2006−2015
As shown in Tables 2–3, most OSOD cases were distributed in the light (260 cases, 43.9%) and electronic (46 cases, 48.9%) industries. Whereas trichloromethane poisoning and trichloroethylene-induced medicamentosa-like dermatitis were predominantly distributed in the electronics industry, other OSODs were mainly distributed in the light industry. In terms of economy/owenership type, most OSOD cases were reported in privately owned (638 cases, 49.5%) and Hong Kong-Macao-Taiwan-owned (319 cases, 24.7%) enterprises, while benzolism cases were predominantly distributed in foreign-funded enterprises (200 cases, 33.8%). In terms of the enterprise scale, a relatively large proportion of OSOD cases were distributed in small-sized (220 cases, 37.2%) and medium-sized (172 cases, 29.1%) enterprises. However, trichloromethane poisoning cases were predominantly distributed in large enterprises (30 cases, 57.7%).
Table 2. Distribution of the 7 major OSODs according to economy/ownership type, n (%)
OSODs Total Ownership type* A B C D E Benzolism 592 200 (33.8) 177 (29.9) 6 (1.0) 29 (4.9) 180 (30.4) Benzene-induced leukemia 232 45 (19.4) 90 (38.8) 12 (5.2) 14 (6.0) 71 (30.6) N-hexane poisoning 206 2 (1.0) 153 (74.3) 4 (1.9) 1 (0.5) 46 (22.3) Trichloroethylene-induced
medicamentosa-like dermatitis94 6 (6.4) 67 (71.3) 7 (7.4) 1 (1.1) 13 (13.8) 1,2 dichloroethane poisoning 65 − 64 (98.5) − − 1 (1.5) Trichloromethane poisoning 52 3 (5.8) 47 (90.4) − − 2 (3.8) Dimethyl formamide poisoning 49 2 (4.1) 40 (81.6) 1 (2.0) − 6 (12.2) Total 1,290 258 (20.0) 638 (49.5) 30 (2.3) 45 (3.5) 319 (24.7) Note. *A, B, C, D, and E represent ‘Foreign-Funded Economy’, ‘Private Economy’, ‘Collective Economy’, ‘State-owned Economy’, and ‘Hong Kong/Macao/Taiwan Economy’, respectively. Table 3. Distribution of the 7 major OSODs according to industry type and enterprise scale, n (%)
OSODs Industry* Enterprise scale& A B C D E F G a b c d e Benzolism 80
(13.5)75
(12.7)49
(8.3)0
(0.0)21
(3.5)260
(43.9)107
(18.1)126
(21.3)220
(37.2)172
(29.1)2
(0.3)72
(12.2)Benzene-induced leukemia 33
(14.2)41
(17.7)23
(9.9)2
(0.9)4
(1.7)86
(37.1)43
(18.5)52
(22.4)77
(33.2)81
(34.9)1
(0.4)21
(9.1)N-hexane poisoning 122
(59.2)3
(1.5)3
(1.5)0
(0.0)0
(0.0)22
(10.7)56
(27.2)0
(0.0)44
(21.4)137
(66.5)1
(0.5)24
(11.7)Trichloroethylene-induced medicamentosa-like dermatitis 46
(48.9)18
(19.1)0
(0.0)0
(0.0)0
(0.0)10
(10.6)20
(21.3)8
(8.5)19
(20.2)43
(45.7)1
(1.1)23
(24.5)1,2-dichloroethane poisoning 0
(0.0)4
(6.2)2
(3.1)0
(0.0)0 56
(86.2)3
(4.6)0
(0.0)4
(6.2)60
(92.3)0
(0.0)1
(1.5)Trichloromethane poisoning 40
(76.9)0
(0.0)1
(1.9)0
(0.0)0
(0.0)7
(13.5)4
(7.7)30
(57.7)3
(5.8)6
(11.5)0
(0.0)13
(25.0)Dimethyl formamide poisoning 0
(0.0)0
(0.0)0
(0.0)0
(0.0)0
(0.0)47
(95.9)2
(4.1)0
(0.0)7
(14.3)39
(79.6)0
(0.0)3
(6.1)Total 321
(24.9)141
(10.9)78
(6.0)2
(0.2)25
(1.9)488
(37.8)235
(18.2)216
(16.7)374
(29.0)538
(41.7)5
(0.4)157
(12.2)Note. *A, B, C, D, E, F, and G represent ‘Electronic industry’, ‘Machinery industry’, ‘Building materials industry’, ‘Construction industry’, ‘Mineral industry’, ‘Light industry’, and ‘Others’, respectively. &a, b, c, d, and e represent ‘Large-scale’, ‘Middle-scale’, ‘Small-scale’, ‘Micro-scale’, and ‘Unknown’, respectively. The median onset ages of most OSODs were lower than 30, among which trichloromethane poisoning had the youngest at 21 years of age. On the other hand, the median onset age of benzolism was the oldest at 37 years of age, followed by that of benzene-induced leukemia at 35, findings that are consistent with the trend in working age of each OSOD (Supplementary Tables S1–S2 available in www.besjournal.com). The fitted trend curve of benzolism onset age from 2006 to 2015 presented a generally increasing trend and indicated a linear relationship with year (R2 = 0.846, P < 0.05). The onset age of dimethyl formamide poisoning also exhibited a generally increasing trend and showed a linear relationship with year (R2 = 0.793, P < 0.05). However, the annual trends in onset ages of other OSODs and their exposure periods did not show statistical significance.
Table S1. Annual change trends in onset age of OSODs in Guangdong province, 2006–2015, M (P25, P75)*
OSODs 2006 2007 2008 2009 2010 2011 2012 2013 2014 2015 Total Benzolism 32.5
(29, 37)31
(22.5, 39.5)34.5
(30, 40)34
(30, 39)32.5
(26, 37)38
(32, 42)37
(30.5, 41)38
(31, 42)40
(34, 45)42
(37, 46)37
(31, 42)Benzene-induced leukemia 33.5
(33, 34)30
(22, 33)35
(32, 39)27.5
(23, 32)34.5
(28, 39)37
(29, 42)36.5
(31, 43.5)38
(32, 43)35
(28, 41)36
(30, 45)35
(29, 42)N-hexane poisoning 23
(20, 27)35
(33, 37)25
(21, 28)− 21
(19.5, 23.5)20
(17, 22)26.5
(19, 37.5)23
(20, 26)27
(20, 32)33
(30, 45)23
(20, 28)Trichloroethylene-induced medicamentosa-like dermatitis 25
(21, 33)27
(25, 35)22.5
(18, 27)28.5
(28, 29)22
(21, 31)25
(20, 27.5)25.5
(24, 27)31.5
(25, 40.5)25
(22, 31)29
(21, 37)26
(22,33)1,2-dichloroethane poisoning − − − 32
(26, 36)28.5
(23, 32)29
(22.5, 40.5)23.5
(17, 38)51
(51, 51)21
(21, 21)− 26
(20, 38)Trichloromethane poisoning 18
(18, 18)29
(23, 30)− 19
(18, 21)32
(28, 42)28
(20, 36)35
(25, 44)42
(42, 42)− − 21 (18, 29) Dimethyl formamide poisoning 24
(20, 30)23.5
(21, 26.5)− 28
(28, 28)32
(32, 32)38
(28, 39)− − 52
(49, 55)37.5
(37, 38)28
(21, 33)Note. * M: Median; (P25, P75): Interquartile range. Table S2. Annual change trend in working age of onset OSODs in Guangdong province, 2006–2015, M (P25, P75)*
OSODs 2006 2007 2008 2009 2010 2011 2012 2013 2014 2015 Total Benzolism (year) 4
(2, 5)3
(1, 5)6
(3, 10)3
(1, 4)2
(1, 4)4
(2, 7)5
(3, 9)6
(2, 9)6
(2, 10)7
(4, 10)4
(2, 8)Benzene-induced leukemia (year) 3.5
(2, 5)1.5
(1, 3)9
(4, 12)2.5
(1, 4)4
(2, 6)4
(2, 9)4
(2.5, 8)6
(3, 8)4
(2, 7)8
(4, 10)4
(2, 8)N-hexane poisoning (month) 9
(7, 12)56
(11, 108)8
(5, 18)7
(5, 10)9
(6, 12)12
(7, 15)6
(6, 6)8
(6, 6)8
(6, 12)10
(9, 14)8
(6, 13)Trichloroethylene-induced medicamentosa-like dermatitis (month) 1
(1, 1)1
(1, 2)1
(1, 1)17
(1, 32)1
(1, 1)1
(1, 2)2
(1, 2)1
(1,1)1
(1, 1)1
(0,1)1
(1, 1)Dichloroethane poisoning (month) − − − 3
(2, 3)6
(2, 15)2
(1, 5)7
(4, 13)10 6
(6, 6)− 5
(3, 10)Trichloromethane poisoning (month) − 6
(3, 7)− 1
(1, 1)2
(1, 4)32
(4, 60)1
(1, 37)1
(1, 1)29
(29, 29)− 1
(1, 4)Dimethyl formamide poisoning (month) 1
(1, 1)2
(1, 3)− 5
(5, 5)54
(54, 54)8
(0, 10)− − 1
(1, 1)46
(2, 90)1
(1, 1)Note.*M: Median; (P25, P75): Interquartile range. The recognition that organic solvents exhibit occupational disease-accelerating properties has motivated growing interest in occupational health research. In our study, the number of cases of benzolism and leukemia induced by benzene exhibited exponential growth from 2006 to 2015 in Guangdong. The reasons for the rapid growth are as follows: First, as the average annual production and consumption of pure benzene in China has increased at rates of 9.82% and 7.00%, respectively[5], exposure to benzene might have increased as well. Second, whereas the permissible concentration-time-weighted average is 1 ppm in major developed countries and regions, the occupational exposure limit to benzene (1.7 ppm) is still high in our country. However, a recent study has demonstrated that exposure to 1 ppm or less of airborne benzene may cause hematotoxicity in susceptible populations[6]. Third, there are 26 benzene-containing solvents, accounting for 2.9% of 898 organic solvents [7], rendering it difficult to prevent and control benzene exposure.
Additionally, compared with occupational diseases induced by other organic solvents, workers, enterprises, regulatory authorities, and society in general have higher awareness of and pay greater attention to benzolism and benzene-induced leukemia. Therefore, more workers may be seeking further examination and diagnosis in cases of similar health damage, and technical service divisions may have greater ability to test benzene status and perform occupational health examinations. In general, the inspection of occupational diseases in large enterprises may be more than that in small and medium enterprises. In our study, reports of benzolism demonstrated an increasing trend with the increasing proportion of large enterprises, which indicates that improved supervision in small-scale enterprises is imperative.
Trichloromethane is a protoplasmic toxicant that can directly damage liver cells and their organelles (especially the endoplasmic reticulum) and cause fatty degeneration and necrosis of liver cells[8]. From 2006 to 2015, a total of 52 cases of trichloromethane poisoning occurred, with the highest incidence of 35 cases occurring in 2009. In contrast to the other six major OSODs, trichloromethane poisoning occurs mainly in large enterprises. The average age of onset of trichloromethane is 21 years of age, and it is the youngest of all 12 occupational diseases included in the study[9]. Trichloromethane poisoning was mainly caused by exposure to high concentrations. Simulated operation test results showed that the time-weighted average concentrations of airborne trichloromethane in the patient's workplace in 8 hours were 602.1 mg/m3 and 366.6–403.4 mg/m3, which were 30 times and 17.3–19.2 times that of the occupational exposure limit, respectively[10].
In conclusion, we proffer the following recommendations for the prevention and control of OSODs: 1) Public awareness and education on the occupational diseases caused by organic solvents must be strengthened, and the workers’ and enterprises’ awareness, understanding, and implementation of protective measures must be enhanced, especially regarding benzolism and benzene-induced leukemia. 2) The obligations of enterprises and regulatory responsibilities of controlling authorities to prevent the occurrence of group occupational poisoning must be increased, while noting that protection should also be provided for exposed skin in addition to that for respiratory inhalation. 3) Monitoring of organic solvent-induced occupational diseases and evaluation of occupational health risk based on the actual disease situation in Guangdong must be executed, so as to understand the high-risk industries, areas, and professions as well as ultimately realize real-time monitoring, accurate evaluation, and effective responses regarding relevant risks and hazards. 4) The technical acuity of organizations must be improved, especially in coping scientifically with new trends following the publication of a new version of the Law on Prevention and Control of Occupational Diseases, stating that occupational disease group diagnosis and management of qualifications of occupational health examination organizations are not mandatory. 5) Scientific research on organic solvent-induced occupational diseases must be enhanced, focusing on the health effects of collective exposure to several organic solvents and other occupational hazard factors as well as the health effects of new organic solvents and the new toxicity of known poisons.
Ethics Approval and Consent to Participate This work was approved by the Medical Ethics Committee of Guangdong Province Hospital for Occupational Disease Prevention and Treatment.
Competing Interests The authors declare no conflict of interest.
Author Contributions LI Xu Dong and TU Hong Wei analyzed data, and LI Xu Dong drafted the manuscript. HU Shi Jie and CHEN Jia Bin accessed original data from the Occupational Disease Hazard Factors Monitoring System, and YU Hong Wei and CHEN Pei Liang processed the data. LI Xu Dong and ZHANG Run Ze critically revised the manuscript.
Acknowledgments We thank the doctors from Guangdong Prevention and Treatment Center for Occupational Diseases and Lab Associates for Occupational Disease Diagnosis. Data was supported by the Occupational Disease Hazard Factors Monitoring System of the China Disease Prevention and Control Information System.
doi: 10.3967/bes2020.117
Trends of 7 Organic Solvent-induced Occupational Diseases in Guangdong, from 2006 to 2015
-
&These authors contributed equally to this work.
注释: -
Figure 1. Distribution of the 7 major OSODs in the cities of Guangdong province, China, 2006–2015
Table 1. Annual trends for new cases of OSODs in Guangdong province, 2006–2015, n (%)
OSODs 2006 2007 2008 2009 2010 2011 2012 2013 2014 2015 Total Benzolism 38
(6.4)40
(6.8)26
(4.4)41
(6.9)50
(8.4)65
(11.0)76
(12.8)72
(12.2)121
(20.4)63
(10.6)592
(100.0)Benzene-induced leukemia 2
(0.9)6
(2.6)6
(2.6)12
(5.2)34
(14.7)43
(18.5)36
(15.5)23
(9.9)39
(16.8)31
(13.4)232
(100.0)N-hexane poisoning 26
(12.6)5
(2.4)32
(15.5)0
(0.0)44
(21.4)10
(4.9)48
(23.3)11
(5.3)23
(11.2)7
(3.4)206
(100.0)Trichloroethylene-induced
medicamentosa-like dermatitis23
(24.5)5
(5.3)6
(6.4)2
(2.1)9
(9.6)8
(8.5)2
(2.1)12
(12.8)14
(14.9)13
(13.8)94
(100.0)1,2-michloroethane poisoning 0
(0.0)0
(0.0)0
(0.0)5
(7.7)12
(18.5)12
(18.5)34
(52.3)1
(1.5)1
(1.5)0
(0.0)65
(100.0)Trichloromethane poisoning 1
(1.9)5
(9.6)0
(0.0)31
(59.6)3
(5.8)2
(3.8)9
(17.3)1
(1.9)0
(0.0)0
(0.0)52.0
(100.0)Dimethyl formamide
poisoning36
(73.5)4
(8.2)0
(0.0)1
(2.0)1
(2.0)3
(6.1)0
(0.0)0
(0.0)2
(4.1)2
(4.1)49
(100.0)Total 126
(9.8)65
(5.0)70
(5.4)92
(7.1)153
(11.9)143
(11.1)205
(15.9)120
(9.3)200
(15.5)116
(9.0)1,290
(100.0)Note. OSODs, organic solvent-induced occupational diseases.  下载: 导出CSV
Table 2. Distribution of the 7 major OSODs according to economy/ownership type, n (%)
OSODs Total Ownership type* A B C D E Benzolism 592 200 (33.8) 177 (29.9) 6 (1.0) 29 (4.9) 180 (30.4) Benzene-induced leukemia 232 45 (19.4) 90 (38.8) 12 (5.2) 14 (6.0) 71 (30.6) N-hexane poisoning 206 2 (1.0) 153 (74.3) 4 (1.9) 1 (0.5) 46 (22.3) Trichloroethylene-induced
medicamentosa-like dermatitis94 6 (6.4) 67 (71.3) 7 (7.4) 1 (1.1) 13 (13.8) 1,2 dichloroethane poisoning 65 − 64 (98.5) − − 1 (1.5) Trichloromethane poisoning 52 3 (5.8) 47 (90.4) − − 2 (3.8) Dimethyl formamide poisoning 49 2 (4.1) 40 (81.6) 1 (2.0) − 6 (12.2) Total 1,290 258 (20.0) 638 (49.5) 30 (2.3) 45 (3.5) 319 (24.7) Note. *A, B, C, D, and E represent ‘Foreign-Funded Economy’, ‘Private Economy’, ‘Collective Economy’, ‘State-owned Economy’, and ‘Hong Kong/Macao/Taiwan Economy’, respectively.
下载: 导出CSV
Table 3. Distribution of the 7 major OSODs according to industry type and enterprise scale, n (%)
OSODs Industry* Enterprise scale& A B C D E F G a b c d e Benzolism 80
(13.5)75
(12.7)49
(8.3)0
(0.0)21
(3.5)260
(43.9)107
(18.1)126
(21.3)220
(37.2)172
(29.1)2
(0.3)72
(12.2)Benzene-induced leukemia 33
(14.2)41
(17.7)23
(9.9)2
(0.9)4
(1.7)86
(37.1)43
(18.5)52
(22.4)77
(33.2)81
(34.9)1
(0.4)21
(9.1)N-hexane poisoning 122
(59.2)3
(1.5)3
(1.5)0
(0.0)0
(0.0)22
(10.7)56
(27.2)0
(0.0)44
(21.4)137
(66.5)1
(0.5)24
(11.7)Trichloroethylene-induced medicamentosa-like dermatitis 46
(48.9)18
(19.1)0
(0.0)0
(0.0)0
(0.0)10
(10.6)20
(21.3)8
(8.5)19
(20.2)43
(45.7)1
(1.1)23
(24.5)1,2-dichloroethane poisoning 0
(0.0)4
(6.2)2
(3.1)0
(0.0)0 56
(86.2)3
(4.6)0
(0.0)4
(6.2)60
(92.3)0
(0.0)1
(1.5)Trichloromethane poisoning 40
(76.9)0
(0.0)1
(1.9)0
(0.0)0
(0.0)7
(13.5)4
(7.7)30
(57.7)3
(5.8)6
(11.5)0
(0.0)13
(25.0)Dimethyl formamide poisoning 0
(0.0)0
(0.0)0
(0.0)0
(0.0)0
(0.0)47
(95.9)2
(4.1)0
(0.0)7
(14.3)39
(79.6)0
(0.0)3
(6.1)Total 321
(24.9)141
(10.9)78
(6.0)2
(0.2)25
(1.9)488
(37.8)235
(18.2)216
(16.7)374
(29.0)538
(41.7)5
(0.4)157
(12.2)Note. *A, B, C, D, E, F, and G represent ‘Electronic industry’, ‘Machinery industry’, ‘Building materials industry’, ‘Construction industry’, ‘Mineral industry’, ‘Light industry’, and ‘Others’, respectively. &a, b, c, d, and e represent ‘Large-scale’, ‘Middle-scale’, ‘Small-scale’, ‘Micro-scale’, and ‘Unknown’, respectively.
下载: 导出CSV
S1. Annual change trends in onset age of OSODs in Guangdong province, 2006–2015, M (P25, P75)*
OSODs 2006 2007 2008 2009 2010 2011 2012 2013 2014 2015 Total Benzolism 32.5
(29, 37)31
(22.5, 39.5)34.5
(30, 40)34
(30, 39)32.5
(26, 37)38
(32, 42)37
(30.5, 41)38
(31, 42)40
(34, 45)42
(37, 46)37
(31, 42)Benzene-induced leukemia 33.5
(33, 34)30
(22, 33)35
(32, 39)27.5
(23, 32)34.5
(28, 39)37
(29, 42)36.5
(31, 43.5)38
(32, 43)35
(28, 41)36
(30, 45)35
(29, 42)N-hexane poisoning 23
(20, 27)35
(33, 37)25
(21, 28)− 21
(19.5, 23.5)20
(17, 22)26.5
(19, 37.5)23
(20, 26)27
(20, 32)33
(30, 45)23
(20, 28)Trichloroethylene-induced medicamentosa-like dermatitis 25
(21, 33)27
(25, 35)22.5
(18, 27)28.5
(28, 29)22
(21, 31)25
(20, 27.5)25.5
(24, 27)31.5
(25, 40.5)25
(22, 31)29
(21, 37)26
(22,33)1,2-dichloroethane poisoning − − − 32
(26, 36)28.5
(23, 32)29
(22.5, 40.5)23.5
(17, 38)51
(51, 51)21
(21, 21)− 26
(20, 38)Trichloromethane poisoning 18
(18, 18)29
(23, 30)− 19
(18, 21)32
(28, 42)28
(20, 36)35
(25, 44)42
(42, 42)− − 21 (18, 29) Dimethyl formamide poisoning 24
(20, 30)23.5
(21, 26.5)− 28
(28, 28)32
(32, 32)38
(28, 39)− − 52
(49, 55)37.5
(37, 38)28
(21, 33)Note. * M: Median; (P25, P75): Interquartile range.
下载: 导出CSV
S2. Annual change trend in working age of onset OSODs in Guangdong province, 2006–2015, M (P25, P75)*
OSODs 2006 2007 2008 2009 2010 2011 2012 2013 2014 2015 Total Benzolism (year) 4
(2, 5)3
(1, 5)6
(3, 10)3
(1, 4)2
(1, 4)4
(2, 7)5
(3, 9)6
(2, 9)6
(2, 10)7
(4, 10)4
(2, 8)Benzene-induced leukemia (year) 3.5
(2, 5)1.5
(1, 3)9
(4, 12)2.5
(1, 4)4
(2, 6)4
(2, 9)4
(2.5, 8)6
(3, 8)4
(2, 7)8
(4, 10)4
(2, 8)N-hexane poisoning (month) 9
(7, 12)56
(11, 108)8
(5, 18)7
(5, 10)9
(6, 12)12
(7, 15)6
(6, 6)8
(6, 6)8
(6, 12)10
(9, 14)8
(6, 13)Trichloroethylene-induced medicamentosa-like dermatitis (month) 1
(1, 1)1
(1, 2)1
(1, 1)17
(1, 32)1
(1, 1)1
(1, 2)2
(1, 2)1
(1,1)1
(1, 1)1
(0,1)1
(1, 1)Dichloroethane poisoning (month) − − − 3
(2, 3)6
(2, 15)2
(1, 5)7
(4, 13)10 6
(6, 6)− 5
(3, 10)Trichloromethane poisoning (month) − 6
(3, 7)− 1
(1, 1)2
(1, 4)32
(4, 60)1
(1, 37)1
(1, 1)29
(29, 29)− 1
(1, 4)Dimethyl formamide poisoning (month) 1
(1, 1)2
(1, 3)− 5
(5, 5)54
(54, 54)8
(0, 10)− − 1
(1, 1)46
(2, 90)1
(1, 1)Note.*M: Median; (P25, P75): Interquartile range.
下载: 导出CSV
-
[1] Taofeeq O, Olayinka RG, Taiwo OO, et al. Organic solvent exposure: hepatotoxicity, nephrotoxicity, and haematotoxicity assessment amongst vehicle spray painters in ile-ife, nigeria. Am J Environ Prot, 2015; 3, 95−9. [2] Wen XZ, Li XD, Huang YS, et al. Analysis on occupational disease spectrum in Guangdong province, 2006-2010. China Occup Med, 2014; 41, 157−62. (In Chinese [3] Hu SJ, Jin JC, Jiang JX, et al. Characteristics of occupational poisoning in Guangdong province, 2006-2010. South China J Prev Med, 2012; 38, 22−4, 28. (In Chinese [4] Han L, Yao WX, Bian ZL, et al. Characteristics and trends of pneumoconiosis in the Jiangsu province, China, 2006-2017. Int J Environ Res Public Health, 2019; 16, 437. doi: 10.3390/ijerph16030437 [5] Xia ZL, Sun P, Zhang ZB, et al. Review and perspective of bene-induced health hazards. Chin J Ind Hyg Occup Dis, 2005; 23, 241−3. (In Chinese [6] Lan Q, Zhang LP, Li GL, et al. Hematotoxicity in workers exposed to low levels of benzene. Science, 2004; 306, 1774−6. doi: 10.1126/science.1102443 [7] Zhu ZL, Xu XR, Wu JH, et al. Analysis of main volatile chemical components of common organic solvents in recent five years. Chin J Ind Hyg Occup Dis, 2010; 28, 581−3. (In Chinese [8] Plaa GL. Chlorinated methanes and liver injury: highlights of the past 50 years. Annu Rev Pharmacol Toxicol, 2000; 40, 43−65. doi: 10.1146/annurev.pharmtox.40.1.43 [9] Lionte C. Lethal complications after poisoning with chloroform-case report and literature review. Hum Exp Toxicol, 2010; 29, 615−22. doi: 10.1177/0960327109357142 [10] Cheng JX. Investigation on a case report of occupational acute trichloromethane poisoning. Occup Health Emerg Rescue, 2012; 30, 101. (In Chinese -

 点击查看大图
计量
- 文章访问数: 826
- HTML全文浏览量: 403
- PDF下载量: 54
- 被引次数: 0

 Quick Links