


-
Serum fetuin-A, also known as alpha-2 Heremans-Schmid glycoprotein, is a multifunctional glycoprotein secreted by the human liver. It has a variety of physiological and pathological functions in the regulation of mineralization, metabolism, and the cardiovascular system[1]. Previous studies on the relationship between fetuin-A and thyroid hormones are relatively limited and with small sample sizes; however, most reported a positive association between free triiodothyronine (FT3)/free thyroxine (FT4) concentrations and fetuin-A levels and a negative association between thyroid-stimulating hormone (TSH) concentrations and fetuin-A levels. Particularly, Bakiner et al. reported that plasma fetuin-A levels were lower in female patients with hypothyroidism, which normalized after thyroid hormone treatment[1]. However, population-based studies on the association between serum fetuin-A level and thyroid function have been limited. We aimed to investigate this association in a large community-based Chinese population aged 40 years and older.
The study design and population have been reported in detail previously[2]. A total of 10, 185 participants were recruited from Songnan community, Baoshan District, Shanghai, China, in 2008 during the screening examination. The subjects were categorized into three groups according to their fasting plasma glucose levels: normal glucose regulation, impaired glucose regulation, and diabetes. Normal glucose regulation was defined as fasting plasma glucose concentration < 5.6 mmol/L without a history of diabetes; impaired glucose regulation was defined as fasting plasma glucose level of 5.6 to 6.9 mmol/L without a history of diabetes; and diabetes was defined as fasting plasma glucose ≥ 7.0 mmol/L or having a history of diabetes. In 2009, participants were randomly chosen from the three groups based on a ratio of 1.0 (diabetes): 1.2 (impaired glucose regulation): 1.44 (normal glucose regulation) for a comprehensive evaluation including a detailed questionnaire interview, anthropometric measurements, and a 75-g oral glucose tolerance test.
A total of 4, 012 participants participated in the examination. The following were excluded from the final analysis: 1) participants without blood or urine samples (n = 557); 2) participants with insufficient sera for thyroid function measurements including thyroid peroxidase antibody (TPOAB) and thyroglobulin autoantibodies (TGAB) (n = 42); 3) participants having a history of thyroid diseases including hyperthyroidism, hypothyroidism, and thyroiditis, and participants taking or having taken thyroid hormones or antithyroid drugs (n = 12); 4) participants having a history of thyroidectomy (n = 2); 5) participants taking medications including amiodarone, lithium, and antipsychotic drugs such as phenytoin sodium and carbamazepine that might affect thyroid function (n = 5); and 6) participants with missing data on serum fetuin-A levels (n = 410). Eventually, 2, 984 participants were included in the analysis and did not differ significantly with regard to age and sex distribution from those who were excluded.
Written informed consent was obtained from all participants. The study protocol was approved by the Institutional Review Board of Rui-Jin Hospital affiliated with the Shanghai Jiao-Tong University School of Medicine.
A standard questionnaire was used by trained staff to collect information on sociodemographic characteristics, medical history, and lifestyle factors. Anthropometric measurements were performed by experienced investigators according to a standard protocol. Height and weight were recorded to the nearest 0.1 cm and 0.1 kg, respectively, and waist circumference (WC) was measured to the nearest 0.1 cm at the umbilical level horizontally in a standing position. Blood pressure (BP) was measured three times on the non-dominant arm after a 15 min rest with 1 min interval using an automated electronic device (OMRON Model HEM-752 FUZZY, Omron Company, Dalian, China). The average of the three measurements was used in the analysis.
After an overnight fast for at least 10 h, blood samples were collected and blood glucose levels were measured within two hours of collection using the glucose oxidase method on an autoanalyzer (ADVIA-1650 Chemistry System, Bayer Corporation, Germany). Fasting triglycerides, total cholesterol, low-density lipoprotein cholesterol (LDL-C), high-density lipoprotein cholesterol (HDL-C), and high-sensitivity C-reactive protein (hs-CRP) levels were measured using the autoanalyzer. The homeostatic model assessment of insulin resistance (HOMA-IR) index was calculated as fasting insulin (µIU/mL) × fasting glucose (mmol/L)/22.5.
Serum fetuin-A concentration was measured using a human fetuin-A sandwich enzyme-linked immunosorbent assay (ELISA) kit (MAB1184 R & D Company, CA, USA). The intra-and inter-assay coefficients of variation for fetuin-A concentrations were 7.8% and 5.2%, respectively. According to the quartiles of fetuin-A concentrations, the study population was divided into four groups: quartile 1 ( < 237.7 mg/L), quartile 2 (237.7-296.4 mg/L), quartile 3 (296.5-368.1 mg/L), and quartile 4 (≥ 368.2 mg/L).
Levels of thyroid function markers were measured in the clinical laboratory at Shanghai Institute of Endocrine and Metabolic Diseases, which is accredited by the College of American Pathologists. Thyroid hormone levels were tested using chemiluminescent microparticle immunoassays on an Architect System (Abbott Laboratories, Abbott Park, IL). Thyroid antibody levels were measured using Architect anti-TPO and anti-TG chemiluminescent microparticle immunoassays on the Architect System. The reference ranges of FT3, FT4, TSH, TPOAB, and TGAB were 2.62-6.49 pmol/L (inter-assay coefficient of variation: 4.7%-8.0%), 9.01-19.04 pmol/L (inter-assay coefficient of variation: 2.6%-5.3%), 0.35-4.94 µIU/mL (inter-assay coefficient of variation: 3.1%-3.4%), < 5.61 IU/mL (inter-assay coefficient of variation: 4.3%-6.8%), and < 4.11 IU/mL (inter-assay coefficient of variation: 3.2%-5.2%), respectively.
The participants were classified according to serum FT3, FT4, and TSH concentrations as follows[3]: 1) overt hyperthyroidism, FT3 > 6.49 pmol/L and FT4 > 19.04 pmol/L, or FT3 > 6.49 pmol/L and TSH < 0.35 µIU/mL; 2) subclinical hyperthyroidism, normal FT4 (9.01-19.04 pmol/L) and FT3 (2.62-6.49 pmol/L), with serum TSH < 0.35 µIU/mL; 3) euthyroid, normal serum TSH (0.35-4.94 µIU/mL); 4) subclinical hypothyroidism, normal FT4 and TSH > 4.94 µIU/mL; 5) overt hypothyroidism, FT4 < 9.01 pmol/L and TSH > 4.94 µIU/mL. Participants with high-normal thyroid function were defined as those with euthyroid function and FT4 levels within the highest quartile range (FT4 > 15.34 pmol/L)[4]. Similarly, participants with low-normal thyroid function were defined as those with euthyroid function and FT4 levels within the lowest quartile range (FT4 < 13.25 pmol/L). Due to the limited number of participants with overt hyperthyroidism or overt hypothyroidism, we combined overt hyperthyroidism, subclinical hyperthyroidism, and high-normal thyroid function as the high thyroid function group and overt hypothyroidism, subclinical hypothyroidism, and low-normal thyroid function as the low thyroid function group[3-4].
Statistical analyses were performed using SAS version 9.3 (SAS Institute, Cary, NC, USA). The results are presented as means ± standard deviations for variables with a normal distribution, medians (interquartile ranges) for skewed variables, and numbers (proportions) for categorical variables. Skewed variables such as fetuin-A, triglycerides, HOMA-IR, hs-CRP, FT3, FT4, TSH, TPOAB, and TGAB concentrations were logarithmically transformed before analysis. Linear regressions and Cochran-Armitage trend analyses were performed to test the trends across quartiles of serum fetuin-A levels. Associations between fetuin-A and serum thyroid measures were tested by multivariable linear regression analysis. Least-square geometric means of fetuin-A concentration were calculated according to tertiles of FT3, FT4, and TSH concentrations after adjusting for age, sex, body-mass index (BMI), smoking status, drinking status, and LDL-C, HDL-C, HOMA-IR, hs-CRP, TPOAB, and TGAB concentrations. We performed logistic regression analysis to estimate the risk of high and low thyroid function with increasing serum fetuin-A levels.
The characteristics of the study population according to quartiles of serum fetuin-A concentrations are presented in Supplementary Table 1, available in www.besjourna.com. The median and interquartile range of serum fetuin-A concentration was 296.5 (237.7-368.2) mg/L. Compared to participants in quartile 1, those in higher quartiles were more likely to have higher BMI and triglycerides, total cholesterol, LDL-C, fasting glucose, HOMA-IR, hs-CRP, and FT3 levels and lower TPOAB levels. No significant trends were observed in levels of FT4, TSH, and TGAB with increasing fetuin-A quartiles.
Characteristics Quartile 1
( < 237.7 mg/L) n = 746Quartile 2
(237.7-296.4 mg/L) n = 746Quartile 3
(296.5-368.1 mg/L) n = 746Quartile 4
(≥ 368.2 mg/L) n = 746P for Trend Fetuin-A (mg/L) 204.3 (176.7-221.8) 266.2 (254.2-280.5) 327.2 (311.9-347.3) 438.1 (395.3-506.7) < 0.0001 Age (years) 61.0 ± 10.0 60.7 ± 10.2 60.9 ± 10.3 60.8 ± 9.9 0.85 Men [n (%)] 296 (40) 284 (38) 286 (38) 321 (43) 0.24 BMI (kg/m2) 25.1 ± 3.3 25.2 ± 3.3 25.6 ± 3.4 25.6 ± 3.4 0.0006 Smoking status [n (%)] 0.37 Never smokers 549 (74) 561 (75) 560 (75) 532 (71) Former smokers 34 (5) 37 (5) 42 (6) 40 (5) Current smokers 163 (22) 148 (20) 144 (19) 174 (23) Drinking status [n (%)] 0.12 Never drinkers 602 (81) 624 (84) 635 (85) 622 (83) Former drinkers 9 (1) 7 (0.9) 7 (0.9) 7 (0.9) Current drinkers 135 (18) 115 (15) 104 (14) 117 (16) Triglycerides (mmol/L) 1.33 (0.92-1.85) 1.42 (0.99-2.08) 1.50 (1.05-2.13) 1.54 (1.08-2.25) < 0.0001 Total cholesterol (mmol/L) 5.05 ± 0.94 5.15 ± 0.97 5.18 ± 1.01 5.21 ± 1.01 0.002 HDL-C (mmol/L) 1.35 ± 0.31 1.35 ± 0.31 1.35 ± 0.31 1.35 ± 0.30 0.66 LDL-C (mmol/L) 2.34 ± 0.68 2.39 ± 0.68 2.41 ± 0.71 2.44 ± 0.68 0.004 Fasting glucose (mmol/L) 5.58 ± 1.51 5.59 ± 1.66 5.92 ± 2.04 5.91 ± 2.03 < 0.0001 HOMA-IR 1.48 (0.96-2.37) 1.65 (1.04-2.56) 1.91 (1.17-3.02) 1.95 (1.18-3.13) < 0.0001 hs-CRP (mg/L) 0.16 (0.05-0.63) 0.21 (0.06-0.85) 0.21 (0.07-0.87) 0.22 (0.07-0.86) 0.007 FT3 (pmol/L) 4.56 (4.20-4.92) 4.58 (4.28-4.89) 4.62 (4.32-4.90) 4.66 (4.34-4.97) < 0.0001 FT4 (pmol/L) 14.21 (13.27-15.20) 14.19 (13.14-15.38) 14.19 (13.17-15.26) 14.28 (13.25-15.42) 0.25 TSH (µIU/mL) 1.51 (1.02-2.18) 1.41 (0.99-2.18) 1.45 (1.04-2.16) 1.48 (1.01-2.21) 0.23 TPOAB (IU/mL) 0.33 (0.17-0.87) 0.32 (0.18-0.83) 0.29 (0.16-0.75) 0.29 (0.17-0.62) 0.005 TGAB (IU/mL) 1.07 (0.74-2.60) 1.03 (0.70-2.72) 1.09 (0.73-3.10) 1.03 (0.69-1.95) 0.07 Note. Data are presented as mean ± SD or median (interquartile range) for continuous variable and number (percentage) for categorical variable. Abbreviations: BMI, body-mass index; HDL-C, high-density lipoprotein cholesterol; LDL-C, low-density lipoprotein cholesterol; hs-CRP, high-sensitivity C-reactive protein; FT3, free triiodothyronine; FT4, free thyroxine; TSH, thyroid stimulating hormone; TPOAB, thyroid peroxidase antibody; TGAB, thyroglobulin antibody. Table Supplementary Table 1. Study Population Characteristics according to Quartiles of Serum Fetuin-A Concentrations
The multivariable adjusted regression analysis revealed that serum fetuin-A levels were significantly and positively associated with log-FT3 and significantly and inversely associated with log-TPOAB after adjusting for age, sex, BMI, smoking status, drinking status, triglycerides, LDL-C, HDL-C, HOMA-IR, hs-CRP, TPOAB, and TGAB levels (except for the tested variable) (Table 1).
Thyroid Measures Unadjusted Model Multivariable-adjusted Modela β ± SE P Value β ± SE P Value Log-FT3 (pmol/L) 0.024 ± 0.006 < 0.0001 0.019 ± 0.006 0.002 Log-FT4 (pmol/L) 0.009 ± 0.006 0.15 0.010 ± 0.006 0.12 Log-TSH (µIU/mL) -0.033 ± 0.042 0.42 -0.036 ± 0.041 0.38 Log-TPOAB (IU/mL) -0.294 ± 0.129 0.02 -0.295 ± 0.129 0.02 Log-TGAB (IU/mL) -0.160 ± 0.090 0.07 -0.141 ± 0.088 0.11 Note. aAdjusted for age, sex, BMI, smoking status, drinking status, LDL-C, HDL-C, HOMA-IR, hs-CRP, TPOAB, and TGAB (except for the tested variable). β, regression coefficient; SE, standard error. Table 1. Associations between Serum Fetuin-A Concentrations and Thyroid Measures
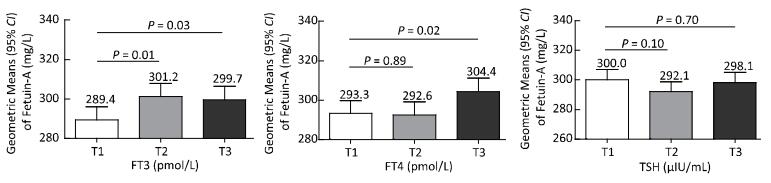
The geometric means of serum fetuin-A concentrations across tertiles of FT3, FT4, and TSH concentrations are shown in Figure 1. Participants in tertiles 2 and 3 of FT3 were more likely to have higher serum fetuin-A concentrations compared to those in tertile 1. Additionally, participants in tertile 3 of FT4 concentration had significantly higher fetuin-A concentrations compared to those in tertile 1, after adjusting for potential confounding factors. No significant trend was observed in serum fetuin-A levels across TSH tertiles (Figure 1).

Figure 1. Geometric means of serum fetuin-A concentrations according to tertiles of FT3, FT4, and TSH concentrations, adjusted for age, sex, BMI, smoking status, drinking status, LDL-C, HDL-C, HOMA-IR, hs-CRP, TPOAB, and TGAB concentration.
Logistic regression analysis was conducted to evaluate the association between serum fetuin-A concentrations and thyroid function. Only 79 (3%) participants had overt or subclinical hypothyroidism, while 60 (2%) participants had overt or subclinical hyperthyroidism. Compared with individuals in the lowest quartile of fetuin-A concentration, those in the highest quartile had a 1.27-fold increased risk of high thyroid function (odds ratio 1.27, 95% confidence interval 1.01-1.61), independent of age, sex, BMI, smoking status, drinking status, LDL-C, HDL-C, HOMA-IR, hs-CRP, TPOAB, and TGAB concentration. No significant association was found between fetuin-A concentration and low thyroid function (Table 2).
Fetuin-A Level (mg/L) Cases No. (%) Unadjusted P Value Multivariable -adjusteda P Value High thyroid function Quartile 1 174 (23) 1.00 - 1.00 - Quartile 2 200 (27) 1.20 (0.95-1.52) 0.12 1.22 (0.96-1.55) 0.10 Quartile 3 180 (24) 1.05 (0.82-1.33) 0.72 1.05 (0.82-1.33) 0.72 Quartile 4 211 (28) 1.30 (1.03-1.64) 0.03 1.27 (1.01-1.61) 0.04 Each log increase - 1.28 (1.02-1.62) 0.03 1.27 (1.01-1.60) 0.05 Low thyroid function Quartile 1 186 (25) 1.00 - 1.00 - Quartile 2 216 (29) 1.23 (0.98-1.54) 0.08 1.26 (0.99-1.58) 0.06 Quartile 3 209 (28) 1.17 (0.93-1.48) 0.18 1.19 (0.94-1.50) 0.15 Quartile 4 188 (25) 1.01 (0.80-1.28) 0.90 1.05 (0.83-1.34) 0.67 Each log increase - 1.02 (0.81-1.27) 0.90 1.01 (0.80-1.27) 0.95 Note. aAdjusted for age, sex, BMI, smoking status, drinking status, LDL-C, HDL-C, HOMA-IR, hs-CRP, TPOAB, and TGAB. High thyroid function was defined as the combination of overt hyperthyroidism, subclinical hyperthyroidism, and high-normal thyroid function, while low thyroid function was defined as the combination of overt hypothyroidism, subclinical hypothyroidism, and low-normal thyroid function. Table 2. Associations between Serum Fetuin-A Concentrations and Risks of High or Low Thyroid Function
In the current study, serum fetuin-A level was positively and inversely associated with serum FT3 and TPOAB levels, respectively. Furthermore, compared with participants in the lowest quartile of serum fetuin-A level, those in the highest quartile had a 1.27-fold increased risk of high thyroid function after adjusting for potential confounders.
Levels of fetuin-A, as a prominent serum glycoprotein and a major noncollagenous component of mineralized bone in mammals, might increase in hyperthyroidism through a mechanism related to bone metabolism, as thyroid hormones increase levels of bone turnover markers and hyperthyroidism increases bone turnover[5]. Recently, Pamuket et al. reported that FT3 and FT4 concentrations were positively correlated with fetuin-A levels and that TSH was inversely related to fetuin-A level in 42 patients diagnosed with hyperthyroidism[5]. Moreover, fetuin-A levels decreased significantly after hyperthyroidism treatment. They hypothesized an interaction between fetuin-A synthesis and thyroid hormones based on the positive correlation between these two parameters. Another study reported that, compared with healthy controls, fetuin-A concentrations in participants with subclinical hyperthyroidism tended to be higher and decreased significantly after treatment[6]. However, Gagnon and colleagues observed no effect on serum levels of fetuin-A following recombinant human TSH stimulation in screening for thyroid cancer recurrence in 26 participants with previous thyroidectomy and radioactive iodine ablation[7].
Our findings on the association between serum fetuin-A level and thyroid function were consistent with those of previous studies. However, there were also differences. Most of the participants in our study had euthyroid and less than 5% had overt clinical or subclinical hyperthyroidism or hypothyroidism, which resulted in a relatively small variability in thyroid function measures. Higher fetuin-A levels were related to high thyroid function, which was defined by the combination of overt hyperthyroidism, subclinical hyperthyroidism, and high-normal thyroid function. Thus, although the variability in thyroid measures according to fetuin-A categories was relatively small, it may be clinically relevant.
Furthermore, serum fetuin-A concentration was associated with that of TPOAB, even after adjusting for potential confounding factors. TPOAB is an antibody marker of intrathyroidal inflammation and is cytotoxic in the presence of complement, which is specific for autoimmune thyroiditis[8]. Fetuin-A may participate in immune reactions as a ligand of toll-like receptor 4 (TLR4) that is involved in innate immunity[9].
Our study has several limitations. First, this is a cross-sectional study; thus, reverse causation cannot be ruled out and no causal relationship can be identified. Second, we measured FT3 and FT4 levels by direct immunoassays, which are widely used in clinical and research settings. However, ultrafiltration liquid chromatography-tandem mass spectrometry[10] may have provided more accurate measurements of FT3 and FT4 levels. Additionally, due to the limited number of participants, we combined overt hyperthyroidism, subclinical hyperthyroidism, and high-normal thyroid function to define high thyroid function and overt hypothyroidism, subclinical hypothyroidism, and low-normal thyroid function to define low thyroid function. This might have resulted in misclassification and attenuated the association with fetuin-A concentration.
In conclusion, the results of our study suggest that serum fetuin-A level was positively and inversely associated with FT3 and TPOAB levels, respectively in Chinese adults aged 40 years or older. In addition, increased serum fetuin-A concentrations were related to high thyroid function. Prospective studies are needed to illustrate the role of fetuin-A and related antibodies in thyroid function.
HTML
-
The funding agencies had no role in the design and conduct of the study; in the collection, management, analysis, and interpretation of the data; or in the preparation, review, or approval of the manuscript or decision to submit for publication.

 Quick Links
 DownLoad: