


HTML
-
Frequent HIV testing is associated with timely HIV diagnosis and treatment among people at risk for HIV infection[1]. Early initiation of antiretroviral therapy (ART) is associated with improved health in HIV-positive individuals and interrupted onward transmission to uninfected individuals[2-3]. Through voluntary counseling and testing (VCT), individuals who test HIV negative gain an opportunity for personalized health education and counseling on HIV prevention, which may help them to reduce the high-risk sexual behaviors to avoid HIV infection[4].
In many countries, VCT clinics are the main platform for HIV testing, HIV prevention efforts, and linkage to care programs[5-6]. In 2011, the State Council of China issued the 'Five Expands, Six Strengthens' strategy, calling for increased HIV testing among at-risk populations and care and support for those infected[7]. Initiated in 2001[8], VCT clinics in China are located at local centers for disease control and prevention, hospitals, maternal and child health care institutions, and community health service centers. Since sexual transmission has become the dominant route[9], health authorities in China encourage VCT clinics to increase HIV testing frequency among high-risk populations, including men who have sex with men (MSM), female sex workers (FSWs), and individuals of FSWs.
In Wuxi, China, VCT and provider-initiated HIV testing and counseling (PITC) were considered as two main measurements implemented for expanding HIV testing. Before the end of 2012, there were only 10 VCT clinics in Wuxi. From January 1, 2013, services from VCT clinics were expanded to more medical institutions, and 22 new VCT clinics were established. These 32 VCT clinics in Wuxi jointly serviced approximately 8, 000 unique individuals every year since 2013. In 2015, PITC was initiated in eight general hospitals among clinical visitors with sexually transmitted diseases (STDs) in order to detect potential HIV-positive individuals. Every year, over 5, 000 clinical visitors with STDs were advised to test HIV, and about 80.0% of them accepted the HIV testing service.
The rate of HIV testing in the past 12 months has remained low among these at-risk populations as reported in several cross-sectional studies in China[10-12]. As reported, there were over 143 million HIV testing person-times in China in 2015, of which more than 2.3 million person-times tested HIV in about 6, 000 VCT clinics[13]. Local CDCs in Wuxi conduct free baseline CD4+ T cell count measurement for HIV-positive individuals every 3 months. As a result, the time interval between HIV diagnosis and baseline CD4+ T cell count measurement varies among HIV-positive individuals. The 2015 World Health Organization HIV Treatment Guidelines recommend the treatment ART to be initiated in everyone living with HIV at any CD4 cell count[14]. The Chinese government started providing ART to all HIV-positive people since June 2016 regardless of their CD4+ T cell count[15]. However, the uptake of VCT HIV testing services among these populations in China has not been well documented. In this study, we aimed to elucidate the HIV testing uptake, repeat HIV testing, and incident HIV diagnosis in individuals attending VCT clinics and compare CD4+ T cell levels between individuals diagnosed at VCT clinics and those diagnosed in other health care institutions in Wuxi, China.
-
Wuxi, located in Jiangsu province in Eastern China, is an economically developed city, with a population of 6.5 million and per capita income of 20, 000 USD as of 2015[16]. HIV epidemic in Wuxi is similar to most other economically developed cities in China, where sexual transmission has been the primary transmission route and high HIV incidence was detected among MSM[9, 17]. All VCTs in Wuxi provide free, anonymous, and confidential HIV testing together with syphilis and hepatitis C virus screening. All counselors had a professional background of medical science and had been trained to master the skills of determining individual HIV risk, providing health education on HIV and HIV transmission, explaining how to reduce HIV infection risk, and clarifying the meaning of HIV test results.
A standardized questionnaire was designed by the Chinese CDC under ethical consideration by the Ethics Committee of China CDC according to the guidelines of the United Nations Programme on HIV/AIDS (UNAIDS) and the World Health Organization. This questionnaire was administered to individual testers and included socio-demographic characteristics, risk behaviors, previous HIV testing history, and phone number. In our study, 'male-male sexual behavior' refers to commercial and non-commercial oral/anal sex between men, and 'commercial heterosexual behavior' refers to a man paying for oral/vaginal sex with a woman or a woman selling oral/vaginal sex to a man, unless otherwise specified. The type of hosting institute and reason for attendance were recorded. Blood samples were drawn from individuals to test for HIV. People who were screened HIV positive would be given further confirmatory tests. All these information in the questionnaire were entered into the VCT information module in the Chinese National HIV/AIDS Comprehensive Control Information System (CNHCCIS) by the counselors. Data on HIV testing from all 32 VCT clinics in Wuxi between January 1, 2013 and December 31, 2015 as well as the HIV diagnosis from other clinical services from CNHCCIS were retrieved in our study. The phone number, being either a mobile phone or landline number; gender; and birthday were used to identify unique individuals.
As normal practice, all cases newly diagnosed with HIV either at VCT clinics or at other clinical services, including comprehensive hospitals, specialized hospitals, community health service centers, and private clinics, are immediately reported through case-reporting information module in the CNHCCIS. These patients are followed-up and advised to test for CD4+ T cell count as soon as possible at a local CDC or specialized hospital. If individuals test out of Wuxi, the CD4+ T cell count will be recorded and entered into the CNHCCIS when they come back to Wuxi through a general follow-up. Information on socio-, risk behaviors, CD4+ T cell count, and phone number are also included in the case-reporting information module in the CNHCCIS. A baseline measurement of CD4+ T cell count is usually conducted within 3 months since HIV diagnosis. This study was approved by the ethical review committee Wuxi Centre for Disease Control and Prevention and informed consents were signed by all participants voluntarily.
-
All HIV testing records from all 32 VCT clinics in Wuxi, China, between January 1, 2013 and December 31, 2015 were included in this study.
-
Testing records were excluded where 1) an invalid phone number was provided, 2) an HIV test occurred after a previous HIV diagnosis, and 3) a repeat test was performed within 1 month since the last HIV test, due to suspected window period.
-
Descriptive statistics were used to describe the baseline characteristics, HIV testing behaviors, and HIV positivity among individuals. In the calculation of repeat HIV testing, only individuals who tested negative for HIV at their first recorded test in either 2013 or 2014 were included. Repeat HIV testing was recorded if an individual retested within 12 months since their first recorded test during 2013-2014. Individuals who came in 2015 were not included as they would not have 12 months to follow-up due to the study time period was limited by the end of 2015. Earlier HIV diagnosis was defined as those HIV-positive individuals whose baseline CD4+ T cell count was ≥ 200 copies/mm3. Univariate logistic regression models were used to screen variables associated with repeat HIV testing. Variables with a P value of < 0.10 were entered in a multivariate model. In the calculation of incident HIV diagnosis, only individuals who were tested negative for HIV at their first recorded test and who had two or more HIV testing records from 2013 to 2015 were included. Individuals who came in 2015 were included as long as they had two tests, whereas those who retested within 1 month were excluded in the calculation of the incident HIV diagnosis according to the exclusion criteria. The date of the last HIV test or date of the first positive HIV test was considered as the endpoint. Person-years were used to calculate the rate of incident HIV diagnosis. A Cox proportional hazards regression was conducted to evaluate the factors associated with incident HIV diagnosis. Patients' characteristics at the first HIV test were used. A chi-square test was conducted to evaluate the differences in the characteristics between individuals who were diagnosed at VCT clinics (Group Ⅰ) and those diagnosed at other testing services (Group Ⅱ). Median and inter-quartile range (IQR) were used to describe the baseline CD4+ T cell count in HIV-infected individuals. A rank-sum test was used to analyze the differences in baseline CD4+ T cell count and the interval between HIV diagnosis and baseline CD4+ T cell count measurement between Groups Ⅰ and Ⅱ. All statistical analyses were conducted using Stata version 13.0 (Stata Corp. LP, College Station, TX, US).
Description of Study Site and Data Collection
Inclusion Criteria
Exclusion Criteria
Statistical Analysis
-
As shown in Figure 1, a total of 16, 535 individuals had 18, 237 episodes of HIV testing at 32 VCT clinics in Wuxi, China, between January 1, 2013 and December 31, 2015. Among these individuals, 61.1% were women including 3, 125 pregnant women, 61.5% were younger than 30 years, 58.8% were married, 46.8% had high school education or lower, and 78.3% were residents of Wuxi. Meanwhile, 31.4% reported previous HIV testing [14.2% for people who have commercial heterosexual behavior (PWCH), 35.5% for MSM, and 88.8% for injection drug users (IDUs)]. In male individuals, 29.0% reported male-male sexual behaviors, 22.0% reported casual non-commercial heterosexual behaviors, and 38.1% reported having commercial heterosexual behaviors at the first recorded test. In female individuals, 18.0% reported casual non-commercial sex with a man, and 20.3% reported having sold sex to a man. At first recorded HIV test, 1.5% of the individuals were diagnosed with HIV, with male individuals having higher rate than female individuals (2.9% vs. 0.7%, P < 0.05) and MSM having the highest rate among all individuals (7.7%); 2.3% of the individuals were diagnosed with syphilis (Table 1). Approximately 29.8% of the individuals attending hospital-based VCT clinics and only 5.3% of those visiting VCT clinics affiliated to community health service centers reported having ever had male-male sex (P < 0.05).
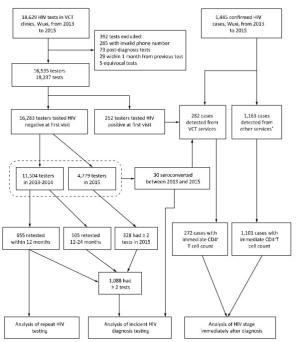
Figure 1. Flow chart of HIV testing in VCT clinics and HIV diagnosis in Wuxi, China, from 2013 to 2015. *Other services included clinical services provided in comprehensive hospitals, specialized hospitals, community health care centers, and private clinics.
Characteristics N % No. HIV+ % HIV+ Total 16, 535 100.0 252 1.5 Gender Female 10, 107 61.1 68 0.7 Male 6, 428 38.9 184 2.9 Age (year) < 30 10, 160 61.5 117 1.2 ≥ 30 6, 375 38.5 135 2.1 Marriage Not married 6, 814 41.2 123 1.8 Married 9, 721 58.8 129 1.3 Education ≤ High school 7, 744 46.8 107 1.4 > High school 8, 791 53.2 145 1.6 Residency Permanent residents in Wuxi 12, 943 78.3 198 1.5 Migrants 3, 592 21.7 54 1.5 Type of hosting institute Community health service center 6, 604 39.9 59 0.9 Hospital 3, 084 18.7 74 2.4 Center for disease control and prevention 6, 847 41.4 119 1.7 Risk category Casual non-commercial heterosexual behaviors 3, 237 19.6 15 0.5 Commercial heterosexual behaviors 4, 498 27.2 34 0.8 Male-male sexual behaviors 1, 867 11.3 143 7.7 Injection drug use 282 1.7 10 3.5 Prenatal health check 3, 025 18.3 1 0.03 Premarital health check 1, 056 6.4 2 0.2 Spouse/sexual partner tested positive 428 2.6 8 1.9 Other 2, 142 13.0 39 1.8 Previous HIV testing No 11, 349 68.6 165 1.5 Yes 5, 186 31.4 87 1.7 Syphilis Negative 15, 443 93.4 233 1.5 Positive 388 2.3 7 1.8 Unknown 704 4.3 12 1.7 Calendar year of initial test 2013 6, 058 36.6 83 1.4 2014 5, 446 32.9 81 1.5 2015 5, 031 30.4 88 1.7 Table 1. Characteristics of Individuals at First Recorded HIV Test at
A total of 11, 504 individuals had their first recorded HIV test in either 2013 or 2014. Of these, 655 (5.7%) retested HIV within 12 months (4.1% for PWCH, 17.1% for MSM, and 52.5% for IDUs). Among pregnant women, only 32 (1.0%) retested HIV within 12 months. In a multivariable analysis, repeat HIV testing within 12 months was associated with being male [adjusted odds ratio (aOR) = 1.7, 95% confidence interval (CI): 1.4-2.2], risk behaviors [commercial heterosexual behavior (aOR = 1.4, 95% CI: 1.1-1.6), male-male sexual behavior (aOR = 3.7, 95% CI: 2.7-4.9), and injection drug use (aOR = 9.9, 95% CI: 6.5-15.1)], and having taken HIV test previously prior to study baseline (aOR = 2.0, 95% CI: 1.6-2.4) (Table 2). About one-third of individuals (3, 657, 31.8%) had previous HIV testing (13.5% for PWCH, 36.9% for MSM, and 90.6% for IDUs).
Variables n Repeat Test* (%) Univariable Analysis Multivariable Analysis OR 95% CI P aOR 95% CI P Gender Female 7, 237 2.7 Ref Ref Male 4, 267 10.8 4.4 3.7-5.3 < 0.001 1.7 1.4-2.2 < 0.001 Age (year) < 30 7, 085 3.5 Ref Ref ≥ 30 4, 419 9.0 2.8 2.4-3.3 < 0.001 1.2 0.9-1.5 0.143 Marriage Not married 4, 511 4.8 Ref Ref Married 6, 993 6.3 1.3 1.1-1.6 0.001 1.1 0.9-1.3 0.678 Education ≤ High school 5, 405 6.5 Ref Ref > High school 6, 099 5.0 0.7 0.6-0.9 < 0.001 0.9 0.7-1.1 0.319 Resident Permanent residents 9, 445 5.8 Ref Migrants 2, 059 5.1 0.9 0.8-1.1 0.477 Type of hosting institute Community health service center 1, 969 6.5 Ref Ref Hospital 4, 623 5.5 0.8 0.7-1.0 0.095 1.0 0.8-1.3 0.885 Center for disease control and prevention 4, 912 5.6 0.9 0.7-1.1 0.151 1.0 0.8-1.3 0.847 Risk category Casual non-commercial heterosexual behaviors 3, 199 3.1 Ref Ref Commercial heterosexual behaviors 3, 186 4.1 1.3 1.1-1.7 0.041 1.4 1.1-1.6 0.032 Male-male sexual behaviors 1, 057 17.1 6.5 5.0-8.4 < 0.001 3.7 2.7-4.9 < 0.001 Injection drug use 286 52.5 9.2 6.8-11.6 < 0.001 9.9 6.5-15.1 < 0.001 Others 3, 776 2.5 0.8 0.6-1.1 0.164 0.8 0.6-1.1 0.114 Previous HIV testing No 7, 847 4.1 Ref Ref Yes 3, 657 9.2 2.4 2.0-2.8 < 0.001 2.0 1.6-2.4 < 0.001 Syphilis Negative 10, 980 5.6 Ref Ref Positive 205 9.3 1.7 1.1-2.8 0.025 1.2 0.7-2.0 0.585 Unknown 319 7.2 1.3 0.9-2.0 0.215 1.3 0.8-2.0 0.321 Calendar year of initial test 2013 6, 058 5.9 Ref 2014 5, 446 5.5 0.8 0.6-1.1 0.242 Note. *Repeat test was recorded if an individual retested within 12 months since their first recorded test during 2013-2014. Table 2. Factors Associated with Repeat HIV Testing among VCT Individuals in Wuxi,
Of the 16, 535 testers involved in this study, 252 (1.5%) were tested HIV-positive at their first recorded test including 1 pregnant woman. Of the 16, 283 testers who tested HIV-negative at their first recorded test, 1, 088 (6.7%) had two or more HIV testing records during 2013-2015. In this group, there were 30 HIV diagnoses in 1, 829 person-years of follow-up, with an overall incident HIV diagnosis rate of 1.6 (95% CI: 1.1-2.1) per 100 person-years [4.5 (95% CI: 3.7-5.2) for MSM, 0.8 (95% CI: 0.3-1.3) for IDU, and 0.6 (95% CI: 0.2-1.0) for PWCH]. The rates of incident HIV diagnosis were not significantly different between MSM < 30 and ≥ 30 years of age [5.0 (95% CI: 4.4-5.7) vs. 4.2 (95% CI: 3.8-4.7) per 100 person-years, χ2 = 3.312, P = 0.071]. No pregnant women had incident HIV diagnosis. Incident HIV diagnosis was associated with male gender [adjusted hazard ratio (aHR) = 8.5, 95% CI: 1.9-38.1], attending hospital-based VCT clinics (aHR = 7.8, 95% CI: 1.1-58.3), and male-male sexual behavior (aHR = 8.4, 95% CI: 1.5-46.7) (Table 3).
Variable Incidence (PY*) Univariable Analysis Multivariable Analysis HR 95% CI P Value aHR 95% CI P Value Gender Female 0.7 Ref Ref Male 3.6 4.7 1.8-12.3 0.001 8.5 1.9-38.1 0.005 Age (year) < 30 2.5 Ref Ref ≥ 30 1.2 0.5 0.3-0.9 0.011 0.6 0.3-1.3 0.192 Marriage Not married 2.5 Ref Ref Married 1.3 0.5 0.3-0.8 0.006 0.9 0.3-2.5 0.092 Education ≤ High school 0.9 Ref Ref > High school 3.4 3.8 2.0-7.1 < 0.001 1.0 0.5-2.1 0.958 Resident Permanent residents 1.7 Ref Migrants 1.5 0.9 0.5-1.6 0.812 Type of hosting institute Community health service center 0.3 Ref Ref Hospital 2.6 9.1 2.2-37.6 0.006 7.8 1.1-58.3 0.045 Center for disease control and prevention 2.0 6.8 0.9-51.9 0.064 3.7 0.5-29.6 0.206 Risk category Casual non-commercial heterosexual behaviors 0.4 Ref Ref Commercial heterosexual behaviors 0.6 1.5 0.6-4.2 0.183 3.9 0.7-22.9 0.132 Male-male sexual behaviors 4.5 10.2 2.4-42.3 0.001 8.4 1.5-46.7 0.016 Injection drug use 0.8 1.9 0.8-4.5 0.515 1.6 0.6-4.2 0.554 Others 0.5 1.4 0.2-9.8 0.746 1.5 0.2-10.9 0.685 Previous HIV testing No 1.2 Ref Ref vYes 2.0 1.7 0.9-3.5 0.059 1.0 0.5-1.9 0.964 Syphilis diagnoses at baseline Negative 1.5 Ref Positive 0.8 0.5 0.2-1.4 0.209 Unknown 1.7 1.1 0.3-4.2 0.851 Calendar year of initial test 2013 1.4 Ref 2014 2.1 1.5 0.2-11.7 0.702 2015 1.1 0.8 0.1-6.5 0.854 Note. *PY means person-year. Table 3. Factors Associated with Incident HIV Diagnosis in Individuals Presenting for
Between January 1, 2013 and December 31, 2015, a total of 1, 445 new HIV diagnoses were reported in Wuxi based on CNHCCIS. A total of 72 cases (5.0%) were excluded due to lack of baseline CD4+ T cell count. Of the remaining 1, 373, 272 (19.8%) were diagnosed in VCT clinics (Group Ⅰ) and 1, 101 (80.2%) from other clinical services (Group Ⅱ). As shown in Table 4, there was no significant difference in gender and age between Groups Ⅰ and Ⅱ (P > 0.05 for both), but the proportion of MSM in diagnosed cases was significantly higher at VCT clinics compared with that at other services (76.1% vs. 54.7%, P < 0.001). A higher proportion of earlier HIV diagnosis was detected in Group Ⅰ compared with that in Group Ⅱ (76.7% vs. 68.6%, P = 0.008). A higher proportion of individuals with a high baseline CD4+ T cell count > 500 copies/mm3 was detected in Group Ⅰ compared with that in Group Ⅱ (30.5% vs. 20.5%, P = 0.002). No significant difference was found in the interval between HIV diagnosis and baseline CD4+ T cell count measurement in the two groups (median 27 vs. 29 days, P = 0.851). A higher median baseline CD4+ T cell count was observed in Group Ⅰ compared with that in Group Ⅱ (median 407 vs. 326 copies/mm3, P = 0.003).
Characteristics HIV Diagnosis in VCT Clinics HIV Diagnosis from other Clinical Services P Value n % n % Total 272 100 1, 101 100 Gender Female 42 15.4 131 11.9 0.115 Male 230 84.6 970 88.1 Age (year) < 30 108 39.7 396 36.0 0.252 ≥ 30 164 60.3 705 64.0 Risk category Heterosexual transmission 63 23.2 476 43.2 < 0.001 Male-male sexual transmission 207 76.1 602 54.7 Drug injection 2 0.7 19 1.7 Others 0 0.0 4 0.4 Baseline CD4+ T cell count (copy/mm3) < 200 63 23.2 346 31.4 0.002 200-349 62 22.8 254 23.1 350-499 64 23.5 275 25.0 ≥ 500 83 30.5 226 20.5 Median 407 326 0.003 IQR 222-506 163-469 Days from HIV diagnosis to baseline CD4+ count measurement ≤ 30 168 61.8 652 59.2 0.851 31-90 64 23.5 305 27.7 > 90 40 14.7 144 13.1 Table 4. Characteristics and Baseline CD4+ T Cell Count in HIV-positive Individuals from
-
To our knowledge, this is the first study to report on repeat HIV testing and incident HIV diagnosis among individuals attending VCT clinics in China. We used the keywords 'repeat testing/retesting', 'HIV', and 'China' and searched English literature in PubMed and Chinese literature in the China National Knowledge Infrastructure (CNKI) database. However, we only found one remotely related publication[18]. In this paper, only the percentage of repeating HIV testers was reported. Previous studies on HIV testing usually defined repeat HIV testing according to respondents' self-reporting[19-20]. In our study, we evaluated repeat HIV testing based on the practical HIV testing behaviors, which would lead to a relatively accurate result. We found that the rate of repeat HIV testing is low among these individuals, while the rate of incident HIV diagnosis high, with MSM having the highest rates of prevalent HIV diagnosis, repeat HIV testing, and incident HIV diagnosis, compared with other groups. Overall, less than a third of individuals attending VCT clinic reported previous HIV testing, and only 6% had repeat HIV testing within 12 months. An overall incident HIV diagnosis rate of 1.6 per 100 person-years was estimated among VCT individuals in our study.
In our study, men engaging in commercial sex and non-commercial casual sex, and pregnant women accounted for the majority of individuals. The reason that female testers accounted for a significant proportion of individuals was that VCT clinics were set up in maternal and child health care institutions in Wuxi, China, to provide HIV VCT services for pregnant women, and over 3, 000 pregnant women were included in our study. These individuals had low rates of HIV diagnosis at first recorded visit (0.03%), repeat HIV testing (1.0%), and incident HIV diagnosis (none). MSM accounted for just over 10% of all individuals, had the highest rate of prevalent HIV (7.7%) and incident HIV diagnosis (4.5 per 100 person-years), and accounted for the majority of HIV cases (76%).
The rates of previous HIV testing and retesting within 12 months among MSM were still suboptimal, with less than half of MSM having taken HIV test previously and less than 1 in 5 MSM retesting within 12 months. These figures point to the necessity of enhancing sexual health education in MSM initially tested negative for HIV. A study from Switzerland found that the majority of patients would have liked their physicians to ask them questions concerning their sexual life and advise on safe sexual practices. However, only a small fraction of doctors consistently do so[21]. The proper explanation of the negative result and emphasis on safe sexual practice by doctors, nurses, and counselors at VCT clinics are crucial to the adoption of protective measures in order to avoid potential HIV transmission among individuals tested negative for HIV. Otherwise, individuals may continue to have high-risk sexual behaviors. In many countries, including China, the guidelines recommend that MSM should undergo HIV testing at least every 12 months, and MSM with high-risk sexual behaviors should test every 3-6 months[22-24]. Interventions aimed at increasing HIV testing rates among MSM attending VCT clinics are needed. Studies have shown that sexual-health-clinic-based interventions, including short text message reminder, emails, and electronic prompts on clinic computers, contributed to the increased HIV testing rates among MSM attending sexual health clinics[25]. These interventions warrant trials in VCT clinics in China. Studies showed that individuals who had repeat HIV testing were more likely to engage in high-risk behaviors[26-27]. Doctors should pay special attention to repeat testers and ensure timely HIV testing and health education.
We found that HIV cases diagnosed at VCT clinics were at earlier stage compared with those diagnosed at other services. The time intervals between HIV diagnosis and baseline CD4+ T cell count measurement were comparable between the two groups of cases. This result indicated that VCT clinics tended to attract people at earlier stage of HIV infection. Thanks to the scale-up of expanded HIV testing in China in the past few years, the country saw a steady increase in baseline CD4+ T cell count immediately after HIV diagnosis, from 221 copies/mm3 in 2006 to 314 copies/mm3 in 2012[28]. However, late HIV diagnosis was still common in China[29]. The median CD4+ T cell count of 407 copies/mm3 detected in our study was higher than that reported among newly diagnosed HIV cases in South Africa[30] of 364 copies/mm3 and other cities in China, such as Chongqing (302)[31] and Kunming (379)[32], but still lower than that in developed countries such as Australia (440)[33] and America (543)[34]. Measures are needed to further expand HIV testing coverage and increase HIV testing frequency among at-risk populations, in order to diagnose cases at earlier stage. More frequent baseline CD4+ T cell count measurements should be in place to avoid loss to follow-up among HIV-positive individuals on treatment.
Previous studies have reported that syphilis positivity was associated with incident HIV infection[35, 36]. However, only a small number of individuals were tested positive for syphilis at their first recorded test in our study, restricting the statistical power to detect syphilis infection as a risk factor for incident HIV diagnosis. The results indicated that individuals tested at hospital-based VCT clinics were almost eight times more likely to be diagnosed with HIV than those tested at VCT clinics affiliated to community health service centers. This may be largely due to the fact that patients in the hospital setting are most likely tested due to the illness that prompted their admission, while those at community sites are almost always healthy. In China, hospital-based VCT clinics are usually located in the dermatology and venereology departments. Previous studies showed that unprotected sexual behaviors were prevalent among individuals attending these departments in China[37]. MSM attending these departments often had anorectal symptoms such as anogenital warts and anal fistula, which are associated with elevated risk for HIV infection. In our study, nearly one-third of male individuals attending VCT clinics operated in hospitals reported having ever had male-male sexual behavior compared with only 5% among male individuals attending VCT clinics affiliated to community health service centers.
The results in our study had some potential limitations. Although a large number of testing records were used, the sample in our study may not represent the general population. As our study included all testing data from Wuxi from 2013 to 2015, the sample was representative of the Wuxi population in terms of test-seeking behavior and screening prevalence. Secondly, repeat testing rate could have been underestimated. Although the phone number is a relatively stable identifying variable, some individuals may change it at some stage. As a result, the same individual could have been counted multiple times if they reported different phone numbers at different visits. Fortunately, the great majority of individuals were permanent residents in Wuxi, and presumably only a few individuals would have changed their phone numbers during the study period. Thirdly, the national VCT individual questionnaire does not include detailed questions about individuals' sexual risk behaviors. Therefore, the impact of behavioral change on individuals' decision to have a repeat testing was not analyzed. Fourthly, we were not able to compare the risk behaviors in repeat testers between the testing encounters, because detailed information on the risk behavior were not collected in the standard questionnaire provided by Chinese CDC. Finally, the HIV testing records at services other than VCT clinics were not collected, restricting our ability to estimate the repeat testing and incident HIV diagnosis among individuals attending those services.
In conclusion, our findings suggest that repeat HIV testing remained uncommon among at-risk populations in China. VCT-clinic-based interventions aimed at increasing repeat HIV testing are needed to detect more cases at earlier stage, especially among individuals at high risk for HIV infection such as MSM. HIV testing at VCT clinics need to be further intensified to achieve frequent testing and earlier diagnosis of cases.
-
No conflict of interest to declare.
the Wuxi Municipal Health and Family Planning Commission QNRC033
the Wuxi Municipal Health and Family Planning Commission MS201613
Early Career Fellowship from Australian National Health and Medical Research Commission APP1092621
the Wuxi Municipal Health and Family Planning Commission ZDXK009
Wuxi Municipal Bureau on Science and Technology CSZ0N1512

 Quick Links
 DownLoad: