


HTML
-
Since 1980, the prevalence of overweight and obese individuals has increased dramatically[1]. Obesity is recognized as one of the most critical contributing risk factor for many diseases, such as cardiovascular disease, chronic kidney disease, and type 2 diabetes[2-4]. Some strategies have been proposed to lose weight, such as dietary restrictions, aerobic exercise, and exercise coupled with dietary restriction[5], which could help body weight control effectively, however, the incidence of obesity is still steadily increasing. On the one hand, people may fail to stick to long-term weight loss programs; on the other hand, some social factors, which are also important risk factors for obesity, have been ignored.
A primary research on social factors found that the consumption of food not only provides nutrients and energy needed to sustain life but also for social life, and that human eating behavior is highly complex[6]. Studies described that a person unconsciously imitated the behavior of companions, the behavioral mimicry played a particular role in social modeling of food intake. Interestingly, regardless of the type of food, the consumption of snack is distinguished by friends and strangers. In both male and female population, the familiarity between co-eaters could increase their food consumption, whereas unfamiliarity could suppress food intake[7]. Recently, several studies found that overweight and obese individuals were more vulnerable to their external social environment, which means the food intake of obese individuals is more likely affected by their co-eaters, especially with familiar individuals in the same weight stature[8-9]. However, these studies mostly used snack foods and were usually conducted in laboratories, what do not correspond to real life situations. In addition, most studies focused only on the imitation of food consumption in dyads but not on eating duration, chewing activity, and physiological mechanisms. Whether or not obesity or overweight physiology can be affected by facilitative effect of familiarity has not been well investigated.
Peripheral appetite hormones play physiologic and pathophysiologic roles in regulating body weight and may function as targets for obesity therapies. Gut hormones, such as anorexigenic postprandial cholecystokinin-8 (CCK-8), glucagon-like peptide 1 (GLP-1), and orexigenic ghrelin, are found in the gastrointestinal tract and are involved in regulation of food consumption[10-12]. GLP-1 is an anorexigenic factor that inhibits appetite and reduces food intake[13]. It is secreted by distal enteroendocrine cells in response to the intake of carbohydrates and fats[14-16]. CCK-8 is a hormone that sends feedback signals from intestinal endocrine cells in response to the intraluminal presence of nutrient digestion products. It produces satiation[17-18], and its effect can be enhanced by stimulation of the oropharynx sensory[19]. By contrast, ghrelin is a fundamental orexigenic gut hormone and temporal increase of food intake and body weight[20-22].
In present study, the co-eaters at same weight stature who usually have breakfast in the dining hall were used to examine the influence of familiarity on energy intake, eating behavior, and postprandial gut hormone concentration in both lean and overweight subjects was measured when they had breakfast in dyads.
-
One hundred and fifty-two healthy young males were recruited from Qiqihar Medical University in Qiqihar City via posters in the campus. Participants with tobacco use, alcohol consumption, eating disorders and low dietary restraint, bodyweight changes during the past three months, and taking medication on bodyweight, were excluded. All participants included in the current study had their breakfast regularly. As study was performed in Chinese population, the body mass index [BMI: weight (kg)/height squared (m2)] cut-off points for Chinese was used[23]. All subjects were divided into two groups (lean, 18.5 ≤ BMI ≤ 23.9; overweight, 24 ≤ BMI ≤ 27.9) and asked to complete a questionnaire which recorded their demographic data (age, major, grade, class, and dormitory). Subjects from the same class and dormitory longer than 2 years were recognized as friends, and those from different grades and majors were recognized as strangers. According to above criteria, 82 subjects were eligible, and they were paired into 41 co-eaters, including 10 in lean friends group (LF), 10 in lean strangers group (LS), 11 in overweight friends group (OF), and 10 in overweight strangers group (OS). Meanwhile, all pairs had to complete a visual analogue scale (VAS) questionnaire for familiarity when they had breakfast together. If the value of familiarity VAS in either of each co-eater was lower than 70 in LF and OF groups or greater than 40 in LS and OS groups, the dyad would be excluded[24]. In the end, according the score of familiarity VAS questionnaire in each pair, 56 participants, 7 pairs in each group, were included in our current analyses (Figure 1). Height, weight, waist circumference, and hip circumference of all participants were measured, and BMI and waist-to-hip ratio [waist (cm)/hip (cm)] were calculated before the study. The percentage of body fat was estimated by bioelectrical impedance analysis (OMRON HBF-306; Omron). All subjects were told that the aim of this study was to investigate the relationship between BMI and total cholesterol concentration, instead of its true purpose. All procedures were compliant with the Declaration of Helsinki, and the protocol was approved by the ethical committee of Qiqihar Medical University.
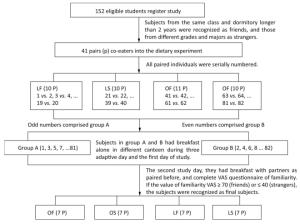
Figure 1. Participants screen and study design.
-
To reduce the confounding effects of previous food intake, we arranged three free consecutive eating days for 82 subjects. To avoid the changing of familiarity between all pairs in these three days, especially in OS and LS groups, we divided all individuals of each pair into temporary group A and group B. All paired individuals were serially numbered (the sequence of group was LF, LS, OF, and OS; the first one of each pair was an odd number, and the second one was an even number). The subjects who were marked with odd numbers comprised group A, and the subjects marked with even numbers comprised group B (Figure 1). During these three days, all participants in group A and B ate same breakfast, lunch, and dinner alone in different dining halls. After three consecutive days, the first day of the study began. Subjects from group A and B arrived at different canteens before 07:20 am with a 12-h overnight fast and a 24-h period without exercise. VAS questionnaire was used to measure participants' hunger and satiety sensations before breakfast[25]. Each VAS was 100 mm in length, from 'not at all' to 'extremely'. All participants marked their hunger and satiety sensations, and the average score was immediately calculated by SPSS. If VAS value showed no significant difference between OF and OS groups, and between LF and LS groups, fasting blood samples were then collected from the cubital vein by nurses in a clean and disinfected room in the canteen. After that, all subjects were presented with 200 g test food (5.1 kcal/g), which was divided into four equal pieces (50 g) with the same shape in a plastic dish. The same test food named pork pie and composed of carbohydrates, fats, and proteins (66% of energy from carbohydrates, 22% of energy from fats, and 12% of energy from proteins). They were told that they could eat as much as they want and could drink water ad libitum. If someone consumed whole 200 g piece, they could ask for more food. The total weight of the consumed test food was recorded and analyzed. All participants were restricted to other foods and exercise was controlled all day.
During the second day of the study, all subjects arrived at the same student canteen before 07:20 am after a 12-h overnight fast. VAS questionnaire was used to describe their hunger and satiety sensations. If no significant difference in VAS value was found between OF and OS groups, and between LF and LS groups, fasting blood samples were collected again from the cubital vein in a clean and disinfected room in the canteen. Subsequently, all participates were arranged to have breakfast with friends or strangers predetermined in pairs (sat at the dining-table face-to-face). Before having breakfast, they had to mark a VAS questionnaire of familiarity between each co-eater. Then the VAS values of each group were analyzed. If the value of familiarity VAS in either of each co-eater was lower than 70 in LF and OF groups or greater than 40 in LS and OS groups, the dyad would be excluded. The test food was provided, and participants' consumption was recorded as the first day. Then postprandial blood samples of 30, 60, 90, and 120 min were collected from the cubital vein in a clean and disinfected room in the canteen. Digital cameras which were hidden in the box (located next to the table on the sill) were used to record the dyad's eating behavior. Based on the same criterion, two experimenters independently viewed the video and calculated meal duration, talking time, and chews of every participant. Meal duration was the time from the start of the first bite to the end of the last bite, talking time was the time when the partners talked with each other face-to-face, and chewing frequency was defined as the number of chews for every 10 g food. Intraclass correlation coefficient (ICC) was used to test the interobserver reliability[26]. Highly reliable results of meal duration, talking time, and chewing frequency were obtained in our study (meal duration, ICC = 0.948; talking time, ICC = 0.984; chewing activity, ICC = 0.981). The subjects were given a money reward if they completed the experiment.
-
Blood samples were collected into chilled tubes containing EDTA-Na2 and aprotinin and then placed in an ice bath until centrifugation at 3, 000 rpm for 15 min at 4 ℃. Plasma was collected and stored at -80 ℃ for further analysis. Plasma glucose concentration were assessed with standard enzymatic methods in an auto-analyzer (AUTOLAB PM 4000, AMS Corporation, Rome, Italy). The concentration of plasma insulin, total ghrelin, CCK-8 and GLP-1 were measured using ELISA kits (Phoenix Pharmaceuticals, Burlingame, CA, USA). The standard range of the fasting insulin assay was 0-100 ng/mL. The sensitivities of these assays were CCK-8 0.06 ng/mL, ghrelin 0.13 ng/mL, GLP-1 0.11 ng/mL, and insulin 0.78 μIU/mL, respectively. The intra and inter variations of all hormone assays were less than 10% and 15%, respectively.
-
All data were presented as means ± SD. All statistical analyses were performed by using SPSS 17.0 (SPSS Inc), and P < 0.05 was considered as statistically significant. ICC was used to test the interobserver reliability of eating behavior, and ICCs were computed using a one-way random model. Student's unpaired t test was used to examine whether the two experimental groups (lean friends and lean strangers, overweight friends and overweight strangers) at same weight stature matched for the baseline indicators before they had breakfast in dyads. Two-factor ANOVA [status (lean/overweight) · familiarity (friends/strangers)] was used to analyze energy intake data generated from the second study day. Energy intake between familiar and unfamiliar peers at same weight stature was analyzed by a LSD post hoc test; Eating behavior between familiar and unfamiliar peers at same weight stature were analyzed using Student's unpaired t test. Multivariate analysis was used to examine the difference of postprandial gut hormone concentration at each time point between familiar and unfamiliar peers at same weight stature.
Subjects
Study Design and Protocol
Laboratory Tests
Statistical Analysis
-
Fifty-six participants were included in our study, filtered by VAS questionnaire of familiarity, 14 subjects in each group. The subjects' height, weight, waist circumference, hip circumference, BMI, waist-to-hip ratio and energy intake during breakfast in first study day were described in Table 1. There was no significant difference in these parameters between OF and OS groups, as well as between LF and LS groups.
Items LF (n = 14) LS (n = 14) OF (n = 14) OS (n = 14) Age (y) 20.7 ± 0.8 20.9 ± 1.2 21.1 ± 1.0 20.8 ± 1.1 Height (cm) 172.2 ± 4.2 173.3 ± 5.1 173.1 ± 5.3 173.6 ± 7.0 Weight (kg) 64.2 ± 2.9 65.6 ± 3.3 80.2 ± 6.1 79.9 ± 7.2 BMI (kg/m2) 21.7 ± 0.6 21.9 ± 0.8 26.7 ± 1.5 26.5 ± 1.3 Body fat (%) 17.1 ± 0.8 17.5 ± 1.6 23.1 ± 3.2 23.4 ± 3.7 Waist circumference (cm) 79.3 ± 4.4 81.5 ± 4.4 91.3 ± 5.9 90.8 ± 6.7 Hip circumference (cm) 95.1 ± 3.7 96.9 ± 3.9 102.8 ± 4.0 103.4 ± 5.2 Waist-to-hip ratio 0.83 ± 0.03 0.84 ± 0.03 0.89 ± 0.04 0.88 ± 0.03 Food intake in first day (g) 292 ± 48 289 ± 45 311 ± 53 306 ± 49 Energy intake in first day (kcal) 1, 489 ± 242 1, 472 ± 228 1, 586 ± 269 1, 563 ± 250 Note. LF: lean friends; LS: lean strangers; OF: overweight friends; OS: overweight strangers. Data are expressed as means ± SD. Table 1. Basic Characteristics of the Lean and Overweight Participants
As shown in Table 2, a significant difference of familiarity VAS values was found between friends and strangers groups (P < 0.01) both in lean and overweight participants. Preprandial appetite VAS, glucose and insulin concentration, and dietary satisfaction VAS were not significantly different between familiar and unfamiliar peers of both weight statures.
Items Lean Overweight LF (n = 14) LS (n = 14) OF (n = 14) OS (n = 14) Familiarity VAS (mm) 85.7 ± 14.9 26.0 ± 12.9## 87.5 ± 10.4 13.7 ± 8.4** Dietary satisfaction VAS (mm) 69.9 ± 13.2 67.6 ± 9.9 73.3 ± 11.7 70.0 ± 10.8 Preprandial hunger VAS (mm) 64.6 ± 9.4 67.0 ± 9.2 70.9 ± 9.8 68.6 ± 8.4 Preprandial satiety VAS (mm) 35.4 ± 9.0 33.9 ± 8.7 34.1 ± 8.8 33.2 ± 8.1 Preprandial glucose (mmol/L) 5.3 ± 0.4 5.2 ± 0.4 5.8 ± 0.4 5.9 ± 0.3 Preprandial insulin (μIU/mL) 1.3 ± 0.3 1.1 ± 0.3 3.2 ± 1.1 3.5 ± 1.0^^ Note. LF: lean friends; LS: lean strangers; OF: overweight friends; OS: overweight strangers. **Significantly different from OF group, P < 0.01; ##Significantly different from LF group, P < 0.01. ^^Significant difference between lean and overweight groups, P < 0.01. Data are expressed as means ± SD. Table 2. VAS, Glucose and Insulin Concentration in the Lean and Overweight Participants
-
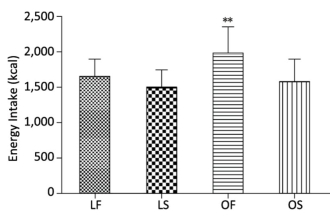
Main effects of status (P = 0.010) and familiarity (P = 0.001) were observed, but no significant interaction between status and familiarity (P = 0.137) on energy intake during breakfast was observed (Figure 2). Regardless of status, familiar subjects' energy intake was higher than unfamiliar dyads' during their breakfast (mean ± SD: energy intake, 1, 829 ± 339 vs. 1, 548 ± 266 kcal, P = 0.001). Compared with OS group, the subjects' energy intake was significantly higher in OF group when they had breakfast with companions (mean ± SD: energy intake, 1, 989 ± 365 vs. 1, 592 ± 297 kcal, P = 0.004, Figure 2). However, no difference was found in the LF and LS groups (mean ± SD: energy intake, 1, 670 ± 228 vs. 1, 505 ± 233 kcal, Figure 2).
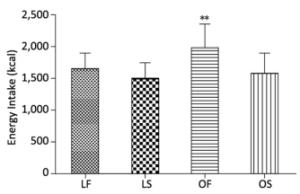
Figure 2. Mean ± SD energy intake by friends and strangers in lean (lean friends, n = 14; lean strangers n = 14) and overweight (overweight friends, n = 14; overweight strangers n = 14) subjects when they had breakfast with companions. A 2-factor ANOVA showed significant main effects of status (P = 0.010) and familiarity (P = 0.001) but no significant status · familiarity interaction (P = 0.451) on energy intake. **Significant difference between overweight friends and strangers (P = 0.001).
-
As shown in Table 3, a significant difference in meal duration (F = 0.189, P = 0.67; t = 0.85, P = 0.001), talking time (F = 6.10, P = 0.02; t = 9.63, P < 0.01), and chewing frequency per 10 g food (F = 0.39, P = 0.54; t = -3.89, P = 0.001) was found between OF and OS groups. However, in the same situation, only talking time was shown to exhibit significant difference between LF and LS groups (F = 19.89, P < 0.01; t = 6.79, P < 0.01).
Items Lean Overweight LF (n = 14) LS (n = 14) OF (n = 14) OS (n = 14) Meal duration (s) 436 ± 54 411 ± 54 482 ± 51 403 ± 59** Talking time (s) 98 ± 36 30 ± 10## 124 ± 31 35 ± 16** Chews/10 g 19.1 ± 1.9 20.5 ± 3.2 15.3 ± 1.9 17.9 ± 1.6** Note: LF: lean friends; LS: lean strangers; OF: overweight friends; OS: overweight strangers. **Significantly different from OF group, P < 0.01; ##Significantly different from LF group, P < 0.01. Data are expressed as means ± SD. Table 3. Influence of Familiarity on the Food Intake Parameters
-
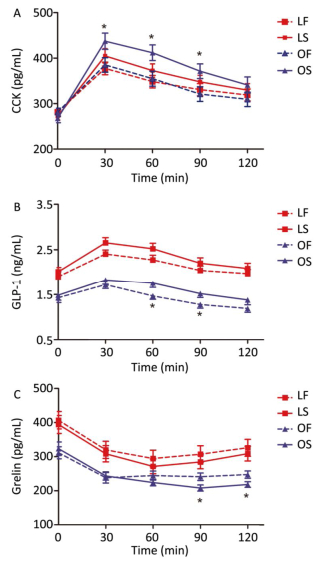
Postprandial CCK-8 concentration rapidly increased and peaked at 30 min, and then slowly decreased. Compared with that in the OS group, the plasma concentration of CCK-8 was significantly lower in OF group at 30 (F = 4.71, P = 0.039), 60 (F = 5.73, P = 0.024), and 90 min (F = 4.87, P = 0.036), but not at 120 min. In the lean subjects, no significant differences were found between LF and LS groups at all time points (Figure 3A). Among all participants, plasma GLP-1 concentration rapidly increased and then decreased. The OS group had higher GLP-1 concentration than the OF group, and significant difference was found at 60 (F = 5.63, P = 0.025) and 90 min (F = 4.58, P = 0.042). The LS group had higher GLP-1 concentration than the LF group, but no significant differences were found at all time points (Figure 3B). Postprandial ghrelin concentration decreased for a brief period, and then increased thereafter. Plasma ghrelin concentration was significantly higher in the OF group than in the OS group at 90 (F = 5.54, P = 0.026) and 120 min (F = 4.66, P = 0.040). Compared with the LS group, no significant difference was found at all time points in the LF group (Figure 3C).
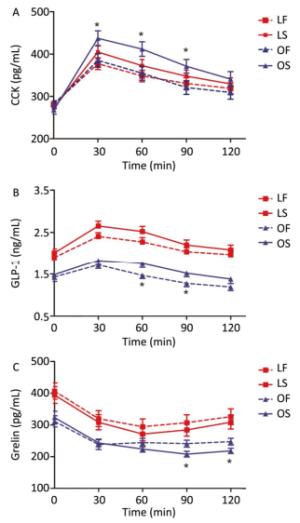
Figure 3. Mean ± SEM postprandial plasma gut hormone concentration over 120 min after eating with companions. LF: lean friends, (n = 14); LS: lean strangers, (n = 14); OF: overweight friends, (n = 14); OS: overweight strangers, (n = 14). *Significantly different from OS group, P < 0.05.
Baseline Assessment Data
Effect of Familiarity on Energy Intake
Effect of Familiarity on Eating Behavior
Effect of Familiarity on Gut Hormone Concentration
-
Numerous studies on social modeling of food intake have shown that familiarity plays an important role in the consumption of food; however, the results are mixed[27-30]. First, considerable researches on familiarity in same-gender dyadic partners confirmed that subjects consumed more food with friends than with strangers[28-29, 31-32]. However, another study reported that no similarities of food intake were found in dyads consisting of male friends or strangers[7]. Second, a majority of studies on familiarity focused on snack foods in laboratory setting and they reached almost the same conclusion that friendship reinforced overeating than unfamiliar relationship in both youths and adults[29-30]. However, a laboratory setting using snack foods did not fully reflect the natural social situation and normative influence. A few studies reported that different eating contexts, in which scripts or routines were available to guide an individual's eating behavior, would weaken the modeling effects of food intake[33]. Finally, the effect of friendship on food consumption has been described extensively, but the underlying mechanisms remain unclear. Moreover, in social eating context, the relationship between the change of eating behavior due to familiarity and gut hormone concentration is unclear. In present study, subjects who usually have breakfast in the dining hall were used to compare the difference of energy intake between familiar and unfamiliar partners with lean and overweight statures. Moreover, the relationship between familiarity and postprandial gut hormone concentration was examined.
Human food intake exhibits highly complex behavior that may be influenced by hunger and satiety sensations, food type and size, food satisfaction, dining condition, sex, familiarity, and weight stature of partners[34]. Therefore, the abovementioned factors were strictly controlled and analyzed in this study. In addition, to ensure that the dyad of friends and strangers in the same weight statures had similar internal environment, preprandial plasma glucose and insulin concentration were measured. The results showed no significant differences in plasma glucose and insulin between friends and strangers in the same weight stature (Table 2).
In the current study, the consumption of food was examined when all participants had breakfast alone, and the results suggested no significant difference between friends' and strangers' groups in both lean and overweight participants (Table 1). Then, energy consumption was examined in familiar and unfamiliar male dyads in the same social situation with similar weight statures. Our results showed that in the lean dyads, no difference was found in energy consumption between friends and strangers when they had breakfast together in the dining hall, which was consistent with earlier studies. This could be partly explained by that they may have a great drive for distinctiveness and did not match each other's intake[9] and that modeling effects of food intake were weaker in eating context due to scripts and routines guiding an individual's eating behavior[33]. However, in overweight participants, there was significant difference in food consumption between friends and strangers (Figure 2). This result was confusing, and it did not support the conclusions demonstrated in the above cited research. Conversely, it was supported by the discourse that people tend to eat more when they are paired with familiar than unfamiliar members, especially in those who are overweight[8]. Furthermore, OF group ate more food than OS group because overweight children may be more sensitive to the characteristics of their companions than normal weight peers[35]. To avoid incurring the stigma related to overweight individuals who eat excessively, they may attempt to adjust the consumption of food in front of strangers[36-37].
Simultaneously, meal duration, talking time, and chewing frequency per 10 g food were recorded using cameras hidden in the carton. The results confirmed these factors to be important for energy intake in individuals with different statures[38-39]. Some studies suggested a significant difference in mastication between lean and obese individuals[40-41], which may contribute to the large energy consumption of the obese population.
In the current study, compared with stranger dyads, talking time was significantly increased in familiar dyads, both lean and overweight subjects. However, only in overweight population, not in lean population, differences in meal duration and chewing frequency between familiar and unfamiliar individuals and longer meal duration and lower chewing activity among familiar than unfamiliar individuals were observed. Above all, the present results suggested that familiarity increased talking time in LF and OF co-eaters, but increased eating time and decreased chewing activity only in OF dyads, which were crucial factors for the difference in energy intake of overweight friends and strangers.
A majority of studies reported that peripheral appetite hormones played major roles in appetite regulation and eating behavior[12, 42-44]. The complex and highly coordinated system of peripheral appetite hormones has been widely studied in different weight statures, and anorexigenic (CCK-8 and GLP-1) and orexigenic (ghrelin) hormones from the gastrointestinal tract are the most important gut hormones involved in regulating appetite[45]. CCK-8 is secreted in response to luminal nutrient intake, which produces satiation[17, 46], and its effect on satiation is enhanced by orosensory stimulation[47]. Compared with normal weight subjects, postprandial GLP-1 concentration response to test meals was significantly reduced in overweight subjects[48]. By contrast, ghrelin is a fundamental orexigen gut hormone and affects eating behavior[20-21]. In the current study, the relationship between familiarity and gut hormone concentration in different weight stature dyads was investigated. The results showed that, compared with that in the OS group, the concentration of CCK-8 was significantly lower at 30, 60, and 90 min in the OF group, but no significant difference was found at all time points between LF and LS groups. Correspondingly, the concentration of GLP-1 was significantly lower at 60 and 90 min in the OF group than in the OS group, but no significant difference was found at all time points between LF and LS groups. Moreover, plasma ghrelin concentration was significantly higher in the OF group than in the OS group at 90 and 120 min, and no significant difference was observed in the LF and LS groups. According to the above results, facilitative effect of familiarity may be involved in changing of postprandial gut hormone concentration in overweight individuals.
There are some limitations in the current study. First, participants in our research are young men, which may make the result less generalized to other populations, such as women, children, and old men. Second, the causal relationship between behavior and gut hormones cannot be concluded.
-
In summary, our study showed that familiarity played an important role in energy intake in overweight population. Compared with OS, OF ate more food, chewed less, and had longer meal duration. Moreover, facilitative effect of familiarity may be involved in changing postprandial gut hormone concentration in overweight individuals. The cause for this finding may be due to familiarity, which inhibited the distinctiveness and routines of an individual's eating behavior. However, the effect of familiarity on eating behavior and the potential mechanism should be further studied.
-
The author(s) declared no potential conflicts of interest with respect to the research, authorship, and/or publication of this article.

 Quick Links
 DownLoad: