


HTML
-
Hepcidin is a small peptide that is synthesized by the liver and considered the main regulator of iron homeostasis. The expression of hepcidin in hepatocytes is induced by inflammatory generators, and it is considered an acute phase protein[1]. Hepcidin is a negative regulator of iron uptake in the small intestine and of iron release from macrophages. Hepcidin binds to 'ferroportin', the iron exporter protein; the binding results in the internalization and degradation of the transporter, thereby blocking the iron export from enterocytes and macrophages to the circulation[2]. Proinflammatory cytokines (IL-6, in particular) induce the expression and synthesis of hepcidin, causing iron deficiency anemia associated with inflammation and inflammatory diseases[3].
Injury of the liver, as any organ, results in a wound healing response that occurs in the liver tissue in the form of fibrosis[4]. Iredale[5] reviewed liver fibrosis models with differences that could be considered as advantages and/or disadvantages. The availability of animal models is essential for study of the pathology and pharmacology of hepatic diseases. Models of subchronic/chronic liver injury may be induced by many stressors, such as drugs, hepatotoxins, nutrient stressors, immunological agents, metabolic modifiers, or genetic stressors[6]. Among the models, hepatotoxins, such as carbon tetrachloride (CCl4) and thioacetamide (TAA), are the most specific for the liver and commonly used to induce subchronic/chronic liver injury. Both agents can induce apoptosis at low doses and necrosis at high doses (300 to 1, 000 μL/Kg for CCl4 and 100 to 300 mg/Kg for TAA; ip, twice weekly) and react with hepatic macromolecules to induce oxidative stress, which may have carcinogenic effects on the long run[7].
CCL4 should be metabolically activated in the liver to induce damage and is converted into trichloromethyl radical (CCl3•) by cytochrome P450 oxidase system (CYP2E1). In the presence of oxygen, the CCl3• radical is then converted into the highly reactive trichloromethylperoxy radical (CCl3OO•), which initiates hepatocyte membrane lipid peroxidation[8]. This activation cascade is associated with the production of several inflammatory cytokines and promotes liver fibrosis[9]. TAA needs two steps for activation in the liver to yield a reactive metabolite. TAA is first converted into thioacetamide sulfur oxide and then to thioacetamide sulfur dioxide via CYP450. The dioxide derivative is an unstable reactive metabolite, which initiates liver damage by a not yet fully understood mechanism. However, this derivative may bind to hepatocellular macromolecules, causing the upregulation of proteins related to lipid peroxidation and oxidative stress[10]. TAA does not inhibit the cytochrome P450 oxygenase system in contrast to CCl4 and other thionosulfur compounds. TAA also induces hepatocarcinogenesis by increasing the oxidative stress and decreasing the antioxidant enzyme function by sulfur dioxide[7].
However, several questions should be answered: does hepcidin expression and thus blood levels change from model to model; does the inflammatory stimulus, namely, IL-6, play the same enhancing role in both models; and do the iron metabolic patterns and blood images differ accordingly between both models?
This study aims to compare blood profiles and iron indices [serum iron, unsaturated iron binding capacity (UIBC), total iron binding capacity (TIBC), transferrin saturation%, and serum transferrin concentration] in CCL4 and TTA subchronic liver injuries by determining the underlying regulatory roles of hepcidin and cytokine IL-6.
-
CCl4 and TAA were purchased from Sigma-Aldrich, SL, USA via a local distributor. TIBC colorimetric reagent set was obtained from Pointe Scientific® Inc., MI, USA via a local distributor. Rat ferritin ELISA kit was acquired from Genway Biotec®, Inc., CA, USA, via a local distributor. RT-PCR Trizol reagent, Oligo (dT) primer, Superscript Ⅱ reverse transcriptase, Taq DNA polymerase, hepcidin, IL-6, and β-actin primers were supplied by Invitrogen, Carlsbad, CA. All other chemicals were of analytical grade and available from local distributors.
-
Thirty male albino rats aged 6 weeks and weighing 180-200 g were acclimatized under hygienic condition and given free access to clean water and balanced diet. The rats were then randomly separated into three groups (10 each group) in separate cages and subjected to different treatments. Subchronic liver injury/fibrosis was induced in groups 2 and 3 by repeated intraperitoneal injections of CCL4 (100 μL/100 g rat weight diluted as 1:4 in corn oil) or TTA (10 mg/100 g rat weight dissolved in isosaline) twice a week for 8 weeks (modified after Scholten et al.[11] and Wallace et al.[12], respectively). Control group (C) was injected with vehicles (corn oil and isosaline) at the same time. On the day after the last administration, blood samples were collected from the medial canthus venous plexus under light ether anesthesia. Two types of blood samples were saved. The first sample was received into EDTA tube for blood examination. The second sample was received into a plain sampling tube, left to coagulate, and centrifuged. Serum was harvested for determination of transaminases, iron, UIBC, and ferretin. After blood collection, the rats were sacrificed. The livers were removed, and pieces (100 mg) were submerged in Trizol reagent for RNA isolation and PCR. All procedures had ethical approval. The animals received daily human care, and the study protocols complied with our institutional guidelines. The study conformed to ARRIVE guidelines (http://www.nc3rs.org.uk/arrive guidelines) developed by the National Center for the Replacement, Refinement, and Reduction of Animals in Research (NC3Rs).
-
An auto-hematology analyzer (Mindray®, Model BC-2800Vet, Shenzhen, China) was used to determine erythrocytic parameters, including red blood cell (RBC) count, packed cell volume (PCV), hemoglobin concentration (HGB), mean cell volume (MCV), mean cell hemoglobin, and mean cell hemoglobin concentration; and leukocytic parameters, including total white blood cell count, lymphocyte, granulocyte, monocytes, and platelets (PLT) counts[13].
-
Serum biomarkers (ALAT and ASAT) in the liver were measured spectrophotometrically using diagnostic kits from Analyticon® (Lichtenfels, Germany) following the instructions of the manufacturer.
-
Serum Iron was determined based on the ferrozine principle described by Stookey[14] by using a diagnostic kit. Transferrin-bound iron in the sample (500 μL) was released at an acidic pH (2.5 mL of 220 mmol/L hydroxylamine hydrochloride in acetate buffer, pH 4.5) and reduced from ferric to ferrous. These ions reacted with ferrozine (50 μL, 16.7 mmol/L) to form a violet colored complex, which was measured spectrophotometrically at 560 nm wavelength.
TIBC was determined by calculation as the algebraic sum of the 'serum iron concentration' plus the 'UIBC'[15]. UIBC was determined first by ferrozine reaction after adding a known concentration (500 μL of the standard 500 μg/dL) of ferrous ions to the serum sample (500 μL) at an alkaline pH (Tris 500 mmol/L, pH 8.1). The ferrous ions will bind to transferrin at the unsaturated iron binding sites. The additional unbound ferrous ions were measured using the ferrozine reaction (adding 50 μL of the iron color reagent, namely, 16.7 mmol/L ferrozine and measuring the intensity of violet color at 560 nm). UIBC is the difference between the concentration of ferrous ions added and the unbound serum ions measured.
Transferrin saturation% was calculated as: [Serum iron (μg/dL)/TIBC (μg/dL)] × 100[16].
Serum Transferrin concentration was calculated from its correlation with TIBC, where one molecule of transferrin can bind to two molecules of iron at two high-affinity binding sites, by using the following equation according to previous works[17-18]:
$$ \text{TIBC }\left( \text{ }\!\!\mu\!\!\text{ mol/L} \right)\text{ = 25}\text{.1 }\!\!\times\!\!\text{ transferrin }\left( \text{g/L} \right) $$ (1) where (μg/dL) = 0.179 (μmol/L) according to SI conversion.
-
Ferritin, the iron storage protein, was determined by ELISA kit according to the instructions of the manufacturer. Ferritin in the serum samples reacted with anti-ferritin antibodies, which were adsorbed onto the surface of the polystyrene microtiter plate. After the removal of unbound proteins by washing, anti-ferritin antibodies conjugated with horseradish peroxidase (HRP) were added. These enzyme-labeled antibodies formed complexes with the previously bound ferritin. After another washing step, the enzyme bound to the immunosorbent was assayed by adding a chromogenic substrate, 3, 3′, 5, 5′-tetramethylbenzidine (TMB). The quantity of the bound enzyme varied directly with the concentration of ferritin in the sample tested. Absorbance was recorded using a microplate reader at 450 nm to measure the concentration of ferritin in the test sample.
-
Total cellular RNA was extracted from the hepatic specimens by Trizol reagent according to Chomczynski and Sacchi[19]. In brief, 100 mg of each liver tissue specimen was homogenized in 1 mL of Trizol reagent by using a power homogenizer (IKA Labortechnik Staufen, Staufen, Germany). The homogenized samples were transferred to 1.5 mL Eppendorf tubes and added with 0.2 mL of chloroform for phase separation. After vigorous shaking for 15 s, the samples were centrifuged at 12, 000 rpm and 4 ℃ for 15 min. The mixture separated into a lower red, phenol-chloroform phase, an inter-phase, and a colorless upper aqueous phase. RNA remained in the aqueous phase. For RNA precipitation, the aqueous phases were transferred to fresh tubes and added with 0.5 mL of isopropanol. The tubes were incubated at room temperature for 15 min and centrifuged again at 12, 000 rpm for 15 min. The RNA precipitate, which is often invisible before centrifugation, formed a gel-like pellet on the side and bottom of the tube. The pellets were washed in 75% ethanol after removal of the supernatant and recentrifuged. The washing alcohol solution was removed, and the pellets were left at room temperature for 10 min to dry up. The dried pellets were redissolved in RNase-free water according to the size of the pellet. RNA concentration was determined by recording their absorbance (A) at 260 and 280 nm with a spectrophotometer (the A260/280 values were less than 1.6 in all samples assuming no protein contamination). RNA samples were subjected directly to reverse transcription (RT).
RT was performed with RNA random primers by using RT-PCR kit (Takara Bio INC., Shiga, Japan) according to the instructions of the manufacturer. Aliquots of 2.5 μg of the isolated RNA in a suitable volume of RNase-free water (1-5 μL according to the concentration of RNA measured in the sample; preferred to be added lastly to avoid trans-contamination) were used for RT. The obtained first-strand complementary DNAs (cDNAs) were kept at -20 ℃ until PCR was performed.
PCR was performed using the same kit with rat hepcidin, IL-6, and β-actin primers prepared by nucleic acid synthesis system (Rikaken, Nagoya, Japan). The sense (forward) and antisense (reverse) sequences were 5′-GCT GCC TGT CTC CTG CTT-3′ and 5′-TTA CAG CAT TTA CAG CAG AAG AGG-3′ for hepcidin; 5′-TGA TGG ATG CTT CCA AAC TG-3′ and 5'-GAG CAT TGG AAG TTG GGG TA -3′ for IL-6; and 5′-TGT CAC CAA CTG GGA CGA TA-3′ and 5′-AAC ACA GCC TGG ATG GCT AC-3′ for β-actin.
The PCR products were size fractionated by 1.5% agarose gel electrophoresis starting with 70 V for 20 min and continuing with 120 V until aliquots reached the desired separation levels. The DNA bands were visualized with an ultraviolet trans-illuminator (UVP, CA, USA). Quantification of hepcidin, IL-6, and β-actin amplified DNAs was carried out by densitometric analysis using Scion Image 4.02 software (Scion Corporation, Maryland, USA), setting the control density as the unity and calculating hepatotoxins as folds.
-
Data are expressed as mean ± standard error of the mean of 10 (control) or 9 (groups 2 and 3) separate observations. Observations were compared using ANOVA followed by LSD as post-hoc test at P level of 0.05. All procedures of statistics and graphing were completed using the computer program GraphPad Prism® version 6 (GraphPad Inc., CA, USA).
Chemicals and Reagents
Animal Models and Study Design
Hemogram
Transaminase Assay
Iron/UIBC/TIBC Assay
Ferritin Assay
RT-PCR of Hepcidin and IL-6 in Hepatocytes
Data Presentation and Analysis
-
Nine of 10 rats in groups 2 and 3 survived until the end of the experimental course. The subchronic TAA and CCL4 treatments induced significant elevations of the liver enzymes, namely, AST and ALT, which indicated damage to liver cells. The values recorded after CCl4 were lower than those recorded after TAA (Table 1).
Parameter Weeks Control TAA CCl4 ALT (U/L) 8 23.87 ± 1.92 275.0 ± 14.3* 155.0 ± 11.3* AST (U/L) 8 29.53 ± 2.05 308.1 ± 18.9* 216.3 ± 12.6* Note. *Means significantly (P < 0.05) different from corresponding control; TAA: thioactamide, 10 mg/100 g rat weight, dissolved in isosaline; CCl4: carbon tetrachloride, 100 μL/100 g rat weight, diluted as 1:4 in corn oil; ALT: alanine aminotransferase; AST: aspartate aminotransferase. Mean ± SE, n = 9 for treated groups (twice weekly, for 8 weeks) and 10 for the control (isosaline/corn oil). Table 1. Transaminases as Liver Serum Biomarkers after Repeated i.p Injections of TAA and CCl4 to Rats Compared to Those of Normal Control
The erythrocyte and leukocyte parameters and those of platelets were significantly (P > 0.05) altered after repeated subchronic hepatotoxin injections compared with those in the control group (Tables 2, 3, and 4). Table 2 shows the diminished erythrocyte count, Hb concentration, hematocrit value, and erythrocytic indices toward anemic condition in the CCl4 model but not in the TAA model. Table 3 shows the data of leukogram, indicating significant leukocytosis with significant granulocytosis and insignificant lymphocytopenia. The altered leukogram was evident in both models. Table 4 shows that the platelets exhibited thrombocytopenia and decreased plateletcrit with insignificantly altered MPV index after subchronic treatment with both hepatotoxins and increased the PDW index only in the case of TTA. Thromocytopenia was more drastic in the TAA model than in the CCl4 model.
Erythrocytic Parameters Groups Control TAA CCl4 RBC (1012/L) 8.02 ± 0.31 7.12 ± 0.39 5.11 ± 0.34* PCV (%) 46.81 ± 2.63 39.37 ± 3.95 26.02 ± 2.14* HGB (g/dL) 15.21 ± 1.88 12.73 ± 0.82 8.21 ± 0.75* MCV (fL) 58.35 ± 1.73 55.29 ± 3.11 50.91 ± 1.52* MCH (pg) 18.97 ± 1.55 17.84 ± 1.15 16.07 ± 0.97 MCHC (g/dL) 32.51 ± 3.01 32.26 ± 2.25 31.56 ± 1.77 Note. *Mean significantly (P < 0.05) different from it; RBC: red blood count; PCV: packed cell volume; HGB: hemoglobin concentration; MCV: mean corpuscular volume; MCH: mean corpuscular hemoglobin; MCHC: mean corpuscular hemoglobin concentration; TAA: 10 mg/100 g rat weight dissolved in isosaline; CCl4: 100 μL/100 g rat weight diluted as 1:4 in corn oil. Mean ± SE, n = 9 for treated groups (twice weekly, for 8 weeks) and 10 for the control (isosaline/corn oil). Table 2. Erythrogram after Repeated i.p. Injections of TAA and CCl4 to Rats, Compared to that of Normal Control
Leukocytic Parameters Groups Control TAA CCl4 WBC (109/L) 13.53 ± 2.43 21.13 ± 2.13* 26.33 ± 2.30* Lymph. (%) 71.83 ± 3.53 67.41 ± 3.25 68.06 ± 3.19 Mid-sized (%) 2.44 ± 0.52 2.29 ± 0.23 3.07 ± 0.30 Gran. (%) 24.23 ± 0.75 30.38 ± 1.19* 29.41 ± 1.55* Note. *Mean significantly (P < 0.05) different from it. WBC: white blood cell; Lymph: lymphocytes; Mid-sized: mid-sized cells; Gran: granulocytes; TAA: 10 mg/100 g rat weight dissolved in isosaline; CCl4: 100 μL/100 g rat weight diluted as 1:4 in corn oil. Mean ± SE, n = 9 for treated groups (twice weekly, for 8 weeks) and 10 for the control (isosaline/corn oil). Table 3. Leukogram after Repeated i.p. Injections of TAA and CCl4 to Rats, Compared to that of Normal Control
Platelet Parameters Groups Control TAA CCl4 PLT (109/L) 655.6 ± 17.44 388.8 ± 11.2* 442.6 ± 14.2* PCT (%) 0.53 ± 0.02 0.36 ± 0.05* 0.45 ± 0.03* MPV (fL) 8.13 ± 0.41 9.26 ± 0.26 10.17 ± 0.28 PDW (%) 16.38 ± 1.02 22.48 ± 1.06* 19.12 ± 1.11 Note. *Mean significantly (P < 0.05) different from it; PLT: platelet; PCT: procalcitonin; MPV: mean platelet volume; PDW: platelet distribution width; TAA: 10 mg/100 g rat weight dissolved in isosaline; CCl4: 100 μL/100 g rat weight diluted as 1:4 in corn oil; Mean ± SE, n = 9 for treated groups (twice weekly, for 8 weeks) and 10 for the control (isosaline/corn oil). Table 4. Platelet Count and Indices after Repeated i.p. Injections of TAA and CCl4 to Rats, Compared to that of Normal Control
Serum analytical assays revealed significantly increased erythropoietin (EPO) concentration in the CCL4 group compared with that in the control and TAA group. The levels of serum iron, UIBC/TIBC, transferrin, and transferrin saturation% significantly decreased, and that of ferritin increased in the CCL4 group compared with those in the control rats. In the TAA model, the serum iron and iron indices changed toward iron overload, although this change was insignificant (Figure 1A-F).
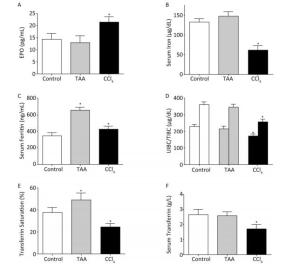
Figure 1. Changes in erythropoietin (A), serum iron (B), ferritin (C), UIBC/TIBC (D), transferrin saturation% (E), and serum transferrin concentration (F) in rats after repeated (twice weekly, for 8 weeks) i.p. injection of TAA (10 mg/100 g rat weight dissolved in isosaline) and CCl4 (100 μL/100 g rat weight diluted as 1:4 in corn oil) in comparison with normal rats (isosaline/corn oil); Mean ± SE, n = 9 for treated groups and 10 for the control. *P < 0.05.
RT-PCR analysis of the hepatic specimen revealed increased expression of hepcidin mRNA associated with increased expression of IL-6 mRNA in the CCL4 group. The TTA group showed unexpected significant decrease in hepcidin mRNA expression, and that of IL-6 did not significantly change (Figure 2A-B).
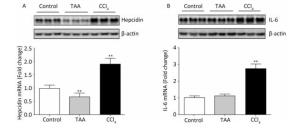
Figure 2. RT-PCR products and fold analysis of liver hepcidin (A) and IL-6 (B) mRNA expression in rats after repeated (twice weekly, for 8 weeks) i.p. injections of TAA (10 mg/100 g rat weight dissolved in isosaline) and CCl4 (100 μL/100 g rat weight diluted as 1:4 in corn oil) in comparison with normal rats (isosaline/corn oil); Mean ± SE of 3 observations; control value was set as the unit and those of hepatotoxins were set as folds. **P < 0.01.
-
Anemia is one of the most common blood disorders caused by disturbance of iron metabolism either as deficiency or as overload. Relative iron deficiency anemia associated with inflammatory liver disease is attributed to induced expression of the hepcidin gene. Hepcidin regulates iron availability into the blood circulation via an iron transport protein, namely, ferroportin. Ferroportin is the only known cellular iron exporter in vertebrates[2]. Hepcidin binds to ferroportin and causes its internalization and degradation in lysosomes. The loss of ferroportin from the cell membrane ablates iron efflux from iron exporting tissues into plasma. In ferroportin-deficient animals, iron accumulates in enterocytes, macrophages, and hepatocytes, indicating the key role of ferroportin, particularly in these cells[20]. When the amounts of iron stored are high, the liver produces hepcidin and releases it to circulation. By binding to ferroportin and causing its internalization, hepcidin blocks the sole pathway for transfer of iron from enterocytes to plasma. When the amounts of iron stored are low, hepcidin synthesis is suppressed; ferroportin molecules are expressed on enterocyte basolateral membranes and absorb iron from the enterocyte cytoplasm to plasma transferrin. A similar pathway occurs in macrophages that recycle aged RBCs and in hepatocytes that store iron.
Liver fibrosis is a pathological sequel after repeated or sustained wound healing response to chronic injury caused by many factors, including, hepatitis virus, alcohol, infection, metabolic disorders, and hepatotoxic drugs[21]. At present, liver transplantation is the only available treatment for liver fibrosis and cirrhosis. However, this treatment is costly and has moderate prognosis (moderate possibility of cure), hampered by limited number of liver donors. Therefore, additional clinical strategies for liver fibrosis must be developed. Experimental models of liver fibrosis are a research must. Chemically induced models of liver inflammation and fibrosis obtained by repeated administrations of CCl4 or TAA to rats and mice are extensively used because of their reproducibility and similarities to human liver fibrosis (can progress from a fibrotic stage into a cirrhotic stage or reverse the fibrotic process removal of the causative hepatotoxin)[22].
This study aimed to compare hemograms, iron homeostatic patterns, and underlying driving molecules, namely, hepcidin and IL-6, between two common models of liver fibrosis.
The establishment of liver fibrosis in both models was confirmed by elevation of liver transaminases (AST and ALT) that leaked to blood from the injured hepatocytes upon repeated administrations of either of hepatotoxins (Table 1). The values of both transaminases were markedly higher in the TAA model than those in the CCL4 model. This finding indicates the higher capability of TAA as a fibrosis inducer compared with CCL4, despite applying standardized doses of each hepatotoxin.
Repeated CCl4 injections for 8 weeks (subchronic) significantly decreased the RBC count, PCV, Hb, and MCV values compared with the normal control; however, the rest of the blood indices were minimally affected (Table 2). These findings could be explained on the basis of the reduced responsiveness to EPO (although elevated, Figure 2A) in the presence of inflammatory mediators and markers, such as C-reactive protein, hepcidin, and IL-6, which antagonize the response to EPO[23]. In addition, iron must be available for erythroid precursors in the bone marrow for erythropoiesis. In the present study, the serum iron level decreased in the CCl4 group compared with that in the control group (Figure 1B). This finding may be explained by the increased expression of hepcidin mRNA in the liver cells (Figure 2A) in the CCl4 group. The increased expression was found to be stimulated by the inflammatory cytokine, IL-6 (Figure 2B). This finding is consistent with the statement of Besarab and Coyne[24], who reported that increased hepcidin production decreased the efflux of recycled iron from splenic and hepatic macrophages and the release of iron from storage in hepatocytes, leading to functional iron deficiency and inflamed liver anemia. Hepcidin also binds to enterocytes, causing poor absorption of dietary iron.
The TAA model did not show significant changes in the hemogram of the subchronically affected animals. This finding could be explained by the suppression of hepcidin mRNA expression with no significant inhibitory effects on iron; by contrast, the serum iron level increased. Hepcidin expression was associated with the non-elevation of the inflammatory cytokine IL-6 (Figure 2). Although the fibrotic effect of TAA, indicated by higher transaminase levels, was more powerful than that of CCL4, it did not increase the hepcidin expression that is considered one of the positive inflammatory reactants. Moreover, EPO showed no significant changes in the TAA model.
Transferrin is a protein synthesized and released by the liver and is responsible for iron transport through the plasma. The expression of this protein increases in absolute iron deficiency to maximize the utilization of the limited iron available[25]. In inflammation, the ability of the diseased liver to synthesize proteins, including transferrin, is reduced. UIBC and TIBC could be alternative tests to transferrin. UIBC/TIBC and transferrin saturation % indicate the free iron binding sites on transferrin. These values increase in absolute iron deficiency but decrease in iron overload[26]. However, in the present study, all of the values decreased, despite the recorded reduction of serum iron because of the reduced transferrin concentration (Figure 1D-F) under the induced inflammatory condition. Therefore, iron and iron indices are considered appropriate tools for accurate etiologic diagnosis of anemia associated with iron deficiency[27]. Ferritin is an additional valuable test that differentiates between anemic conditions characterized by iron deficiency (whether absolute iron deficiency anemia or inflammatory anemia). Ferritin is the second major iron-containing protein after hemoglobin in the body. Unlike hemoglobin, ferritin acts only as iron storage and is found mainly in the cytoplasm of reticuloendothelial cells[28] as well as in the liver, spleen, bone marrow, and serum. A direct correlation exists between serum ferritin and total iron storage in the body. For each 1 ng/mL of serum ferritin, 10 mg of iron is stored in tissues and organs[29]. Decreased serum iron level and depleted ferritin under physiological levels is indicative of absolute iron deficiency anemia. However, decreased serum iron level and high ferritin in the context of decreased transferrin saturation is indicative of immune-driven iron sequestration in inflammation, infection, liver or kidney disease, and cancer[30]. Consistent with this statement, the present study indicated that low serum iron, high ferritin, and low UIBC/TIBC and transferrin saturation% (Figure 1) confirmed the presence of inflammatory anemia rather than iron deficiency anemia.
The TAA model demonstrated relatively higher iron (although insignificant), ferritin, and transferrin saturation%, with insignificant changes in the transferrin concentration and UIBC/TIBC. This finding may be explained on the basis of reduced hepcidin production with consequent iron disturbance toward iron overload rather than iron deficiency.
In contrast to hemogram, leukogram exhibited similar findings in both liver injury models in the form of leukocytosis and granulocytosis (Table 3). These findings are in accordance with literature, in which inflammation/infection is associated with leukocytosis as defense mechanism of the body's immune system.
Data of the platelet parameters showed thrombocytopenia and decreased plateletcrit value (Table 4). The findings may be explained on the basis of decreased thrombopoietin hormone production by the fibrotic liver[31].
-
The results show that although CCl4 and TAA are chemical hepatotoxins, they may differ regarding their effect on hepcidin expression, hepatic IL-6 expression, iron indices, and anemia occurrence. Increased expression of hepcidin and IL-6 and inflammatory iron deficiency anemia were found only in the CCl4 model but not in the TAA model. However, the effects on liver tissue (fibrosis), leukogram, and platelets are still parallel. These findings should be taken in consideration in diagnosis and therapeutics of liver disease and associated disturbed parameters.
-
Both authors contributed equally to this work, including in the concept and design, experiments and procedures, data analysis, and writing and revision of the article.
-
This research received no specific grant from any funding agency in the public, commercial, or not-for-profit sectors. The author(s) declare no potential conflicts of interest with respect to the research, authorship, and/or publication of this article.

 Quick Links
 DownLoad:
