


-
Regular physical activity plays a key role in the enhancement of physical, mental, social, and environmental health and the prevention of non-communicable diseases, including cardiovascular disease, metabolic syndrome, and cancer[1-3]. Systematic reviews reinforce global public health concerns that physical inactivity and sedentary behavior are associated with adiposity, cardiovascular disease, cognitive decline, and social behavioral problems in young people[4, 5]. Globally, the majority of children and adolescents are not sufficiently active to achieve the associated health benefits, with only 20% of youth (11–17 years old) meeting the minimum recommendation of 60 minutes of moderate-to-vigorous physical activity (MVPA) per day[6]. Childhood is a critical period for establishing physical activity and healthy lifestyle behaviors to prevent chronic disease[7]. There is an urgent need for effective surveillance and intervention programs to promote physical activity in the young population.
Traditional measurement strategies for children’s physical activity are self-report and objective measures. Self-report methods, including questionnaires and diaries, are often used in large-scale studies because they are convenient and affordable, whereas objective methods are preferred over self-report measures for their accuracy[8]. A plethora of devices, such as wristbands, smartwatches, fitness trackers, etc., which provide new ways to measure physical activity, show promise for future measurement of physical activity and have the potential to facilitate health behavior change[9]. Nowadays, wristband activity monitors have become popular for tracking daily physical activity. A national survey in the United States showed that approximately 60% of citizens used a wearable device to track their exercise routine in 2012[10]. It is predicted that the Asia-Pacific region, especially China, will be a fast-growing market for wearable technology, owing to the increase in population, technological advancements, and huge demand for health-related product[11]. Usability tests of wearable technology show that they are simple, user-friendly, affordable, and unobtrusive, suggesting that they have the potential to make objective methods more accessible for epidemiology studies on physical activity[12, 13].
Wearable monitors offer considerable potential to track physical activity and encourage health-promoting behavior, however, their ability to accurately measure targeted behavior requires thorough validation and evaluation[14]. To date, most evidence has been gathered on adults in a laboratory setting; therefore, little is known about the feasibility and accuracy of these monitors in a young population and under free-living conditions[15]. Assessing free-living physical activity to evaluate the monitors is particularly important due to the reflection of routine day-to-day behaviors and real-life situations[16]. Accelerometer-based measurements are most frequently used for physical activity assessment in free-living sittings and marketed exclusively as a research instrument to validate against physical activity monitors[17]. A recent systematic review evaluating wearable activity monitors indicated high validity of steps and lower validity of energy expenditure compared with accelerometer-based measurements in adults[18]. In this review, only two studies on children were identified, and both of them only explored the validity of sleep measures[19, 20]. Given that physical activity and engagement with technology are highly valued behaviors in children’s daily life, for either intervention or measurement purposes, it is important to establish whether wearable activity monitors effectively measure physical activity among a free-living young population.
The purpose of this study is to examine the reliability and validity of a commercially available wristband activity monitor using the ActiGraph accelerometer as a criterion standard among children aged 10–17 years in a free-living setting. We aimed to provide a feasible objective method for physical activity surveillance in children. An additional purpose is to determine the optimal number of days of data collection with a wristband activity monitor.
-
On the basis of existing data indicating that the correlation between consumer-level and accelerometer monitors would be greater than 0.35[18], we determined that a sample size of 82 would be able to detect this correlation with an alpha level of 0.05 and a power of 0.80. Children aged between 10 and 17 years (mean 13.1 years, SD 2.4) volunteered to participate in this study. 60 children were recruited from an elementary and a middle school in the Yanqing District, Beijing city (northern China), and 60 children from another elementary and middle school in the Wanzhou District, Chongqing city (southern China), selected by the Center for Disease Control and Prevention. The exclusion criteria were use of medications that could affect growth, known illness or injury, and problems that could reduce adherence to the study protocol. The parents of all participants received written and oral information about this study and signed a written informed consent. The study was conducted from March 2018 to June 2018 and was approved by the National Institute of Nutrition and Health, Chinese Center for Disease Control and Prevention (Ethics committee approval code: 2013-018).
-
The wristband activity monitor (the wristband) we chose to evaluate in this study is one of the most commonly used wearable activity trackers in China. The vendor of this wristband was the third largest in units sold worldwide in 2017 and had the largest year-over-year increases in the sale of wearable fitness trackers[11]. Moreover, this wristband was shown to have a smaller difference and higher correlation with indirect calorimetry for measuring physical activity energy expenditure, compared with two other common wristbands in Chinese people aged 22–27 years old[21]. This wristband is an activity monitor that is worn on the non-dominant wrist and combines data from a 3-dimensional accelerometer with heat rate data to estimate energy expenditure. Moreover, it can measure step count, distance traveled, physical activity, and sleep patterns, displayed on an LED tap screen. This monitor has a battery life of 7–15 days and can store approximately 10 days’ worth of information. It is water-resistant (50 m) and syncs to both Android and iOS systems with Bluetooth 4.0. It measures 40.3 mm × 15.7 mm × 10.5 mm and weighs 7 g.
-
The ActiGraph accelerometer (the accelerometer) was used as the criterion standard to assess children’s behavior on the basis of its established reliability and accuracy[22]. The ActiGraph wGT3X-BT (ActiGraph, LLC, Pensacola, Florida, USA) is a triaxial accelerometer worn on the waist using an elastic belt to secure above the right hip bone. Participants were instructed to wear both of the monitors all the time, even when sleeping, and to remove them only if the monitors would get completely wet, such as when showering or swimming.
The monitor was programmed to begin on the afternoon of the day of the first investigation and continue for 7 complete days, ending on the morning of the day of the last investigation. For this study, the accelerometer was set to record data at a sampling rate of 30 Hertz. Raw accelerometer data were downloaded using ActiLife 6 software (ActiGraph, LLC, Pensacola, FL, USA) and then transformed into 10 s epoch files. The intensity threshold for physical activity was the cut point derived by Vanhelst et al. (2011)[23], as it has been shown have good classification accuracy in Chinese children[24].
-
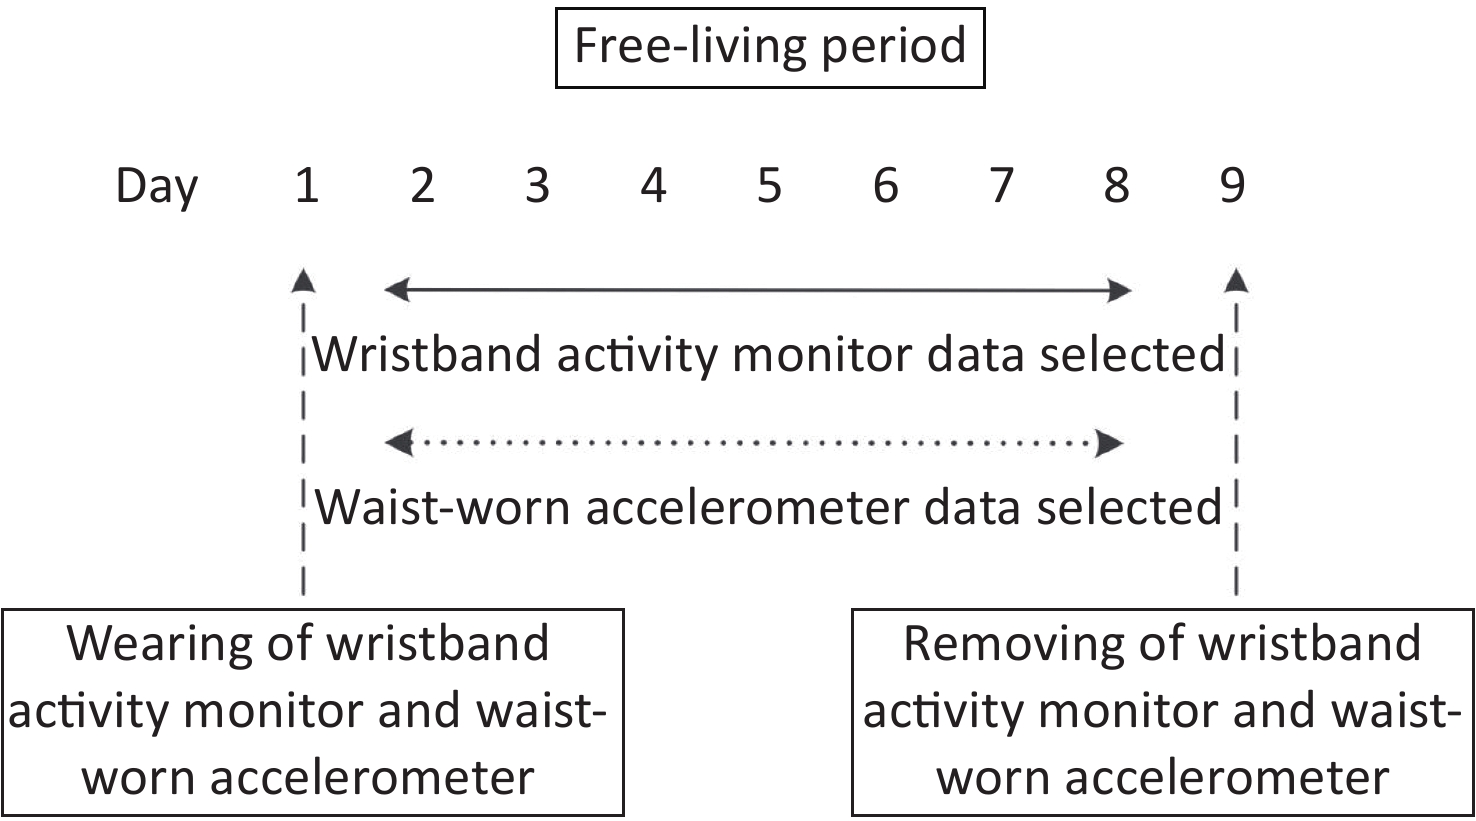
The study duration was 9 days (Figure 1). Instructions were given to the students by trained investigators on how to wear a wristband activity monitor and a waist-worn accelerometer concurrently for 7 days. An instruction leaflet on proper use of the two monitors were also given to the students for additional guidance.

Figure 1. Timeline of the study protocol.
Investigators came to the schools before the start of activity monitoring, referred to as day 1, for study orientation, placement, and instructions for the wristband and accelerometer. Participants wore both of the two monitors on day 1. Activity monitoring data were collected for 7 consecutive days, referred to as days 2–8. The participants keep a log in which they recorded non-wear time and reasons for removal. The day after the 7-day collection period, the participants returned the two monitors to research team at school. The wearing time of the accelerometer is 24 hours (h) for 7 days; it has been indicated that a minimum of 4 days with more than 6 h of wearing time per day provides a reliable estimate of physical activity in children[25]. Children’s information on age, gender and parents’ education level were self-reported. Following a standard protocol, weight and height were measured twice to the nearest 0.1 kg and 0.1 cm, respectively, by using an electronic stadiometer (Hochoice, EF07). The study procedure followed the recommendation of recent reliability and validation methodologies for wearable sensor monitoring[26].
-
All statistical procedures were performed using SAS 9.4 software (SAS Institute Inc., Cary, NC, USA). The significance level was set at P < 0.05. Descriptive characteristics were presented as x ± s or M (interquartile range; IQR). Univariate ANOVA procedures or χ2 tests were used to examine differences in the anthropometric characteristic of the sample. The physical activity variables assessed were number of steps, time spent on physical activity by intensity, namely MVPA, vigorous-intensity physical activity (VPA), moderate-intensity physical activity (MPA) and light-intensity physical activity (LPA), and physical activity energy expenditure. A Shapiro-Wilk test was used to determine whether the data were normally distributed. For inter-device reliability, the intraclass correlation coefficient (ICC) was used to assess the consistency over time since the activity monitor gathered multiple days’ worth of measurements. The strength of reliability was interpreted on the basis of the following definitions: strong (ICC ≥ 0.75), good (ICC = 0.60–0.74), fair (ICC = 0.40–0.59) and poor (ICC < 0.40)[27]. Differences between daily means were tested using repeated measures analyses of variance (PROC MIXED). Age, gender and Body Mass Index were included as adjustment variables in the analysis of variance model.
Spearman’s correlation coefficients (rho) were applied to assess validity when data were non-normally distributed. Rho ≥ 0.70 implied strong, 0.50–0.70 moderate, and ≤ 0.50 weak[28]. To enable comparison between the two monitors, the median of absolute percentage error (MAPE) was calculated: [(Wristband output − Observer data)/Observer data] × 100%. The Bland and Altman method provided the agreement between the two measurements and gives an indication of random error and bias. The optimal number of repeated measures for the wristband monitor was estimated by applying the Spearman-Brown prophecy formula. This formula was k × ICC/[1 + (k − 1) × ICC] = 0.8, which means the between-person variance was at least 80% of the total variance. The optimality criterion was k, which represents the number of repeated measures needed to obtain the desired reliability.
-
Out of 120 recruited children, 99 (82.5%) were included. The data from 21 children were excluded due to technical problems with the device and failure in performing the task on 5 required valid days. As shown in Table 1, the gender distribution was approximately equal, with 48 boys (BMI: 21.1 ± 5.3) and 51 girls (BMI: 19.2 ± 3.2), a mean age of 13.0 (s: 2.5) years, and 48.5% overweight or obese. There were no significant differences in mean age, weight, height, BMI, and household education between students included and excluded from the analyses.
Participant characteristics All Boys Girls P value* Sample number 99 48 51 − Age1 mean ± SD 13.0 ± 2.5 13.3 ± 2.5 12.8 ± 2.4 0.265 Height (m)a mean ± SD 1.6 ± 0.1 1.6 ± 0.2 1.5 ± 0.1 < 0.001 Weight (kg)a mean ± SD 49.8 ± 17.2 55.9 ± 19.9 44.0 ± 11.7 < 0.001 BMI (kg/m2)a mean ± SD 20.1 ± 4.5 21.1 ± 5.3 19.2 ± 3.2 0.025 BMI categories n (%) Overweightb 29 (29.3%) 18 (37.5%) 11 (21.6%) 0.083 Obeseb 19 (19.2%) 13 (27.1%) 6 (11.8%) 0.054 Ethnicb n (%) Majority 91 (91.9%) 53 (93%) 57 (90.5%) 0.517 Minority 8 (8.1%) 4 (7%) 6 (9.5%) Father's educationb n (%) None, primary or unknown 8 (8.1%) 5 (10.4%) 3 (5.9%) 0.479 Secondary 53 (53.5%) 28 (58.3%) 25 (49.0%) college, university of trade 38 (38.4%) 15 (31.3) 23 (45.1%) Mother's educationb n (%) None, primary or unknown 14 (14.2%) 8 (16.7%) 6 (11.8%) 0.245 Secondary 43 (43.4%) 25 (52.0%) 18 (35.3%) college, university of trade 42 (42.4%) 15 (31.3%) 27 (52.9%) Note. BMI = body mass index. *P values, which were calculated by univariate ANOVA procedures or χ2 test of variances between genders. aDescribed as x ± s because of the normal distribution. bDescribed as absolute number (percentage) because of categorical data. Table 1. Characteristics of the study population
-
The median (25th, 75th quartile) values of each physical activity variable and ICC across 7 days from the wristband and the accelerometer are shown in Table 2. The test for normality revealed that physical activity variables were non-normally distributed. The ICC for median values of physical activity variables across the 7-day wristband measurements ranged from 0.71 to 0.82, less than that of accelerometer measurements (ICC: 0.72–0.91). As measured by the wristband, there was no difference across days for steps, time spent on total physical activity and LPA, whereas only accelerometer measurements of LPA and MPA showed no significant difference.
Physical activity variables Wristband activity monitor Accelerometer Average per daya ICCb 95% CIb P valuec Average per daya ICCb 95% CIb P valuec Steps 7,244.0 (4,590.5–10,205.5) 0.71 0.62–0.79 0.320 8,331.0 (6,002.5–10,737.5) 0.72 0.62–0.80 0.019 PA (min) 166.0 (102.5–233.5) 0.76 0.68–0.83 0.723 146.0 (106.3–196.8) 0.87 0.82–0.90 0.032 MVPA 89.0 (54.0–137.0) 0.81 0.75–0.86 0.015 54.5 (38.1–74.5) 0.76 0.68–0.83 0.005 VPA 34.0 (14.0–58.0) 0.71 0.61–0.80 0.023 15.3 (6.7–23.5) 0.75 0.66–0.82 < 0.001 MPA 52.0 (27.0–85.0) 0.82 0.75–0.87 0.003 38.5 (25–52.5) 0.83 0.77–0.87 0.075 LPA 66.0 (34.5–101.5) 0.81 0.75–0.86 0.368 91.0 (59.8–126.5) 0.91 0.88–0.93 0.052 PAEE (kcal) 112.0 (71.0–162.5) 0.76 0.68–0.83 0.004 327.9 (217.1–485.7) 0.86 0.82–0.90 < 0.001 Note. PA = physical activity; MVPA = moderate-to-vigorous physical activity; VPA = vigorous-intensity physical activity; MPA = moderate-intensity physical activity; LPA = light-intensity physical activity; PAEE = physical activity energy expenditure; ICC = Intraclass Correlation Coefficients; CI = Confidence Interval. aData were described as median (25th quartile, 75th quartile). bThis is the intraclass correlation coefficient and 95% confidence interval across the 7 days. cThis is the P value for between-day differences using repeated measures analysis. Table 2. Reliability and summary statistics for the wristband activity monitor and accelerometer
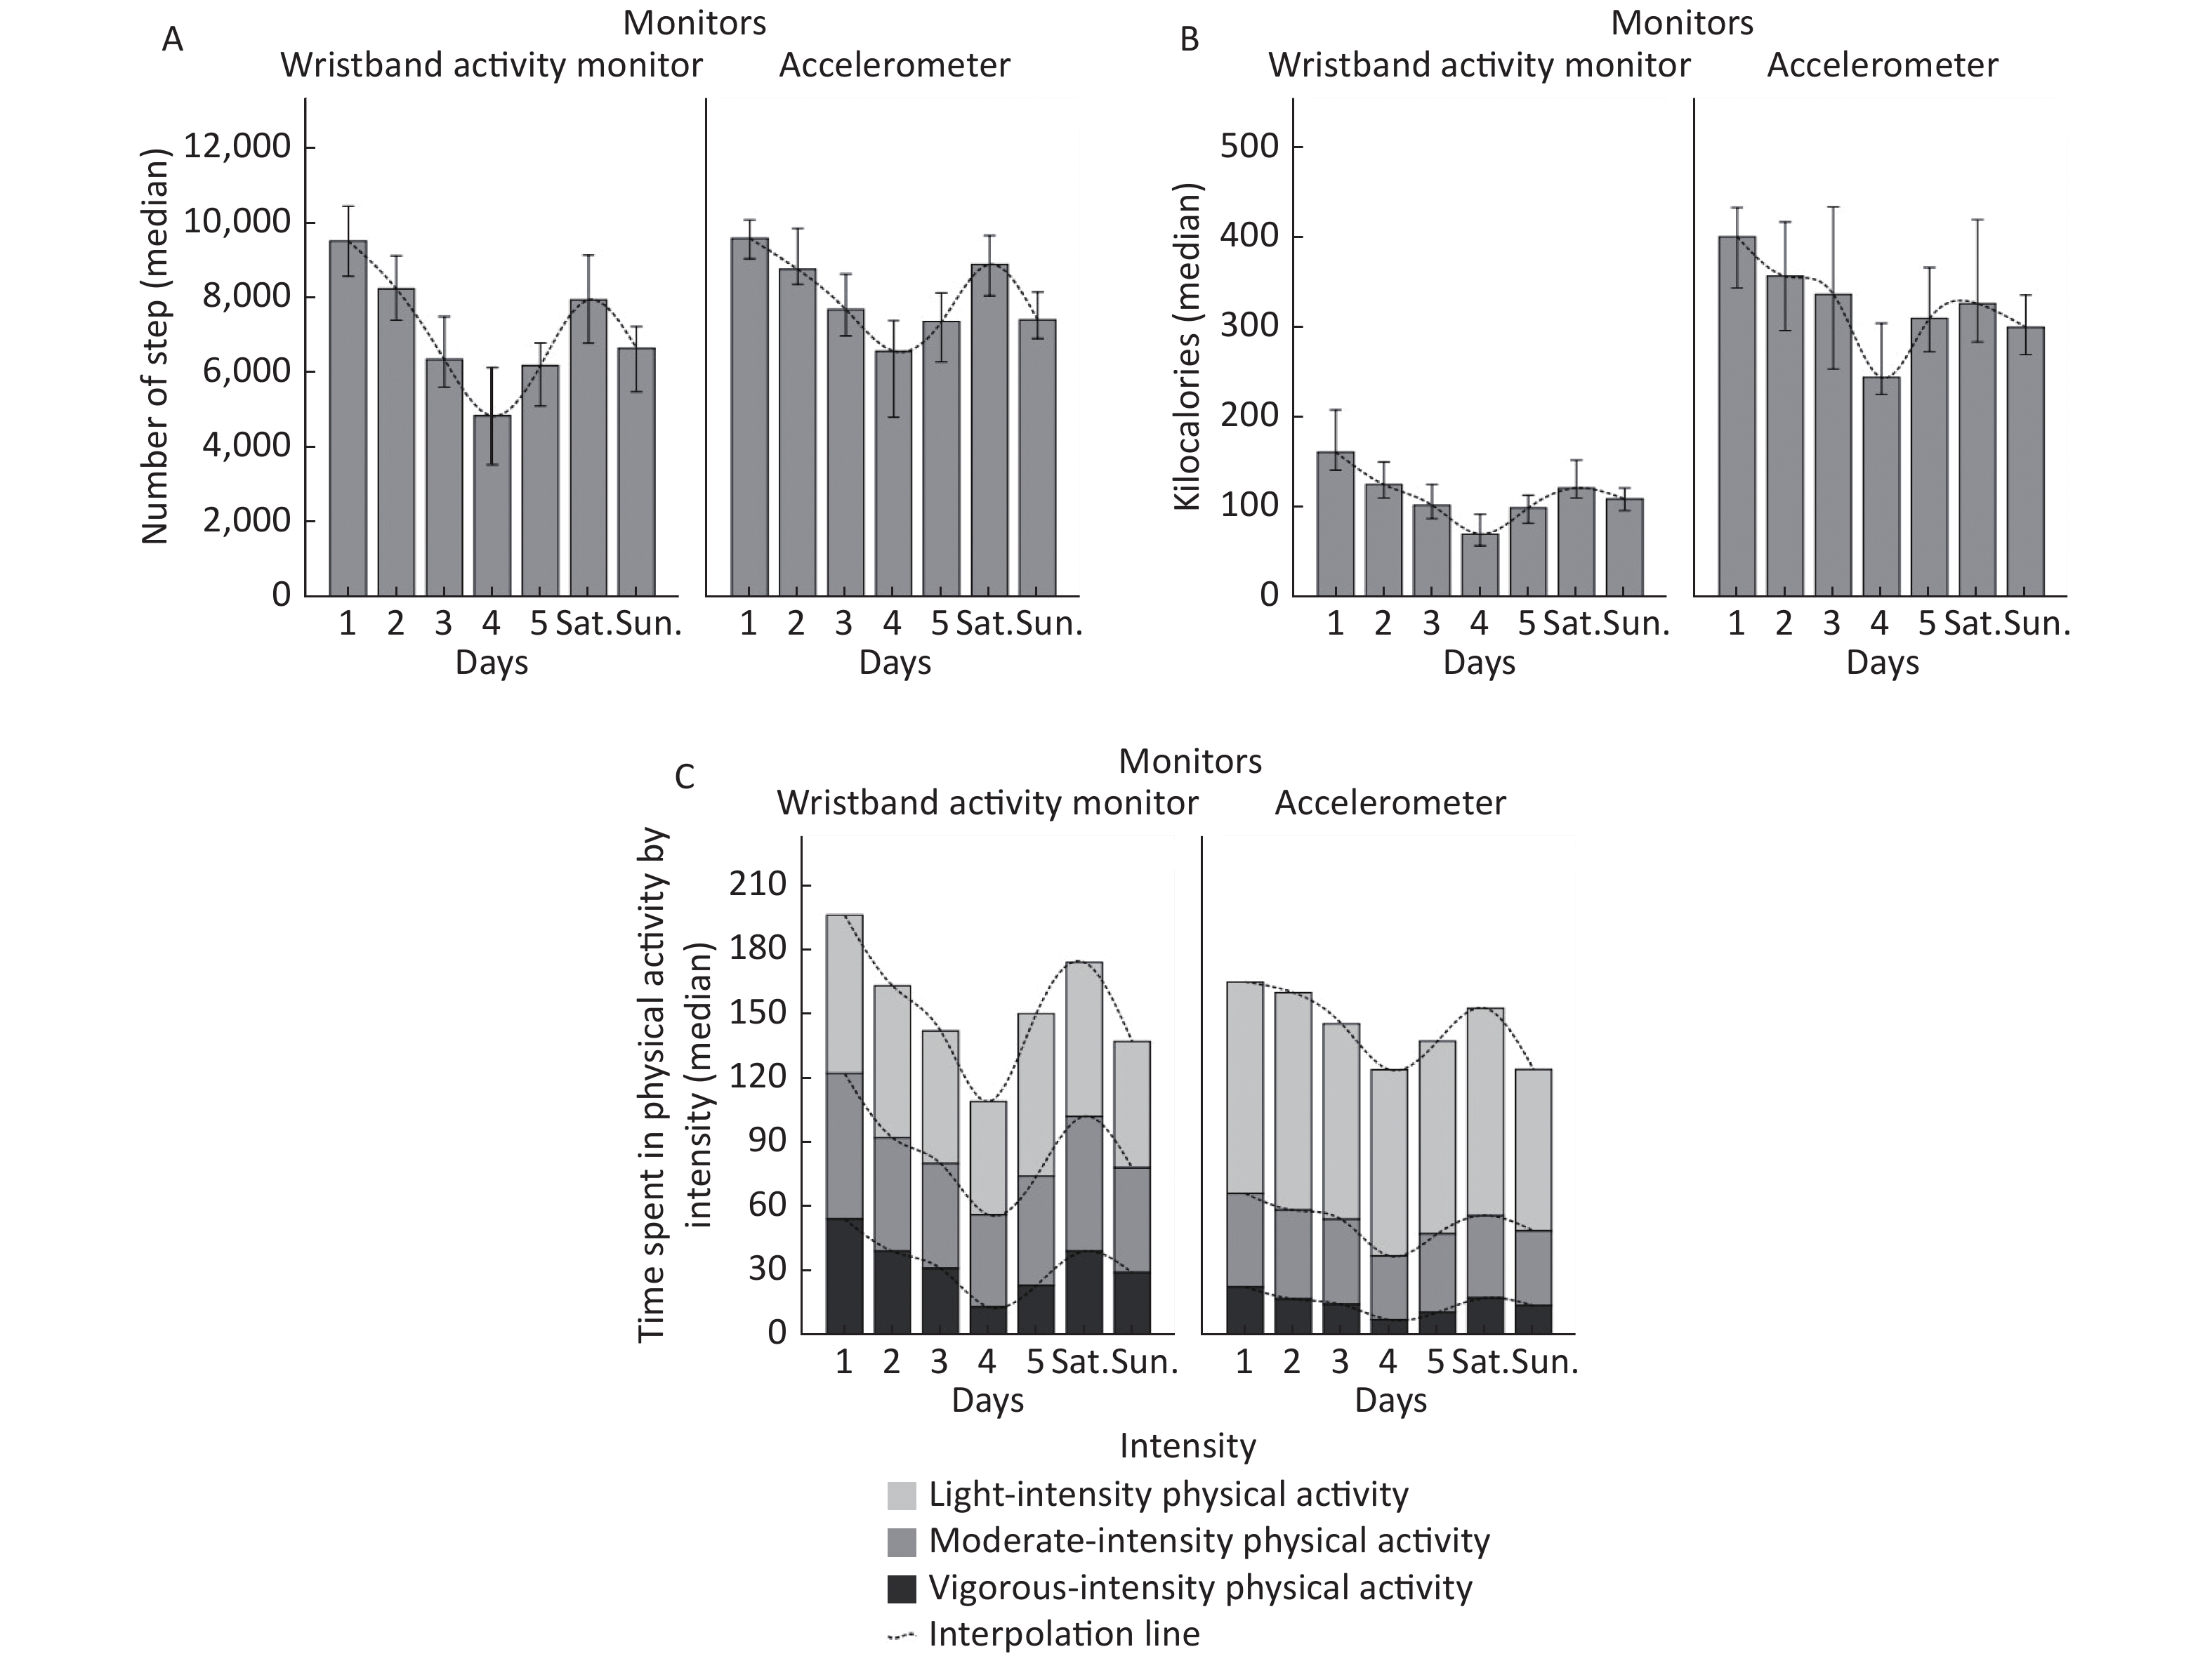
The highest level of physical activity occurred on day 1, and the lowest level was on day 4 (Figure 2). The daily patterns of steps, physical activity energy expenditure, and time spent on physical activity by intensity were similar between the two monitors. By using the Spearman-Brown prophecy formula to determine the optimal number of days for activity data collection, it was suggested that a minimum of 3 days of wristband measurement would be required to achieve an ICC of 0.8.
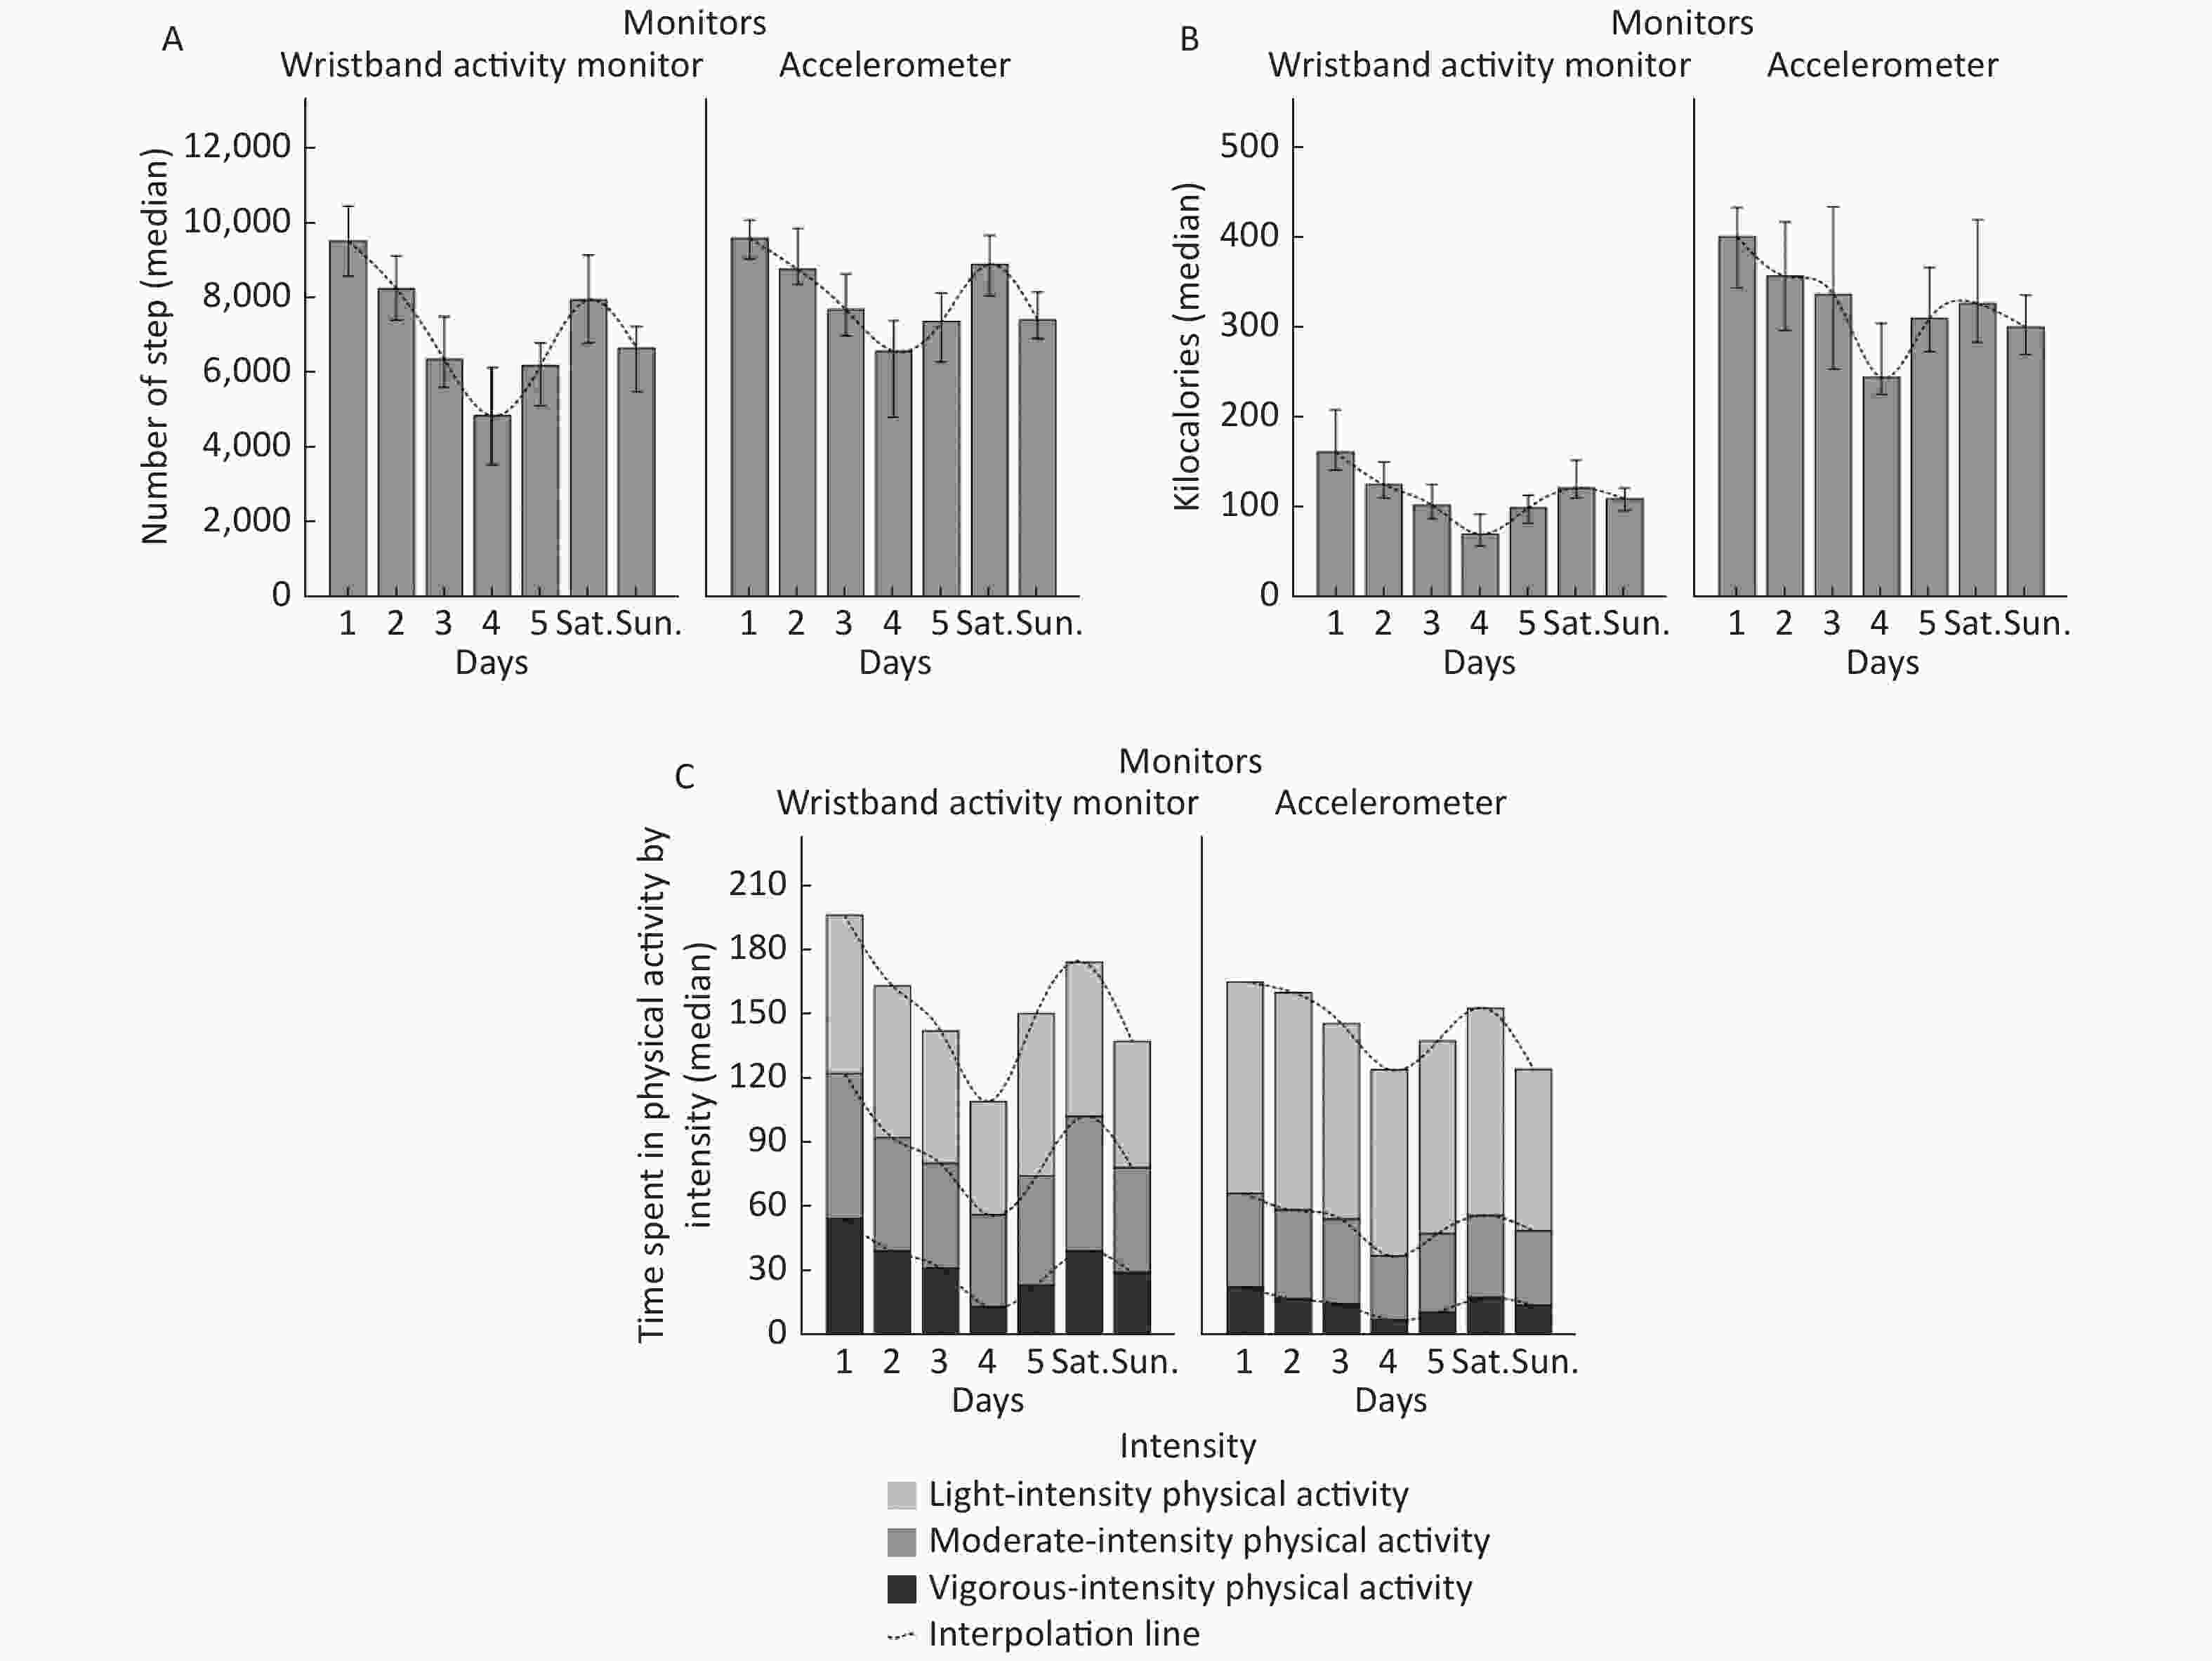
Figure 2. Average number of steps (A), kilocalories (B), and time spent on physical activity by intensity (C) per day from wristband activity monitor and accelerometer.
-
The correlation between 7-day averages for the wristband and the accelerometer was strong for steps (rho: 0.72). For time spent on total physical activity, MVPA, VPA, and physical activity energy expenditure correlations were moderate (rho: 0.51 to 0.63), while for MPA (rho: 0.38) and LPA (rho: 0.45), they were week (Table 3). When each day was examined separately, the correlation coefficients were significant, and the lowest correlation coefficients appeared on Sunday or Day 1. Results from the analyses of MAPE demonstrated that the errors of steps and time spent on total physical activity measurement by the wristband were low (MAPE < 15%), but time spent on different intensities of physical activity and physical activity energy expenditure were relatively high (range from 29.1% to 95.9%).
Physical activity variables Spearman’s correlations between Wristband activity monitor and Accelerometer* MAPE (%) between the two monitors Day 1 Day 2 Day 3 Day 4 Day 5 Saturday Sunday 7-day average Steps 0.58 0.74 0.78 0.76 0.79 0.64 0.54 0.72 −14.5 PA (min) 0.51 0.66 0.74 0.68 0.74 0.55 0.34 0.63 8.0 MVPA 0.30 0.40 0.67 0.66 0.65 0.41 0.41 0.55 61.2 VPA 0.20 0.36 0.60 0.55 0.52 0.39 0.40 0.51 95.9 MPA 0.15 0.33 0.49 0.56 0.42 0.38 0.09 0.38 36.1 LPA 0.35 0.39 0.63 0.51 0.52 0.41 0.20 0.45 −29.1 PAEE (kcal) 0.51 0.64 0.66 0.56 0.49 0.53 0.46 0.57 −68.1 Note. PA = physical activity; MVPA = moderate-to-vigorous physical activity; VPA = vigorous-intensity physical activity; MPA = moderate-intensity physical activity; LPA = light-intensity physical activity; PAEE = physical activity energy expenditure; MAPE = median of absolute percentage error. *All P < 0.001. Table 3. Validity and MPAE of wristband activity monitor with accelerometer
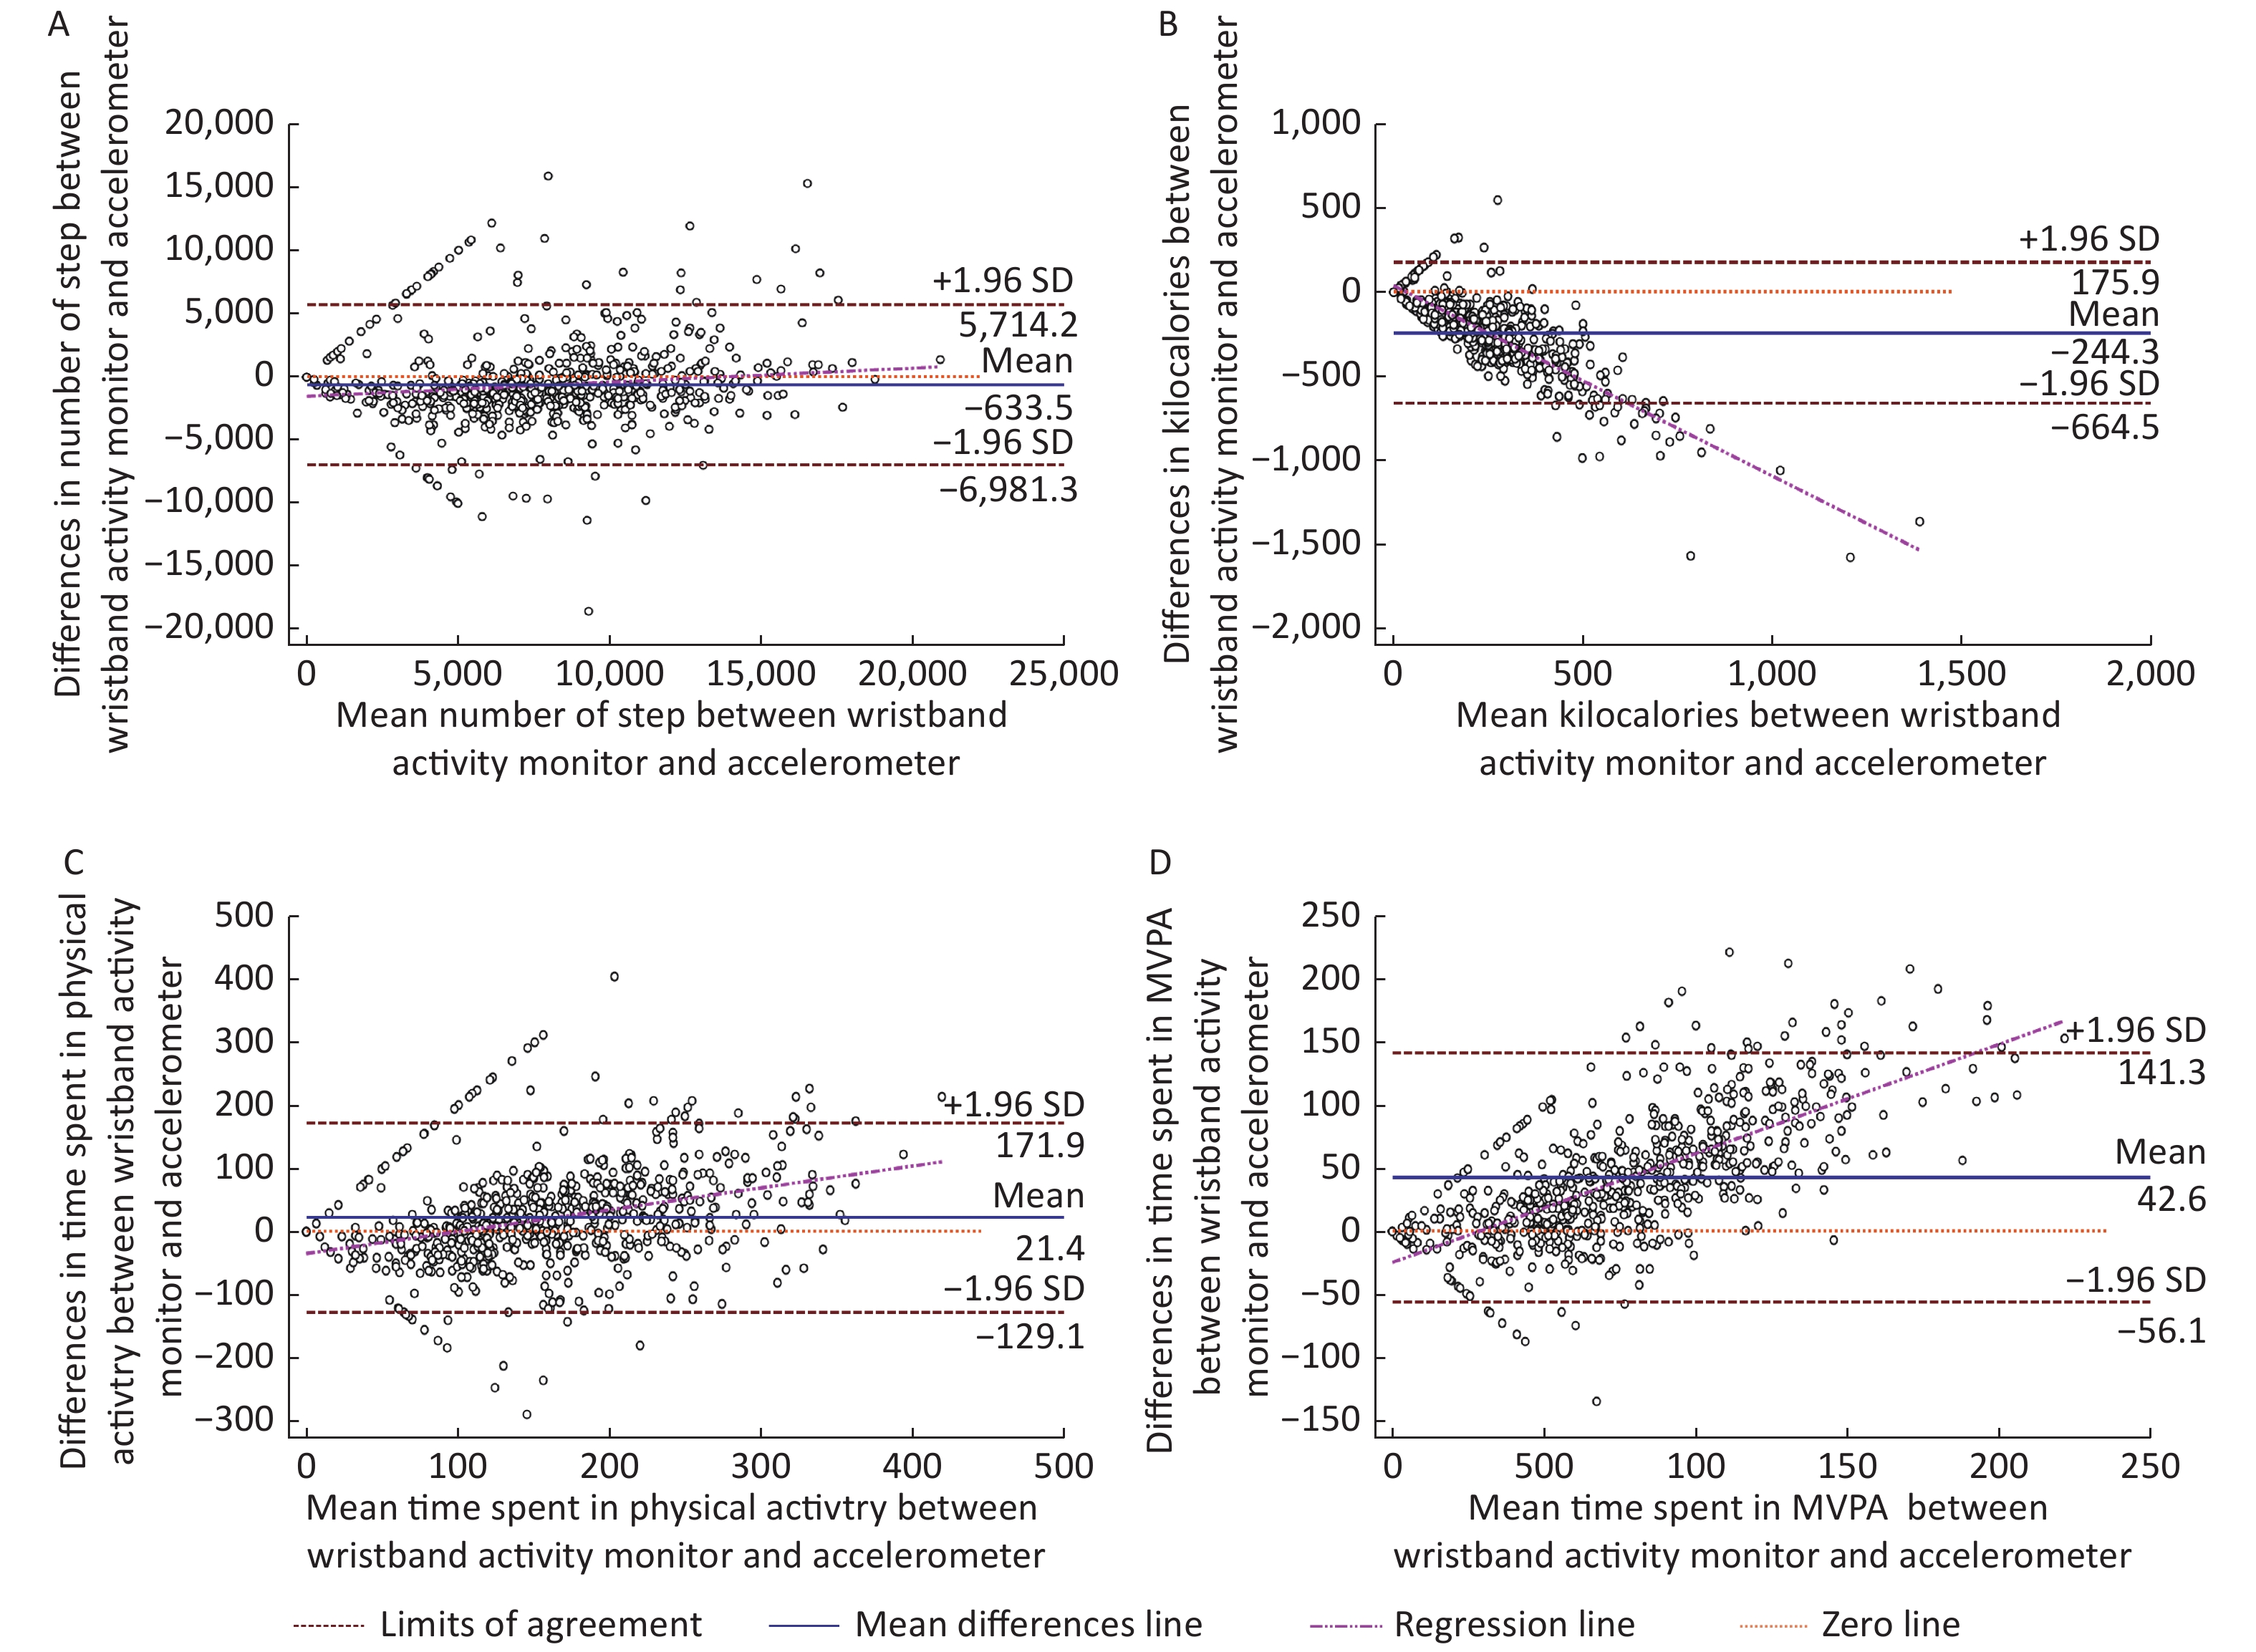
Bland-Altman plots were constructed to give a visual representation of the agreement between the two monitors for physical activity variables (Figure 3). Specifically, analyses identified a mean underestimation of 633.5 steps and 244.1 kilocalories, with a mean overestimation of 21.4 minutes for time spent on total physical activity and 42.6 min for MVPA by the wristband. There did appear to be an obvious trend in the data points on the plots except for a slight trend for steps. More time spent on total physical activity and MVPA were more likely to be overestimated, and the differences between the two methods were much higher, whereas a higher level of physical activity energy expenditure was more likely to be underestimated, and the difference between the two methods were much higher.
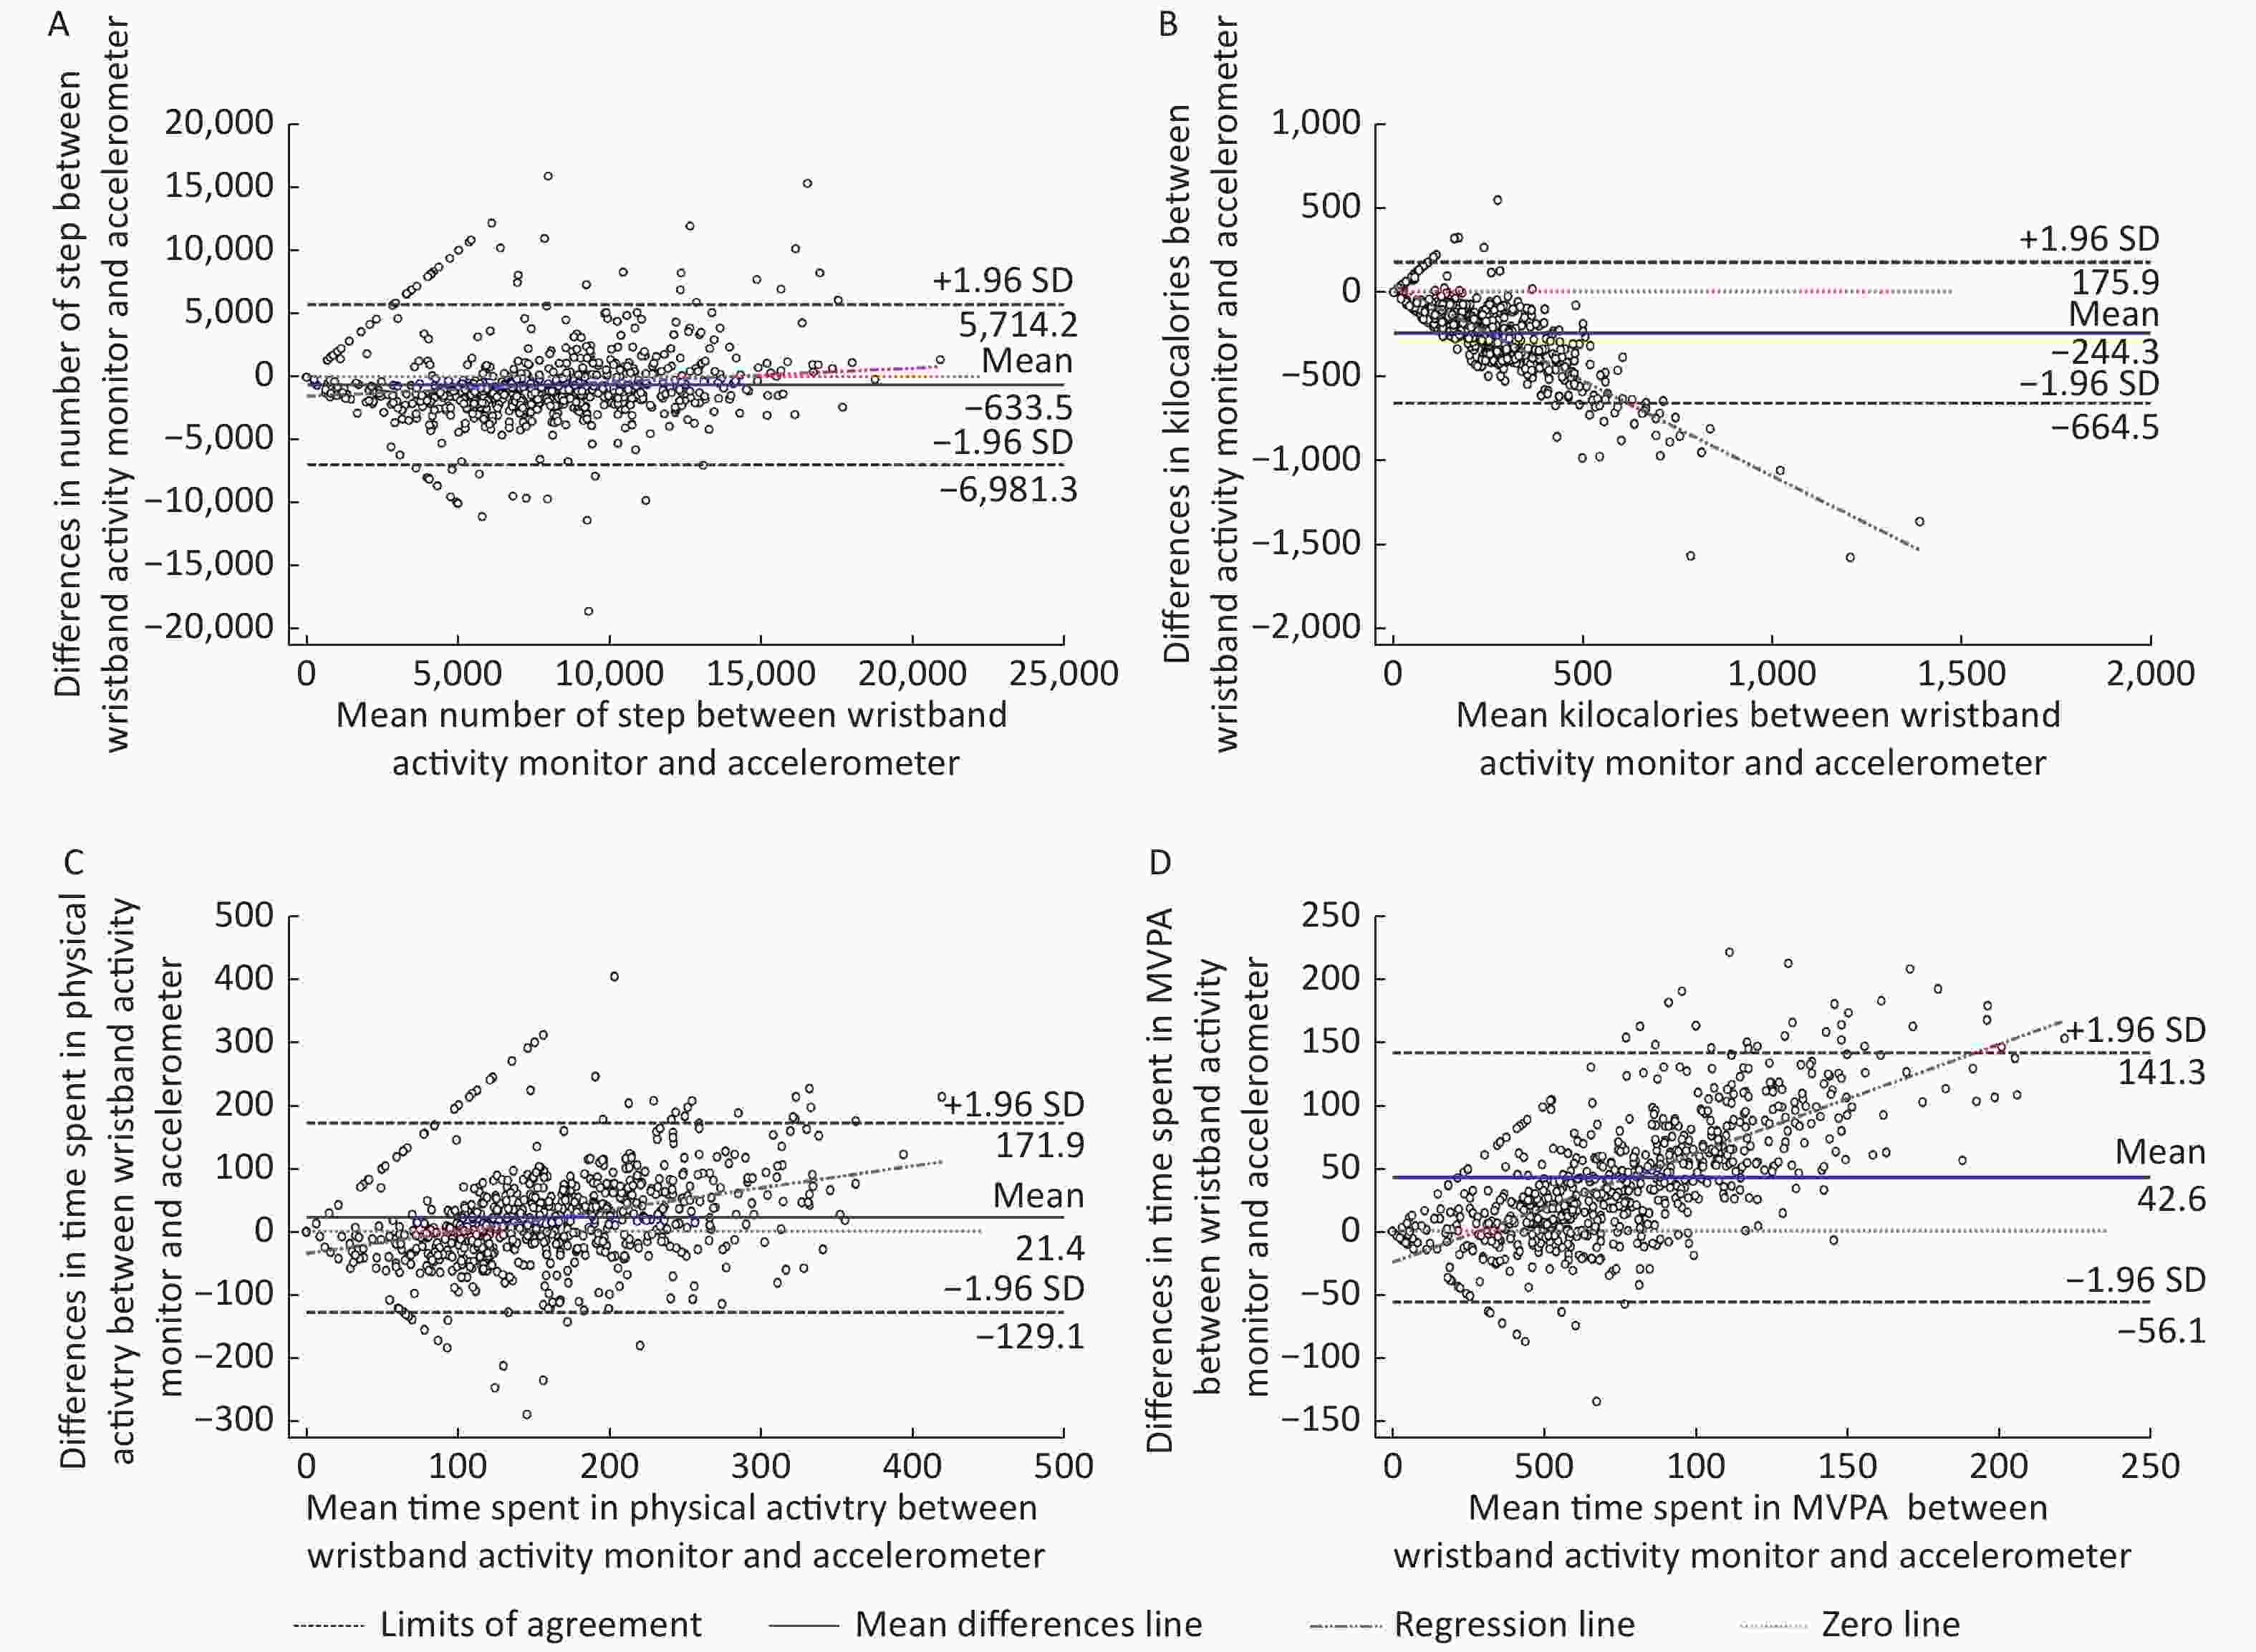
Figure 3. Bland and altman plots of physical activity variables to evaluate the agreement between the wristband activity monitor and accelerometer.
-
The purpose of this study was to evaluate the reliability or consistency over time and the validity of the wristband activity monitor in free-living children, by using the ActiGraph accelerometer as a criterion standard. Our study indicated that the number of steps counted by the wristband were highly correlated with estimates from the accelerometer, whereas moderate correlations were found for time spent on total physical activity and physical activity energy expenditure. Different intensities of physical activity estimates from the wristband showed weak to moderate correlations with the accelerometer. In particular, higher correlations were found for VPA and MVPA than for MPA and LPA. Meanwhile, the present findings also indicated that the wristband had consistently high inter-device reliability for steps, physical activity at different intensities and physical activity energy expenditure.
-
The wristband demonstrated high reliability, even though the median time spent on physical activity was different across days. Reliability between wrist-worn monitors and the accelerometer reported by other investigators was substantial to almost perfect for steps (ICC: 0.76–1.00) and physical activity energy expenditure (ICC: 0.71–0.97)[29, 30]. This discrepancy in reliability may be due to the larger sample size and free-living conditions in our study compared with previous studies of fewer than 10 participants in laboratory settings.
Knowledge about reliability helps to guide researchers as to the optimal number of measurement days necessary to capture a good estimation of overall physical activity. This study estimated that 3 days of monitoring children’s physical activity were required to attain a reliability of 0.80. Trost et al. indicated that 4–5 days of monitoring would be necessary to achieve a reliability of 0.80 in youth[31]. In a study by Treuth et al. on girls, 3, 4, and 5 days of monitoring were required to attain a reliability of 0.64, 0.70, and 0.75[32]. In designing studies, the sample size, subject compliance, logistics, and cost will weigh into the decision as to how many monitoring days are feasible.
-
The results obtained with the wristband and the accelerometer were significantly correlated, which could be principally attributed to the strong correlation for day 3. Over an average of 7 days, high correlations (rho = 0.72) were observed in steps, and steps measured by the wristband were underestimated by 14.5%. This is consistent with the findings of Sharp et al., who compared the results obtained with two wearable devices to observer step counts in preschool children[33]. Generally, in adults, wristband-measured steps showed a trend towards small differences but even stronger correlations (rho: 0.90–0.99) with accelerometer data[34, 35]. The relatively lower validity in our study might be due to the need to rely on the children’s compliance, the ability of children to follow the study protocol, and recording of the wristband monitor’s reading by investigators. Besides, some wristband monitors have also been previously evaluated under laboratory conditions, where the correlation with criterion methods was considerably stronger. Most studies using an accelerometer as the criterion indicated that wrist-worn trackers underestimated steps during treadmill walking and running[15, 36]. In contrast, one study of 104 adults wearing a wrist-worn monitor (Fibit Flex) for 7 days under free-living conditions found a median overestimation of 1,300 steps/day compared with the waist-worn ActiGraph[37].
A feature of this study is the ability to evaluate the time spent on different intensities of physical activity. As MVPA is accepted as a yardstick of healthful activity behavior, replacing sedentary behavior with LPA has been indicated to reduce the risk of all-cause mortality[38, 39]. However, the performance of wrist-worn trackers on the intensity of children’s free-living activity is relatively unknown. In this study wristband-measured physical activity at intensities higher than moderate (namely MVPA and VPA) were moderately correlated (rho = 0.55 and rho = 0.51) and differed (MAPE = 61.2% and MAPE = 95.9%) from those measured with the accelerometer, whereas intensities of activity lower than moderate (namely LPA and MPA) were weekly correlated (rho = 0.45 and rho = 0.38) and had modest differences (MAPE = −29.1% and MAPE = 36.1%). This pattern was closely followed in a recent study on children wearing a wrist-worn activity monitor (Polar Active Watch) during 80 min of afterschool programs for 5 school days. The correlations found were greater, and the differences were larger than in our study[40]. This is likely because of the different sensitives of wristband activity monitors to various types of movement and the lack of consensus on cut-off points when translating accelerometer intensity into physiologic intensity. Meanwhile, both of the studies demonstrate that wrist-worn trackers overestimated the time spent on MVPA relative to the accelerometer with large MAPE despite the high correlation, but MAPE and its correlation was low in LPA. Conceptually, while MAPE is a calculation of absolute error between the monitors in physical activity estimates, the correlation is a measurement of the linear relationship illustrating consistency of the same participants’ relative position between the monitors. Further, the findings of the current research extend those of the previous study by showing that in a free-living setting, a wrist-worn monitor can provide acceptable estimations of different intensities of physical activity among children.
Finally, this study observed a moderate degree of accuracy (rho = 0.57) and an underestimation of physical activity energy expenditure (mean: −244.1 kcals/day) by the wristband compared with the accelerometer. To date, the only wrist-worn device for which the validity of energy expenditure estimation assessed in children was Actiwatch, which found a good correlation (rho = 0.80) with indirect calorimetry[41]. Previously reported validities of wrist-worn monitors in adults ranging from 0.74 to 0.88 were also higher than what we observed[42, 43]. Regardless of the criterion measures, physical activity energy expenditure measured from wearable activity trackers was more often underestimated by 14%–60%[44, 45]. We found a significant difference of 68.1% between the wristband and the accelerometer. These differences could be due to variations in how well the monitor could record different types and intensities of activity, how often and for how long the monitors were removed, true differences in physical activity performed for the 7 days, and other random effects.
The current study has numerous strengths. Firstly, as highlighted earlier, the assessment of the wristband was in a free-living setting for estimation of unstructured lifestyle activity in children, while existing evidence is mainly from laboratory context. Thus, the findings of this study were more likely to reflect the performances of the wrist-worn monitor in real-world practice, providing a scientific basis of physical activity surveillance in children. Secondly, the reliability and validity of the monitor were evaluated for 7-day of a wearing protocol including both weekday and weekend days. Thirdly, a recent review indicated that sample sizes in validity and reliability studies of consumer-wearable activity trackers ranged from 6 to 65[18]. This study was conducted among a relatively large sample in children. Moreover, to our knowledge, this is the first study to evaluate the performance of wrist-worn trackers across a range of physical activity variables, including time spent on different intensities of physical activity, steps, and physical activity energy expenditure, showing a more complete picture of the monitors’ capabilities in children.
Despite the strengths of this study, some limitations should be acknowledged. Careful consideration should be given to the effects of movement artefacts, due to the use of monitors in different attachment sites that may not be ideal for direct comparison. Research indicates that the activity monitor worn on the wrist recorded 2,558 more steps than the one worn on the waist under free-living conditions, since wrist movements might be identified as false step counts[46]. In general, waist-worn trackers outperformed wrist-worn monitors for step accuracy[47]. In this study, the wristband had 633.5 lower mean steps than the accelerometer, which might be because of the placement of the monitors influencing physical activity variables or the sensitivity of the wristband for recording steps. However, a recent study support the notion that physical activity data obtained from waist- and wrist-worn activity monitors correlates moderately well in children and adults[48, 49]. In this regard, the findings of this study could provide some information on evaluation despite the different placement of the two monitors. Nyberg et al. also found that wrist placement might be more feasible than waist placement in children and may potentially facilitate long-term recordings since the wrist track can be worn overnight conveniently[41]. Besides, the discrepancy between the two monitors could possibly be attributed to not only the wristband activity monitor, but also the ActiGraph accelerometer, which is not the gold standard for steps and physical activity energy expenditure. However, the ActiGraph has been shown to be an accurate tool for children’s physical activity measurement and has been widely used in epidemiological studies[50].
-
The wristband activity monitor appears to be a valid and reliable measure to record children’s step in free-living settings. It was found to be feasible for measuring overall time spent on physical activity and physical activity energy expenditure. The wristband’s ability to measure different intensities of physical activity, especially low-intensity activity, should be improved. This study herein suggests that the wristband seems to offer a suitable alternative to the accelerometer for providing group, but not individual, estimations of physical activity variables. This is important for public health surveillance and physical activity promotion alongside advance in wearable fitness measurement techniques. Further research scrutinizing the monitors’ usability, acceptability and durability are warranted, since the new wave of activity monitors provides exciting possibilities for healthcare servers and researches.
-
All authors were involved in the conception of the manuscript. Prof. ZHAO Wen Hua directed all aspects of the study, including coordinated the design and administration of the research, reviewed the manuscript and so on. Ms. YANG Xi contributed to the design and implementation of the study, analysis and interpretation of data, and drafted the manuscript. Prof. Jago Russ contributed intellectual input into the main ideas of this paper and reviewed the manuscript. Dr. ZHANG Qian and Dr. WANG Yu Ying contributed to study design and implementation. Dr. ZHANG Jian assisted with writing of the manuscript. All authors read and approved the final manuscript.
-
We would like to thank all children, parents, teachers and staff that made this study possible and Dr. QIU Jun Qiang from Department of Sports Biochemistry, Beijing Sport University for accelerometers data collection.
-
The authors declare that they have no competing interests.
Funds:
This work was funded by National Scientific and Technological Basic Resources Investigation Program ‘Research and application of nutrition and health system for children aged 0-18 years in China’ [2017FY101107]

 Quick Links
 DownLoad: