

-
Consumption of food products contaminated with potentially toxic elements (PTEs) is one of the primary health issues across the world[1, 2]. Due to their nonbiodegradable properties, the long half-life, and the accumulative behaviors, PTEs can contaminate different environments such as soil, water, and air, which consequently results in further contamination of food products, i.e., vegetables and fruits[3, 4]. In this regard, the ingestion of contaminants through the food chain is one of the most important pathways of PTE intake[5-7]. However, a variety of PTEs in various concentrations are important for plant growth; they can be accumulated in high levels among the storage tissues of plants, such as tubers, fruits, and leaves[8-10], and then transfer to the food chain, which can lead to adverse side effects. Furthermore, PTEs can reduce the quality and the production rate of crops[11]. On the other hand, PTEs such as arsenic (As), cadmium (Cd), mercury (Hg), and lead (Pb) are routinely discharged into the environment through metallurgical and industrial processes besides their natural occurrences[8,12-14].
The contamination of crops with PTEs can cause serious health issues for consumers due to their teratogenic, mutagenic, and carcinogenic properties[15-18]. In addition, excessive levels of PTEs ingested through the diet can lead to some disorders such as neurological, cardiovascular, nervous, renal, liver, and bile issues[15].
Pb and Cd as PTEs for living beings are among the most abundant elements in the world[19, 20]. Pb is used in the manufacture of batteries, paints, and gasoline additives as well as in various metal products such as solder, pipes, and Pb sheets[21]. Exhausts of vehicles release a significant amount of Pb into the air, of which a certain amount is uptaken by plants, fixed in the soil, and penetrates water resources. In this context, inhalation and ingestion are the two major routes of exposure to Pb and Cd[21]. Moreover, excessive uptake of Pb into the body can cause certain adverse health issues such as hypertension, nephropathy, abnormalities in blood composition[22], and cardiovascular disease[23].
Cd is a widely distributed compound in the earth, and although it is not degradable, it can be naturally found in combination with zinc in the earth’s crust as a side-product of Zn production[21]. Although Cd is considered as a PTE, it is used in paint industries, rechargeable batteries, and in the production of alloys; it can also be found in tobacco smoke[24]. It can remain in the environment for several decades[21], and when absorbed by living beings, it causes adverse effects to the liver and lungs. Furthermore, Cd disturbs the metabolic pathways associated with several important enzymes and could have an effect on neural cell apoptosis[25]. Further health issues such as painful osteomalacia or osteotoxicity, destruction of red blood cells, and kidney damage or nephrotoxicity are among the consequences of Cd uptake in high concentrations[26].
Hg, as a bioaccumulative toxic element, has some adverse effects on the marine environment as well as in human beings[27]. It has been reported that Hg poisoning can result in chest pain, hemolytic anemia, bronchitis, and pulmonary fibrosis[28, 29]. Hg can be found in three different forms, organic, inorganic, and elemental Hg, which is widely used in various products such as mercurochrome and merthiolate[22]. Ethyl Hg is used as a maintenance material to prevent bacterial contamination of multidose vaccine vials[30] as well as in the production of fluorescent and arc lamps, barometers, and hydrometers.
As is found in two forms, organic and inorganic [31]. It can accumulate in keratin-rich tissues such as the skin, nails, and hairs and can also transfer to blood flow and further excrete in urine[32-34]. Pigmentation, keratosis, liver damage, and lung diseases are among the disorders caused by the consumption of food and water contaminated with As[35].
Foods may get contaminated with PTEs due to a variety of reasons such as irrigation with contaminated water, application of fertilizers and metal-based pesticides, industrial emissions or air pollution, transportation, harvesting process, and unsuitable conditions for storage and/or distribution[36]. In addition to their rich contents of minerals, vitamins, and carotenoids, fruits can absorb PTEs not only from the soil but also from contaminated water and air. Therefore, monitoring the levels of PTEs in fruits due to their huge impact on human health is a matter of significant concern.
PTE content in different fruits has been assessed in some regions of the world. For example, there are reports on peach, orange, cherry, and pineapple juices from Tehran, Iran[3]; banana, peach, orange, strawberry, watermelon, melon, apple, grape, and mango from Misrata city, Libya[11]; strawberry, cherry, and grape from Manisa, Turkey[36]; apple, banana, melon, date, grapefruit, peach, orange, strawberry, and watermelon from Alexandria city, Egypt[37]; guava, banana, apple, bush butter, grape, orange, pawpaw, avocado, pineapple, local pear, tangerine, and bush mango from Owerri, Southeastern Nigeria[38]; and plum, grape, apple, pear, raspberry, gooseberry, and blackcurrant from Baia Mare mining area, Romania[39].
Several previous studies have conducted risk assessments of PTEs among different food products (vegetables, tea, hen eggs, and dairy products) produced and supplied in Markazi Province, Iran[9, 14, 40-43]. However, to our knowledge, no previous investigation has determined the concentration of PTEs in fruits produced in Markazi Province, which is one of the most important industrial zones of Iran. Therefore, in this study, inductively coupled plasma atomic emission spectroscopy (ICP-OES) was applied to evaluate the concentration of PTEs in popular Iranian fruits such as peach, apple, grape, nectarine, and golden plum, which were cultivated and consumed in an industrial zone of Iran (Markazi Province). In addition, the transfer of PTEs from the soil to the fruits and the carcinogenic and noncarcinogenic risks were determined based on certain safety factors such as the estimated daily intake (EDI) and the target hazard quotient (THQ).
-
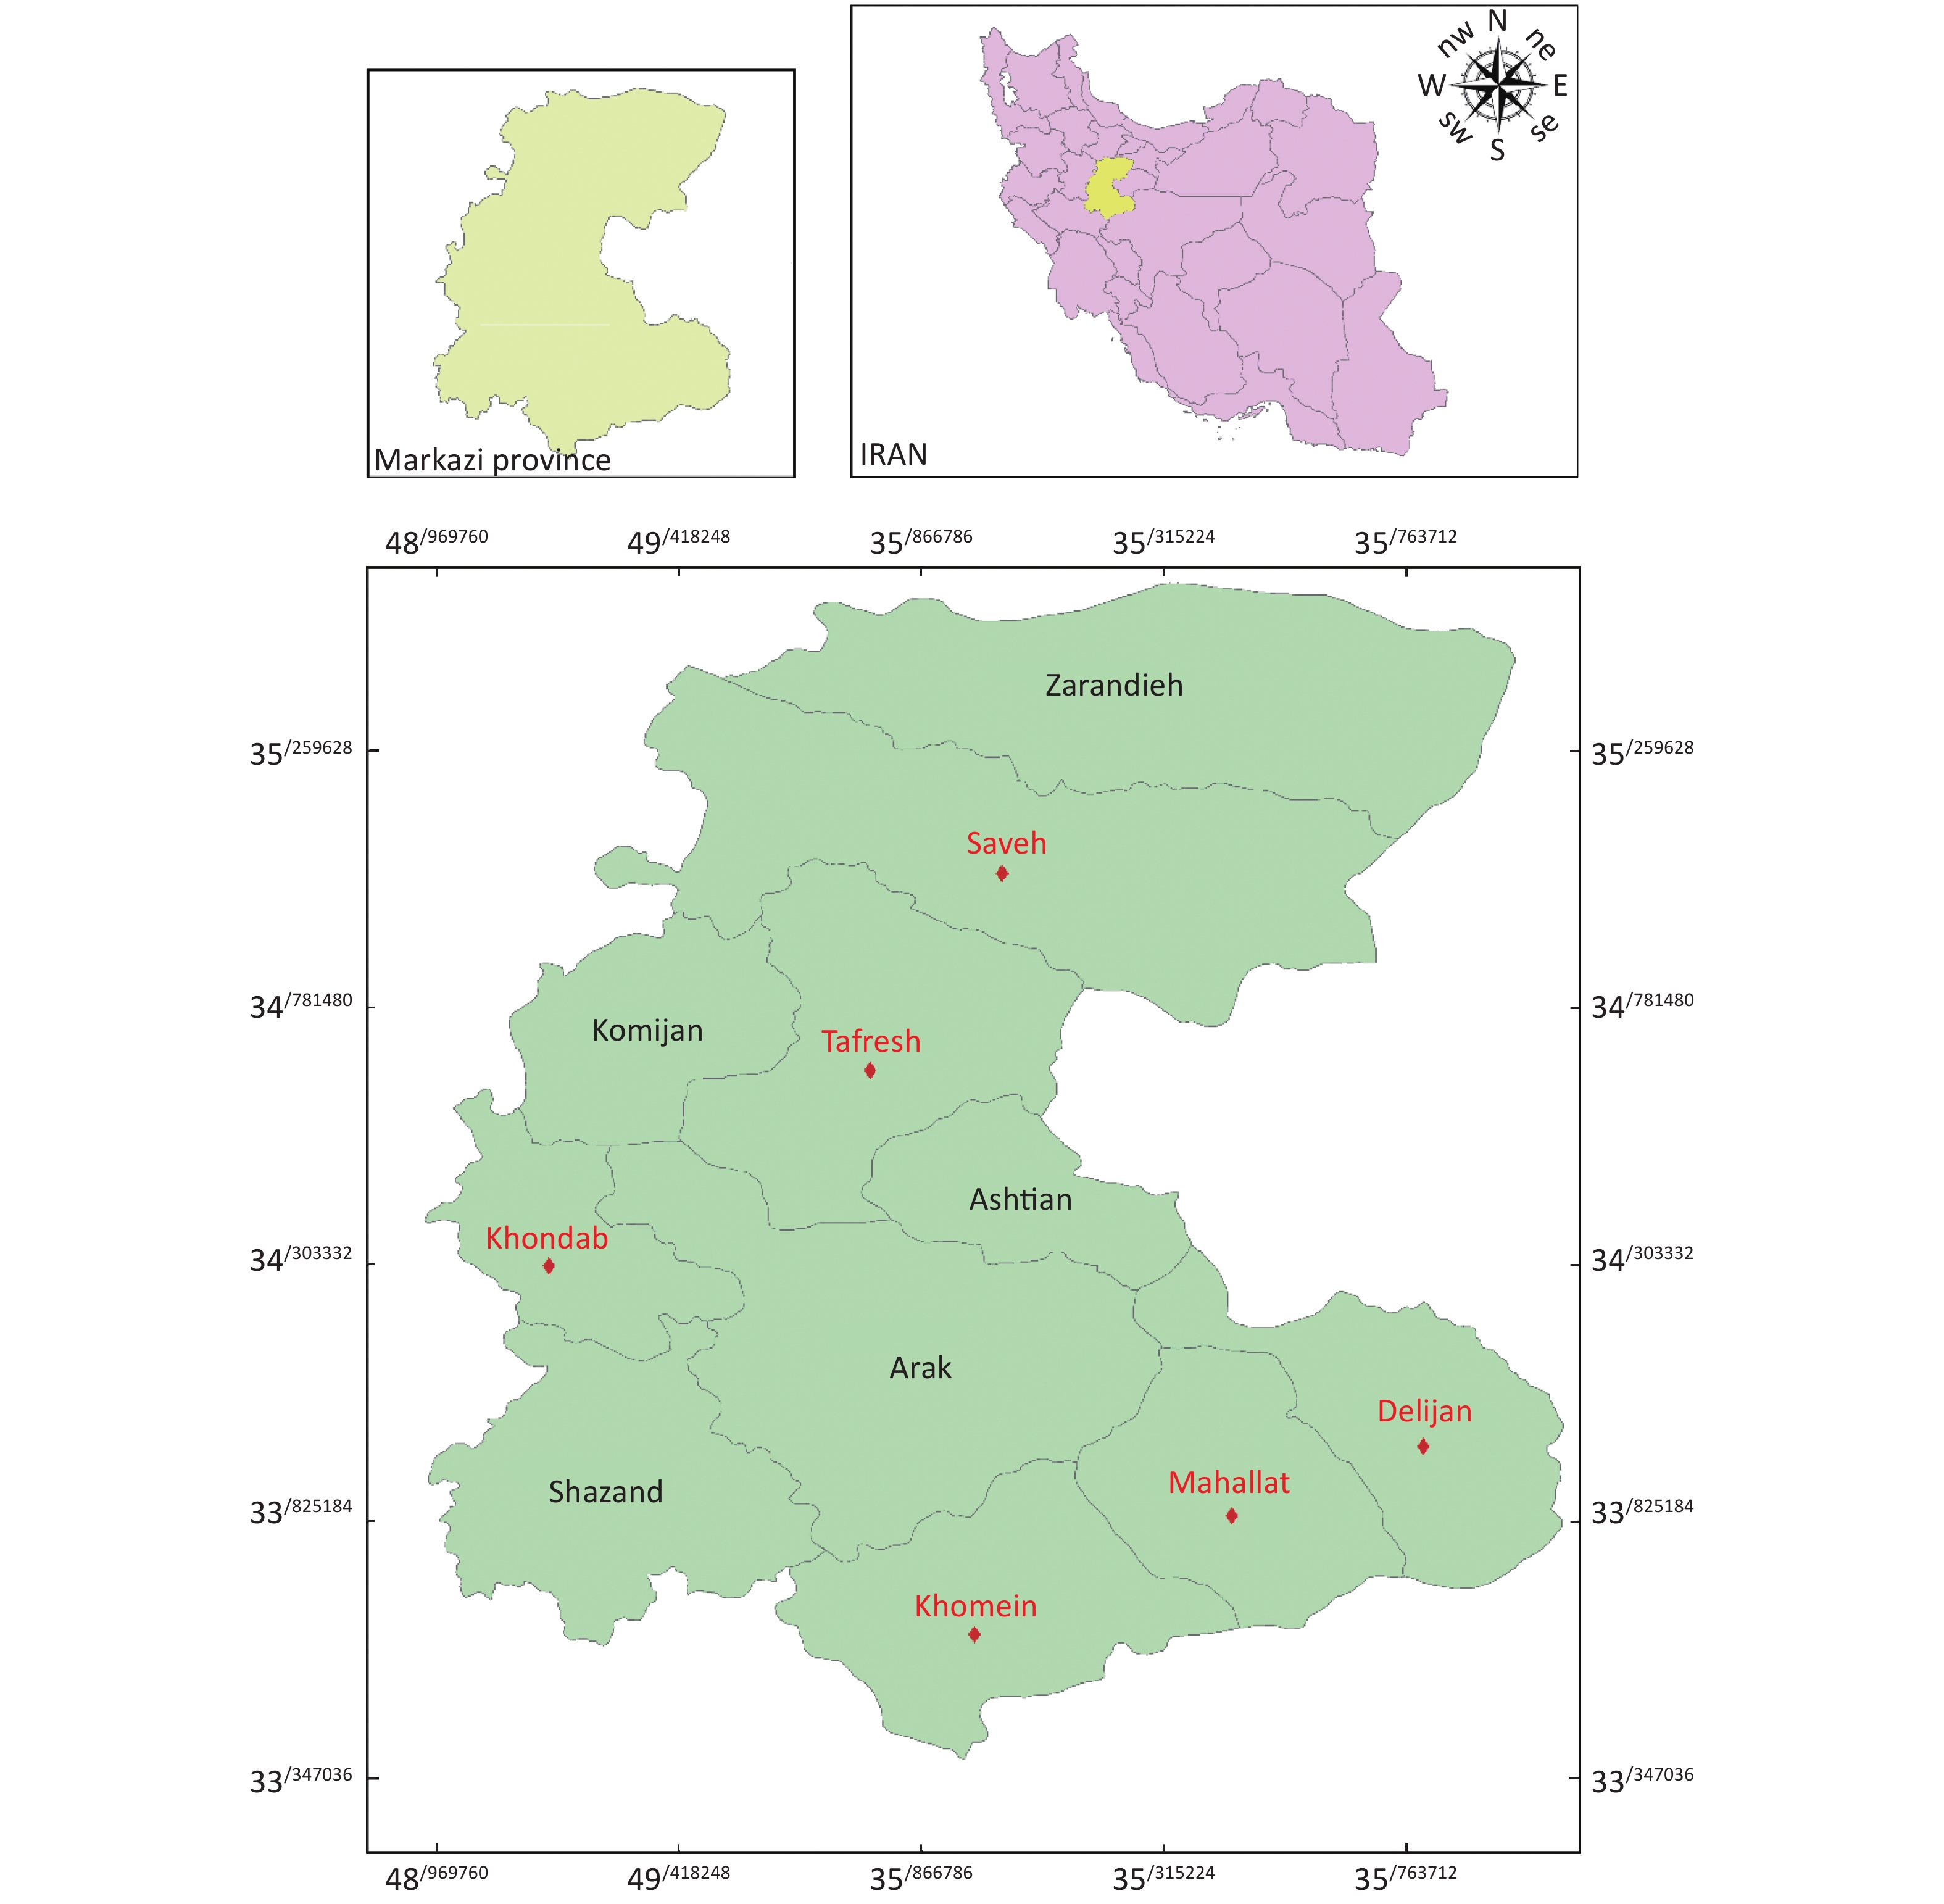
The study was conducted in Markazi Province located in the west of Iran at a latitude of 34° 05′ 30.26″ N and a longitude of 49° 41′ 20.98″ E. As Markazi Province is a developed, industrial, and agricultural region, heavy pollution can be found on most of the days in a year. Six different sites (cities) of Markazi Province, namely, Saveh, Khondab, Khomein, Mahallat, Tafresh, and Delijan, were selected for this study due to their fewer distances from industrial zones (Figure 1). The mean annual precipitation was 278 mm/year with a relative humidity of 46%, and the mean temperature is approximately 12.8 °C, with the minimum and maximum annual temperature being approximately −13 °C to −35 °C and 36–49 °C, respectively. The population of this region is about 1.43 million habitants.
Figure 1. Map of the sampling localities at Markazi province
-
All chemicals and standards and stock standard solutions of As, Cd, Hg, and Pb of analytical grade (purity > 99%) were purchased from Merck (Darmstadt, Germany). Double-deionized water was used in the preparation of all dilutions.
-
Different summer fruits such as peach (Prunus persica) (n = 15), apple (Malus domestica) (n = 15), grape (Vitis vinifera) (n = 15), nectarine (Prunus persica) (n = 15), and golden plum (Prunus domestica subsp. Syriaca) (n = 15) in three replicates (n = 3) were collected (a total of 90 samples) randomly from six agricultural sites in Markazi Province (1 kg of each sample). All fruit samples were collected from June to July 2018 and prepared according to the procedure recommended by previous studies[42, 44].
-
Based on previously described methods[42, 45, 46], a total of 18 soil samples were collected from around the plant (6 agricultural sites × 3 sample plots; soil samples from each site were collected by excavating 1.5-m radial distance from the plant center) and were prepared for analysis.
-
A total of 18 irrigation water samples (1 L of each sample) were collected from the experimental sites (6 agricultural sites × 3 sample plots) and stored in precleaned high-density polyethylene bottles, which were washed with 10% HNO3 overnight and then with deionized water and were dried before use. The water samples were filtered and acid-stabilized, and approximately 20 mL HCl was added to the sample [42, 47, 48]. The samples can be introduced into a plasma directly.
-
The ICP-OES method was used for analyzing all samples based on the method described in our previous investigation[42].
-
A calibration curve was used to check the linearity of the method. Individual stock standard solutions (10 µg/mL) were prepared as follows: 2.5, 5, 10, 100, 200, 300, 500, and 1,000 μL. Then, the mixed standard stock solutions were added to 10 g of blank samples[39, 46].
-
The sensitivity of the analytical methods was investigated by the limit of detection (LOD) (signal-to-noise; S/N ratios of 1/3) and the limit of quantification (LOQ) (10 times more than that of background noise in spiked samples at lowest levels).
-
For investigation of the recovery, spiked fruit, soil, and water blank samples at concentration levels of 25, 75, 150, 250, 500, and 750 µg/mL of PTEs (As, Cd, Hg, and Pb) were prepared in triplicates and then treated according to the procedure described in the original sample preparation[42, 49].
-
The transfer factor (TF) is defined as the ratio of PTEs in the soil to their ratio in plant tissues, which indicates internal PTE transportation or transfer of PTEs from the soil to the fruits. Soil to plant transfer is the primary pathway of human exposure to PTE contamination[50]. A higher TF level of > 1 reflects the high ability of the plant to absorb each PTE.
-
The EDI was estimated using the following Equation[51-54]:
$$\text{EDI} = \frac{{\text{C} \times \text{IR} \times \text{EF} \times \text{ED}}}{{\text{BW} \times \text{AT}}} $$ (Equation (1)) In this equation, C (µg/L) is the concentration of the PTE, IR (kg/n·day) is the ingestion rate of fruit (in Iran, it is 0.012 kg/n·day for children and 0.030 kg/n·day for adults)[55], EF (days/year) is the exposure frequency (350 days/year), ED (year) is the exposure duration (children = 6 years and adults = 30 years), BW (kg) is the bodyweight (children = 15 kg and adults = 70 kg), and AT (days) is the average lifespan time (for noncarcinogenic risk, it is 2,190 days in children and 10,950 days in adults, and for carcinogenic risk, it is 25,550 days in children and 25,550 days in adults).
-
The noncarcinogenic risk due to the ingestion of fruit content of PTEs was evaluated using the THQ[51, 56, 57] as follows:
$$ TH{Q_i} = \frac{{EDI}}{{RfD}} $$ (Equation (2)) In this equation, EDI [µg/(kg·d)] is the amount of PTE intake per kilogram BW that is presented as EDI and RfD [mg/(kg·d)], the reference dose of PTEs through the oral pathway. The oral RfD values for As (inorganic), Cd, and Hg (methylmercury) are 0.0003, 0.001, and 0.0001 [mg/(kg·d)] and unavailable, respectively[58]. According to the World Health Organization (WHO) report, the tolerable daily intake (TDI) for Pb is 0.0036 [mg/(kg·d)][59].
To calculate the total THQ (TTHQ), the sum of THQ for each PTE was calculated using the following equation[60, 61]:
$$ TTHQ = \mathop \sum \nolimits_{i = 1}^n THQi $$ (Equation (3)) -
The carcinogenic risk (CR) was evaluated using the following equation[62-64]:
$$ \text{CR} = \text{EDI} \times \text{CSF} $$ (Equation (4)) In this equation, CSF is the cancer slope factor [mg/(kg·d)]−1, which is defined as a probable increase in cancer risk due to one substance through the oral pathway[65, 66].
According to EPA, the CSF through the oral pathway for As is 1.5 [mg/(kg·d)]−1[67]. The CSF values for Cd, Hg, and Pb are not available.
-
Uncertainties can occur during a health risk assessment[68]. If the used single-point value of PTE concentration for health risk assessment, high uncertainty can be observed. Therefore, a Monte Carlo simulation model was used as a probabilistic model to decrease uncertainties[69, 70]. The probabilistic risk assessment was conducted using the Crystal Ball software (version 11.1.2.4, Oracle, Inc., USA). The 95th percentile of THQ and CR was considered as a benchmark value that could endanger the health of consumers, and the number of repetitions was 10,000[71].
-
Two-way analysis of variance (ANOVA) was performed to assess the effect of different variables on the toxic element concentrations in the tested fruits. ANOVA for each fruit was performed separately using variables such as the study site. A significant level of contamination in different fruits and water and soil of regions of sampling (P ≤ 0.05). All statistical analyses were performed using SPSS v.24 (SPSS Inc., Chicago, IL). Each sample was analyzed three times (n = 3) for each PTE.
-
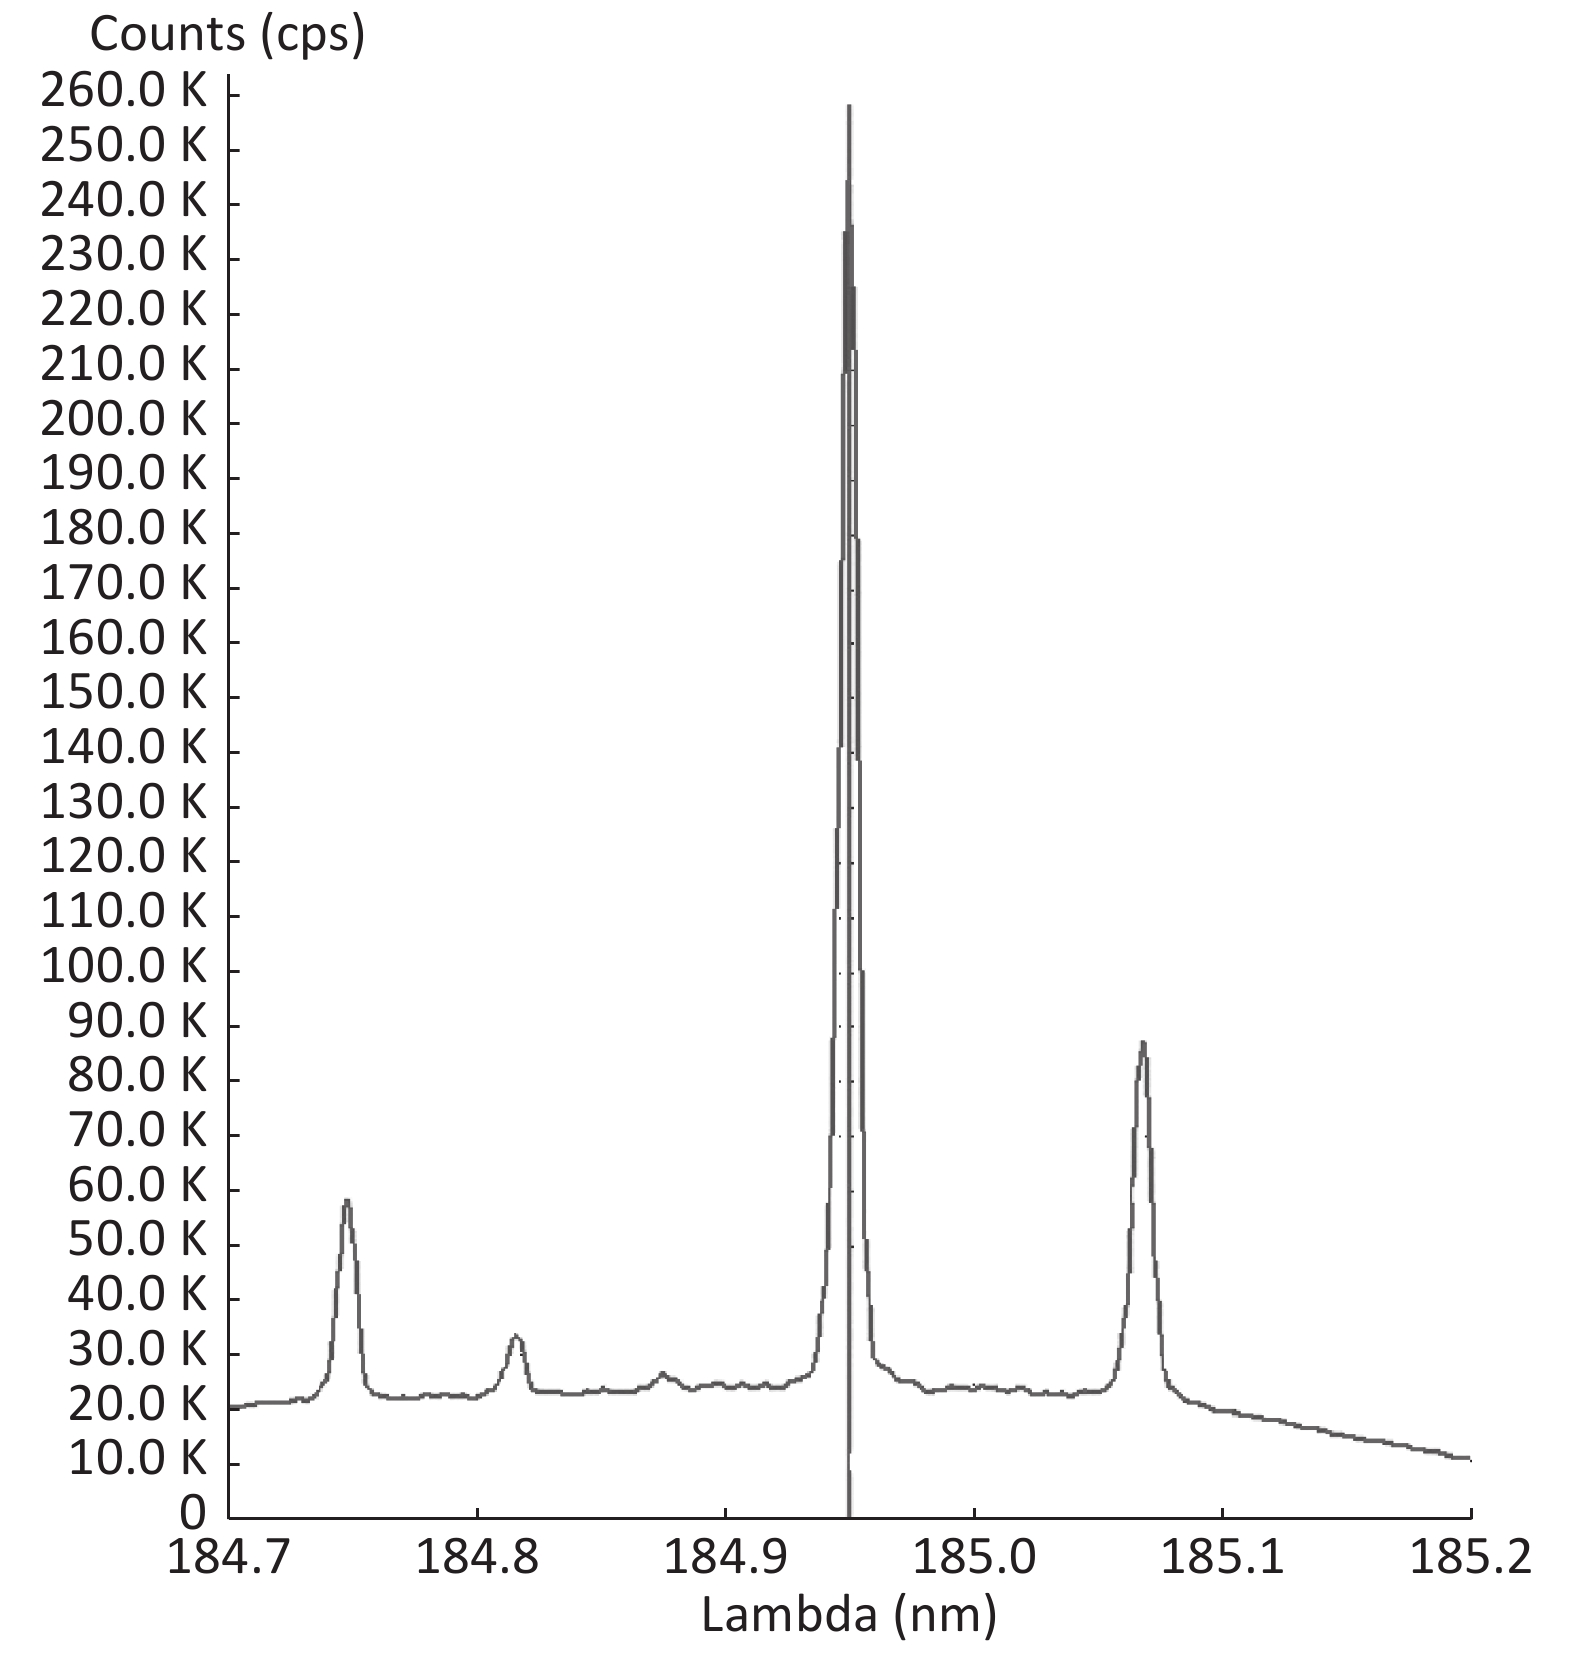
Good linearity was noted according to the calibration curves plotted for four forms of PTEs in five types of fruits. The correlation factors for all the fruits were found to be in the range of 0.9975–0.9996 (Table 1). Figure 2 shows the spiked calibration curve for Hg in nectarine as a representative. Furthermore, an ICP-OES chromatogram of Hg analyzed in nectarine is depicted in Figure 3.
Fruit samples Metal Equation Regression coefficient Nectarine As y = 0.0005x - 0.008 0.9985 Cd y = 0.003x - 0.0248 0.9995 Hg y = 0.0009x - 0.0112 0.9993 Pb y = 0.0009x -0.0048 0.9996 Grape As y = 0.003x + 0.0275 0.9979 Cd y = 0.001x - 0.0123 0.9993 Hg y = 0.0003x - 0.0047 0.9993 Pb y = 0.0014x + 0.0178 0.9975 Plum As y = 0.0012x - 0.0181 0.9987 Cd y = 0.0028x - 0.0362 0.9992 Hg y = 0.0016x - 0.0017 0.9977 Pb y = 0.0003x + 0.0005 0.9992 Peach As y = 0.001x - 0.0136 0.9993 Cd y = 0.0002x - 0.002 0.9984 Hg y = 0.0008x - 0.0062 0.9986 Pb y = 0.0008x - 0.0106 0.9992 Apple As y = 0.0008x - 0.0073 0.9977 Cd y = 0.0007x - 0.0081 0.9978 Hg y = 0.0019x - 0.0056 0.9994 Pb y = 0.0002x - 0.0024 0.9985 Table 1. Linear equations and regression coefficient of the calibration curves for PTEs (range 2.5-1,000 μg/kg)
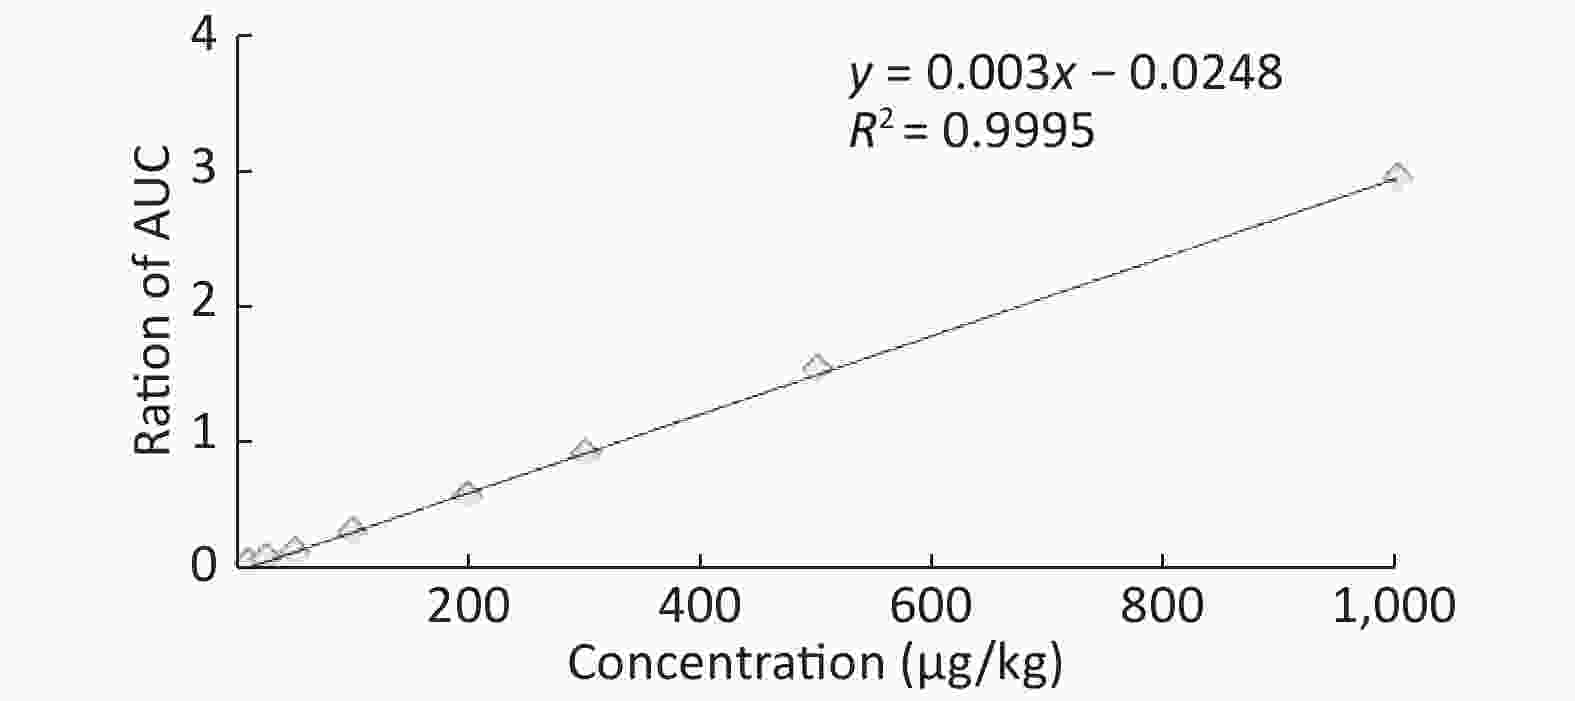
Figure 2. Spiked calibration curve for Hg in nectarine
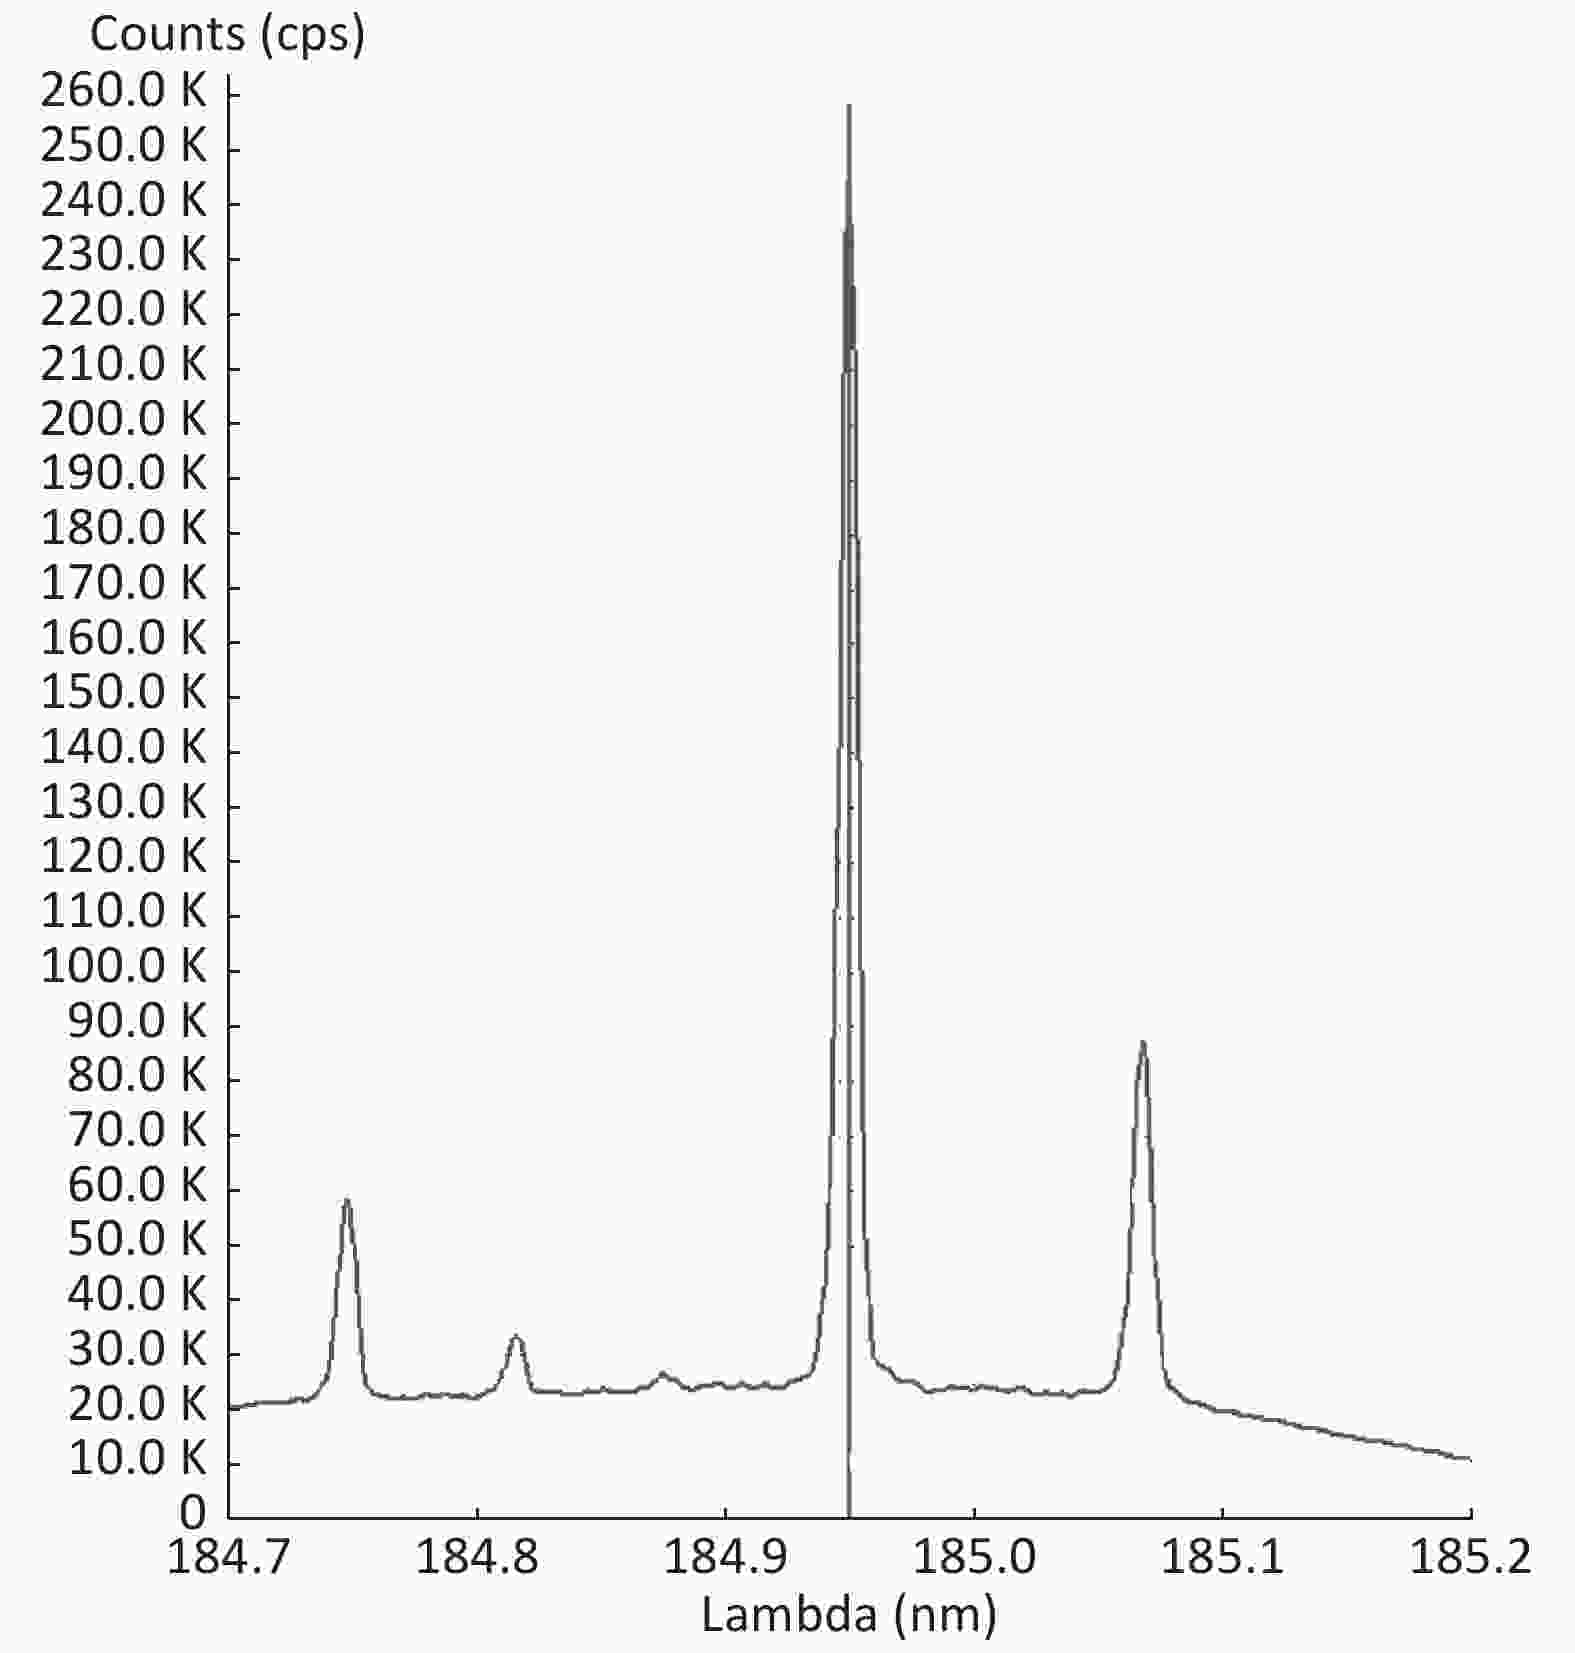
Figure 3. A representative ICP-OES chromatogram obtained for the Hg in nectarine
-
Table 2 show the average recoveries (%), relative standard deviations (%), LODs, and LOQs (μg/kg) obtained by ICP-OES analysis at six spiking levels (n = 3) in fruit, soil, and water samples. Using this method, the LODs for As, Cd, Hg, and Pb were calculated as 1, 0.05, 0.35, and 2 µg/kg, and the LOQs were 3.25, 0.42, 1.13, and 6.5 µg/kg in all types of samples, respectively. In addition, the recovery of PTEs at these six spiking levels was in the range of 89.01%–126.65% in fruit, 89.11%–114.07% in soil, and 101.2%–132.8% in water samples. Regarding repeatability, all samples gave an RSD of < 20% with n = 3 at each spiking level (Table 2).
Metal Samples Recovery (n = 18), Mean ± SD (95% CI) Range of RSDr (n = 6) LOD LOQ As Fruits 105.06 ± 8.09 (93.7-116.2) 6.9−14.1 1 3.25 Soil 98.78 ± 2.58 (93.8-103.7) 10.62−19.21 Water 115.7 ± 4.24 (111.2-128.3) 12.1−16.71 Cd Fruits 102.26 ± 5.21 (93.8-112.5) 9.3−15.4 0.05 0.42 Soil 99.71 ± 3.64 (94.2-108.7) 11.86−17.32 Water 110.36 ± 6.3 (101.2-119) 11.9−15.12 Hg Fruits 106.6 ± 8.81 (102.13-126.65) 8.1−16.8 0.35 1.13 Soil 106.6 ± 4.54 (99.43-114.07) 10.86−18.11 Water 121.85 ± 3.24 (119.54-132.8) 9.3−12.11 Pb Fruits 100.4 ± 8.21 (89.01-111.55) 9.1−17.5 2 6.5 Soil 94.37 ± 2.87 (89.11-99.55) 9.86−17.12 Water 110.54 ± 4.5 (105.64-123.17) 13.3−14.3 Table 2. Average recoveries (%), relative standard deviations (RSD) (%), LOD and LOQ (μg/kg) obtained by ICP-OES analysis at 6 spiking levels (n = 3) in fruit, soil and water samples
-
The concentration of PTEs showed a wide variation in the fruit samples as indicated by the average level of each PTE in Table 3. The order of mean concentration of PTEs in grape, peach, and nectarine was as follows: Pb > As > Hg > Cd. An almost similar order was found for plum (Pb > Hg > Cd > As) and apple (Pb > Hg > As > Cd). These findings indicate that the lowest and highest mean levels of As (0.085 ± 0.057 and 1.2 ± 0.087 μg/kg, respectively) correlated with nectarine and grape samples, whereas for Cd, the corresponding values were 0.0096 ± 0.005 and 0.3 ± 0.007 μg/kg for golden plum and grape, respectively. For Hg, the corresponding values were 0.03 ± 0.005 and 0.91 ± 0.008 μg/kg for golden plum and grape, and for Pb, the corresponding values were 1.2 ± 0.35 and 6.3 ± 1.11 μg/kg for nectarine and apple, respectively.
Location Plum Apple Grape As Cd Hg Pb As Cd Hg Pb As Cd Tafresh 0.21±0.08a 0.02±0.010ab 0.09±0.006a 4.01±1.62a 0.15±0.03b 0.01±0.000a 0.05±0.007b 1.99±0.70a 0.23±0.10ab 0.03±0.006a Delijan 0.18±0.04a 0.02±0.002ab 0.09±0.010a 3.42±1.14a 0.29±0.06a 0.20±0.003c 0.11±0.005a 2.53±1.15a 0.18±0.05a 0.02±0.001a Saveh 0.30±0.02a 0.03±0.003ab 0.13±0.005b 3.85±0.90a 0.17±0.03ab 0.02±0.004ab 0.06±0.005bc 2.55±1.12a 0.45±0.05b 0.05±0.002b Khomein 0.26±0.06a 0.02±0.080b 0.10±0.017a 4.69±1.23a 0.28±0.05a 0.03±0.007b 0.10±0.009a 3.78±1.22a 1.20±0.08c 0.30±0.006c Mahallat 0.14±0.02a 0.01±0.004a 0.03±0.005c 2.70±1.08a 0.19±0.04ab 0.02±0.004ab 0.08±0.006c 6.27±1.10b 0.51±0.09b 0.11±0.017d Khondab 0.22±0.08a 0.03±0.010ab 0.09±0.007a 4.37±1.20a 0.15±0.03b 0.01±0.004a 0.06±0.005b 1.25±0.29a 0.35±0.06ab 0.03±0.002ab Location Grape Peach Nectarine Hg Pb As Cd Hg Pb As Cd Hg Pb Tafresh 0.10±0.006a 2.49±0.86a 0.14±0.01a 0.01±0.001a 0.06±0.005a 2.77±0.84b 0.22±0.025bc 0.05±0.004c 0.07±0.005b 2.95±0.83b Delijan 0.09±0.005a 1.71±0.56a 0.22±0.05ac 0.02±0.002ab 0.10±0.005b 5.64±1.10a 0.16±0.015a 0.02±0.003a 0.06±0.005a 1.70±0.30a Saveh 0.19±0.005b 6.01±0.83b 0.18±0.03ab 0.02±0.004a 0.06±0.005a 1.57±0.32b 0.10±0.005bc 0.01±0.001b 0.04±0.005c 1.23±0.34b Khomein 0.91±0.008c 2.98±0.53a 0.29±0.07bc 0.03±0.005b 0.12±0.005c 4.53±0.68ab 0.14±0.034ac 0.01±0.005a 0.05±0.005ab 1.61±0.31a Mahallat 0.32±0.032d 2.55±0.55a 0.34±0.07c 0.04±0.004b 0.14±0.005d 5.11±0.78a 0.22±0.060a 0.02±0.004a 0.10±0.005a 2.89±0.78a Khondab 0.16±0.018b 2.50±0.32a 0.19±0.06ac 0.02±0.007a 0.07±0.009a 1.67±0.31b 0.12±0.015ab 0.01±0.002ab 0.04±0.005b 1.97±0.46a Note. Different letters in the same column indicate significant differences (P < 0.05). Table 3. The mean level and standard deviation of different PTEs in different fruits in various sites of Markazi Province, Iran (µg/kg·dw)
A significant difference was observed in the concentration of PTEs among fruit samples collected from different regions (Table 3), and the levels of PTEs in the investigated samples were in the range form 0.10 ± 0.005 to 1.20 ± 0.08 µg/kg for As, 0.01 ± 0.004 to 0.30 ± 0.006 µg/kg for Cd, 0.03 ± 0.005 to0.91 ± 0.008 µg/kg for Hg, and 1.23 ± 0.34 to 6.27 ± 1.10 µg/kg for Pb.
In general, the highest concentration of PTE was associated with apple samples, and the lowest one was noted among plum samples. The highest concentration of Pb was found in apple (6.27 ± 1.10 µg/kg) in Mahallat, and the highest levels of As, Cd, and Hg (1.20 ± 0.08, 0.303 ± 0.006, and 0.910 ± 0.008 µg/kg, respectively) were observed in grape samples in Khomein. However, the levels of Pb, Hg, As, and Cd was below the standard limit recommended by the WHO/Food and Agricultural Organization (FAO). The nectarine fruit samples collected from Saveh were contaminated with the lowest concentrations of As, Cd, and Pb (0.10 ± 0.005, 0.01 ± 0.001, and 1.23 ± 0.34 µg/kg, respectively). Plum samples also contained the lowest concentration of Hg, 0.030 ± 0.005 µg/kg, in Mahallat. According to the Institute of Standards and Industrial Research of Iran (ISIRI), the maximum limit of Pb in fruits is 100 µg/kg, whereas a limit of 200 µg/kg was proposed for grape[72]. Therefore, the level of this toxic element in fruits is lower than the recommended ISIRI limit.
-
The analysis results of water and soil samples collected from different sites in Markazi Province are presented in Table 4. The order of PTE levels in the soil and water samples can be summarized as Pb > As > Hg > Cd. There was a significant difference in the concentration of PTEs between fruits as well as soil and water samples collected from different regions. The levels of Pb, As, Hg, and Cd in the soil were in the range of 146.01 ± 6.7 to 318.72 ± 1.43, 79.17 ± 1.07 to 263.9 ± 9.95, 0.71 ± 0.06 to 2.13 ± 0.014, and 0.20 ± 0.009 to 0.20 ± 0.01 µg/kg, respectively, and those in the water samples were 92.40 ± 3.66 to 102.9 ± 5.6, 53.76 ± 6.7 to 171.4 ± 57.6, 11.01 ± 1.11 to 44.4 ± 0.50 µg/kg, respectively. This implies that the concentrations of Pb and As in the soil were higher than those in the water samples, whereas those of Cd and Hg were higher in the water samples than in the soil samples.
Location Water (mean ± SD) Soil (mean ± SD) As Cd Hg Pb As Cd Hg Pb Khomein 55.5 ± 9.5a 5.09 ± 0.16a 20.13 ± 0.22ab 101.6 ± 3.3ab 95.80 ± 6.4b 0.207 ± 0.012a 0.81 ± 0.015a 246.62 ± 1.29b Khondab 54.16 ± 7.2a 5.30 ± 0.53a 20.27 ± 0.45ac 102.9 ± 5.6a 181.32 ± 6.5ab 0.2 ± 0.012a 2.13 ± 0.014b 318.72 ± 1.43c Tafresh 54.09 ± 8.8a 5.27 ± 0.47a 20.27 ± 0.47bc 101.06 ± 2.39ab 181.54 ± 1.24ab 0.2 ± 0.014a 0.81 ± 0.013a 281.93 ± 6.7a Delijan 54.06 ± 6.4a 5.26 ± 0.46a 20.29 ± 0.42a 101.7 ± 3.6ab 237.1 ± 1.01a 0.2 ± 0.011a 1.41 ± 1.04b 166.87 ± 3.5d Saveh 53.7 ± 6.7a 5.28 ± 0.48a 44.4 ± 0.50e 101.2 ± 2.7ab 79.17 ± 1.07b 0.2 ± 0.005a 0.80 ± 0.009a 146.01 ± 6.3e Mahallat 171.4 ± 57.6a 4.22 ± 1.34a 11.01 ± 1.11d 92.4 ± 3.6b 263.9 ± 9.95a 0.2 ± 0.008a 0.71 ± 0.062d 271.23 ± 4.4a Note. Different letters in the same column indicate significant differences (P < 0.05). Table 4. The mean level of different PTEs contamination in water and soil samples in different place of Markazi province (µg/L or kg)
-
The TF and the total mean TF in the fruits collected from the study sites are shown in Table 5. The order of the ability of all examined fruits to absorb PTEs was Cd > Hg > Pb > As. Although fruits can uptake the highest levels of Cd from the soil, they can also absorb the lowest level of As from the soil. Among the fruits, grape showed the highest TF level for Cd and Hg, whereas the lowest TF level was found for As in plum, apple, peach, and nectarine.
Fruits As Cd Hg Pb Plum 0.001 0.113 0.074 0.016 Apple 0.001 0.238 0.063 0.013 Grape 0.003 0.439 0.242 0.013 Peach 0.001 0.118 0.083 0.015 Nectarine 0.001 0.114 0.050 0.009 Table 5. The level of transfer factor for different PTEs in fruit samples (µg/kg)−1
-
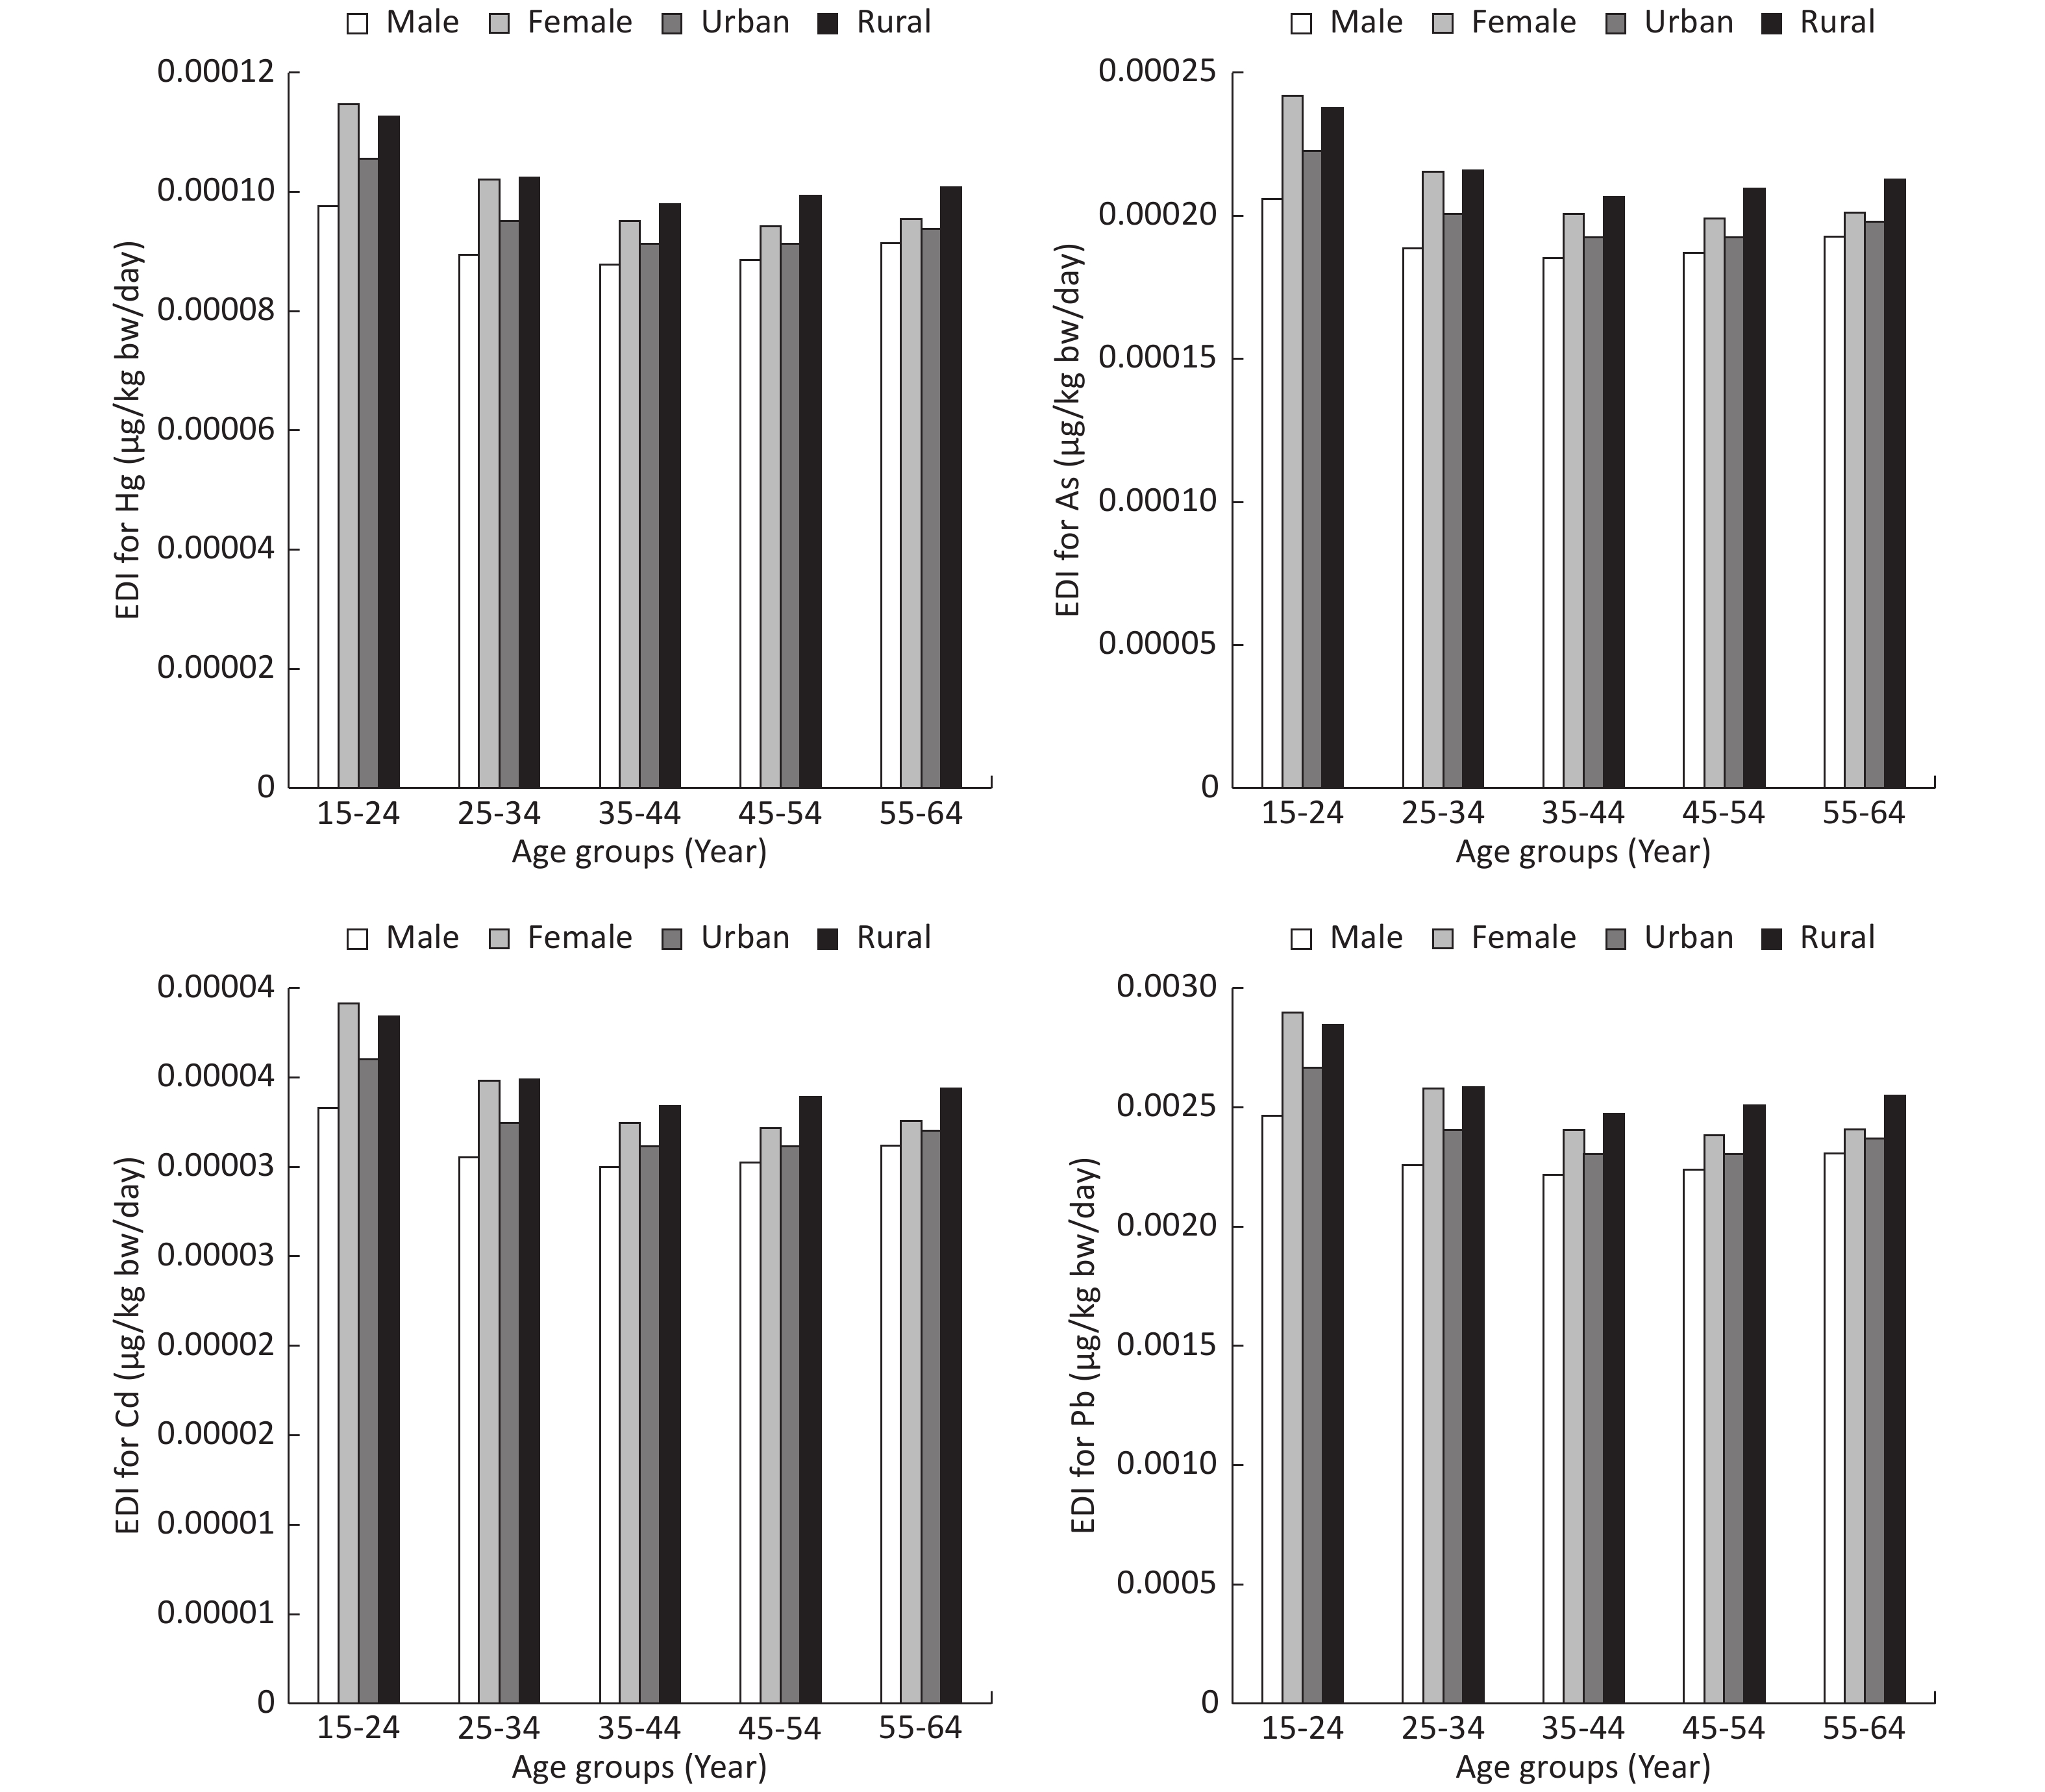
EDI values in adults due to contamination with As, Cd, Hg, and Pb were 1.32 × 10⁻⁷, 2.84 × 10⁻⁸, 9.45 × 10⁻⁸, and 5.34 × 10⁻⁹ µg/kg·d, respectively. EDI values in children due to the ingestion of As, Cd, Hg, and Pb through fruit consumption were 2.45 × 10⁻⁷, 5.29 × 10⁻⁸, 1.76 × 10⁻⁷, and 9.97 × 10⁻⁹ µg/kg·d, respectively (Table 6). EDI values in both adults and children were lower than the TDI for As (2 µg/kg·d), Cd (1 µg/kg·d), Hg (0.71 µg/kg·d), and Pb (3.6 µg/kg·d) recommended by the FAO/WHO/ food safety agency (FSA)[56].
Consumer group Heavy metal EDI Adults As 1.32 × 10⁻⁷ Cd 2.84 × 10⁻⁸ Hg 9.45 × 10⁻⁸ Pb 5.34 × 10⁻⁹ Children As 2.45 × 10⁻⁷ Cd 5.29 × 10⁻⁸ Hg 1.76 × 10⁻⁷ Pb 9.97 × 10⁻⁹ Table 6. EDI in the adults and children due to ingestion fruits content of PTEs (µg/kg·d)
-
When the THQ and/or the TTHQ is > 1, there could be adverse health effects, but when the THQ is ≤ 1, adverse health effects are not probable[6, 38]. The total mean value of THQ and HQ of PET and also, RfD are presented in Table 7.
As Cd Hg Pb HQ 0.6782 0.0329 0.3215 0.6962 THQ 0.7459 0.0380 0.3236 0.6914 RfD 0.0003 0.0010 0.0003 0.0035 Table 7. The RfD and total mean value of THQ and HQ of metals
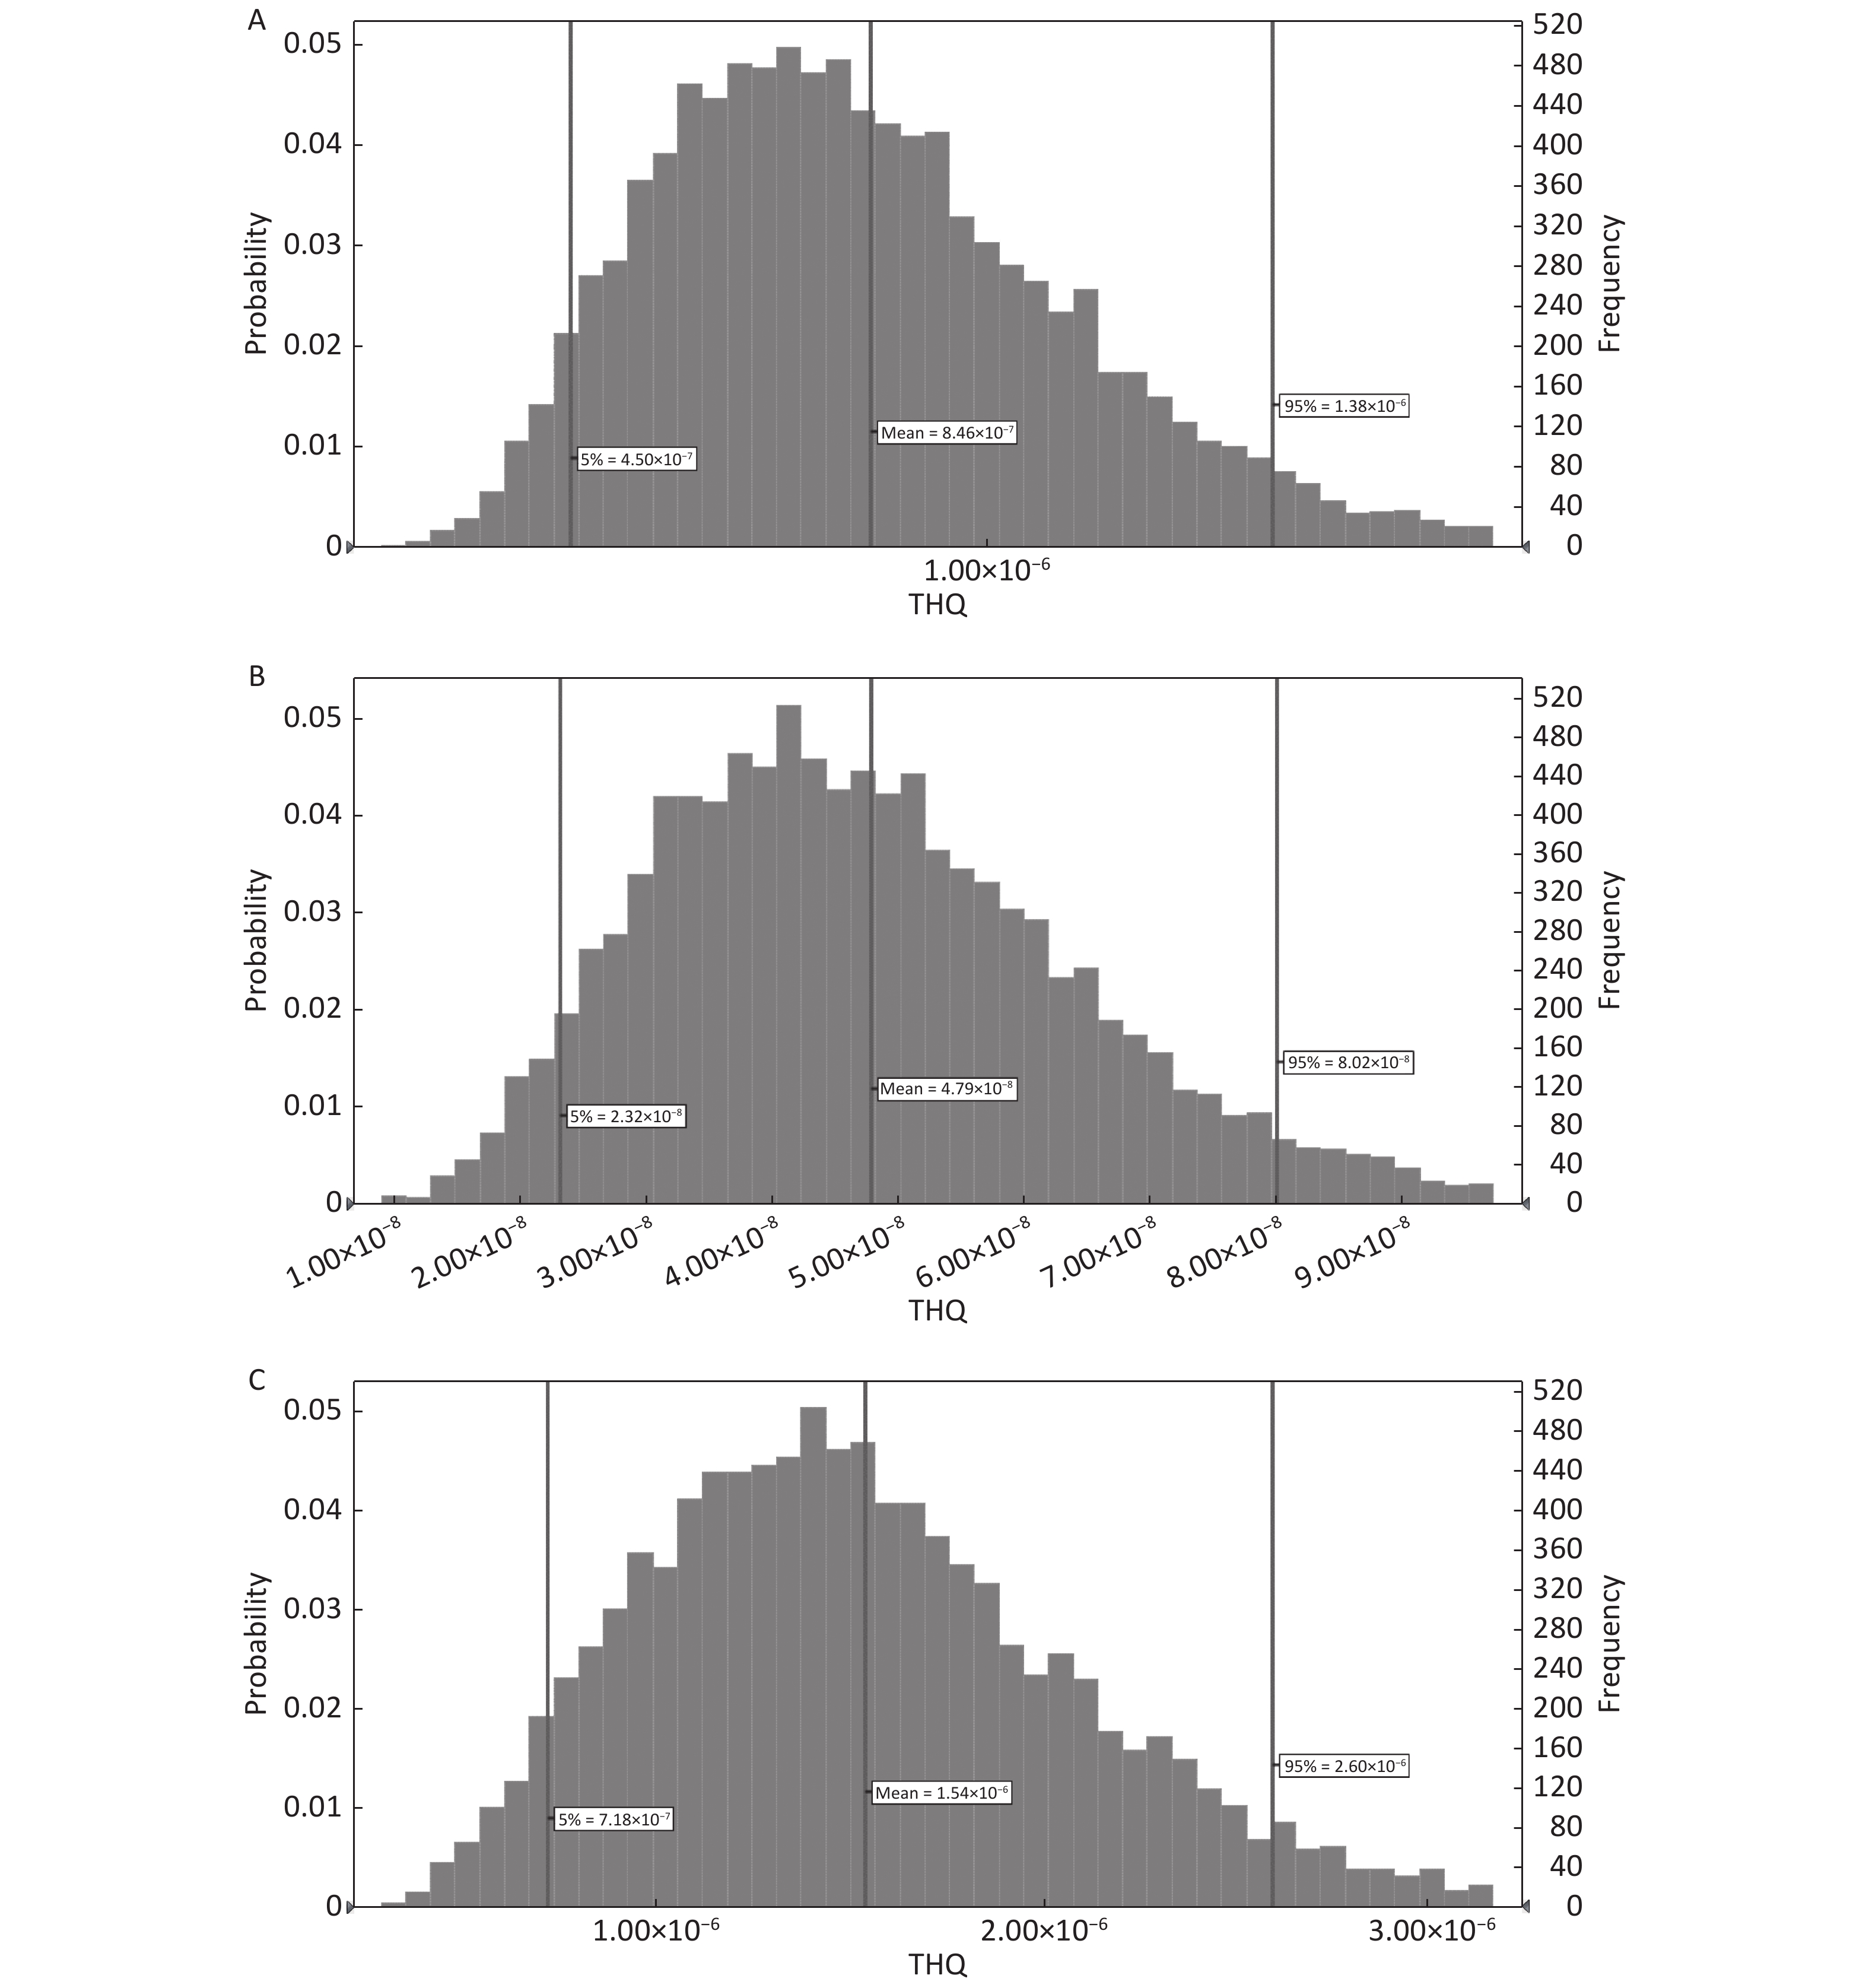
In this context, the 95th percentiles of THQ in adults due to the ingestion of PTEs (As, Cd, and Hg) through the consumption of fruits were 7.75 × 10⁻⁷, 4.46 × 10⁻⁸, and 1.46 × 10⁻⁶, respectively (Figure 4A-C); however, the corresponding values for the same PTEs in children were 1.38 × 10⁻⁶, 8.02 × 10⁻⁸, and 2.60 × 10⁻⁶, respectively (Figure 5A-C). The rank order of PTEs based on their THQ in both adults and children was Hg > As > Cd. The THQ of Hg was higher than that of other PTEs primarily due to the lower assigned RfD for Hg[60]. The THQ in children was 1.78 times higher than that of adults due to their lower BW[51-53]. Moreover, the TTHQ values in adults and children due to the ingestion of As, Cd, and Hg were 9.00 × 10⁻⁶ and 4.06 × 10⁻⁶, respectively. The 95th percentiles of THQ and TTHQ in both adults and children were much lower than 1 (Figures 5 and 6) because of the low concentration of PTEs[51-53] and the low ingestion rate of fruits[55].

Figure 4. EDI induced by fruit intake content of potentially toxic elements (PTEs) in the male, female, urban, and rural areas of Iran.
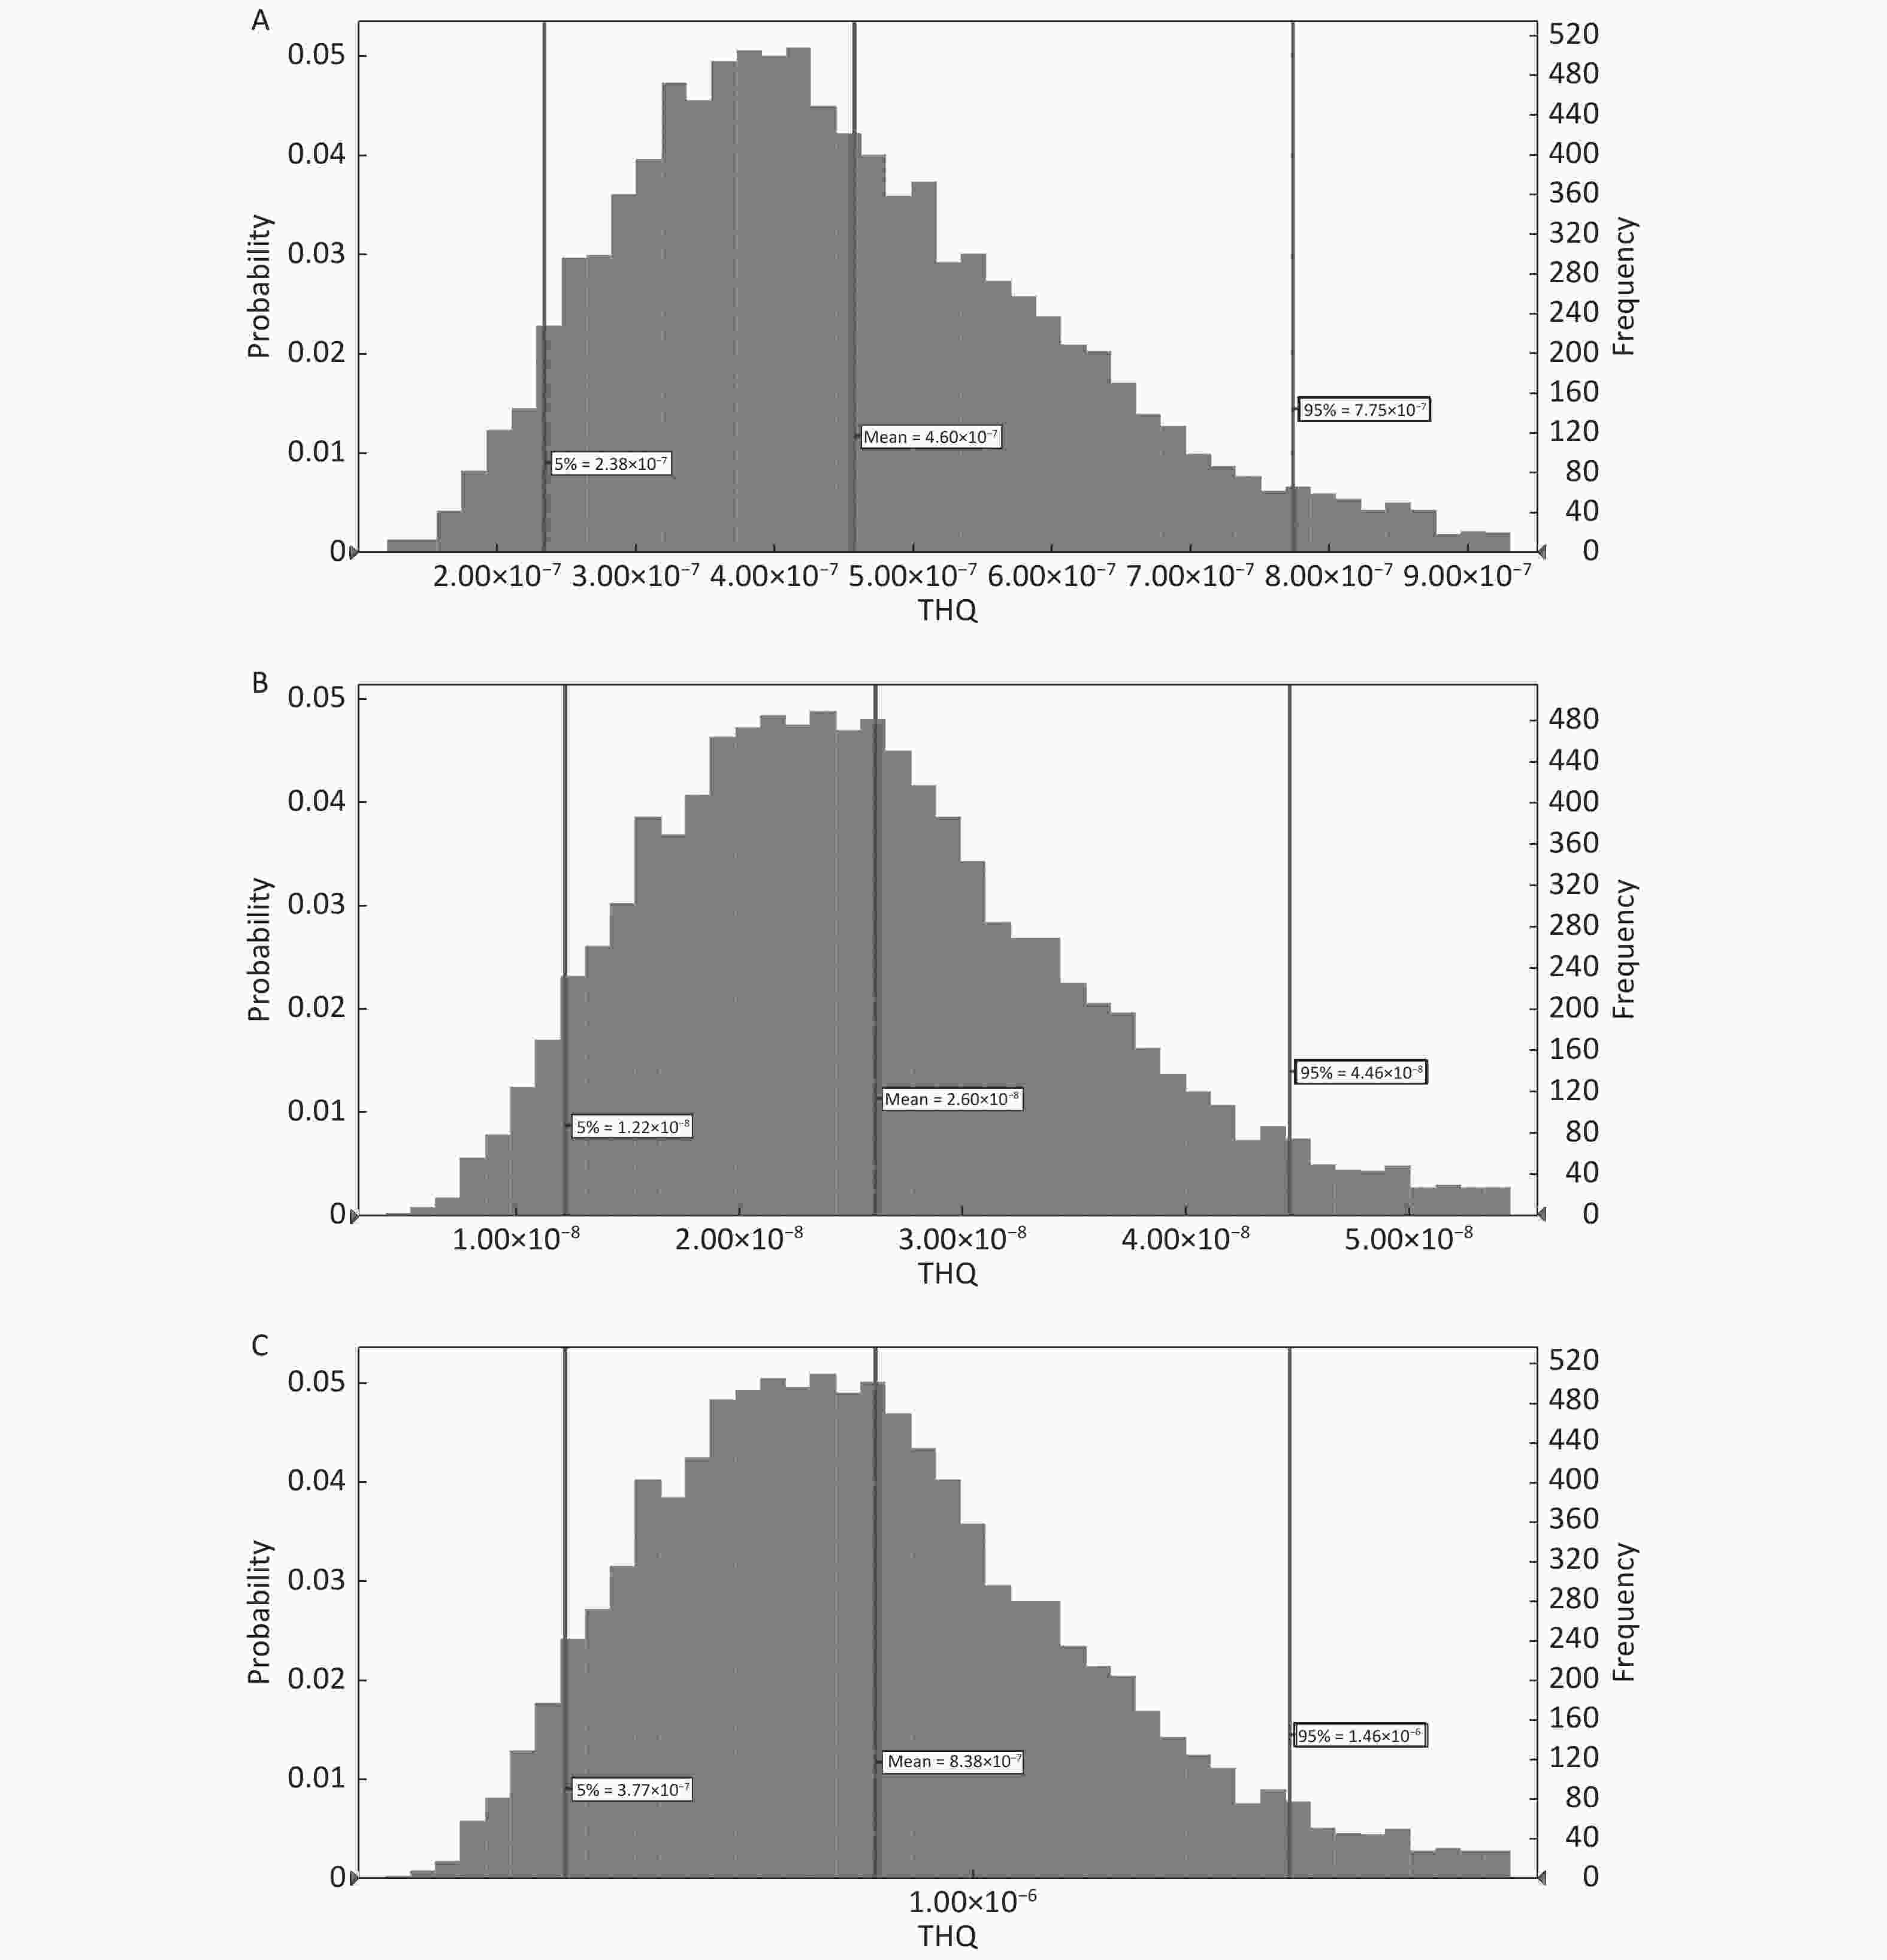
Figure 5. THQ of As (A), Cd (B), and Hg (C) in the adults fruits consumers

Figure 6. THQ of As (A), Cd (B), and Hg (C) in the children fruits consumers
-
The accumulation of Pb in the human body can cause anemia and inhibit the activities of porphobilinogen synthase and ferrochelatase[73]. In this study, the mean concentration of Pb among all fruit samples was found to be approximately 3.10 ± 1.58 µg/kg, which did not exceed the recommended limit (200 µg/kg). Consumption of food products contaminated with Hg can result in extensive corrosive damages to the gastrointestinal tract[74] as well as in kidney function. However, the mean level of Hg among all the examined fruits was 0.122 ± 0.15 μg/kg, which was lower than the permissible limit (10 µg/kg)[75]. Regarding As and Cd, it is known that the ingestion of As through food products can cause oxidative stress and abnormalities in chromosomes[76] and Cd acts as a mitogen, which can further lead to cancer[77]. However, the mean levels of these two PTEs were lower (0.259 ± 0.20 and 0.041 ± 0.06 µg/kg, respectively) than the standard limits proposed by the WHO (permissible limit for Cd and As in bulb and fruits is 50 µg/kg)[78]. Furthermore, the ISIRI has set a limit of 50 µg/kg for Cd in fruits[72].
The average concentrations of the 4 PTEs Cd, Hg, Pb, and As found in this study were consistent to the values reported by Banerje et al. (2010), especially in terms of the levels of Pb and Cd in fruits collected from India[76]. Elbagermi et al. (2012) reported that the mean levels of Pb in potatoes and mangoes were approximately 20 and 1,824 µg/kg, respectively. The concentration of Cd ranged from 10 µg/kg in strawberries to 362 µg/kg in mangos. The authors concluded that the higher levels of PTE contamination in some fruits and vegetables can be associated with the presence of pollutants in irrigation water, farm soil, and pesticides, and/or pollution from traffic on the highways[11]. Radwan and Salamaet (2006) reported that the levels of Pb, Cd, Cu, and Zn in some Egyptian fruits were 20-1,080, < LOD-80, 900-25,900, 1,010-11,200 mg/kg, respectively[37].
However, according to the findings of this study, the levels of PTEs in soil and water were high, whereas the amount of toxic metals in fruits cultivated in these soils and irrigated with these waters was low. Therefore, it can be stated that fruits cannot accumulate a high level of PTEs in their tissues. According to the WHO, the permissible limits of PTEs in soil are 2,000 µg/kg for Hg, 50,000 µg/kg for Pb, 3,000 µg/kg for Cd, and 20,000 µg/kg for As[79], and the recommended levels in irrigation water are 5,000 µg/L for Pb, 10 µg/L for Cd, 100 µg/L for As[80], and 1,000 µg/L for Hg[81]. However, the contamination with PTEs among all soil and water samples was lesser than the permissible limit, and the level of Hg in irrigation water was higher than the WHO/FAO permissible limit, which can be correlated with industrial activities around the sampling zones as well as the highly observed air pollution in this province[82]. Krishna et al. (2006) investigated the accumulation of PTEs in soil from an industrial area of Surat, Gujarat, Western India. They reported higher concentrations of Cu and Zn in the soil samples collected from the industrial areas[80], and a significant correlation was found between the distance from the industrial areas and the levels of some of the PTEs in soil.
In addition to the total concentration of PTEs in soil, several parameters could influence the TF, and crops also have different abilities to uptake and accumulate PTEs[83]. In this context, the reported variation in the level of TF among the different fruits can be related to the ability of trees to uptake PTEs, the element chemistry, the characteristics of the soil such as the pH, organic matter contents, fertilizer, and extension of the root system in the soil, and also the ability of storage tissues to absorb and accumulate PTEs[84-85].
Mbong et al. (2014) investigated the level of PTEs in Citrus reticulata cultivated in urban and rural areas and found a higher TF for Pb in rural areas, whereas the corresponding TF values for Fe, Cd, and Cr in urban areas were twice higher than those in rural areas, which can be correlated to the phytoavailability of PTEs and also the high anthropogenic activities and disparities in soil properties[83-84]. Mirecki et al. (2015) determined the levels of 4 PTEs in different plants and reported that the level of TF is related to the type of the plant and further found that sometimes with an increase in the level of PTEs in the soil, the level of TF decreases[86]. In our study, the order of TF levels was Cd > Hg > Pb > As, whereas the order of PTEs in soil was Pb > As > Hg > Cd, which implies that at higher levels of As than Pb in soil, these fruit trees can absorb a higher level of Pb. According to the findings of Ghasemidehkordi et al. (2018), among different vegetables cultivated in Markazi Province, the level of As in vegetables in comparison with fruits in that area was higher than the safety limit[9]. The survey the level Pb and Hg in vegetables demonstrated that vegetables can uptake higher concentration of Pb in tissues and also fruits in the present study can absorb and accumulate a higher level of Pb.
Regarding the EDI of toxic elements, according to Bagdatlioglu et al. (2010), the EDI values of Cd and Pb in all Turkish fruit samples (cherry and grape) were lower than the safety limit of provisional tolerable weekly intakes (PTWI)[36]. The findings of Guerra et al. (2012) indicated that the daily intake of PTEs such as As, Cd, Pb, Hg and Cr through fresh fruit consumption might not be risky for consumers because the values were below the recommended daily intake of these PTEs[85]. Orisakwe et al. (2012) performed an assessment of health risk due to the ingestion of PTEs (Pb, Cd, and Hg) through the consumption of fruits (guava, banana, apple, bush butter, grape, orange, pawpaw, avocado, pineapple, local pear, tangerine, and bush mango) irrigated with wastewater in Owerri, Southeastern, Nigeria. Their results demonstrated that EDI for adults due to the ingestion of Pb via the consumption of apples was 1.4 (mg/kg·d)−1, whereas the EDI values for the ingestion of Pb and Cd via grape were 2 and 0.9 mg/kg·d, respectively[87].
Roba et al. (2016) also conducted an assessment of health risk due to the ingestion of fruits, including apple, grape, gooseberry, and blackcurrant, in urban and rural areas of Baia Mare mining area (Romania). Similar to the results of the current study, they reported that the THQ in all consumers due to Pb and Cd was < 1, indicating that the consumers are not at considerable health risk[88].
The 95th percentiles of CR in adults and children due to the ingestion of As through fruit consumption were 3.44 × 10⁻¹⁰ and 1.09 × 10⁻⁹, respectively (Figure 6A and B, Figure 7A and B). The 95th percentile of CR was lower than 1.00 × 10⁻⁶. Thus, consumers are not at considerable cancer risk due to As via oral ingestion.
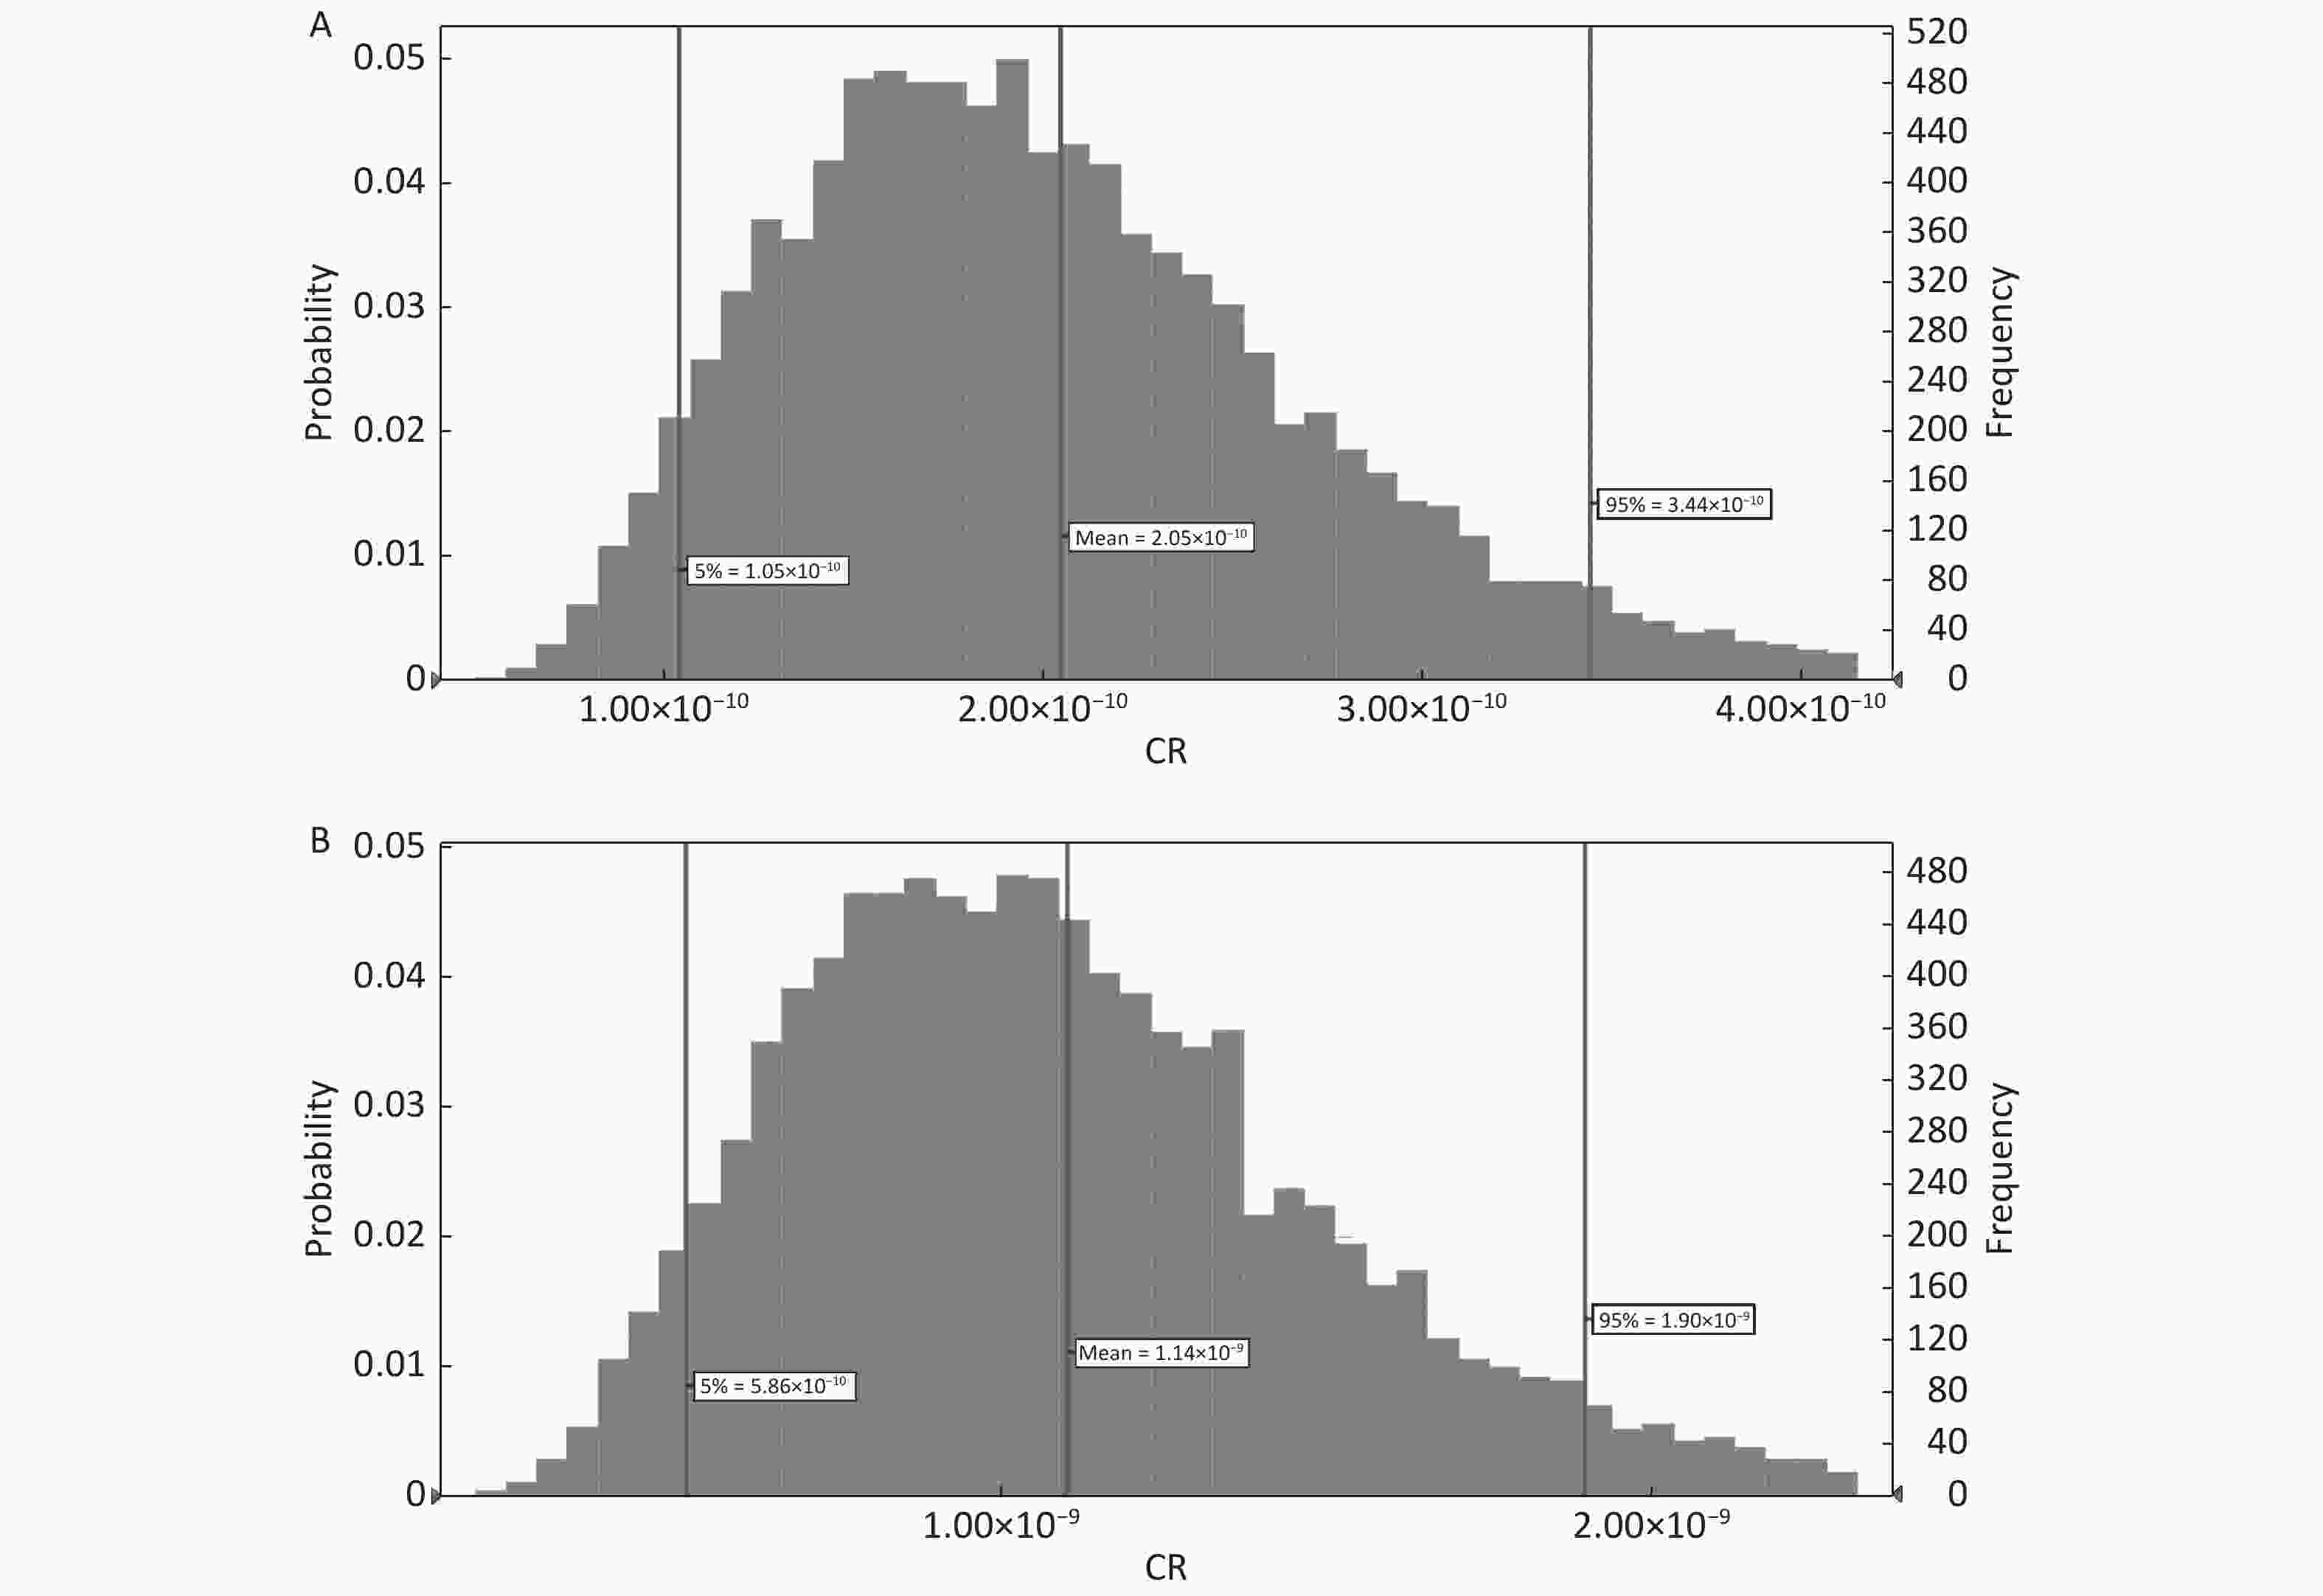
Figure 7. CR of As in the adults (A) and children (B) fruits consumers
-
This study evaluated the PTE concentrations in fruit, soil, and irrigation water samples in Markazi Province, along with an evaluation of the potential health risks associated with consumption of fruits. The investigated metal concentrations varied widely in fruits and according to the site of sample collection, and the PTE levels were lower than the allowable concentration. There was a significant difference in the total mean concentration of Pb (3.10 ± 1.58 µg/kg), Hg (0.122 ± 0.15 µg/kg), Cd (0.041 ± 0.06 µg/kg), and As (0.25 ± 0.20 µg/kg) among the different fruits as well as the sampling sites. The 95th percentiles of THQ and TTHQ used in the health risk assessment of PTEs provide a complete picture of the hazard index for human health, although the findings of this study suggest that the consumption of these fruits is free from risk in the investigated area. The exposed population (adults and children) was not at considerable noncarcinogenic (THQ and TTHQ < 1) and carcinogenic (CR < 1.00 × 10⁻⁶) risks due to the ingestion of PTEs through fruit consumption. Although the investigated PTEs in the fruit samples were in negligible levels, and the assessment of different factors was also within the standard limit. Regular monitoring of PTE levels in fruits in the industrial areas is recommended.
-
The authors declare that they have no conflict of interest.
-
Babak Peykarestan is grateful to the PNU for the financial support through the grant for faculty members. This study was approved and supported by the Payame Noor University (PNU), Tehran, Iran.
Potentially Toxic Element Concentration in Fruits Collected from Markazi Province (Iran): A Probabilistic Health Risk Assessment
doi: 10.3967/bes2019.105
- Received Date: 2019-03-26
- Accepted Date: 2019-08-26
-
Key words:
- Fruits /
- Soil /
- Water /
- Toxic elements /
- Target Hazard Quotient (THQ) /
- Estimated Hazard Index (HI)
Abstract:
| Citation: | Mohammad Rezaei, Bahareh Ghasemidehkordi, Babak Peykarestan, Nabi Shariatifar, Maryam Jafari, Yadolah Fakhri, Maryam Jabbari, Amin Mousavi Khaneghah. Potentially Toxic Element Concentration in Fruits Collected from Markazi Province (Iran): A Probabilistic Health Risk Assessment[J]. Biomedical and Environmental Sciences, 2019, 32(11): 839-853. doi: 10.3967/bes2019.105

|


 Quick Links
 DownLoad: