


-
Prehypertension and hypertension have been considered significant public health issues worldwide[1]. Disproportionate body fat distribution (excess fat stored in the liver and visceral compartment) is a well-established risk factor for prehypertension/hypertension[2]. However, the most commonly used anthropometric indicators, such as body mass index (BMI) and waist circumference (WC), cannot comprehensively distinguish the accumulation of visceral fat, specifically for non-obese individuals (with normal BMI and WC).
Recently, some central adiposity indices [conicity index (CI), a body shape index (ABSI), and body roundness index (BRI)] have been proposed as alternative indicators for the traditional anthropometric indicators and have demonstrated a significant association with hypertension. However, there are only few studies that investigated the association between these indicators and prehypertension/hypertension in non-obese individuals. Hence, we conducted this cross-sectional study to determine which central adiposity index was significantly associated with prehypertension and hypertension in non-obese Chinese subjects.
This cross-sectional study was based on the data of adults who underwent routine physical examination between November 2015 and September 2018 in China. Subjects who were pregnant, had malignant tumors and mental disorder, and with BMI ≥ 24 kg/m2 and/or WC ≥ 85 cm in men and ≥ 80 cm in women were excluded in this study. Finally, a total of 75,560 nonobese individuals were included in the analysis. This study was approved by the Ethics Committee of Hangzhou Aeronautical Sanatorium of Chinese Air Force.
Basic medical history and medication use data were collected by face-to-face interview. Anthropometric indicators, such as height, weight, WC, and hip circumference (HC), were measured by well-trained examiners. Blood pressure (BP) was measured three times at 2-min intervals after at least 5 min of rest using a standardized automatic electronic sphygmomanometer. The blood samples of subjects were collected after a minimum of 8 h of overnight fasting. Serum levels of fasting plasma glucose (FPG), plasma uric acid (UA), total cholesterol, triglyceride (TG), low-density lipoprotein cholesterol, and high-density lipoprotein cholesterol (HDL-C) were determined using a biochemical autoanalyzer.
Prehypertension was defined as having either a systolic blood pressures (SBP) of 120–139 mmHg and/or diastolic blood pressures (DBP) of 80–89 mmHg without taking antihypertensive medication. Hypertension was defined as an SBP ≥ 140 mmHg and/or DBP ≥ 90 mmHg or antihypertensive medication use. Nonobese was defined as having BMI < 24 kg/m2 and WC < 85 cm in men and < 80 cm in women. The three central adiposity indices were calculated using the following formulas:
$$\text{CI} =\text{WC} \div \left[ {{\rm{0}}{.{\text{109}} \times }\dfrac{{{\rm{\text{weight (kg)}}}}}{{{\rm{\text{height (cm)}}}}}} \right]^{[3]},$$ (1) $$\text{CI}=\text{WC} \div \left( {\text{BMI}{^{\frac{{\text{2}}}{{\text{3}}}}} \times {\rm{\text{heigh}}}{{\rm{t}}^{\frac{{\text{1}}}{{\text{2}}}}}} \right)^{[4]},$$ (2) and
$$\text{BRI} = {\text{364.2}}-{\text{365.5}} \times \sqrt {\text{1} - {{(\dfrac{{\text{WC}}}{{\text{2}\pi }})}^{\text{2}}} \div {{\left( {0.5 \times \text{height}} \right)}^{\text{2}}}} \;^{[5]}.$$ (3) Data were expressed as the mean and standard deviation (continuous variables) or numbers and percentages (categorical variables). Differences between different groups were compared using t-test, analysis of variance, nonparametric test, or χ2 test. CI, ABSI, and BRI were divided into four quartiles, and the lowest quartile was used as a reference. After adjusting for age, sex, smoking status, and medication (antihypertensive agents, statins, low-dose aspirin, and hypoglycemic agents), logistic regression analysis was performed to investigate the association between CI, ABSI, and BRI and prehypertension/hypertension. Receiver operating characteristic (ROC) analyses and the area under the ROC curves (AUC) were then used to assess the ability of the three central adiposity indices for discriminating prehypertension/hypertension. Statistical analysis was performed using the Statistical Package for the Social Sciences (SPSS) version 18.0 (SPSS Inc.). P-value < 0.05 was considered statistically significant.
Table 1 shows the demographic and clinical characteristics of the 75,560 obese subjects according to their BP, including 34.3% with prehypertension and 10.6% with hypertension. Compared with normotensive individuals, the cohort with prehypertension and hypertension exhibited a significantly higher number of male subjects, and higher age, BMI, WC, ABSI, and BRI, but lower HDL-C and FPG. The subjects with prehypertension but not hypertension had significantly higher TG and UA than those with normotension.
Variable Total Normotension Prehypertension P value* Hypertension P value# No., n (%) 75,560 41,598 (55.1) 25,922 (34.3) − 8,040 (10.6) − Age, y 42.2 ± 12.2 39.8 ± 10.1 42.8 ± 12.7 < 0.001 52.3 ± 14.9 < 0.001 Female, n (%) 40,356 (53.4) 26,918 (64.7) 10,531 (40.6) < 0.001 2,894 (36) < 0.001 BMI (kg/m2) 21.2 ± 1.7 20.9 ± 1.8 21.4 ± 1.7 < 0.001 21.8 ± 1.6 < 0.001 WC (cm) 72.2 ± 6.2 70.8 ± 6.1 73.5 ± 5.9 < 0.001 74.9 ± 5.6 < 0.001 SBP (mmHg) 117.9 ± 15.6 107.1 ± 8.0 126.4 ± 6.3 < 0.001 146.7 ± 12.5 < 0.001 DBP (mm Hg) 72.1 ± 10.3 66.0 ± 6.7 76.8 ± 7.0 < 0.001 88.4 ± 9.7 < 0.001 FPG (mmol/L) 5.75 ± 1.22 5.76 ± 1.22 5.75 ± 1.22 0.402 5.74 ± 1.20 0.394 TC (mmol/L) 4.78 ± 0.90 4.78 ± 0.91 4.78 ± 0.89 0.731 4.77 ± 0.88 0.577 TG (mmol/L) 1.58 ± 1.34 1.58 ± 1.35 1.59 ± 1.34 0.690 1.58 ± 1.31 0.607 HDLc (mmol/L) 1.46 ± 0.33 1.47 ± 0.33 1.46 ± 0.33 0.302 1.46 ± 0.32 0.809 LDLc (mmol/L) 2.71 ± 0.77 2.71 ± 0.77 2.71 ± 0.76 0.527 2.69 ± 0.74 0.111 UA (μmol/L) 346.9 ± 88.6 346.4 ± 88.2 347.7 ± 89.2 0.076 346.7 ± 89.3 0.828 CI 19.03 ± 1.13 19.05 ± 1.14 18.93 ± 1.11 < 0.001 19.18 ± 1.17 < 0.001 ABSI 0.0735 ± 0.0037 0.0730 ± 0.0037 0.0738 ± 0.0036 < 0.001 0.0749 ± 0.0036 < 0.001 BRI 2.30 ± 0.55 2.21 ± 0.54 2.36 ± 0.54 < 0.001 2.57 ± 0.53 < 0.001 Note. UA, plasma uric acid; BMI, body mass index; WC, waist circumference; SBP, systolic blood pressure; DBP, diastolic blood pressure; FPG, fasting plasma glucose; TC, total cholesterol; TG, triglyceride; HDLc, high-density lipoprotein cholesterol; LDLc, low-density lipoprotein cholesterol; CI, conicity index; ABSI, a body shape index; BRI, body roundness index; *, compared with normotensive group; #, compared with non-hypertensive group. Table 1. Clinical characteristics of non-obese subjects
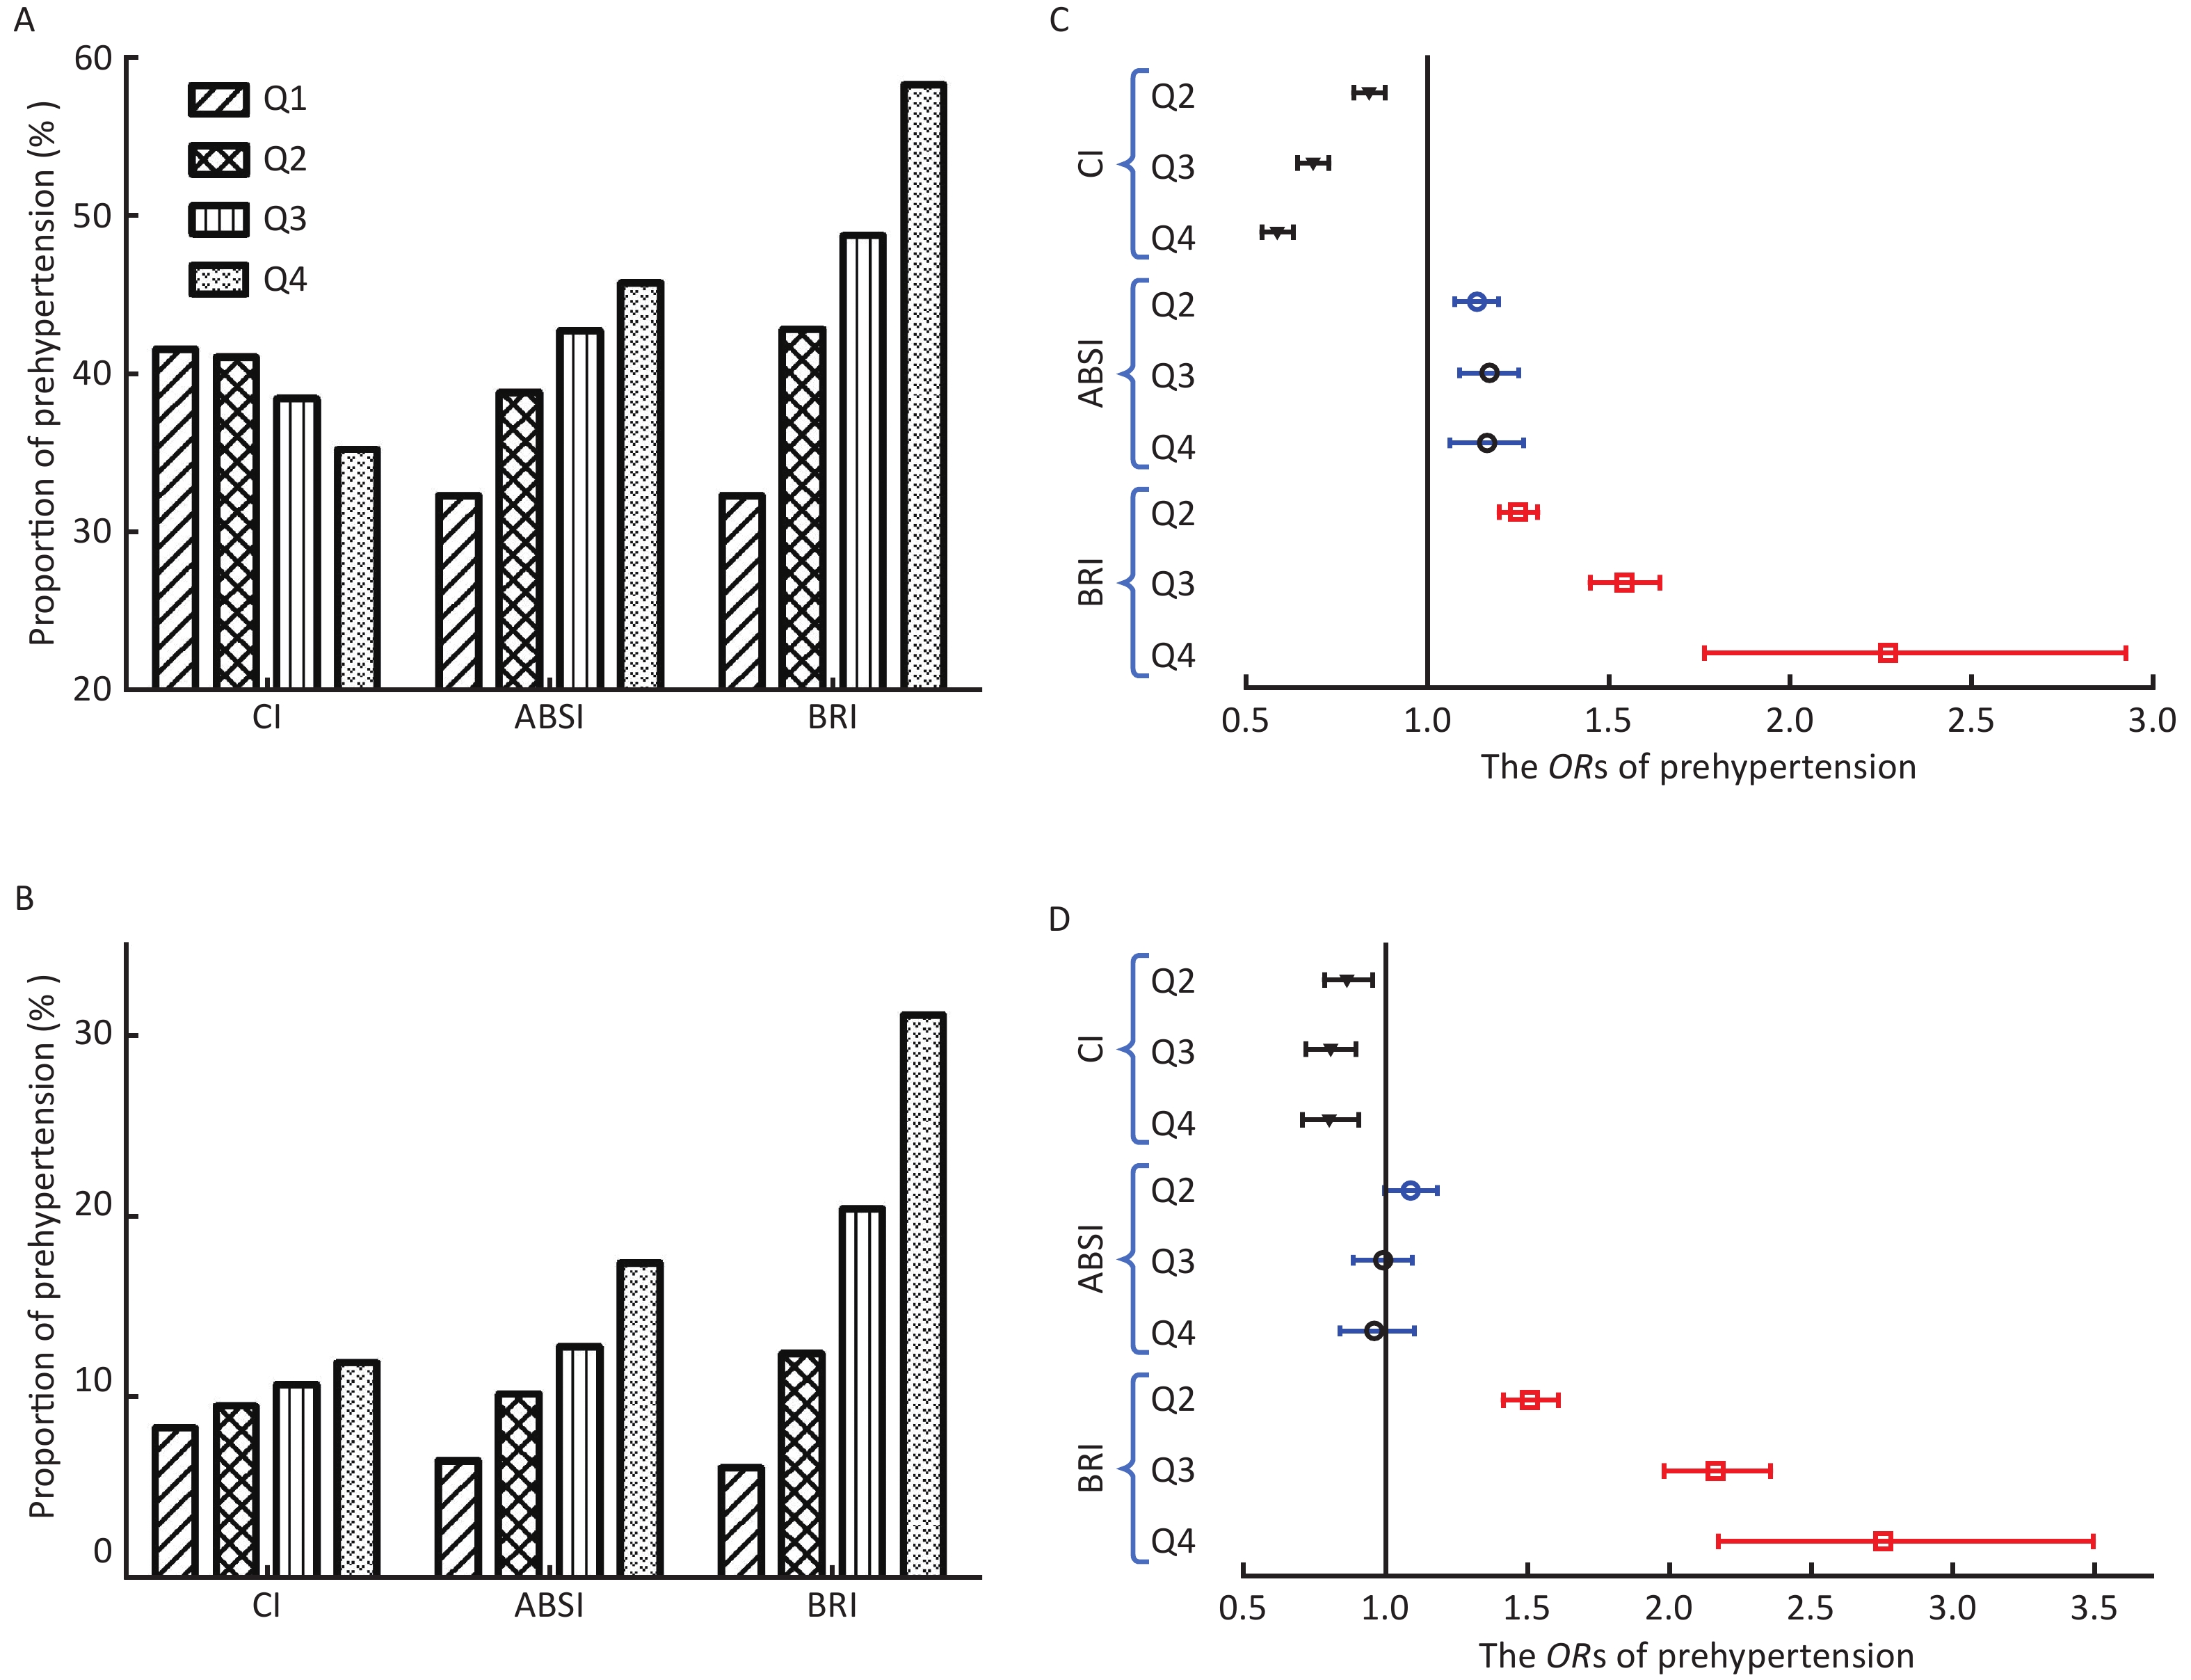
The proportion of prehypertension increased with the increase of ABSI and BRI quartiles, but the proportion decreased in CI (Figure 1A). The proportion of patients with hypertension significantly increased with the increase in CI, ABSI, and BRI quartiles (Figure 1B). The details of logistic regression analysis are shown in Supplementary Tables S1–S2 available in www.besjournal.com, and the odds ratios (ORs) of prehypertension/ hypertension with each quartile increase of the three central adiposity indices are shown in Figure 1C–D. After adjusting for all the possible confounders, each quartile increase of ABSI and BRI continued to have significant ORs for prehypertension, whereas that of CI was nonsignificant. The ORs for prehypertension in the fourth quartile of ABSI and BRI were 1.157 [95% confidence interval (CI), 1.061–1.263] and 2.272 (95% CI, 1.763–2.927), respectively, with all P < 0.001 (Figure 1C). Only each quartile increase of BRI continued to have significant ORs for hypertension after adjusting all the possible confounders. The OR for hypertension in the fourth quartile of BRI was 2.756 (95% CI, 2.174–3.494) with P < 0.001 (Figure 1D).
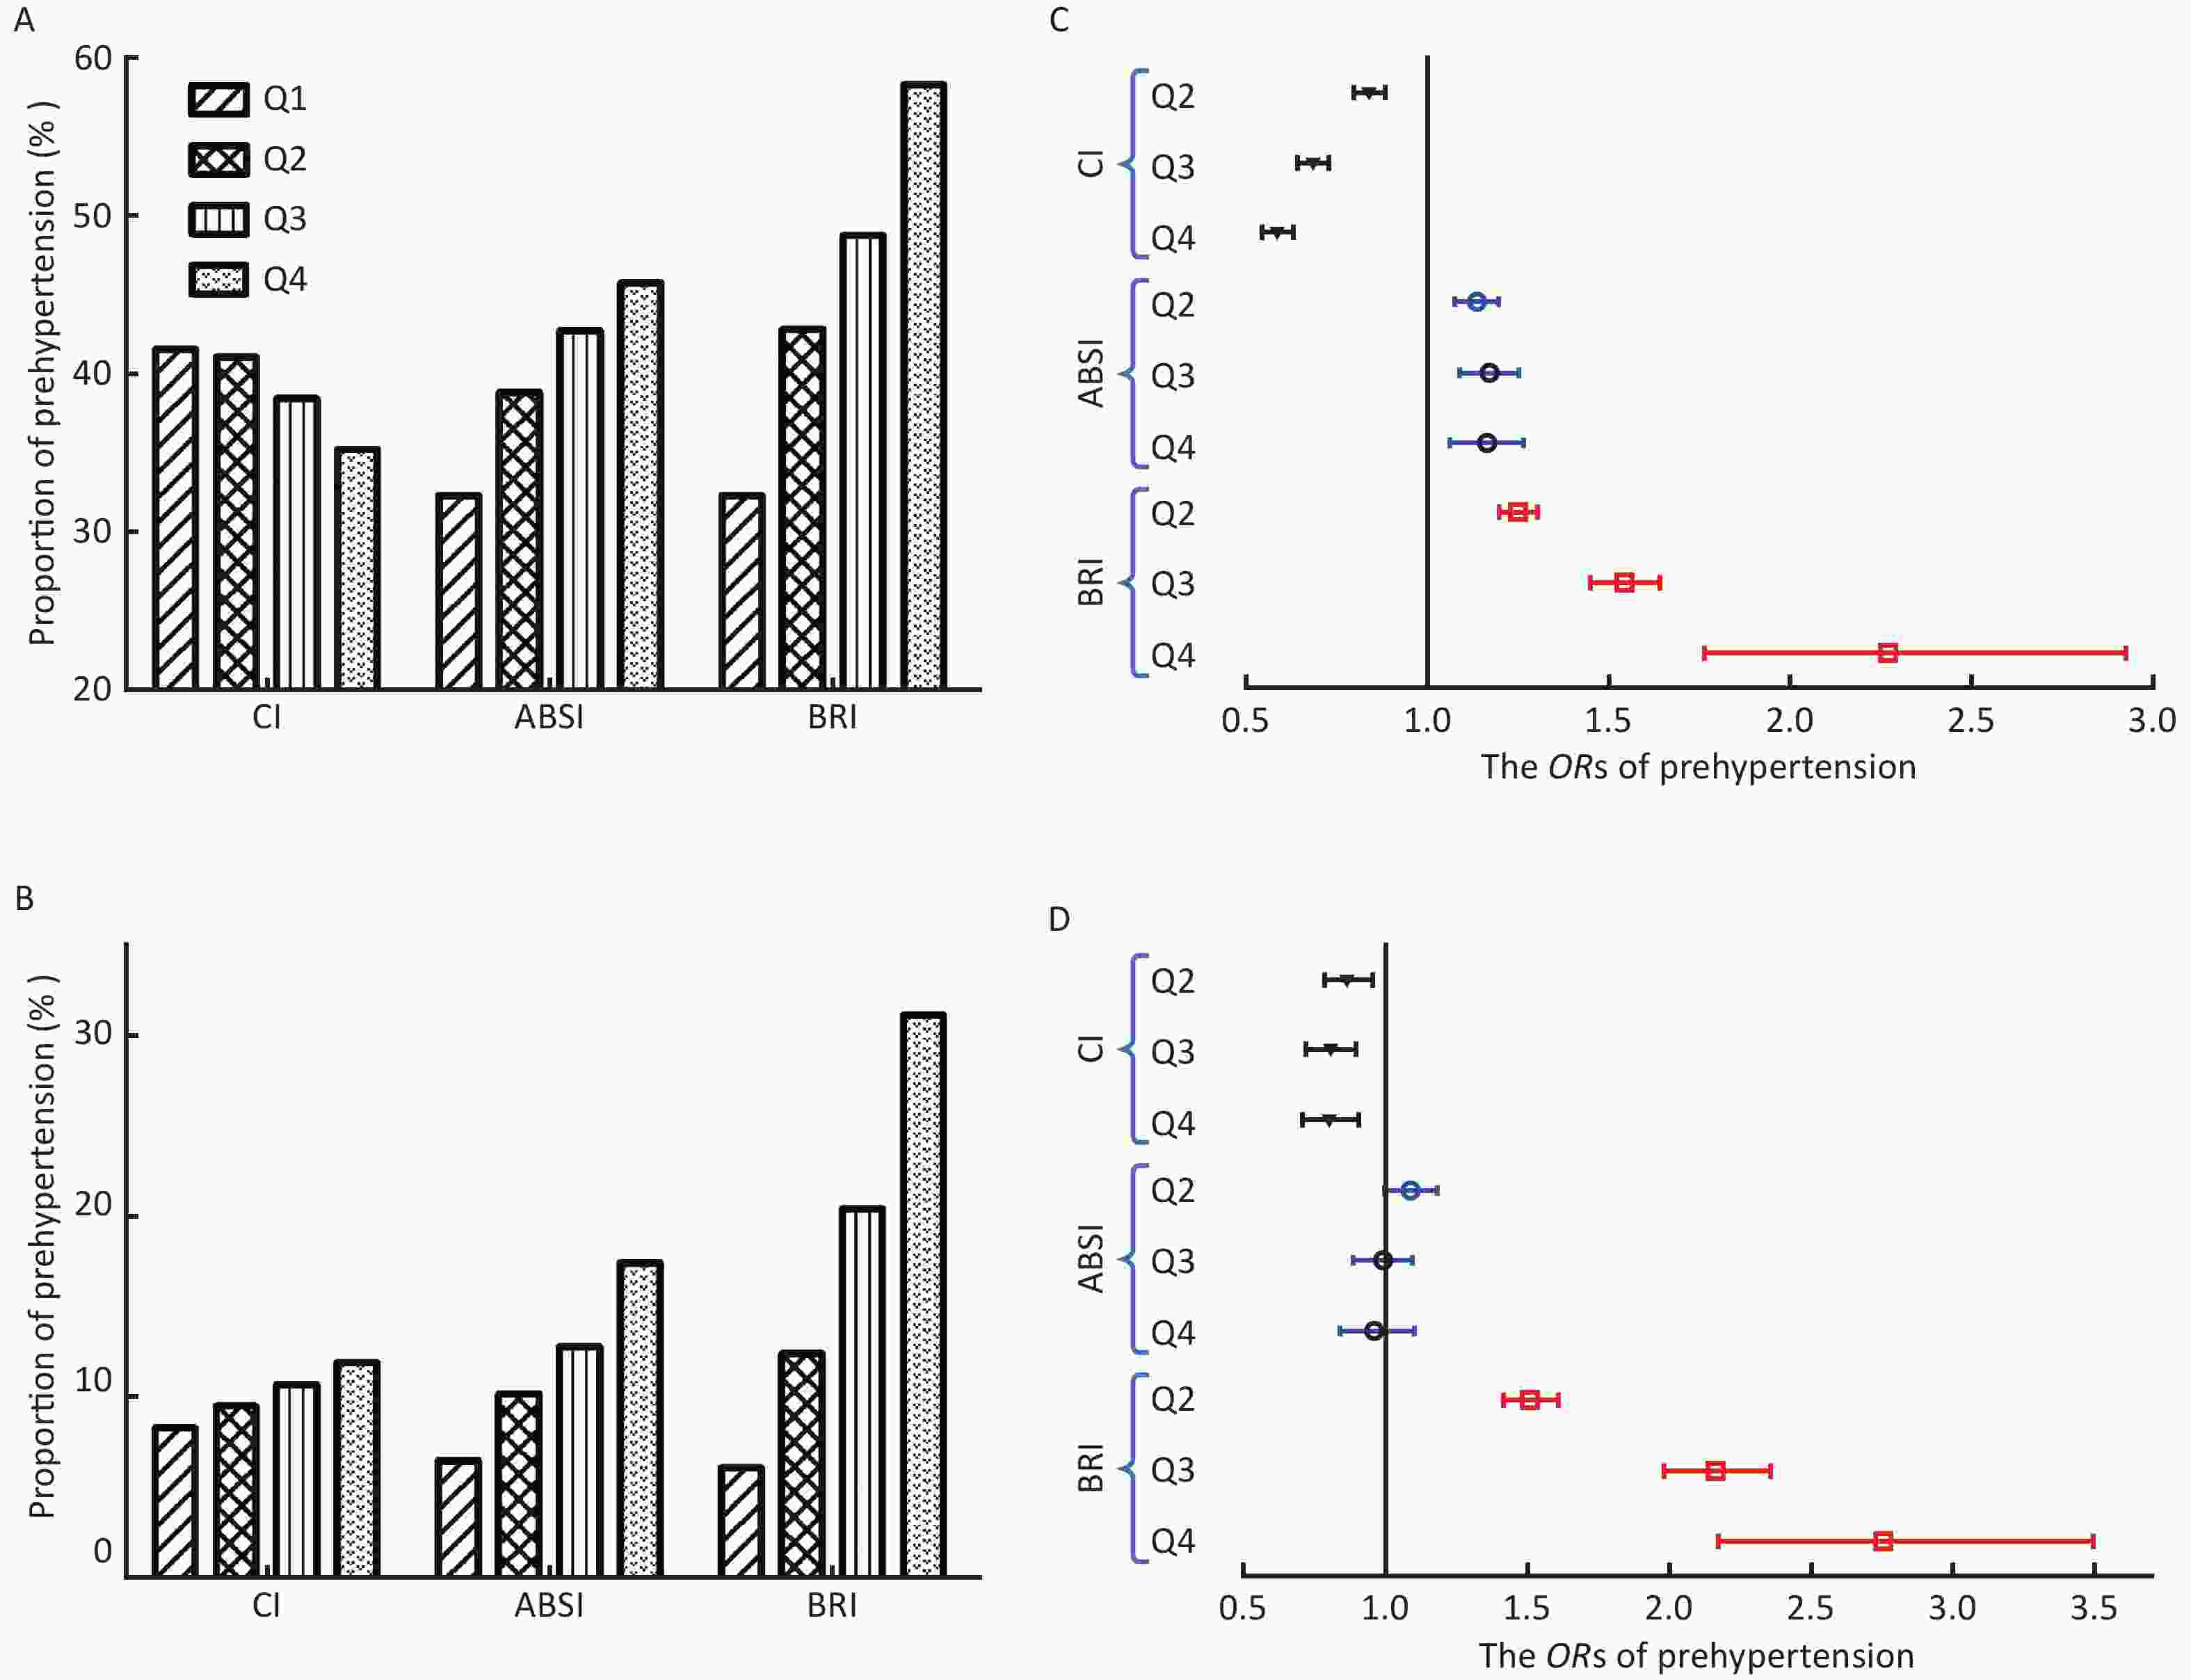
Figure 1. The proportion of prehypertension/hypertension and odds ratio (OR) by quartiles of the three central adiposity indices. (A) The proportion of prehypertension by quartiles of CI, ABSI, and BRI. (B) The proportion of hypertension by quartiles of CI, ABSI, and BRI. (C) The ORs of prehypertension by the three central adiposity indices quartile (reference to the lowest quartile). (D) The ORs of hypertension by the three central adiposity indices quartile (reference to the lowest quartile); CI, conicity index; ABSI, a body shape index; BRI, body roundness index.
Variable B SE Wals df P−value OR 95% CI CI Q1 226.392 3 < 0.001 Q2 −0.180 0.029 37.453 1 < 0.001 0.835 0.788−0.885 Q3 −0.382 0.032 145.067 1 < 0.001 0.683 0.642−0.726 Q4 −0.539 0.038 202.335 1 < 0.001 0.583 0.542−0.628 ABSI Q1 26.529 3 < 0.001 Q2 0.126 0.026 22.994 1 < 0.001 1.134 1.077−1.194 Q3 0.154 0.034 20.445 1 < 0.001 1.167 1.091−1.247 Q4 0.146 0.045 10.744 1 < 0.001 1.157 1.061−1.263 BRI Q1 225.586 3 < 0.001 Q2 0.222 0.021 115.179 1 < 0.001 1.249 1.199−1.301 Q3 0.432 0.032 185.349 1 < 0.001 1.541 1.448−1.640 Q4 0.821 0.129 40.289 1 < 0.001 2.272 1.763−2.927 Note. CI, conicity index; ABSI, a body shape index; BRI, body roundness index. Table S1. The details of logistic regression analysis for prehypertension
Variable B SE Wals df P−value OR 95% CI CI Q1 16.791 3 0.001 Q2 −0.147 0.050 8.729 1 0.003 0.863 0.783−0.952 Q3 −0.218 0.054 16.503 1 < 0.001 0.804 0.724−0.893 Q4 −0.224 0.062 12.896 1 < 0.001 0.799 0.708−0.903 ABSI Q1 10.632 3 0.014 Q2 0.082 0.043 3.590 1 0.058 1.085 0.997−1.181 Q3 −0.014 0.054 0.063 1 0.801 0.986 0.887−1.097 Q4 −0.039 0.068 0.335 1 0.563 0.961 0.842−1.098 BRI Q1 329.341 3 < 0.001 Q2 0.410 0.033 151.057 1 < 0.001 1.507 1.412−1.609 Q3 0.771 0.044 312.355 1 < 0.001 2.161 1.984−2.354 Q4 1.014 0.121 70.135 1 < 0.001 2.756 2.174−3.494 Note. CI, conicity index; ABSI, a body shape index; BRI, body roundness index. Table S2. The details of logistic regression analysis for hypertension
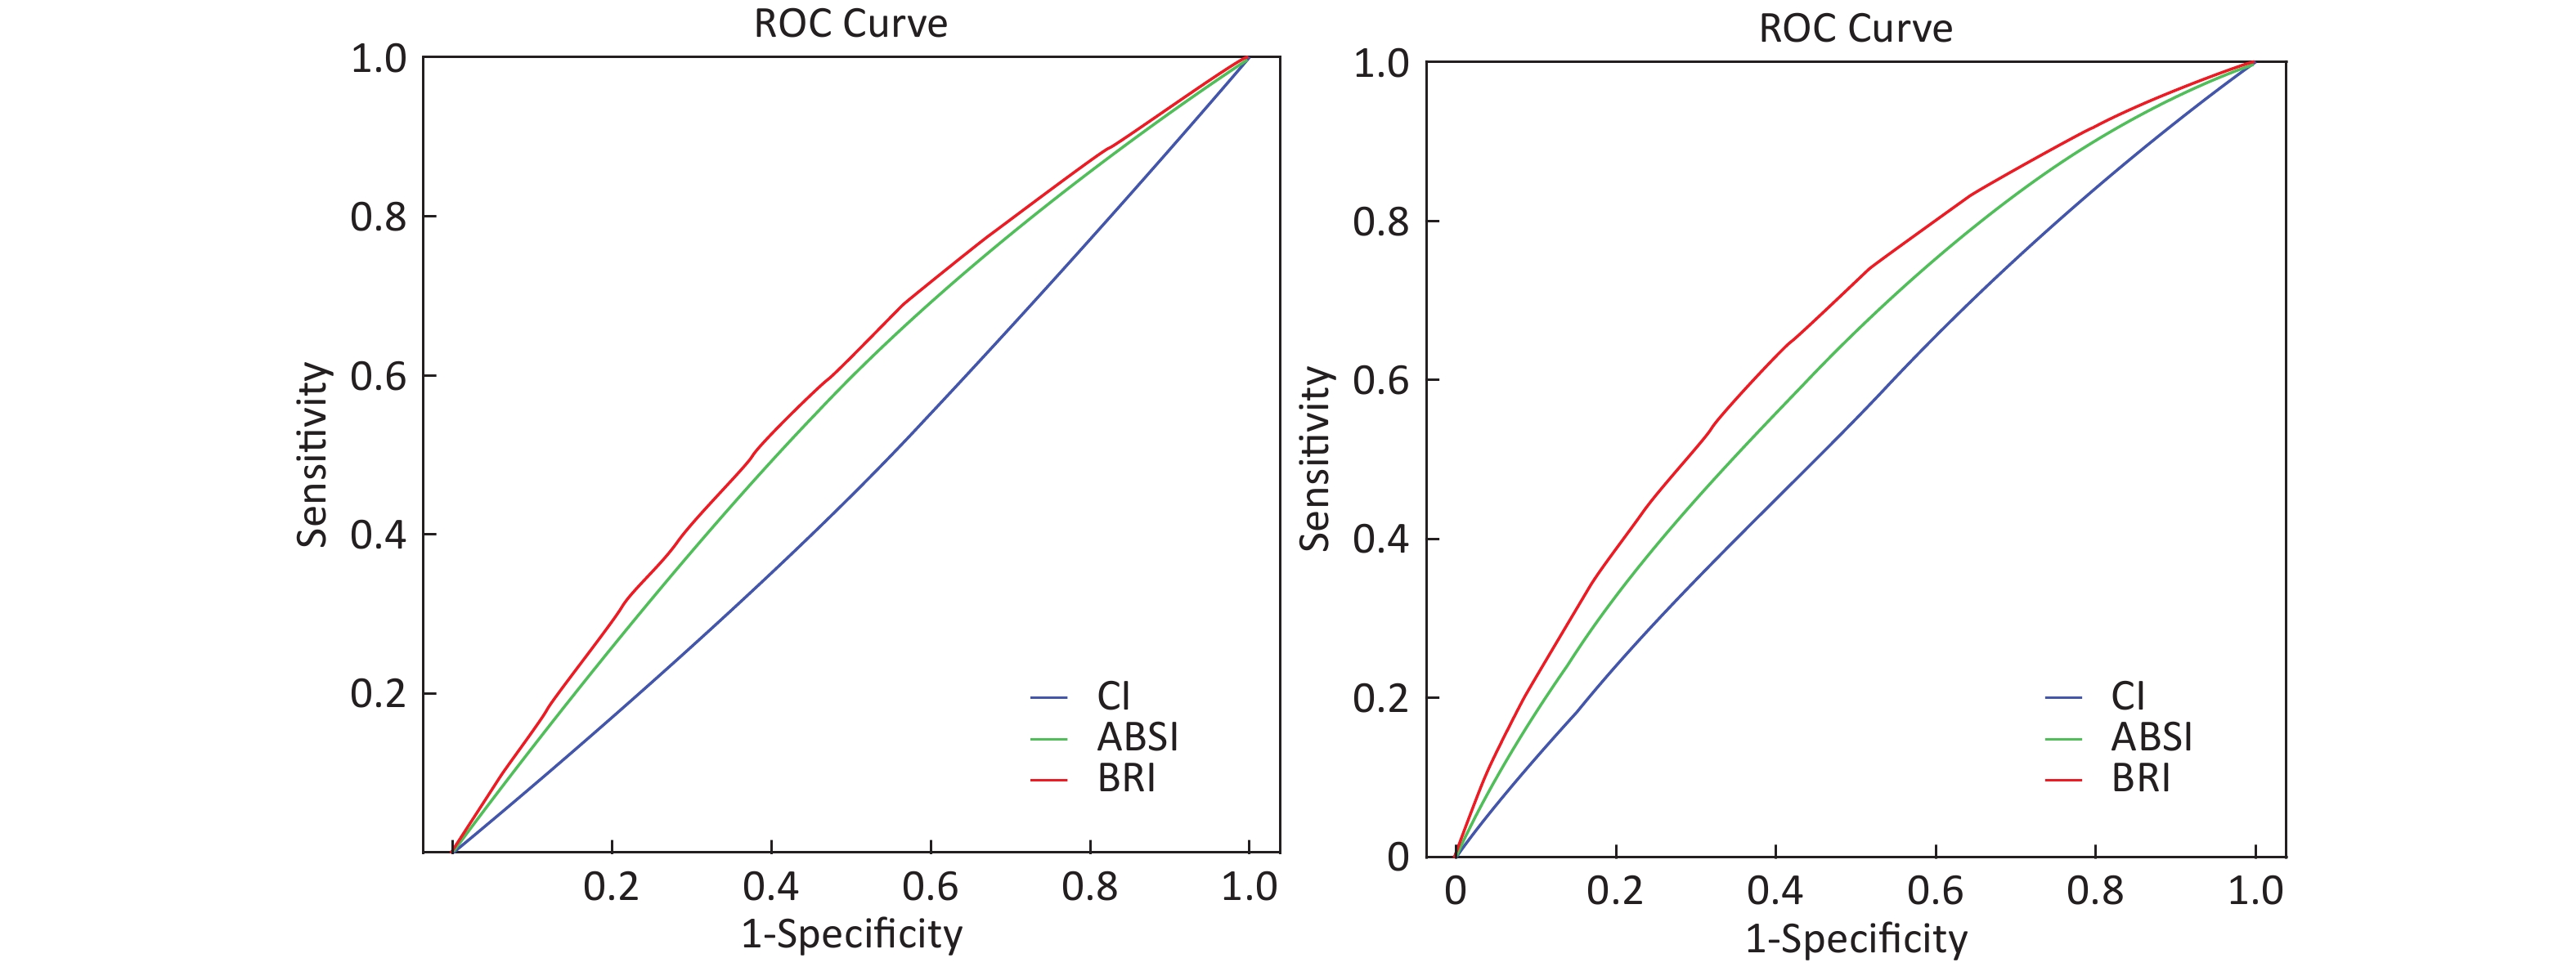
The AUC values for discriminating prehypertension/hypertension by the three central adiposity indices are shown in Table 2. The ROC curves for each central adiposity indices in the identification of prehypertension/hypertension are presented in Supplementary Figure S1 available in www.besjournal.com. BRI had the largest AUC for prehypertension and hypertension at 0.583 (95% CI, 0.579–0.587) and 0.657 (95% CI, 0.650–0.663), respectively, with all P < 0.001.
Variable AUC 95% CI P values Cut-off Sensitivity (%) Specificity (%) Prehypertension CI 0.468 0.464−0.473 < 0.001 − − − ABSI 0.563 0.559−0.568 < 0.001 0.0735 55 45.2 BRI 0.583 0.579−0.587 < 0.001 2.34 53.5 41 Hypertension CI 0.541 0.534−0.547 < 0.001 18.7 66 60.5 ABSI 0.615 0.608−0.621 < 0.001 0.74 59.8 43.5 BRI 0.657 0.650−0.663 < 0.001 2.42 63.5 40.4 Note. AUC, area under the receiver-operating characteristic curve; CI, confidence interval; CI, conicity index; ABSI, a body shape index; BRI, body roundness index. Table 2. The AUC with its 95% CI for detecting prehypertension and hypertension by the new central adiposity indices

Figure S1. Receiver Operating Characteristic curves of CI, ABSI, and BRI to discriminate prehypertension/hypertension. CI, conicity index; ABSI, a body shape index; BRI, body roundness index.
The present study, conducted based on a large sample of non-obese Chinese adults, showed that ABSI and BRI were associated with prehypertension and only BRI was associated with hypertension. Additionally, BRI also was a powerful discriminator of hypertension. To the best of our knowledge, this is the first large-scale study to examine the association between the three central adiposity indices and prehypertension/hypertension in non-obese adults. Our findings highlight that BRI might be used as an appropriate central adiposity index in the management of prehypertension/hypertension in individuals with normal BMI and WC.
Overweight and obesity are well-established risk factors of hypertension. The BMI is the most commonly used anthropometric indicator for defining obesity; however, it does not comprehensively distinguish the muscle over fat mass. Thomas et al. reported that MRI measured body fat content varied from 7.8% to 44.2% in individuals with similar BMI. Besides the amount of excess fat, its distribution is also very critical. The accumulation of visceral fat is more likely to cause an increased BP than a simple body weight gain. Although WC can better reflect the accumulation of abdominal fat when compared with BMI and be used in risk prediction equations for atherosclerotic cardiovascular disease of Chinese population, it still provided limited information regarding whether the excess abdominal fat is under the skin or around the internal organs. Hence, nonobese individuals with excess visceral fat also have a high risk of metabolic abnormalities, specifically among East Asians. In the present study, the proportion of subjects with prehypertension was 34.3% and that of those with hypertension was 10.6% despite the study population having normal BMI and WC. Therefore, the risk of increased BP in nonobese individuals who may have accumulated excess visceral fat should also not be ignored.
The BRI, which depends on waist and height eccentricity, was first introduced by Thomas et al. in 2013 to predict the percentage of visceral fat[5]. Recently, two studies investigated the association between BRI and hypertension in Asian individuals whose mean BMI approached or exceeded the standard of overweight in Asian populations and one study evaluated the same in nonobese individuals. One of the studies found that BRI showed the strongest association with hypertension among five anthropometric indices (ABSI, BMI, BRI, WC, and WHR)[6], whereas another study demonstrated that BRI showed weaker capability for identifying hypertension when compared to WC or WHtR[7]. One study regarding BRI conducted in 1596 in nonobese individuals demonstrated that BRI was able to identify prehypertension and hypertension but was not superior to WHtR. Although we did not compare the three indices with WHtR in this study, BRI showed the strongest association with prehypertension and hypertension among the three central adiposity indices (CI, ABSI, and BRI) in nonobese subjects. Considering that the reports of BRI being associated with prehypertension/hypertension in the nonobese population are still relatively rare, the available evidence still suggests that BRI has a significant potential for application in the prevention and management of hypertension in nonobese individuals, specifically in Asian populations.
ABSI was created in 2012 by Krakauer et al. to reflect the degree of central bulge based on a US population sample from the National Health and Nutrition Examination Survey, which included Mexicans, Hispanics, Whites, Blacks, and other ethnicities[4]. Several studies based on the European population showed that ABSI was superior than the BMI and WC for the distinction of metabolic abnormalities and was significantly associated with total cardiovascular mortality. Conversely, most studies based on Asian populations showed that ABSI was not a better index in the assessment of cardiometabolic risk factors. This inconsistent performance of ABSI may be attributable to the ethnic differences. In this study, ABSI was significantly associated with prehypertension but not hypertension, and its overall performance was weaker than that of BRI. The result is consistent with that of the only study conducted in the non-obese population[8]. These findings suggest that the association between ABSI and prehypertension/hypertension in non-obese individuals needs to be determined in future studies.
Compared with BRI and ABSI, CI is an older indicator that was first reported in 1993[3]. CI adjusts WC for height and weight and does not require the measurement of HC to assess fat distribution, which is theoretically more advantageous than WC and WHR. After more than 20 years of research, the association between CI and hypertension still remains controversial. Dhall et al. reported that CI had ability comparable to that of BMI and WC to predict hypertension in Indians[9]. Another study based on the Brazilian population found that CI was closely associated with hypertension[10]. Conversely, there were also some studies that demonstrated that CI showed a weaker association with hypertension than BRI, ABSI, or even some traditional abdominal adiposity indices (WC or WHR). However, the above study did not perform a subgroup analysis of the subjects’ BMI or WC. Hence, it is unclear if CI is associated with prehypertension/hypertension in non-obese individuals. In the present study, the proportion of subjects with prehypertension showed a decreasing trend with the increase of CI quartiles, and logistic regression analysis showed that CI was not associated with prehypertension/hypertension in non-obese Chinese adults. The discrepant results might be due to the ethnic differences and size of study populations. Hence, further large-scale studies are required to confirm the appropriate application of CI in different races and diseases.
The strength of the present study is the large sample size. Moreover, this study is also one of the few studies to investigate the association between central adiposity indices and prehypertension/hypertension in non-obese individuals whose metabolic abnormalities are easily ignored. On the contrary, this study has also several limitations. First, this cross-sectional study cannot reflect the causal association between the three central adiposity indices and prehypertension/hypertension. Second, because our subjects were Chinese adults, it is not clear whether our results can be translatable to other ethnic groups. Third, the lack of similar research in nonobese individuals makes it impossible to fully compare the results of our study with those of others.
In conclusion, among the three central adiposity indices, BRI showed the strongest association with prehypertension and hypertension in nonobese Chinese subjects. Moreover, BRI was superior to ABSI and CI for discriminating prehypertension/hypertension in adults with normal BMI and WC. Therefore, BRI may be a potential effective indicator for use in weight management in individuals with prehypertension and hypertension.
Conflicts of Interest There are no conflicts of interest to disclose.


Funds:
This research was supported by the Key Specialty Construction Project of Pudong Health and Family Planning Commission of Shanghai [Grant No. PWZzk2017-29]; Outstanding Leaders Training Program of Pudong Health Bureau of Shanghai [Grant No. PWRI2018-02]; and National Natural Science Foundation of China [81170738, 81671595]
Reference 
 Quick Links
 DownLoad: