


-
Non-alcoholic fatty liver disease (NAFLD) is the most common liver disease in Asia. Several studies have shown that NAFLD is associated with obesity, insulin resistance, type 2 diabetes, hypertension, hyperlipidemia, and metabolic syndrome (MS)[1]. Several studies concluded that indicators such as body mass index (BMI), waist circumference (WC), uric acid (UA), and visceral adiposity index (VAI) are closely related to the occurrence of non-alcoholic fatty liver[2]. NAFLD is usually diagnosed by ultrasonography in a hospital. However, the pre-diagnosis of NAFLD remains unclear, and less attention is paid in predicting the onset of NAFLD[3].
NAFLD is also an ongoing process. If no measures are taken, it can develop into irreversible diseases such as cirrhosis, hepatic carcinoma. In addition, some studies have confirmed that non-alcoholic fatty liver can be alleviated by adapting diet control and regular exercise, suggesting that it is significant to determine individuals who may have NAFLD and guide them to reduce their risk of NAFLD[4]. Thus, we plan to develop an efficient prediction model using an electronic health record database to enable individuals to self-test their risk probability of developing NAFLD 1 year in advance.
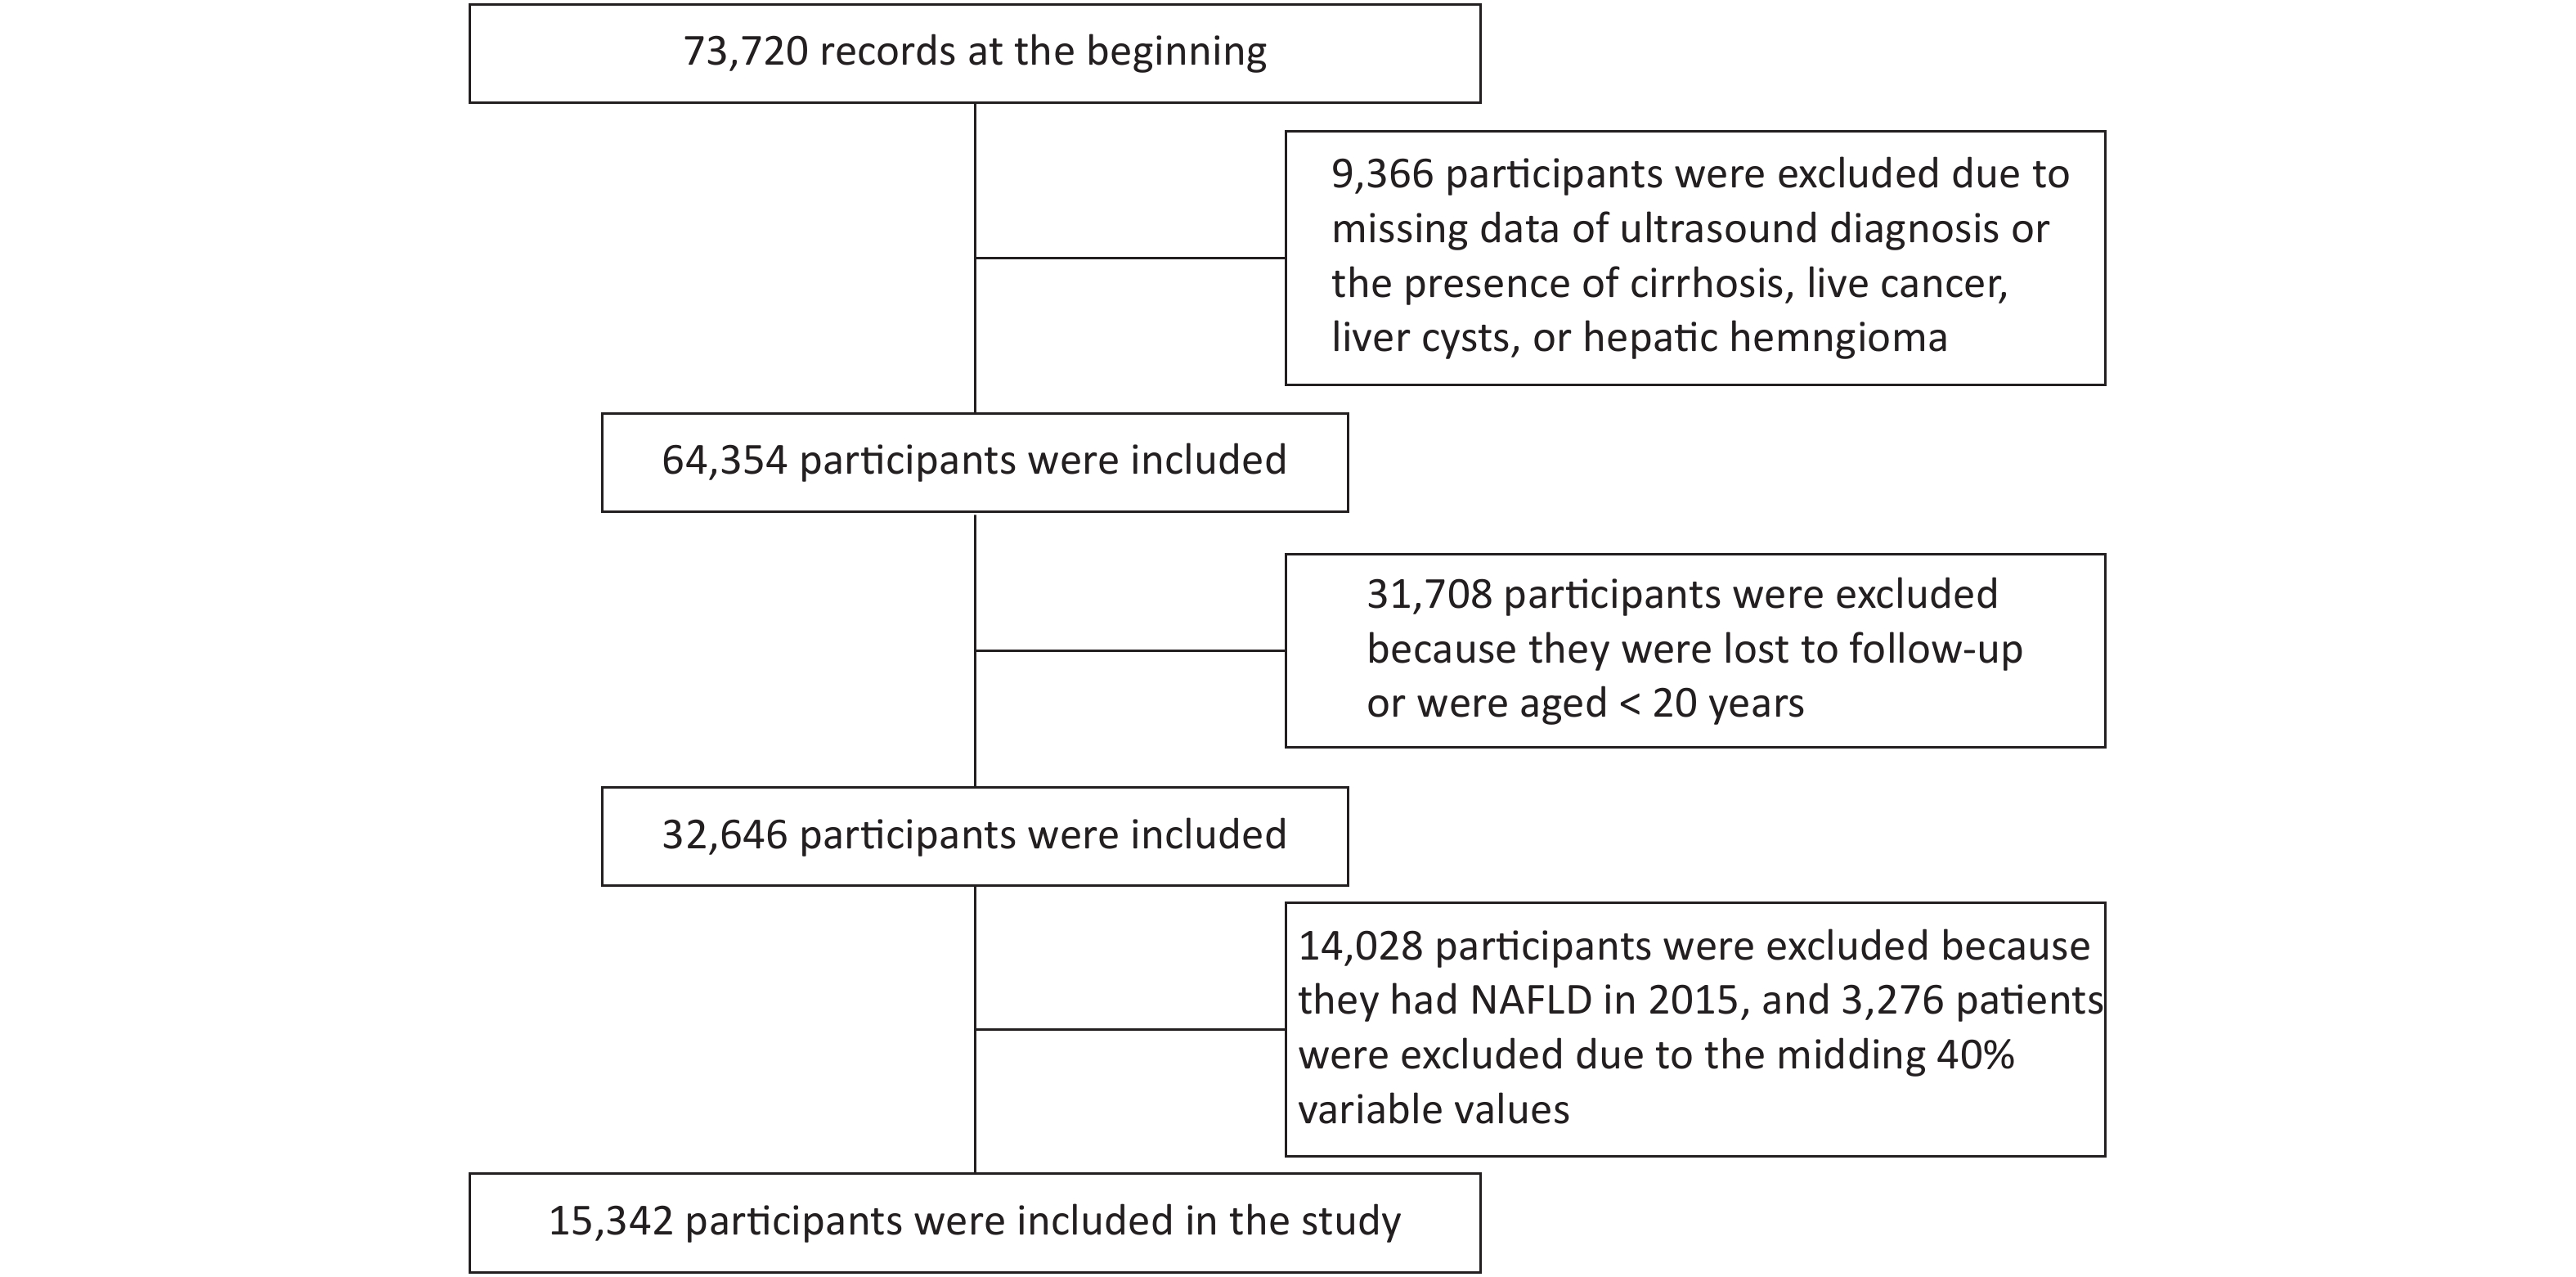
Data of 73,720 individuals who underwent health checkups at Beijing Physical Examination Center from January 1, 2015 to December 31, 2016 were collected. Finally, 15,342 participants were recruited in this study (Supplementary Figure S1, available in www.besjournal.com).
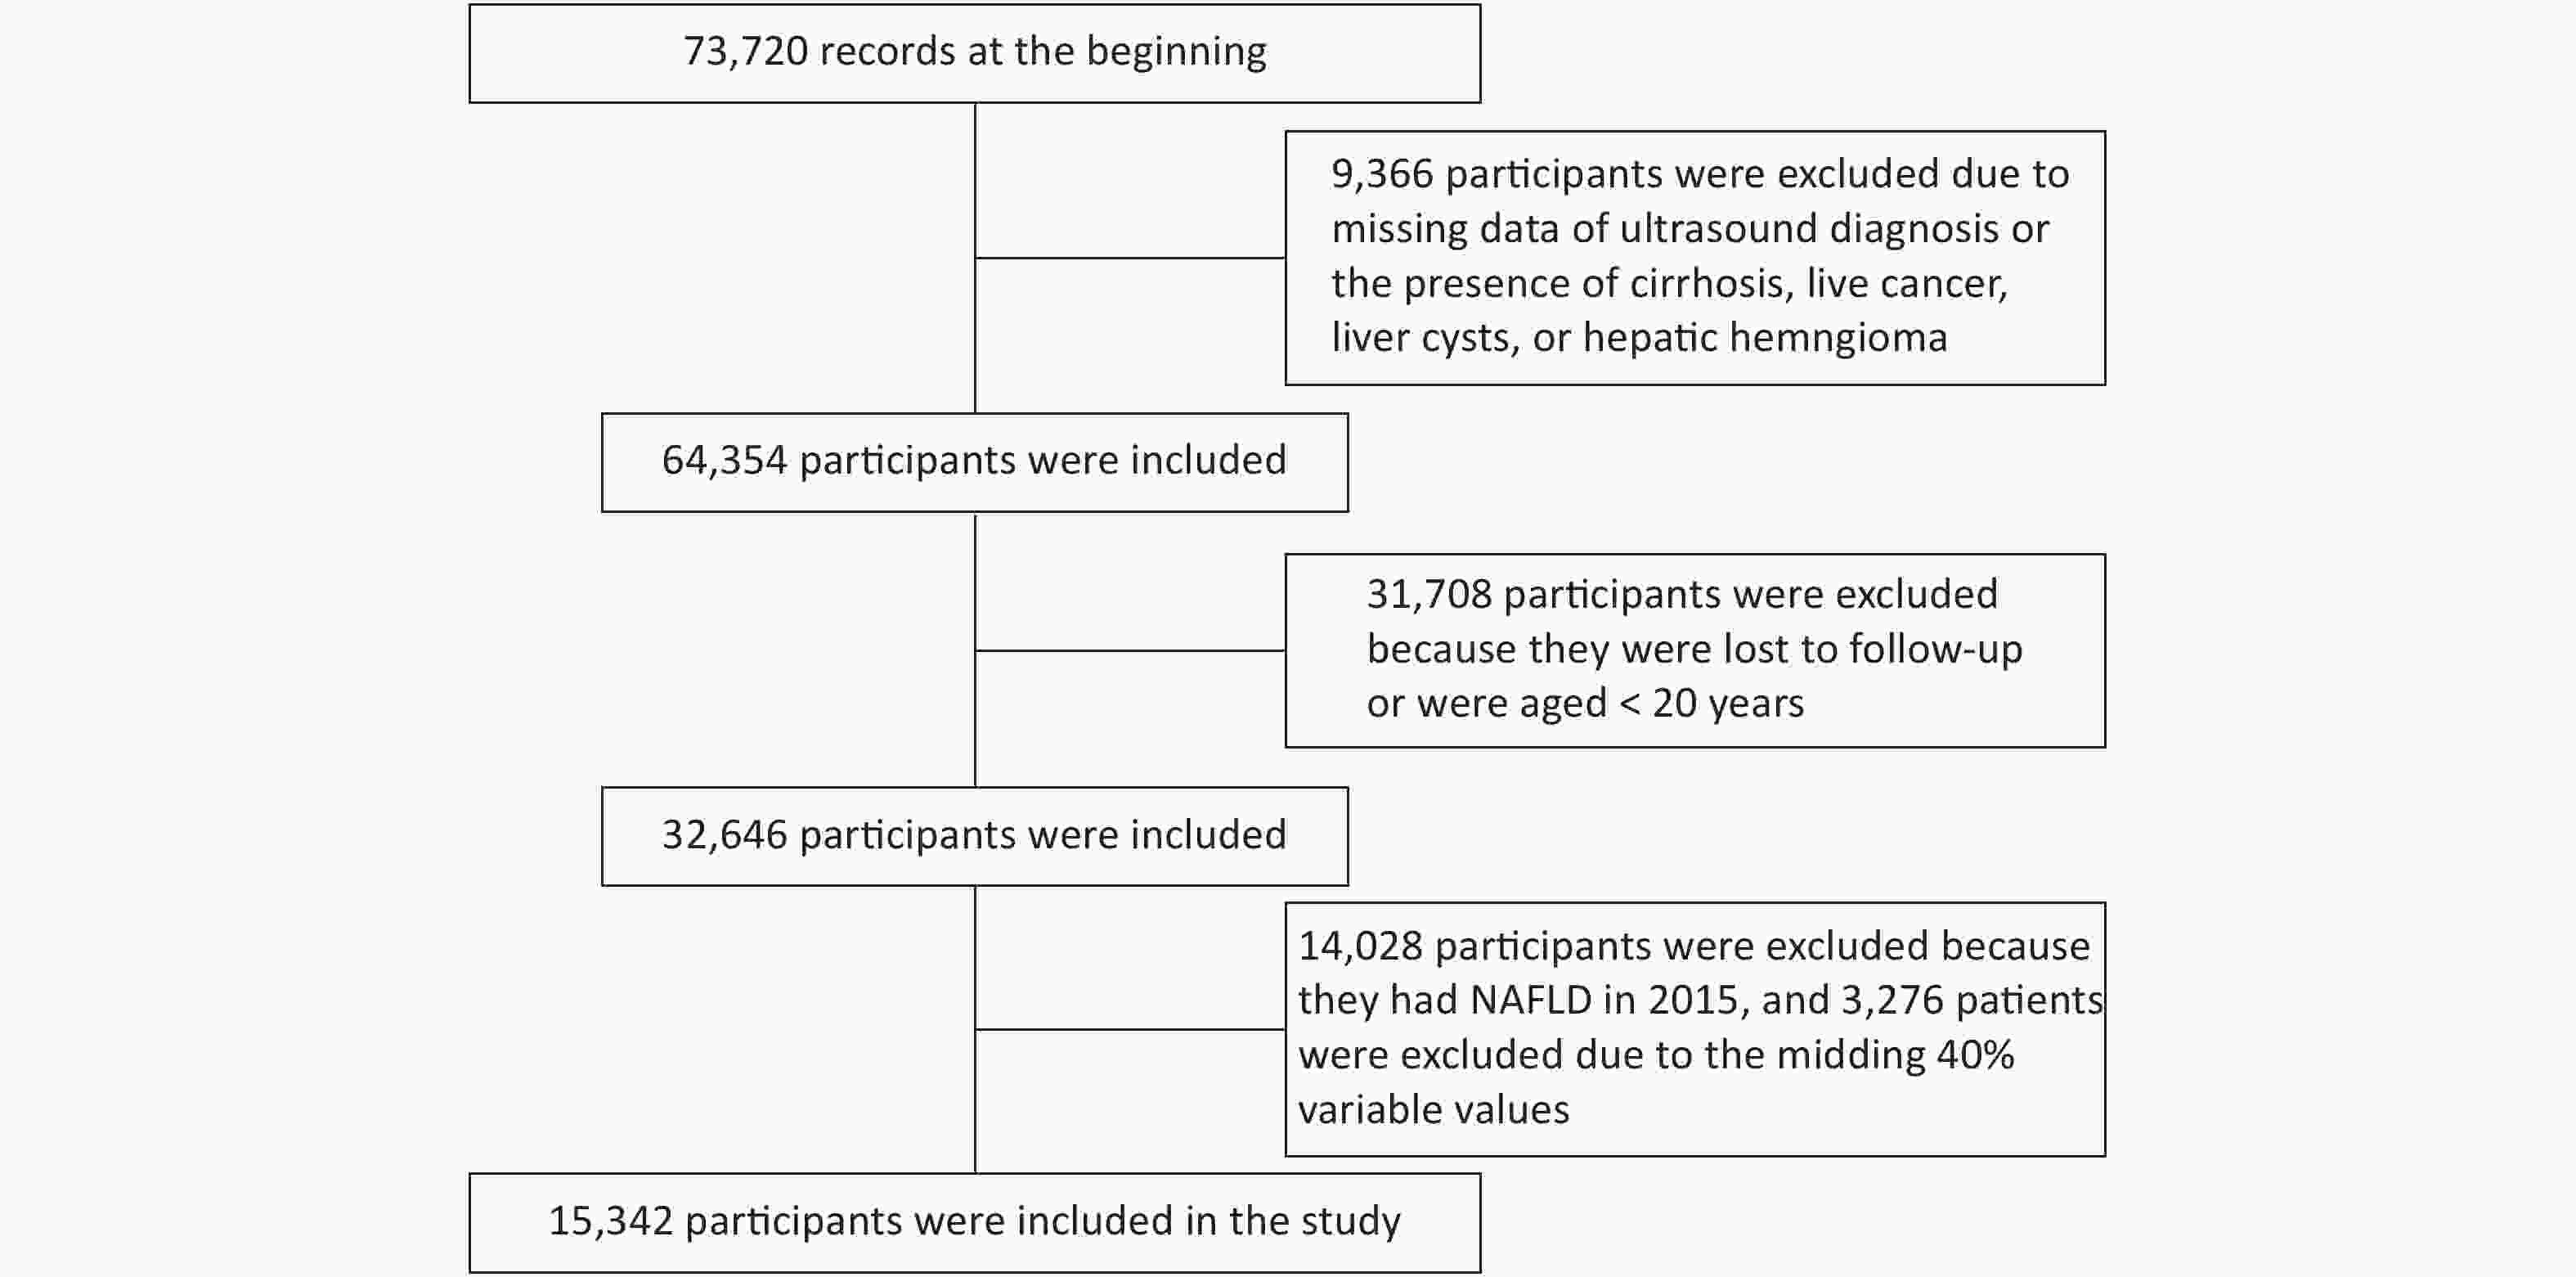
Figure S1. A schematic diagram of the study participants
The research data were collected in a unified manner and included a consultation, physical examination, laboratory testing, and ultrasound (US) examination. The consultation included the assessment of patients’ personal medical history and alcohol consumption history. The physical examination included measuring the patients’ blood pressure, height, weight, and WC. The laboratory tests included measurements of patients’ total cholesterol (TC), high-density lipoprotein cholesterol (HDL-C), triglyceride (TG), and low-density lipoprotein cholesterol (LDL-C) levels and several conventional test indicators.
We combined the US diagnosis of fatty liver and the alcohol intake consultation to diagnose NAFLD. The Chinese criteria for the US diagnosis of fatty liver were used in this study. People were identified following the previously published diagnostic criteria[5]: (1) slight diffuse increase and bright homogeneous echo pattern in the liver parenchyma with normal visualization of the diaphragm and portal and hepatic vein borders and a normal hepatorenal echogenicity contrast, (2) diffuse increase in the bright echoes in the liver parenchyma with slightly impaired visualization of the peripheral portal and hepatic vein borders, and (3) marked increase in the bright echoes at a shallow depth with deep attenuation, impaired visualization of the diaphragm, and marked vascular blurring. The thresholds for alcohol consumption were < 140 g/week for men and < 70 g/week for women.
The diagnostic criterion for overweight was according to the World Health Organization’s standard of BMI higher than 25 kg/m2. The diagnostic criteria for diabetes and prediabetes were based on venous samples and laboratory methods. We used the harmonized definition of the MS established in 2009, with at least 3 or more of the following criteria required for diagnosis.
The BMI and VAI are usually calculated to measure the degree of obesity, and they have been proven to be associated with NAFLD. Thus, we added the other two parameters in our analysis.
VAI = WC (cm)/(39.68 + 1.88 × BMI) × (TG/1.03) × (1.31/HDL-C) for men; VAI = WC (cm)/(36.58 + 1.89 × BMI) × (TG/0.81) × (1.52/HDL−C) for women
The demographic and clinical biochemical indexes were described in all participants using the mean ± standard deviation for continuous variables and percentages for categorical variables. Subsequently, we used the logistic regression, linear discriminant analysis, random forest, K-nearest neighbors, support vector machine (SVM), and lightGBM to construct the predictive model.
LightGBM is a tree-based ensemble learning algorithm, which is one of the most efficient gradient boosting decision tree (GBDT) algorithms. LightGBM is an effective GBDT algorithm with good accuracy and scalability, fast training speed, and low memory usage. Here, viewing our problem as a classification task, we used cross-entropy loss as a loss function described below:
$$ loss=-\sum\limits_{i=i}^{n}{y}_{i}log\left({p}_{i}\right)+\lambda (1-{y}_{i})log\left({p}_{i}\right) $$ Here, the outcome variable
$ {p}_{i} $ is the probability of developing NAFLD within a year of sample i, while$ {y}_{i} $ is the ground truth label of sample I, which is known in advance, and$ \lambda$ is a hyperparameter that balances the loss between the negative and positive samples.To achieve stable and reliable evaluation, we used 10-fold cross-validation as our training and testing process. Specifically, we uniformly split all our data into 10 parts. Nine of them were used as a training set, and the remaining was used as a testing set. We repeated this process 10 times and used the averaged evaluation index as the result.
The sensitivity, specificity, and the area under the receiver operating curve (AUC) were used to compare the ability of predicting NAFLD. All statistical analyses were performed using the Statistical Analysis System version 9.4 and Python version 3.6.2. The two-sided statistical significance level was set at α = 0.05.
In 73,720 participants, the prevalence of NAFLD in 2015 was 42.97%. A total of 15,342 participants who did not have NAFLD in 2015 were selected and followed up to observe their indicator change in 2016. The incidence of NAFLD in this population was 12.27%. Among them, 8,343 (54.38%) participants were female. Table 1 shows the baseline characteristics of the participants. The differences between the NAFLD group and the non-NAFLD group were statistically significant.
Variables Normal (n = 13,459) NAFLD (n = 1,883) P value* Age (years) 39.41 ± 13.09 43.66 ± 13.21 < 0.0001 WBC (× 109/L) 6.17 ± 1.46 6.75 ± 1.55 < 0.0001 TG (mmol/L) 1.09 ± 0.69 1.71 ± 1.28 < 0.0001 ALT (U/L) 17.14 ± 13.48 25.60 ± 32.15 < 0.0001 AST (U/L) 18.60 ± 7.96 21.40 ± 16.39 < 0.0001 HCT (%) 41.90 ± 3.85 44.34 ± 3.57 < 0.0001 RBC (× 109/L) 4.75 ± 0.44 5.02 ± 0.43 < 0.0001 Cr (μmoI/L) 60.33 ± 13.20 67.88 ± 14.62 < 0.0001 BUN (mmol/L) 4.68 ± 1.23 5.09 ± 1.24 < 0.0001 UA (umol/L) 282.30 ± 81.85 353.40 ± 87.11 < 0.0001 MCV (fL) 88.38 ± 4.49 88.50 ± 4.43 0.2886 MCH (pg) 29.97 ± 1.95 30.34 ± 1.85 < 0.0001 MCHC (g/L) 339.00 ± 11.22 342.70 ± 11.13 < 0.0001 Hb (g/L) 142.20 ± 15.24 152.10 ± 13.87 < 0.0001 FPG (mmol/L) 5.23 ± 0.81 5.58 ± 1.22 < 0.0001 PLT (× 109/L) 228.50 ± 51.43 227.10 ± 51.08 0.2771 TC (mmol/L) 4.63 ± 0.86 4.84 ± 0.96 < 0.0001 LDL-C (mmol/L) 2.45 ± 0.67 2.67 ± 0.73 < 0.0001 HDL-C (mmol/L) 1.42 ± 0.29 1.22 ± 0.24 < 0.0001 RDW 12.92 ± 0.90 12.84 ± 0.71 0.0002 Lymph (%) 34.95 ± 7.50 34.18 ± 7.44 < 0.0001 SBP (mmHg) 112.80 ± 14.20 121.50 ± 14.11 < 0.0001 DBP (mmHg) 75.12 ± 9.27 81.38 ± 9.49 < 0.0001 BMI (kg/m2) 22.36 ± 2.76 25.68 ± 2.63 < 0.0001 PCT (%) 0.23 ± 0.05 0.23 ± 0.05 0.4969 WHR 0.81 ± 0.06 0.87 ± 0.05 < 0.0001 VAI 1.24 ± 1.02 2.07 ± 1.90 < 0.0001 Neut (%) 57.27 ± 7.94 57.76 ± 7.81 0.0122 Non-HDL-C 3.21 ± 0.81 3.62 ± 0.90 < 0.0010 Male (%) 5,503 (78.63) 1,496 (21.37) < 0.0001 Overweight (%) 2,281 (67.37) 1,105 (32.60) < 0.0001 Ms (%) 270 (66.34) 137 (33.66) < 0.0001 Diabetes (%) 271 (71.50) 108 (28.50) < 0.0001 Impaired FPG (%) 412 (72.03) 160 (27.97) < 0.0001 Note. WBC, White blood cell count; ALT, alanine aminotransferase; AST, aspartate aminotransferase; HCT, Hematocrit; RBC, Red blood cell count; Cr, Creatinine; BUN, Blood urea nitrogen; MCV, Mean red blood cell volume; MCH, Mean erythrocyte hemoglobin content; MCHC, Mean erythrocyte hemoglobin concentration; Hb, Hemoglobin; FPG, fasting plasma glucose; PLT, Platelet count; RDW, RBC distribution width; Lymph, Percentage of lymphocytes; SBP, systolic blood pressure; DBP, diastolic blood pressure; PCT, Platelet hematocrit; WHR, Waist-to-hip ratio; Neut, Neutrophilic granulocyte. Data are expressed as the mean ± standard deviation, n (%). *P < 0.05 was considered statistically significant. Table 1. Baseline characteristics of participants grouped by non-alcoholic fatty liver disease
The results of the multiple logistic regression analysis showed that age, WBC, TG, ALT, RBC count, UA, FPG, DBP, BMI, PCT, WHR, WC, and non-HDL-C were predictive factors of NAFLD, whereas AST, Cr, HDL-C, and VAI were protective factors (Table 2).
Variables β Wald χ2 test P value OR (95% CI) Constant term −15.7878 469.4885 < 0.0001 Age 0.0109 17.6484 < 0.0001 1.011 (1.006, 1.016) WBC 0.0406 4.1928 0.0406 1.041 (1.002, 1.083) TG 0.4990 25.2471 < 0.0001 1.647 (1.356, 2.001) ALT 0.0197 41.1115 < 0.0001 1.020 (1.014, 1.026) AST −0.0175 8.8296 0.0030 0.983 (0.971, 0.997) RBC 0.1757 4.5543 0.0328 1.192 (1.014, 1.401) Cr −0.00852 10.6270 0.0011 0.992 (0.986, 0.997) UA 0.00347 68.5765 < 0.0001 1.003 (1.003, 1.004) FBG 0.0717 7.1301 0.0076 1.074 (1.019, 1.132) HDL-C −1.1027 54.9475 < 0.0001 0.332 (0.248, 0.444) DBP 0.0123 14.8173 0.0001 1.012 (1.006, 1.019) BMI 0.1995 133.4437 < 0.0001 1.221 (1.180, 1.263) PCT 1.8978 9.1519 0.0025 6.671 (1.951, 22.815) WHR 3.9170 18.4845 < 0.0001 50.250 (8.426, 299.669) WC 0.0294 12.6515 0.0004 1.030 (1.013, 1.047) VAI −0.2286 11.8039 0.0006 0.796 (0.698, 0.906) Non-HDL-C 0.1409 14.5095 0.0001 1.151 (1.071, 1.238) Table 2. Multivariate logistic regression model of non-alcoholic fatty liver disease
For lightGBM, we first constructed a model with all the variables (10-fold cross-validation) to determine the importance of the variables according to the interpretability of the model. Subsequently, we selected 20 most important variables including age, WBC, TG, ALT, AST, RBC, Cr, UA, MCV, FPG, PLT, LDLC, HDL-C, weight, BMI, WHR, WC, VAI, ALT_AST, and non-HDL-C to construct a new model (10-fold cross-validation). The best hyperparameters were chosen based on the grid search. The importance of the variables selected by lightGBM is BMI (72.3), UA (59.8), TG (50.9), AGE (49.2), WC (41.4), ALT/AST (38.0), FPG (37.5), Cr (37.3), VAI (35.6) and HDL-C (32.5), respectively. These variables are ranked by the important score, numbers in brackets, which represents the times of the model-chosen variables as split node. The bigger the means, the more important the variable.
The overall comparison of the six models is shown in Table 3. The logistic regression model and linear discriminant analysis model were used to predict the NAFLD-free participants with the highest specificity of approximately 0.97, but its sensitivity was lower than 0.26. The predictive powers of SVM, random forest, and lightGBM were close to each other. They all had similar sensitivity and specificity, which was higher than 0.70. However, the lightGBM model could acutely predict the NAFLD participants. It had higher sensitivity and acceptable decreased specificity. Thus, the AUC (0.790) was better than the other models.
Model Sensitivity Specificity AUC Logistic regression 0.222 0.977 0.600 Linear discriminant analysis 0.251 0.971 0.611 Random forest 0.807 0.747 0.777 K-nearest neighbors 0.210 0.948 0.579 SVM 0.752 0.756 0.754 LightGBM 0.860 0.720 0.790 Table 3. Comparison of different prediction models
A previous study has reported that the cumulative incidence of NAFLD in 5 years in Hong Kong was 13.5%[6], and a cohort study found that the 2-year incidence of NAFLD was 13.27%[7]. In our study, 1,883 (12.27%) participants developed NAFLD after the 1-year follow-up. The incidence in our study population was higher than that in the other studies.
In this paper, we described the baseline physical indicator differences between healthy individuals and individuals diagnosed with NAFLD. Subsequently, we developed an efficient model to establish the pre-diagnosis of NAFLD. The results of the predictive performance in Table 4 showed that the lightGBM model could be used to screen undiagnosed NAFLD individuals considering its high sensitivity (0.860) and specificity (0.720). For the lightGBM model, the AUC value was 0.790 after a 10-fold cross-validation. A previous study used a classification tree to predict the NAFLD, which was 0.780 and 0.750 in the training and testing dataset, respectively[8]. Although the two models were appropriate for different populations, our model comprised more variables and had a higher AUC value. The variables in our model were easy to determine.
We calculated the importance of each variable by lightGBM. The top 10 variables were BMI, UA, TG, AGE, WC, ALT/AST, FPG, Cr, VAI, and HDL-C. The importance score of BMI was 72.3, accounting for the biggest portion of the lightGBM model. The result is similar to those of previous studies, reporting that BMI was the most useful predictive factor of NAFLD onset[9]. We analyzed the association between UA level and the development of NAFLD and found that an elevated UA level was a risk factor for NAFLD. As it is known, both elevated TG levels and abdominal obesity play an important role in the pathogenesis of NAFLD. The lightGBM model comprised variables TG, WC, and VAI, which is consistent with the findings of previous studies[10]. In the lightGBM model, the importance score of Cr was 37.3, which is similar to that of FPG. The Cr in the blood is one of the indicators of renal function, which was closely related to the body’s total muscle mass and was not susceptible to diet. Moreover, serum Cr and age can be used to calculate the glomerular filtration rate to diagnose chronic kidney disease. A previous study has shown that NAFLD was associated with chronic kidney disease [11]; hence, the serum Cr may initiate NAFLD by affecting kidney function.
The lightGBM model has good predictive ability and could directly estimate the risk of NAFLD in patients undergoing physical examination. We use this method to develop the model for the following considerations. First, lightGBM is an ensemble model, which combines several weak classifiers to perform prediction. Hence, it is significantly better than simple classifiers such as logistic regression or decision tree. Second, lightGBM is one of the gradient boosting algorithms combing boosting and gradient descent, which learns residual while training. Thus, each classifier reduces the previous residual, making each classifier different. Due to the diversity of the classifiers, lightGBM can reduce the risk of overfitting. Third, the model has several parameters; therefore, we can easily tune these parameters to apply bagging, early-stopping, or boosting policy to achieve a better result, while logistic regression does not have this advantage. Moreover, by exploiting the nonlinear structure of data, tree-based model lightGBM can select variables with nonlinear dependence; however, linear models such as logistic regression do not possess such property.
In the future, we will focus on the application of the model and develop an online prediction system for healthy individuals to use.
The authors declare that they have no competing interests.
This study was approved by the Beijing Physical Examination Center Institutional Review Board.
HTML


Reference

 Quick Links
 DownLoad: