

-
Metabolic syndrome (MS) is a cluster of metabolic abnormalities that include obesity, dyslipidemia, hyperglycemia, and high blood pressure (BP)[1]. Previous studies have shown that the prevalence of MS is increasing in both developing and developed countries[2]. Currently, about a quarter of the adult population worldwide have MS, which has become a serious global public health problem.
Recent studies have found a correlation between vitamin D levels and the risk of MS. The third National Health and Nutrition Examination Survey and the Nutrition and Health of Aging Population in China demonstrated that vitamin D levels in the MS population were significantly lower than those in the non-MS population, indicating a negative correlation between 25-hydroxyvitamin D [25(OH)D] and MS[3]. However, other studies had some contradictory conclusions, for example, a study of an obese population showed that vitamin D levels were not statistically different between the MS and non-MS population[4]. Therefore, in the present study, we aimed to evaluate the relationship between vitamin D deficiency and the risk of MS in a rural population in China.
A total of 1,566 participants were invited to participate in the study from three different areas including the Wuzhi, Xin’an, and Houzhai of the Henan province (31°–36°N) in China, between June and July of 2018. All participants were 18 years or older. Participants with mental health problems, physical disabilities, and major systemic disease or taking medications affecting glucose, lipid levels, metabolic parameters, and vitamin D levels were excluded. Finally, 1,233 participants aged 22–70 years were included in the study, of which 373 (30.3%) were men and 860 (69.7%) were women.
This study was approved by the Ethic Review Board of Zhengzhou University.
A questionnaire containing descriptive information was administered by SUN Hua Lei and LI Wen Jie. Fasting venous blood samples were collected in the morning after overnight fasting. An automatic biochemical analyzer was used to measure the concentration of fasting serum glucose, triglyceride (TG), total cholesterol (TC), high-density lipoprotein cholesterol (HDL-C), low-density lipoprotein cholesterol (LDL-C), and fasting insulin (FIN). The concentration of 25(OH)D was determined by human enzyme-linked immunosorbent assay kits. The Endocrine Society defined vitamin D deficiency as 25(OH)D levels of < 20 ng/mL, vitamin D insufficiency as 25(OH)D of 20–30 ng/mL, and vitamin D sufficiency as 25(OH)D of ≥ 30 ng/mL[5].
For statistical analysis, baseline characteristics between the MS group and the non-MS group were calculated using the mean and standard deviations for continuous, frequencies, and percentages for categorical variables. Logistic regression models were used to determine the association between vitamin D level and the risk of MS. Moreover, the restricted cubic spine model was used to analyze the dose–response relationship between serum 25(OH)D levels and the risk of MS. Statistical analyses were performed using SPSS version 21.0 and STATA version 11.0. P < 0.05 was considered statistically significant.
In this study, 500 participants with MS and 733 participants without MS (control) were included. The characteristics of all participants are presented in Supplementary Table S1 (available in www.besjournal.com). The mean age of the MS group and non-MS group subjects was 51.59 ± 12.73 and 50.17 ± 16.45 years, respectively. Compared with the non-MS group, the MS group showed significant differences in body mass index (BMI), waist circumference (WC), fasting blood glucose (FBG), FIN, TC, TG, and HDL-C levels. Meanwhile, the prevalence of smoking, alcohol intake, and high-fat diet was lower in the MS group than in the non-MS group. In contrast, 59.2% of the participants in the MS group had vitamin D deficiency, whereas 47.9% of the participants in the non-MS group had vitamin D deficiency, which was significantly lower than that of the MS group (P < 0.01).
Item MS group (n = 500) No-MS group (n = 733) t/χ2 P Male (%) 138 (27.6) 235 (32.1) 3.18 0.070 Age 51.59 ± 12.73 50.17 ± 16.45 1.63 0.104 BMI (kg/m2) 27.21 ± 3.29 24.34 ± 3.66 15.47 < 0.001 WC 92.39 ± 8.36 83.95 ± 11.15 17.08 < 0.001 FBG (mmol/L) 6.60 ± 2.78 5.00 ± 1.85 14.53 < 0.001 FIN (mIU/L) 14.68 ± 7.08 11.74 ± 6.74 8.25 < 0.001 TC 4.76 ± 1.04 4.40 ± 0.99 6.90 < 0.001 TG 2.53 ± 1.64 1.38 ± 1.07 17.79 < 0.001 HDL-C 1.13 ± 0.26 1.30 ± 0.30 11.45 < 0.001 LDL-C 2.56 ± 0.79 2.49 ± 0.78 1.61 0.108 Smoking, n (%) 89.91 < 0.001 No 402 (80.4) 467 (63.7) Ever 26 (5.2) 56 (7.6) Yes 72 (14.4) 210 (28.7) Alcohol intake, n (%) 37.89 < 0.001 No 446 (89.2) 559 (76.3) Yes 54 (10.8) 174 (23.7) Vegetable consumption,n (%) 0.06 0.814 No or small 342 (68.4) 506 (69.0) More 158 (31.6) 227 (31.0) Physical activity, n (%) 8.22 0.016 Low 199 (39.8) 249 (34.0) Moderate 108 (21.6) 163 (22.1) High 193 (38.6) 351 (47.9) High-fat diet, n (%) 8.90 0.003 No 408 (81.6) 545 (74.4) Yes 92 (18.4) 188 (25.6%) Education 11.04 < 0.001 Below high school 442 (88.4%) 596 (81.3%) Above high school 58 (11.6%) 137 (18.7%) Vitamin D 28.55 ± 8.67 35.78 ± 8.02 19.07 < 0.001 Deficiency 296 (59.2%) 351 (47.9%) 19.49 < 0.001 insufficient 115 (23%) 171 (23.3%) sufficient 89 (17.8%) 211 (28.8%) Note. Values are mean ± standard deviation or n (%).
BMI, body mass index; WC, waist circumference; FBG, fasting blood glucose; FIN, fasting insulin;
TC, total cholesterol; TG, triglyceride; HDL-C, high-density lipoprotein cholesterol; LDL-C, low-density lipoprotein cholesterol.Table S1. General characteristics of the study participants
Among the participants, 647 (52.5%) had vitamin D deficiency and 286 (23.2%) had vitamin D insufficiency, and this number was significantly lower than the number of affected people living in high latitude areas and might be related to the difference in light, time, and ultraviolet intensity[6]. These findings were supported by a previous study which showed that the prevalence rate of the vitamin D deficiency and insufficiency ranged from 60% to 93%[7].
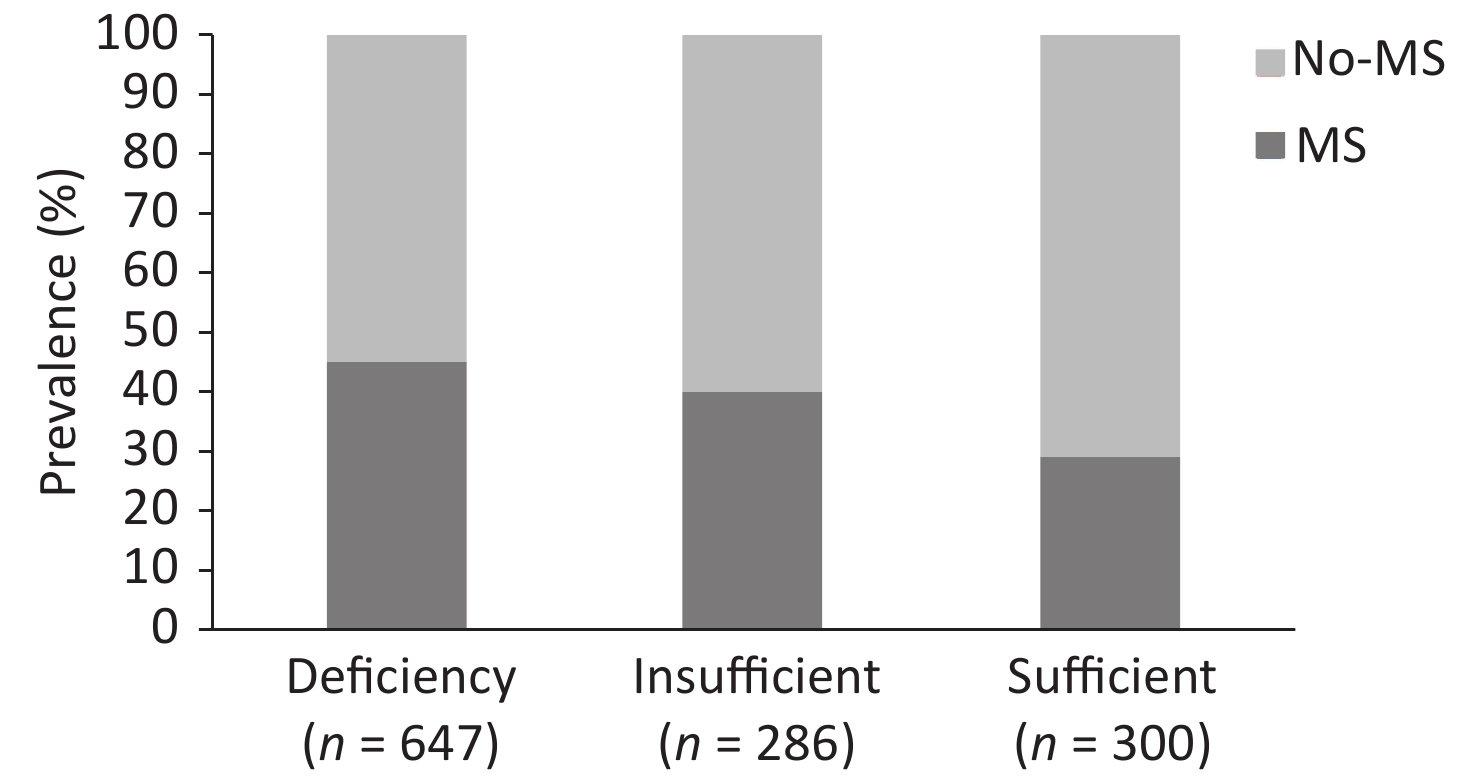
Figure 1 presents the prevalence of MS according to the different serum 25(OH)D levels. In this study, the prevalence rate of MS was 45% in the serum 25(OH)D-deficient group. Meanwhile, a significant decrease in MS prevalence rate was observed in the two other groups when compared with the serum 25(OH)D-deficient group, that is, 40% in the serum 25(OH)D-insufficient group and 29% in the serum 25(OH)D-sufficient group (P < 0.001).
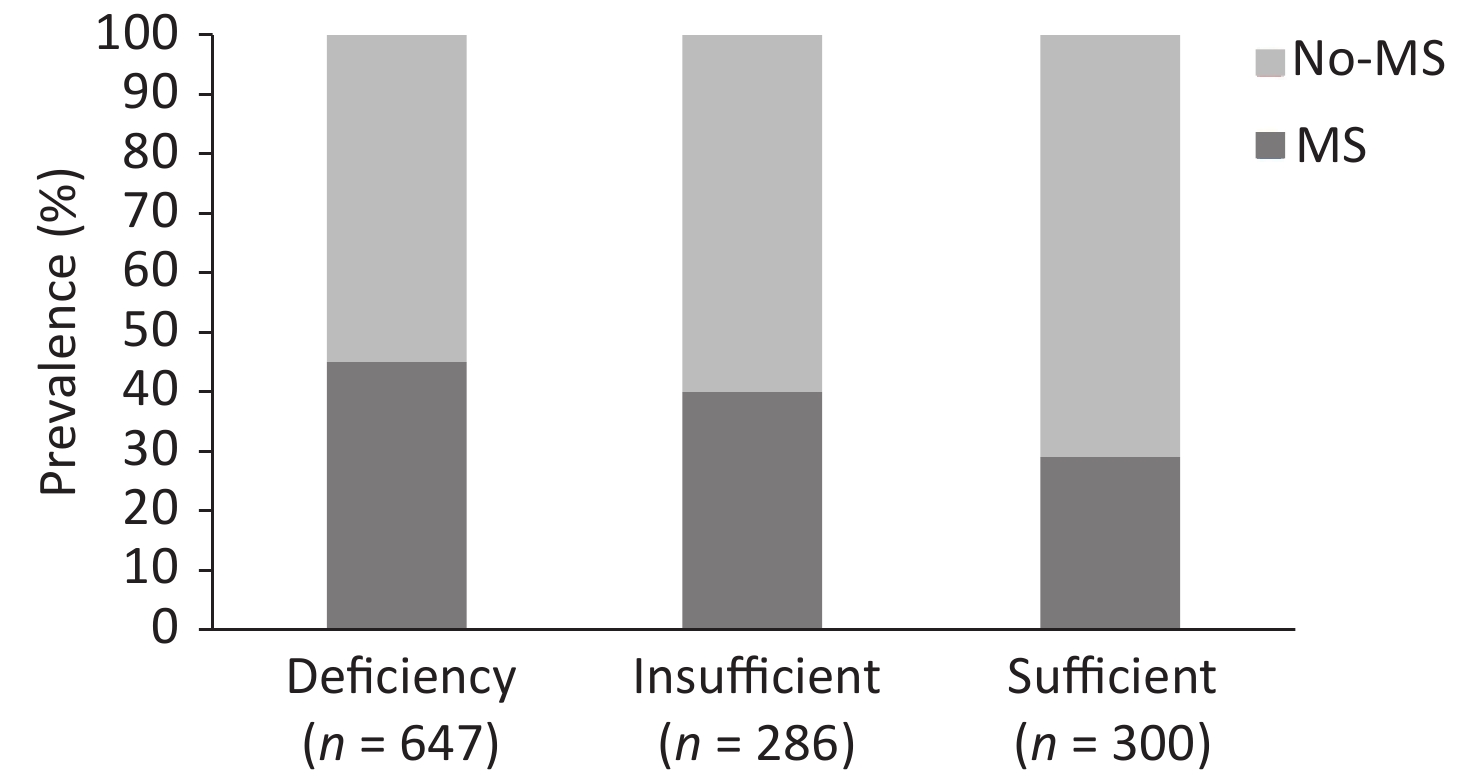
Figure 1. The prevalence of MS in different serum 25(OH)D levels.
The association between 25(OH)D levels and the risk of MS are presented in Table 1. In the unadjusted model and adjusted model (adjusted for confounding variables of age, gender, BMI, smoking, alcohol intake, high-fat diet, education, and physical activity), compared with the vitamin D-deficient group, significant decrease in MS, WC, TG, HDL-C, and FBG were observed in the vitamin D-sufficient group. Serum 25(OH)D levels were negatively associated with MS [odds ratio (OR): 0.63, 95% confidence interval (CI): 0.46–0.83], as well as with WC (OR: 0.54, 95% CI: 0.43–0.75), TG (OR: 0.68, 95% CI: 0.51–0.83), HDL-C (OR: 0.73, 95% CI: 0.49–0.99), and FBG (OR: 0.70, 95% CI: 0.53–0.94) levels. These results were consistent with those of a previous study of the Longitudinal Aging Study Amsterdam showing a significant association of the high levels of 25(OH)D and the risk of MS[8]. Among 6810 participants of a British birth cohort, after adjusting the gender, compared with the lowest quintile, the OR of the MS subjects in the group with the highest vitamin D levels was 0.31 (95% CI: 0.24–0.39)[9].
Variable 25(OH)D P < 20 ng/mL 20–30 ng/mL ≥ 30 ng/mL MS Unadjusted 1 0.94 (0.73–1.20) 0.54 (0.41–0.70) 0.001 Model 1 1 0.92 (0.77–1.19) 0.64 (0.48–0.84) 0.001 Model 2 1 0.90 (0.68–1.17) 0.63 (0.46–0.83) 0.001 WC Unadjusted 1 0.82 (0.61–1.09) 0.44 (0.35–0.55) 0.02 Model 1 1 0.84 (0.65–1.11) 0.53 (0.42–0.73) 0.02 Model 2 1 0.91 (0.68–1.17) 0.54 (0.43–0.75) 0.03 TG Unadjusted 1 0.74 (0.85–1.35) 0.70 (0.56–0.89) 0.001 Model 1 1 1.06 (0.85–1.34) 0.71 (0.56–0.90) 0.001 Model 2 1 1.07 (0.84–1.35) 0.68 (0.51–0.83) 0.001 BP Unadjusted 1 0.77 (0.58–1.12) 0.66 (0.43–1.08) 0.17 Model 1 1 0.73 (0.53–1.05) 0.64 (0.42–1.06) 0.17 Model 2 1 0.71 (0.52–1.03) 0.59 (0.40–1.03) 0.32 HDL-C Unadjusted 1 0.73 (0.53–1.04) 0.64 (0.42–0.96) 0.02 Model 1 1 0.77 (0.54–1.10) 0.70 (0.46–0.98) 0.02 Model 2 1 0.78 (0.55–1.15) 0.73 (0.49–0.99) 0.03 FBG Unadjusted 1 1.00 (0.78–1.29) 0.62 (0.48–0.82) 0.02 Model 1 1 0.98 (0.76–1.30) 0.73 (0.55–0.96) 0.02 Model 2 1 0.97 (0.75–1.26) 0.70 (0.53–0.94) 0.03 Note. Model 1 was adjusted for gender and age.
Model 2 was further adjusted for age (year), body mass index (< 18.5, 18.5–23.9, 24–27.9, ≥ 28 kg/m2), smoking (yes/ever/no), alcohol consumption (yes/no), high-fat diet (yes/no), vegetable consumption (more/small) and physical activity (high/moderate/low). FBG, fasting blood glucose; HDL-C, high-density lipoprotein cholesterol; MS, metabolic syndrome; TG, triglyceride; WC, waist circumference.Table 1. Adjusted odds ratios (95% confidence intervals) for the presence of MS comparing the two highest 25(OH)D levels to serum 25(OH)D deficiency
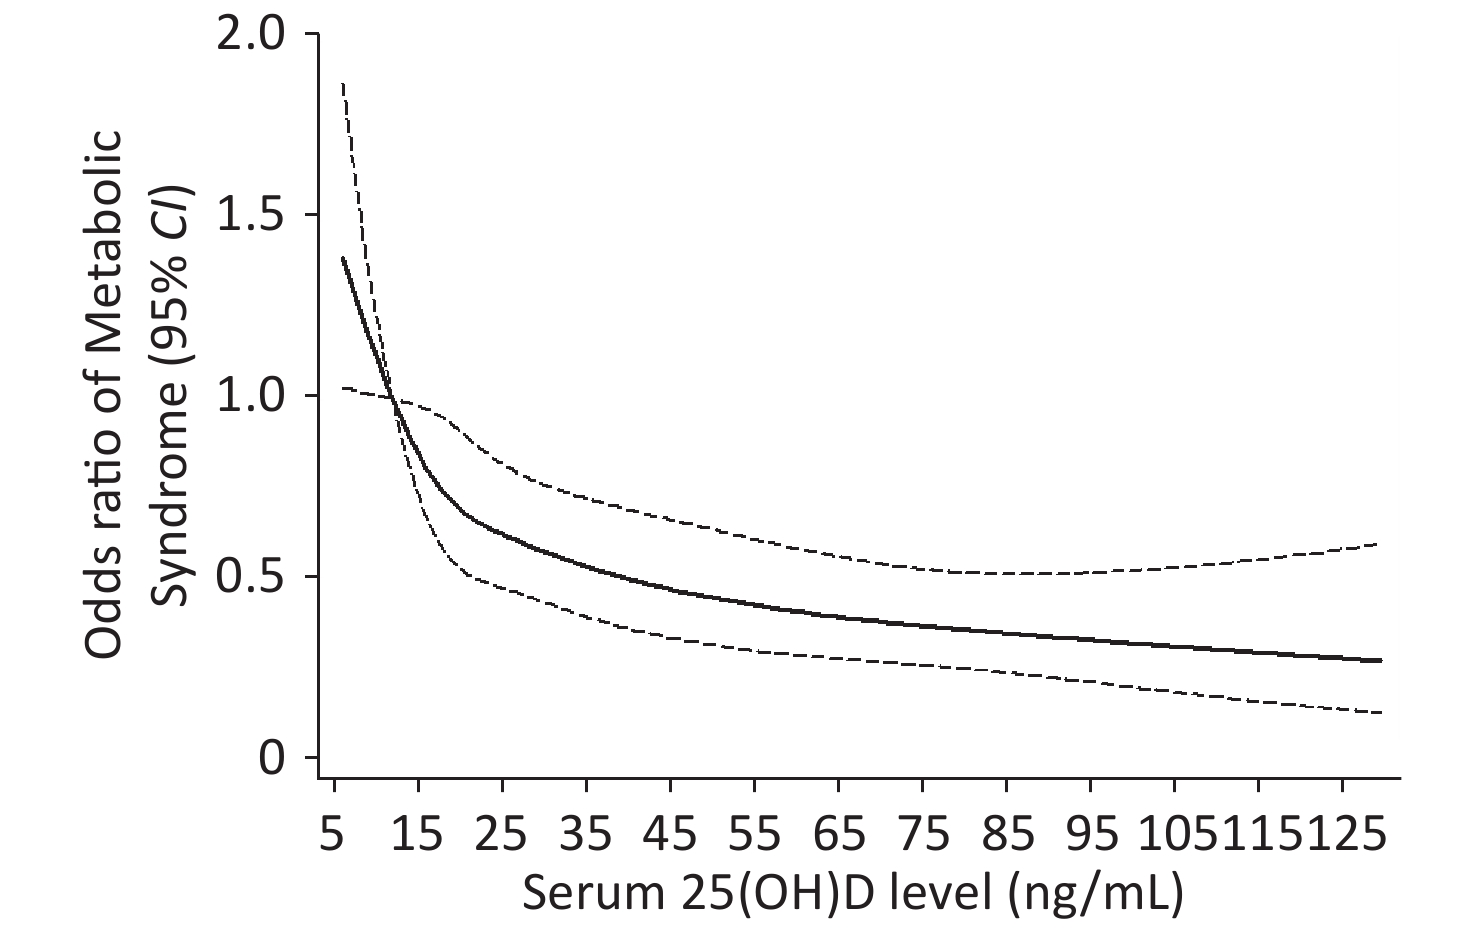
Restricted cubic spline analysis showed a negative dose–response relationship between 25(OH)D levels and the risk of MS and a linear relationship in the 25(OH)D levels that range from 5 to 25 ng/mL, and the curve was tapered after 25(OH)D levels exceed 35 ng/mL (Figure 2).
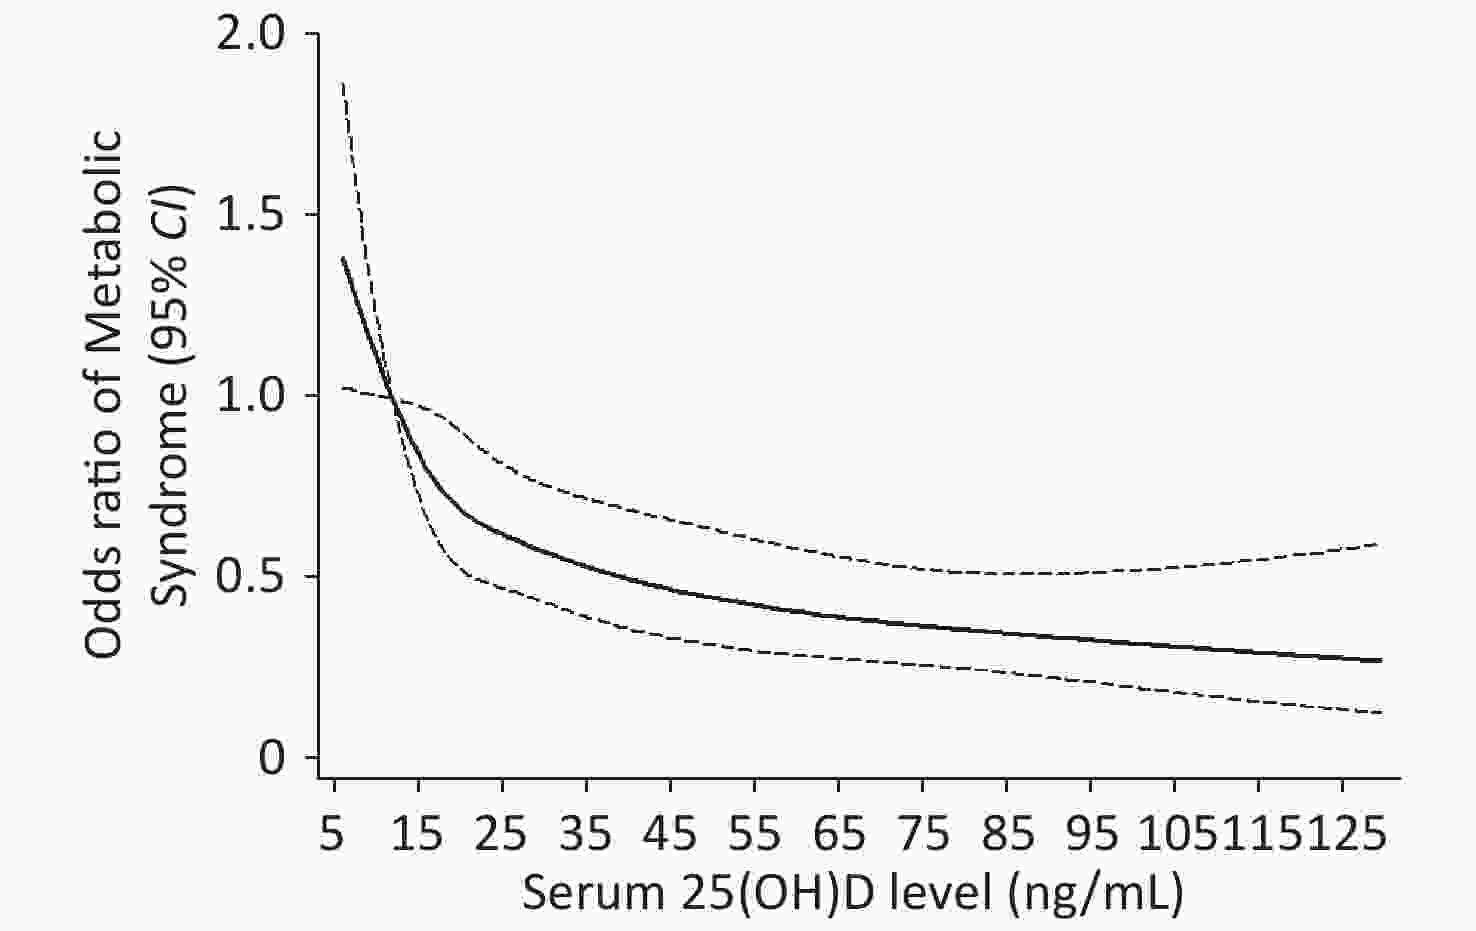
Figure 2. Dose-response analyses of the non-linear association between Serum 25(OH)D and risk of MS in the participants. adjusted for age (year), BMI (< 18.5, 18.5–23.9, 24–27.9, ≥ 28 kg/m2), smoking (yes/ever/no), alcohol consumption (yes/no), high-fat diet (yes/no), vegetable consumption (more/small), physical activity (high/moderate/low).
The pathology of MS is complex and can be influenced by various factors, such as obesity, smoking, alcohol consumption, high-fat diet, and lack of exercise. Vitamin D deficiency is considered as a risk factor of MS. The potential mechanism of vitamin D deficiency inducing MS may stem from a combination of different factors. First, polymorphisms of vitamin D receptors may play a role on the association of MS components. Meanwhile, vitamin D helps in the secretion of insulin from pancreatic β-cells and increases the sensitivity of insulin by stimulating the expression of insulin receptors[10]. Therefore, vitamin D deficiency can directly reduce β-cell function and accelerate pancreatic β-cells apoptosis through immunomodulatory effects. Second, vitamin D deficiency can lead to an increase in parathyroid hormone levels, thereby promoting adipogenesis and lipid storage. Third, vitamin D is an important regulator of the renin–angiotensin system (RAS). It can inhibit the release of the renin and reduce the levels of angiotensin II, which plays an important role in decreasing the BP. Finally, vitamin D deficiency activates the RAS and subsequently activates the body’s oxidative stress response, thereby resulting in disorders of the lipid metabolism.
This study found that the vitamin D deficiency in rural areas of Henan was a serious problem and showed a certain correlation between vitamin D deficiency and MS. However, the present study also had several limitations that need to be addressed. First, since this study had a cross-sectional design, data involving the relationship between vitamin D and MS might be biased. Second, the levels of parathyroid hormones that play an important role in regulating serum 25(OH)D levels and calcium metabolism was not determined. Third, we were unable to adjust several confounding factors, including seasonality and dietary intake of vitamin D.
In conclusion, the results of this study demonstrated that among adults in rural of China, MS components such as FBG and TG were inversely related with the serum vitamin D levels. In addition, our findings indicated that the lower serum 25(OH)D levels were associated with the risk of MS and showed a linear relationship between vitamin D levels and the risk of MS when the concentration of serum 25(OH)D was less than 25 ng/mL.
Association between Vitamin D Levels and the Risk of Metabolic Syndrome in a Rural Chinese Population
doi: 10.3967/bes2021.043
Funds:
This work was supported by the National Nature Science Foundation of China [grants number 81872626]
- Received Date: 2020-05-27
- Accepted Date: 2020-09-27
| Citation: | SUN Hua Lei, LONG Shao Rong, FU San Xian, CHEN Gai Yun, WANG Ya Juan, LIANG Rui, WANG Su Fan, ZHANG Li Ke, ZHOU Li Wei, LU Quan Jun, LI Wen Jie. Association between Vitamin D Levels and the Risk of Metabolic Syndrome in a Rural Chinese Population[J]. Biomedical and Environmental Sciences, 2021, 34(4): 330-333. doi: 10.3967/bes2021.043

|

 Quick Links
 DownLoad: