


-
Childhood and adolescence play important roles in human growth and development[1]. With societal progress and changes in environmental factors, such as climate, seasons, and even latitude and longitude, human growth and development trends are also changing. Learning more about the growth and development of children and adolescents will provide a better understanding of the growth and development of human beings, thus helping to understand the influence of politics, economy, culture, and environment on human growth and development.
Several studies have shown that the height of urban Chinese children increased from 1985 to 2010[2-3]. This change was positive in both males and females, regardless of city groups and survey periods, and was most obvious during puberty. Sexual dimorphism was also present in the changes in height. In particular, increases in height were more obvious in males than females. Notably, the extent of sexual dimorphism in terms of height was smaller when individuals were in a state of nutritional imbalance and became greater as nutrition improved[2]. A study in Wuhan showed that, until adolescence, females exhibited lower height and weight than males, and this difference was likely governed by genetic factors[3]. After entering adolescence, the height and weight of males increased greatly. Compared with males, females, particularly urban females, tend to pay more attention to their physique upon entering adolescence and seek to control their weight through diet and exercise. Consequently, the gender difference in weight showed an upward trend[3]. In contrast to height and weight, the growth of chest circumference was slow.
The age-period-cohort (APC) model estimates the effects of age, period, and birth on various outcomes. In this study, age effects refer to changes in height due to age. Similarly, time effects refer to changes in height caused by various events that occurred over time. Cohort effects reflect the differences in height caused by lifestyle changes or the different risk exposure of groups born in different years. Zhi et al.[4] analyzed Beijing’s fertility rate using the APC model to explain the reasons for the sharp increase in Beijing’s newborn population. However, to the best of our knowledge, no previous research has investigated the effects of age, period, and cohort on changes in height in China. This paper aims to explore whether the height of Chinese children and adolescents is influenced by age, period, and cohort effects. It is anticipated that the findings of this study will reveal changing trends in the mean heights of Chinese children and adolescents as influenced by these factors.
-
The China Health and Nutrition Survey (CHNS) is an international collaborative project between the Carolina Population Center at the University of North Carolina at Chapel Hill and the National Institute for Nutrition and Health (NINH, formerly the National Institute of Nutrition and Food Safety) at the Chinese Center for Disease Control and Prevention (CCDC)[5]. The CHNS data were updated up to 2015. The survey instruments were designed by an interdisciplinary group of social and biomedical scientists with extensive experience in survey research and construction in their respective fields. The data were collected in a way that enabled the team to answer China’s policy-relevant questions concerning the design and impact of programs and policies affecting each of the outcomes described above.
We extracted the CHNS data collected for the period 1989–2015. The design and methods of this survey are described in detail on the CHNS website[6]. In brief, the survey used a stratified multistage cluster sampling method to select participants in each of the surveyed provinces. We extracted observations regarding individuals aged 2–22 years at the time of the survey. We excluded observations with key variables, such as height and gender, as well as observations with heights less than 40 cm.
-
We divided age into seven groups, with each group consisting of three consecutive years, and birth cohort into eight groups, with each group consisting of five consecutive years. The survey period was included as the survey wave. Linear regression models were fitted for the overall sample, as well as for each sex, to examine the effects of age, birth cohort, and survey period on the heights of Chinese children and adolescents. Age was the first factor that was added to the model. Thereafter, survey period (i.e., survey wave) and birth (i.e., birth year) cohorts were added sequentially. The reference categories for age, survey period, and birth cohort were 2–4 years, 1989, and born before 1975, respectively. A model including all three effects could not be fitted due to the interrelatedness of the variables. To solve this problem, many researchers utilized various methods, such as a two-factor model, a nonlinear model, the penalty function method, and the estimation function method. However, these methods could not completely solve the collinearity problem at the fundamental level. In this study, the classification, age, and investigation period are not equally spaced, making it easier to avoid the collinearity problem. Thus, future research must study new methods.
The APC model assessed the effects of age, period, and birth cohort on childhood height. This method has been widely used in trend analysis[7-9]. Therefore, this study applied the APC model to analyze changes in Chinese children’s and adolescents’ heights to provide a scientific basis for the formulation of children’s and adolescents’ growth and development policies in China.
-
A total of 28,974 observations regarding individuals aged 2–22 years were included in the final analysis. Among them, 15,227 observations (52.55%) pertained to males and 13,747 observations (47.45%) pertained to females, as shown in Table 1. The proportion of observations in each age group was relatively balanced. Looking at the investigation period, the number of observations was highest in 1991 (accounting for 16.77% of all observations) and 1993 (accounting for 14.75% of all observations). The years with the lowest number of observations were 1989 and 2009, accounting for 6.40% and 6.46% of the total observations, respectively. Regarding the birth year, the highest number of observations (24.51% of the total observations) occurred in the group born in the 1985–1989 period.
Item Overall population (N = 28,974) Male (N = 15,227) Female (N = 13,747) Frequency Percent (%) Height (cm) Frequency Percent (%) Height (cm) Frequency Percent (%) Height (cm) Age (A) (years) 2–4 4,231 14.60 94.85 ± 8.94 2,301 15.11 95.56 ± 8.99 1,930 14.04 94.01 ± 8.80 5–7 4,568 15.77 114.02 ± 8.98 2,467 16.20 114.54 ± 9.07 2,101 15.28 113.41 ± 8.84 8–10 4,528 15.63 130.99 ± 9.23 2,381 15.64 131.05 ± 9.01 2,147 15.62 130.92 ± 9.47 11–13 4,743 16.37 147.08 ± 10.41 2,475 16.25 146.97 ± 11.02 2,268 16.50 147.20 ± 9.70 14–16 4,049 13.97 159.47 ± 9.10 2,110 13.86 162.88 ± 9.40 1,939 14.10 155.76 ± 7.09 17–19 3,051 10.53 163.42 ± 8.73 1,619 10.63 168.54 ± 7.21 1,432 10.42 157.63 ± 6.35 20–22 3,804 13.13 162.76 ± 8.48 1,874 12.31 168.55 ± 6.61 1,930 14.04 157.13 ± 5.93 Year of survey (P) 1989 1,853 6.40 121.34 ± 32.48 935 6.14 121.50 ± 34.23 918 6.68 121.18 ± 30.61 1991 4,859 16.77 134.94 ± 26.07 2,486 16.33 136.03 ± 27.72 2,373 17.26 133.79 ± 24.17 1993 4,273 14.75 136.08 ± 24.84 2,224 14.61 137.37 ± 26.09 2,049 14.91 134.68 ± 23.33 1997 3,643 12.57 139.90 ± 22.91 1,943 12.76 141.26 ± 24.39 1,700 12.37 138.36 ± 20.99 2000 3,420 11.80 142.77 ± 23.09 1,821 11.96 144.35 ± 24.48 1599 11.63 140.97 ± 21.26 2004 2,279 7.87 142.22 ± 24.98 1,221 8.02 144.22 ± 26.34 1,058 7.70 139.91 ± 23.10 2006 1,925 6.64 139.41 ± 26.20 1,040 6.83 140.98 ± 27.84 885 6.44 137.57 ± 24.01 2009 1,872 6.46 139.80 ± 25.35 1,024 6.72 141.78 ± 26.56 848 6.17 137.40 ± 23.59 2011 2,537 8.76 135.71 ± 26.70 1,314 8.63 136.45 ± 28.53 1,223 8.90 134.92 ± 24.58 2015 2,313 7.98 137.43 ± 26.52 1,219 8.01 138.49 ± 28.34 1,094 7.96 136.24 ± 24.30 Birth cohort (C) before 1975 2,837 9.79 160.87 ± 8.06 1,359 8.92 166.54 ± 6.19 1,478 10.75 155.65 ± 5.71 1975–1979 3,097 10.69 157.48 ± 10.46 1,621 10.65 160.65 ± 11.66 1,476 10.74 154.00 ± 7.56 1980–1984 4,609 15.91 141.55 ± 20.26 2,387 15.68 142.99 ± 21.71 2,222 16.16 140.00 ± 18.47 1985–1989 7,102 24.51 128.52 ± 28.11 3,885 25.51 130.18 ± 29.23 3,217 23.40 126.52 ± 26.55 1990–1994 3,598 12.42 137.31 ± 25.67 1,835 12.05 138.35 ± 27.27 1,763 12.82 136.22 ± 23.86 1995–1999 3,077 10.62 136.08 ± 25.78 1,653 10.86 137.27 ± 26.80 1,424 10.36 134.71 ± 24.49 2000–2004 2,456 8.48 126.50 ± 22.92 1,293 8.49 126.74 ± 23.19 1,163 8.46 126.24 ± 22.62 2005 and after 2,198 7.59 110.82 ± 17.71 1,194 7.84 110.70 ± 17.55 1,004 7.30 110.97 ± 17.90 Table 1. Distribution of the study population across study variables
-
Like the general rule of growth, the results for different APC models showed that age (A) had a steady and continuous effect on height (Table 2). As individuals’ heights increased with age (P < 0.0001), height growth estimates were used as a reference for each age group. However, the height of the 20–22 years age group did not increase significantly compared with the 17–19 years age group. Moreover, when using the 2–4 years age group as the reference group, the height growth of females in the 5–7 years, 8–10 years, and 11–13 years age groups exceeded that of males in the same age groups. Furthermore, beginning from the 14–16 years age group, the height growth of males exceeded that of females in the same age group, with the height growth of males in the 17–19 years age group estimated to be 9.37 cm greater than that of females (72.98 cm vs. 63.61 cm) in the same age group.
Item Overall population Male Female A
(210769.97)*A + P
(208728.44)A + C
(209288.2886)A
(110158.19)A + P
(108902.30)A + C
(109232.21)A
(97142.19)A + P
(96167.30)A + C
(96414.11)E CL E CL E CL E CL E CL E CL E CL E CL E CL INCPT 94.85 (94.57, 95.13) 91.60 (91.15, 92.05) 88.77 (88.22, 89.31) 95.56 (95.19, 95.92) 92.23 (91.62, 92.83) 89.56 (88.81, 90.30) 94.01 (93.64, 94.38) 91.19 (90.61, 91.77) 88.89 (88.18, 89.59) Age (A) (years) 2–4 Ref. Ref. Ref. Ref. Ref. Ref. Ref. Ref. Ref. Ref. Ref. Ref. Ref. Ref. Ref. Ref. Ref. Ref. 5–7 19.17 (18.78, 19.55) 18.82 (18.45, 19.19) 19.49 (19.11, 19.87) 18.98 (18.47, 19.50) 18.64 (18.15, 19.14) 19.26 (18.76, 19.76) 19.40 (18.88, 19.91) 19.08 (18.58, 19.58) 19.71 (19.20, 20.21) 8–10 36.14 (35.75, 36.52) 35.50 (35.12, 35.88) 36.88 (36.49, 37.27) 35.49 (34.98, 36.01) 34.98 (34.47, 35.49) 36.23 (35.71, 36.75) 36.91 (36.40, 37.42) 36.25 (35.75, 36.76) 37.59 (37.07, 38.10) 11–13 52.23 (51.85, 52.61) 51.65 (51.27, 52.03) 53.79 (53.39, 54.19) 51.41 (50.90, 51.92) 50.90 (50.39, 51.40) 52.97 (52.45, 53.50) 53.19 (52.69, 53.69) 52.66 (52.16, 53.16) 54.68 (54.16, 55.21) 14–16 64.62 (64.23, 65.02) 64.15 (63.76, 64.55) 66.83 (66.40, 67.25) 67.33 (66.80, 67.86) 66.96 (66.44, 67.49) 69.73 (69.16, 70.30) 61.75 (61.23, 62.27) 61.30 (60.78, 61.81) 63.69 (63.13, 64.25) 17–19 68.57 (68.14, 68.99) 68.42 (68.00, 68.84) 72.06 (71.58, 72.53) 72.98 (72.41, 73.56) 72.88 (72.32, 73.44) 76.53 (75.90, 77.16) 63.61 (63.05, 64.18) 63.52 (62.97, 64.08) 66.70 (66.07, 67.33) 20–22 67.91 (67.50, 68.31) 68.21 (67.82, 68.60) 72.28 (71.79, 72.76) 72.99 (72.44, 73.54) 73.33 (72.80, 73.86) 77.46 (76.80, 78.12) 63.12 (62.60, 63.64) 63.40 (62.90, 63.91) 66.87 (66.24, 67.50) Year of survey (P) 1989 − Ref. Ref. − − Ref. Ref. − − Ref. Ref. − 1991 − 0.80 (0.31, 1.29) − − 0.76 (0.09, 1.43) − − 0.60 (−0.03, 1.23) − 1993 − 1.77 (1.27, 2.27) − − 1.77 (1.08, 2.45) − − 1.45 (0.81, 2.10) − 1997 − 2.64 (2.12, 3.16) − − 2.24 (1.53, 2.94) − − 2.47 (1.80, 3.14) − 2000 − 3.92 (3.40, 4.45) − − 3.65 (2.94, 4.36) − − 3.70 (3.02, 4.38) − 2004 − 4.83 (4.26, 5.39) − − 4.75 (3.99, 5.51) − − 4.20 (3.47, 4.94) − 2006 − 5.05 (4.47, 5.63) − − 5.19 (4.41, 5.98) − − 4.25 (3.48, 5.01) − 2009 − 6.14 (5.56, 6.73) − − 6.70 (5.92, 7.49) − − 4.93 (4.16, 5.69) − 2011 − 6.97 (6.42, 7.51) − − 7.25 (6.50, 7.99) − − 6.40 (5.69, 7.10) − 2015 − 7.87 (7.32, 8.43) − − 8.17 (7.42, 8.93) − − 7.15 (6.43, 7.87) − Birth cohort (C) before 1975 − − Ref. Ref. − − Ref. Ref. − − Ref. Ref. 1975–1979 − − 2.09 (1.59, 2.59) − − 1.22 (0.54, 1.90) − − 1.94 (1.30, 2.58) 1980–1984 − − 2.92 (2.43, 3.42) − − 2.67 (1.99, 3.36) − − 2.27 (1.63, 2.90) 1985–1989 − − 3.76 (3.28, 4.24) − − 3.56 (2.90, 4.22) − − 2.80 (2.17, 3.42) 1990–1994 − − 5.97 (5.45, 6.49) − − 6.03 (5.31, 6.75) − − 5.14 (4.48, 5.80) 1995–1999 − − 6.62 (6.07, 7.16) − − 7.21 (6.47, 7.96) − − 5.01 (4.31, 5.71) 2000–2004 − − 8.03 (7.44, 8.61) − − 8.05 (7.24, 8.85) − − 6.99 (6.24, 7.75) 2005 and after − − 8.95 (8.33, 9.57) − − 8.61 (7.77, 9.45) − − 8.31 (7.51, 9.12) Note. *The Akaike information criterion (AIC) is shown in parentheses. P,investigation period. C Table 2. Comparison of the estimated effects among different groups of indices
-
The average heights of the investigated groups continuously increased during the investigation period (P), as shown in Table 2. Based on the average height of the groups during the 1989 survey, the analysis revealed that, by 2015, the average height of the groups increased by 7.87 cm, with an average increase of –8.17 cm in males and 7.15 cm in females. It was statistically significant to use height growth estimates as a reference for the investigation period (P < 0.001).
-
Birth year (C) had a stable effect on height in the overall group, as well as in the gender-based groups (Table 2). When the height of individuals born in or before 1975 was used as the reference, the average height of each birth cohort showed an increase as compared to the previous birth cohort. For example, in the overall group of individuals born in 2005 or later, the average height increased by 8.95 cm as compared to those born in 1975 or earlier. It was statistically significant to use height growth estimates as a reference for birth years (P < 0.001).
-
Figure 1 shows the estimated growth in the height of males and females by age group, survey year, and birth year, respectively, relative to their respective control groups.
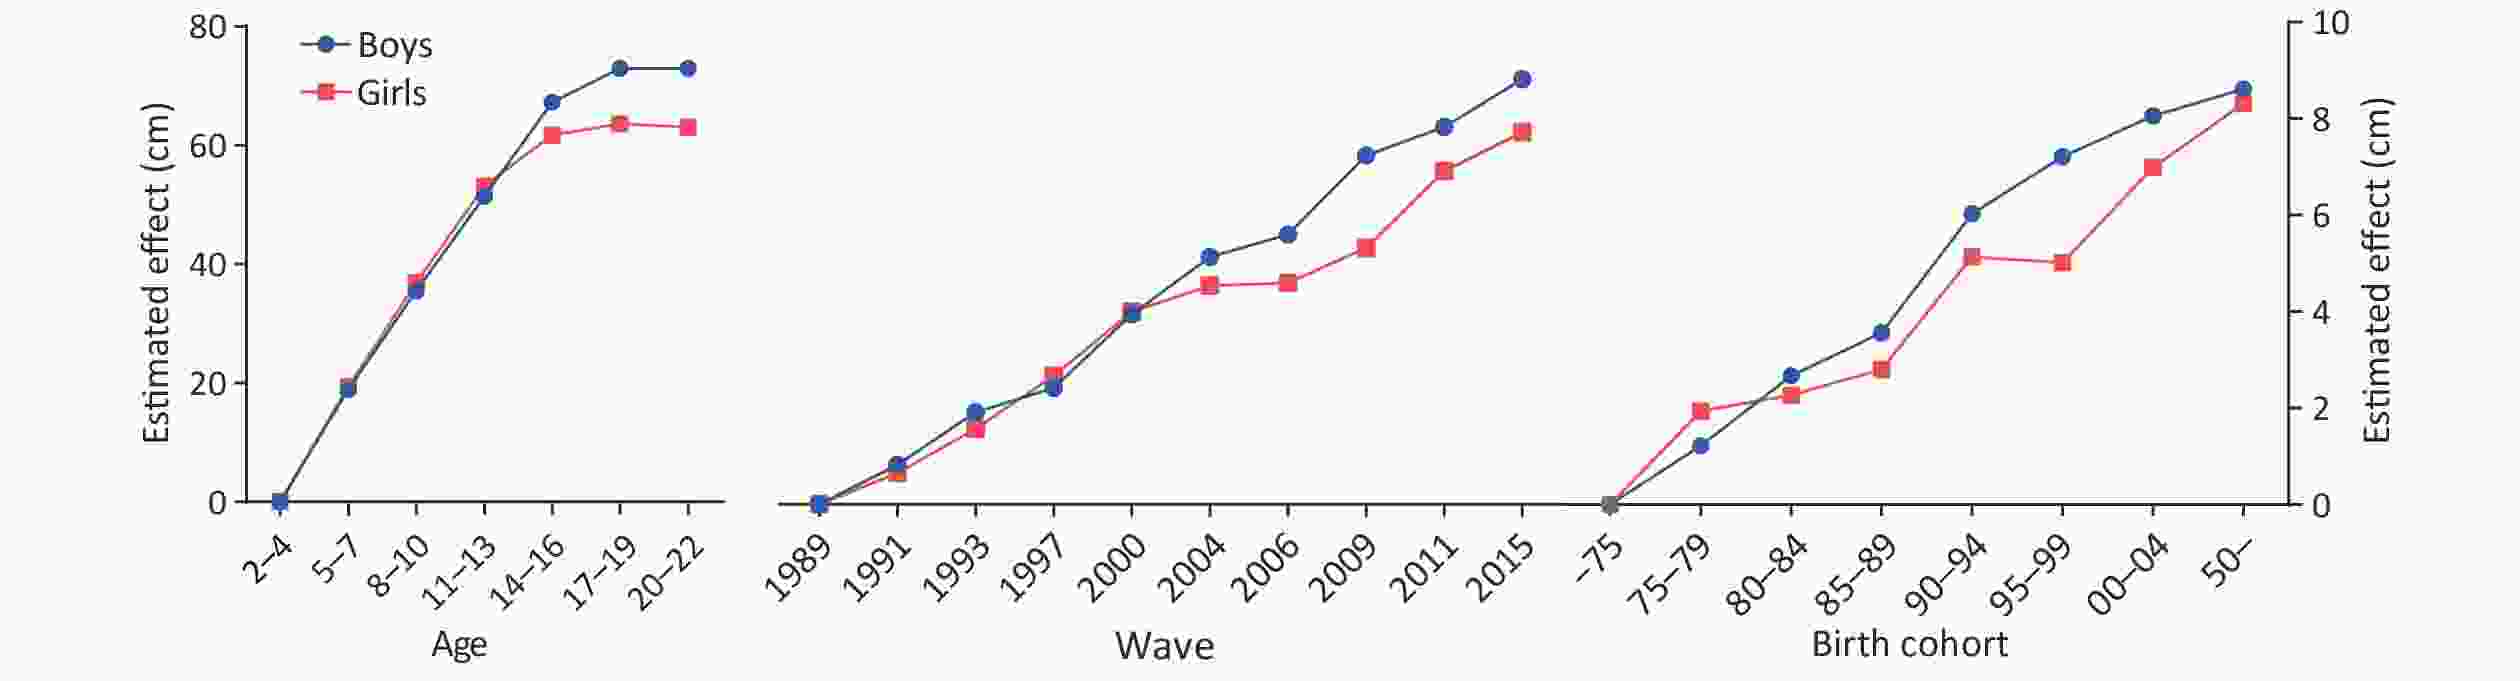
Figure 1. Estimated growth in the height of males and females by age group, survey year, and birth year, respectively, relative to their respective control groups.
-
The growth and development of children and adolescents may not only reflect the status of their health but also act as an important indicator of national economic development, health care, and society. With the rapid improvement in economic living standards, the growth and development of children and adolescents have improved in China. However, the prevalence of underweight, overweight, and obesity in children is also increasing. Moreover, overweight and obesity in childhood are associated with an increased prevalence of cardiovascular and cerebrovascular diseases in adulthood.
Height and weight are important growth and development indicators in children and adolescents. Therefore, it is very important to study the height of children and adolescents. Children’s growth and development are affected by various factors, such as heredity, age, gender, race, season, region, nutrition, and physical exercise. According to a recent study, the Dutch are the tallest race in the world[1], and their height has reached a limit beyond which human beings cannot grow taller[1]. The third trimester of pregnancy is the period of fetal nutrient storage. Premature infants commonly demonstrate symptoms of inadequate nutrient storage[10]. Malnutrition in mothers during early fetal development may result in low birth weight and obesity in fetuses[11]. Children’s weight is also affected by the amount of sleep they receive, with obese children having shorter sleep periods than normal-weight children[12]. The process of human growth and development is a long-term and continuous process involving the transition from quantitative to qualitative change.
The findings showed that birth year (A) had a stable effect on height. Since height increased with age, it was statistically significant to use height growth estimates as a reference point for each age group. This is because height may be affected by different factors, such as varying nutrition levels, at different ages. However, the height of individuals in the 20–22 years age group did not increase significantly compared with that of individuals in the 17–19 years age group. This suggests that at –19 years of age, individuals’ heights tended to stop increasing. In addition, the rate of increase in height was different for males and females of different ages. Using the 2–4 years age group as the reference group, the findings show that the height growth rate of females in the 5–7 years, 8–10 years, and 11–13 years age groups exceeded that of males in the same age groups. However, starting from the 14–16 years age group, the height growth rate of males exceeded that of females in the same age group. Compared with females, the estimated increase in height in males aged 17–19 years was 9.37 cm higher. As the period of investigation (P) increased, the average height of the investigated groups also increased continuously. It was statistically significant to use height growth estimates as a reference for the investigation period analysis. Based on the average height of the groups during the 1989 survey, the results showed that by 2015, the average height of the overall group increased by 7.87 cm, while the average height of the male and female groups increased by 8.17 cm and 7.15 cm, respectively. Birth year (C) had a stable effect on the height of the overall group, as well as each gender group. Thus, it was statistically significant to use height growth estimates as a reference for the birth year analysis. Using the height of individuals born in 1975 or earlier as the reference group, the average height of each birth cohort increased compared to the previous birth cohort. For example, for the overall group of participants born in 2005 or later, the average height increased by 8.95 cm across all age groups as compared to the overall group of participants born in 1975 or earlier. This finding shows that the average heights of children and adolescents have changed over time.
The presence of varying factors, such as season, region, nutrition, and physical exercise, at different ages affect the growth of children and adolescents. External environmental factors are also important factors that influence the height and weight of children and adolescents. Studies have shown that the height of children during development is closely related to the latitude and distance from the equator, i.e., the higher the latitude, the greater the height[13-14]. The average heights of males and females also increase with distance from the equator[15]. Moreover, studies have shown that children born in summer are less likely to develop retardation than children born in winter[16]. In addition, many studies have found that further study of other developmental indicators that may affect the height of children and adolescents is necessary [17-2013-16]. Furthermore, regional economy and urbanization have a significant impact on children’s growth and development. Urbanization has been found to improve children’s health[17], and greater exposure to green plants in residential areas has a beneficial effect on the physical development of children and adolescents[18]. Vigorously promoting urbanization, developing urban gardens, and improving the environment are effective ways to promote the growth and development of children and adolescents. Studies have also shown that feeding methods can also affect the growth and development of infants and young children. Breastfeeding can promote more infant growth and development than artificial feeding and mixed feeding[19]. Early growth and development indicators can also be improved through pediatric health care and massage[20].
Overall, China has experienced a comprehensive long-term growth trend, which is reflected in the improved outcomes for childhood growth, early puberty, increased adulthood height, and the continuous right shift of the height/weight ratio curve. Before China’s economic reforms and opening up, improvements in nutrition were governed by the level of food availability. Consequently, the health of children and adolescents in China was mainly threatened by malnutrition and anemia. After the reforms and opening up of China, there was a large increase in the number of obese and overweight children and adolescents[21]. Obesity/overweight is associated with several health risks[22] and has become an important global health challenge. Therefore, health workers that work with children and in schools in China should pay more attention to obesity/overweight in children and adolescents. In the face of changes and new challenges, it is important to constantly formulate new disease prevention and control strategies and measures to promote the healthy growth of children and adolescents. Due to the limitations of the open database, it was not possible to obtain data for after 2010, which limited the comprehensiveness of the results of this research. After the database is updated, the results of this study will continue to be updated. In addition, future researchers should pay attention to the collinearity of the APC method.
-
This research utilized data obtained from the China Health and Nutrition Survey (CHNS). We thank the National Institute of Nutrition and Food Safety, the China Center for Disease Control and Prevention, the Carolina Population Center, the University of North Carolina at Chapel Hill, the NIH (R01-HD30880, DK056350, and R01-HD38700), and the Fogarty International Center, NIH for their financial support in collecting the CHNS data and analysis files for the period 1989–2006 and both parties plus the China-Japan Friendship Hospital and the Ministry of Health for supporting the CHNS 2009 and future surveys.
The authors would like to express their gratitude to EditSprings (
https://www.editsprings.com/ ) for providing their expert linguistic services.
Increases in Height among Chinese Children and Adolescents by Gender: An Age-Period-Cohort Analysis
doi: 10.3967/bes2021.046
Funds:
This study was supported by 2020 Beijing Natural Science Foundation-Haidian Original Innovation Joint Fund Key research topic. The research of varicella disease burden and economic evaluation of vaccination [L202008]; Beihang University & Capital Medical University Advanced Innovation Center for Big Data-Based Precision Medicine Plan [BHME- 201801]; Study on the current situation, change trend, nutrition and related factors of diabetes in children and adolescents, National Key R&D Program of China [2016YFC1305201]; Study on the influencing factors of herpes zoster, Chinese Center for Disease Control and Prevention surplus project [59911917]
- Received Date: 2020-12-15
- Accepted Date: 2021-03-15
-
Key words:
- Age-period-cohort analysis /
- Children and adolescents /
- Height
Abstract:
| Citation: | HU Yue Hua, WANG Xin Yu, YAO Hong Yan, ZHANG Jian, YIN Da Peng, FENG Guo Shuang. Increases in Height among Chinese Children and Adolescents by Gender: An Age-Period-Cohort Analysis[J]. Biomedical and Environmental Sciences, 2021, 34(5): 348-355. doi: 10.3967/bes2021.046

|

 Quick Links
 DownLoad: