


-
With the rapid urbanization in China in the past three decades, substantial changes in the lifestyles of the general population have been observed, with children being particularly vulnerable to such impact. However, little is known about such impact on Chinese children. Particularly, a paucity of data on the recent trends in physical activity among Chinese children still exists. To promote physical activity among children, it is practically significant to identify the underlying causes and investigate the differences in trends according to demographic, social, and economic factors[1]. Such findings could provide important insights for policy makers to develop effective strategies to promote physical activity among Chinese children and could also serve as a reference point for other developing countries. Using the data from the China Health and Nutrition Survey (CHNS), this study aims to examine the trends in physical activity among Chinese children aged 6 to 17 years from 2004 to 2015 based on their demographic and social characteristics.
The CHNS is a nationwide, ongoing cohort study with an evident hierarchical structure that covers regions with substantial variability in geography, economic development, and public resources. The physical activity questionnaire was adapted from the US Health Interview Surveys developed by Professor Barry Popkin of the University of North Carolina and Professor Barbara Ainsworth of Arizona State University[2]. The physical activity questionnaire was designed to assess physical activity in the following four domains: (1) active leisure, (2) in-school physical activity, (3) active travel, and (4) domestic physical activity. Active leisure and in-school physical activities involved strolling, gymnastics, track and field, martial arts, ball games, and other activities; active travel involved walking and cycling; and domestic physical activity involved cleaning the house, doing laundry, and cooking and buying food. The survey protocols, instruments, and procedures used to obtain informed consent for this study were approved by the Medical Ethics Committee of the National Institute for Nutrition and Health, Chinese Center for Disease Control and Prevention and University of North Carolina. During the implementation of the project, the rights and privacy of relevant personnel involved in the survey were fully respected, and written informed parental consent was obtained for each participant.
Physical activity outcome measures included the following: (1) the average daily time spent in physical activity (min/day), (2) average daily time spent in moderate-to-vigorous intensity physical activity (MVPA) (min/day), (3) average weekly volume of each of the four domains of physical activity (metabolic equivalent of task [MET]-hrs/week), and (4) average weekly volume of total physical activity (MET-hrs/week), which was produced by multiplying the average weekly time spent in various physical activities by their corresponding MET values with reference to the 2017 Youth Compendium of Physical Activities[3]. The compendium provides MET intensity levels for 196 activities presented in the following four age groups: 6–9, 10–12, 13–15, and 16–18 years. Demographic characteristics included age, gender, ethnicity, annual family income, and parental educational levels. Social factors included residential areas (urban/rural), region (north/south), and urbanization level (low/medium/high). Urbanization level was estimated using the urban city index developed by Jones Smith and Barry Popkin[4]. The index was produced from a comprehensive evaluation of the following 12 dimensions: population density, economic activity, traditional markets, modern markets, transportation infrastructure, sanitation, communication, housing, education, diversity, health infrastructure, and social services[4]. In this study, the compiled urban city index was stratified into low, medium, and high levels of urbanization.
The Statistical Analysis System 9.4 software was used for data cleaning and analyses. Repeated measures mixed models were employed using the physical activity outcomes as dependent variables and survey year as an independent variable, while controlling for all demographic and social characteristics. Community was included as a random effect in the models. The adjusted means (standard deviation) of the physical activity outcome were reported. The trends in all outcomes were examined, and the differences across survey years were compared using the Bonferroni method. The trends were further analyzed after gender, age, urbanization level, residential area, and region were stratified.
The study sample included 4,341 Chinese children (mean age, 11.0 ± 3.3 years) in 298 communities with a total of 6,936 observations. Table 1 summarizes the characteristics of the participants by survey years. There was no significant change in the average daily time spent in physical activity (P = 0.052) from 2004 to 2015.
Item CHNS year Statistics
(P-value)2004 2006 2009 2011 2015 N 1,593 1,267 1,141 1,544 1,391 Gender (%)a Boys 854 (53.6) 677 (53.4) 644 (56.4) 791 (51.2) 728 (52.3) Z = −0.304 (Unilateral
P = 0.381)Girls 739 (46.4) 590 (46.6) 497 (43.6) 753 (48.8) 663 (47.7) Age (%)a 6–11 y 838 (52.6) 788 (62.2) 743 (65.1) 1,027 (66.5) 1,057 (76.0) Z = 3.38 (Unilateral
P < 0.001)12–17 y 755 (47.4) 479 (37.8) 398 (34.9) 517 (33.5) 334 (24.0) Ethnicity (%)b Han 1,374 (86.3) 1,065 (84.1) 957 (83.9) 1,353 (87.6) 1,212 (87.1) Z = −0.458 (Unilateral
P = 0.323)Minority 219 (13.7) 202 (15.9) 182 (16.0) 189 (12.2) 169 (12.2) Unknown 0 0 2 (0.2) 2 (0.1) 10 (0.7) Family income level (%)a Low (< 50,000 yuan/year) 1,584 (99.4) 1,249 (98.6) 1,082 (94.8) 1,346 (87.2) 969 (69.7) Z = −7.443 (Unilateral
P < 0.001)High (> 50,000 yuan/year) 9 (0.6) 18 (1.4) 59 (5.2) 198 (12.8) 422 (30.3) Paternal educational levels (%)c Low (primary or below) 204 (12.8) 198 (15.6) 153 (13.4) 225 (14.6) 195 (14.0) Χ2 = 0.000 (P = 0.995) Middle (secondary completed) 1,203 (75.5) 938 (74.0) 871 (76.3) 1,122 (72.7) 1,041 (74.8) High (college or higher) 186 (11.7) 131 (10.3) 117 (10.3) 197 (12.8) 155 (11.1) Maternal educational levels (%)c Low (primary or below) 307 (19.3) 271 (21.4) 225 (19.7) 315 (20.4) 283 (20.3) Χ2 = 0.002 (P = 0.966) Middle (secondary completed) 1,102 (69.2) 870 (68.7) 805 (70.6) 1,040 (67.4) 960 (69.0) High (college or higher) 184 (11.6) 126 (9.9) 111 (9.7) 189 (12.2) 148 (10.6) Urbanization level of communityc Low 534 (33.5) 416 (32.8) 380 (33.3) 513 (33.2) 460 (33.1) Χ2 = 0.01 (P = 0.911) Medium 533 (33.5) 417 (32.9) 376 (33.0) 509 (33.0) 451 (32.4) High 526 (33.0) 434 (34.3) 385 (33.7) 522 (33.8) 480 (34.5) Residential areas (%)a Urban 444 (27.9) 370 (29.2) 308 (27.0) 583 (37.8) 486 (34.9) Z = 1.540 (Unilateral
P = 0.062)Rural 1,149 (72.1) 897 (70.8) 833 (73.0) 961 (62.2) 905 (65.1) Region (%)a North 679 (42.6) 500 (39.5) 402 (35.2) 494 (32.0) 446 (32.1) Z = −1.88 (Unilateral
P = 0.03)South 914 (57.4) 767 (60.5) 739 (64.8) 1,050 (68.0) 945 (67.9) Physical activity (SD)d Time spent in physical activity (min/day) 65.9 ± 2.5 65.7 ± 3.0 72.6 ± 3.0 72.5 ± 2.7 61.4 ± 2.9 F = 3.78 (P = 0.052) Time spent in MVPA (min/day) 47.2 ± 2.3 44.1 ± 2.3 44.6 ± 2.4 45.9 ± 2.2 34.5 ± 2.1 F = 9.29 (P < 0.001) Volume of total physical activity (MET-hrs/week) 41.7 ± 1.6 40.6 ± 2.0 43.9 ± 1.9 43.5 ± 1.7 35.9 ± 1.7 F = 5.16 (P < 0.001) Active leisure 18.8 ± 1.3 17.4 ± 1.4 19.1 ± 1.4 18.1 ± 1.2 18.5 ± 1.3 F = 0.61 (P = 0.654) In-school physical activity 11.6 ± 0.6 11.3 ± 0.7 11.2 ± 0.7 12.1 ± 0.6 7.0 ± 0.5 F = 25.04 (P < 0.001) Active travel 10.0 ± 0.5 10.0 ± 0.5 9.5 ± 0.5 9.7 ± 0.5 8.7 ± 0.5 F = 1.70 (P = 0.147) Domestic physical activity 2.1 ± 0.2 2.4 ± 0.3 3.8 ± 0.3 3.6 ± 0.3 2.0 ± 0.2 F = 12.66 (P < 0.001) Note. aUsing the Cochran–Armitage trend test; bUsing the Fisher’s exact test; cUsing the Mantel–Haenszel chi-squared test; dUsing the repeated measures mixed models to test the trends after adjusting other sociodemographic and social characteristics; Statistics index P < 0.05 is shown in bold. Table 1. Distribution and trends of demographic and social characteristic and physical activity among Chinese children aged 6–17 years from 2004 to 2015
However, the average daily time spent in MVPA decreased by 26.9% from 47.2 ± 2.3 min/d to 34.5 ± 2.1 min/d (P < 0.001). The total physical activity decreased from 41.7 ± 1.6 MET-hrs/week in 2004 to 35.9 ± 1.7 MET-hrs/week in 2015 (P < 0.001). Regarding the domains of physical activity, active leisure had the largest share in total physical activity; in-school physical activity decreased from 11.6 ± 0.6 MET-hrs/week in 2004 to 7.0 ± 0.5 MET-hrs/week in 2015 (P < 0.001). Overall, there was a more noticeable decrease in physical activity between 2011 and 2015. Specifically, from 2011 to 2015, daily time spent in physical activity decreased by 15.3% (P = 0.004); MVPA decreased by 24.8% (P < 0.001); and total physical activity decreased by 17.5% (P = 0.002). Moreover, in-school physical activity experienced the greatest decrease (42.1%, P < 0.001), followed by domestic physical activity (44.4%, P < 0.001) and active travel (10.3%, P < 0.001).
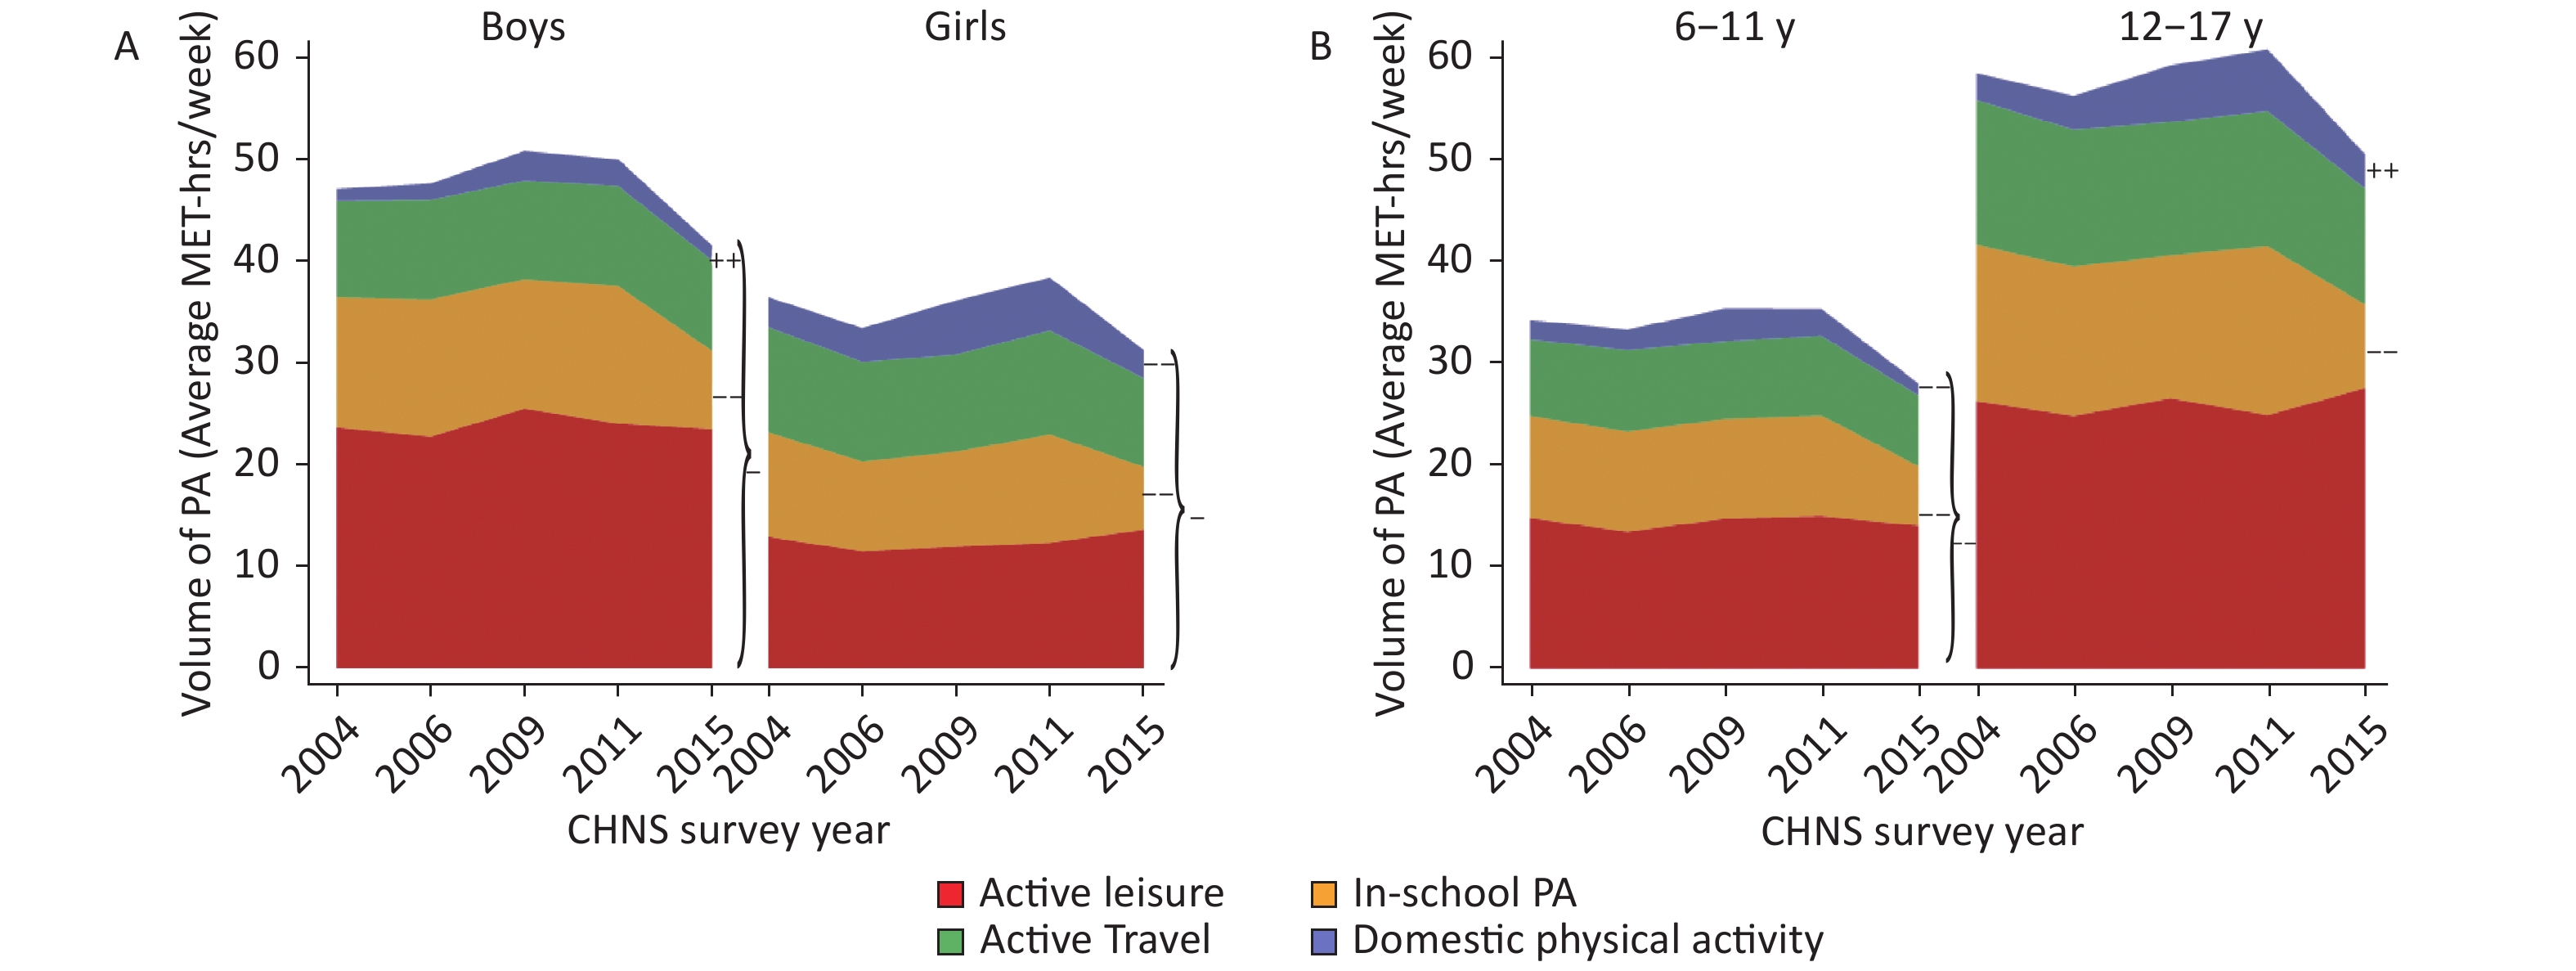
Gender Across all survey years, the total physical activity among boys was higher than that among girls (P < 0.001). Specifically, the active leisure among boys was nearly double than that among girls (P < 0.001). The in-school physical activity among boys was higher than that among girls (P ≤ 0.020). However, the domestic physical activity among girls was higher than that among boys (P ≤ 0.012). From 2004 to 2015, the total physical activity among boys and girls decreased from 47.0 ± 2.6 MET-hrs/week to 41.6 ± 2.4 MET-hrs/week (P = 0.006) and from 36.3 ± 2.1 MET-hrs/week to 31.0 ± 1.9 MET-hrs/week (P = 0.002), respectively. Notably, a more profound decrease in total physical activity was observed from 2011 to 2015, with a decrease of 16.8% (P = 0.011) and 19.0% (P = 0.002) among boys and girls, respectively. Over the 11 years, the decrease in in-school physical activity contributed to the largest proportion of the decrease in total physical activity, with a decrease of 5.1 MET-hrs/week (P < 0.001) and 4.1 MET-hrs/week (P < 0.001) among boys and girls, respectively. Interestingly, opposite trends in domestic physical activity were observed among boys and girls, with an increase of 0.3 MET-hrs/week (P < 0.001) among boys but a decrease of 0.2 MET-hrs/week among girls (P < 0.001). See Figure 1A.
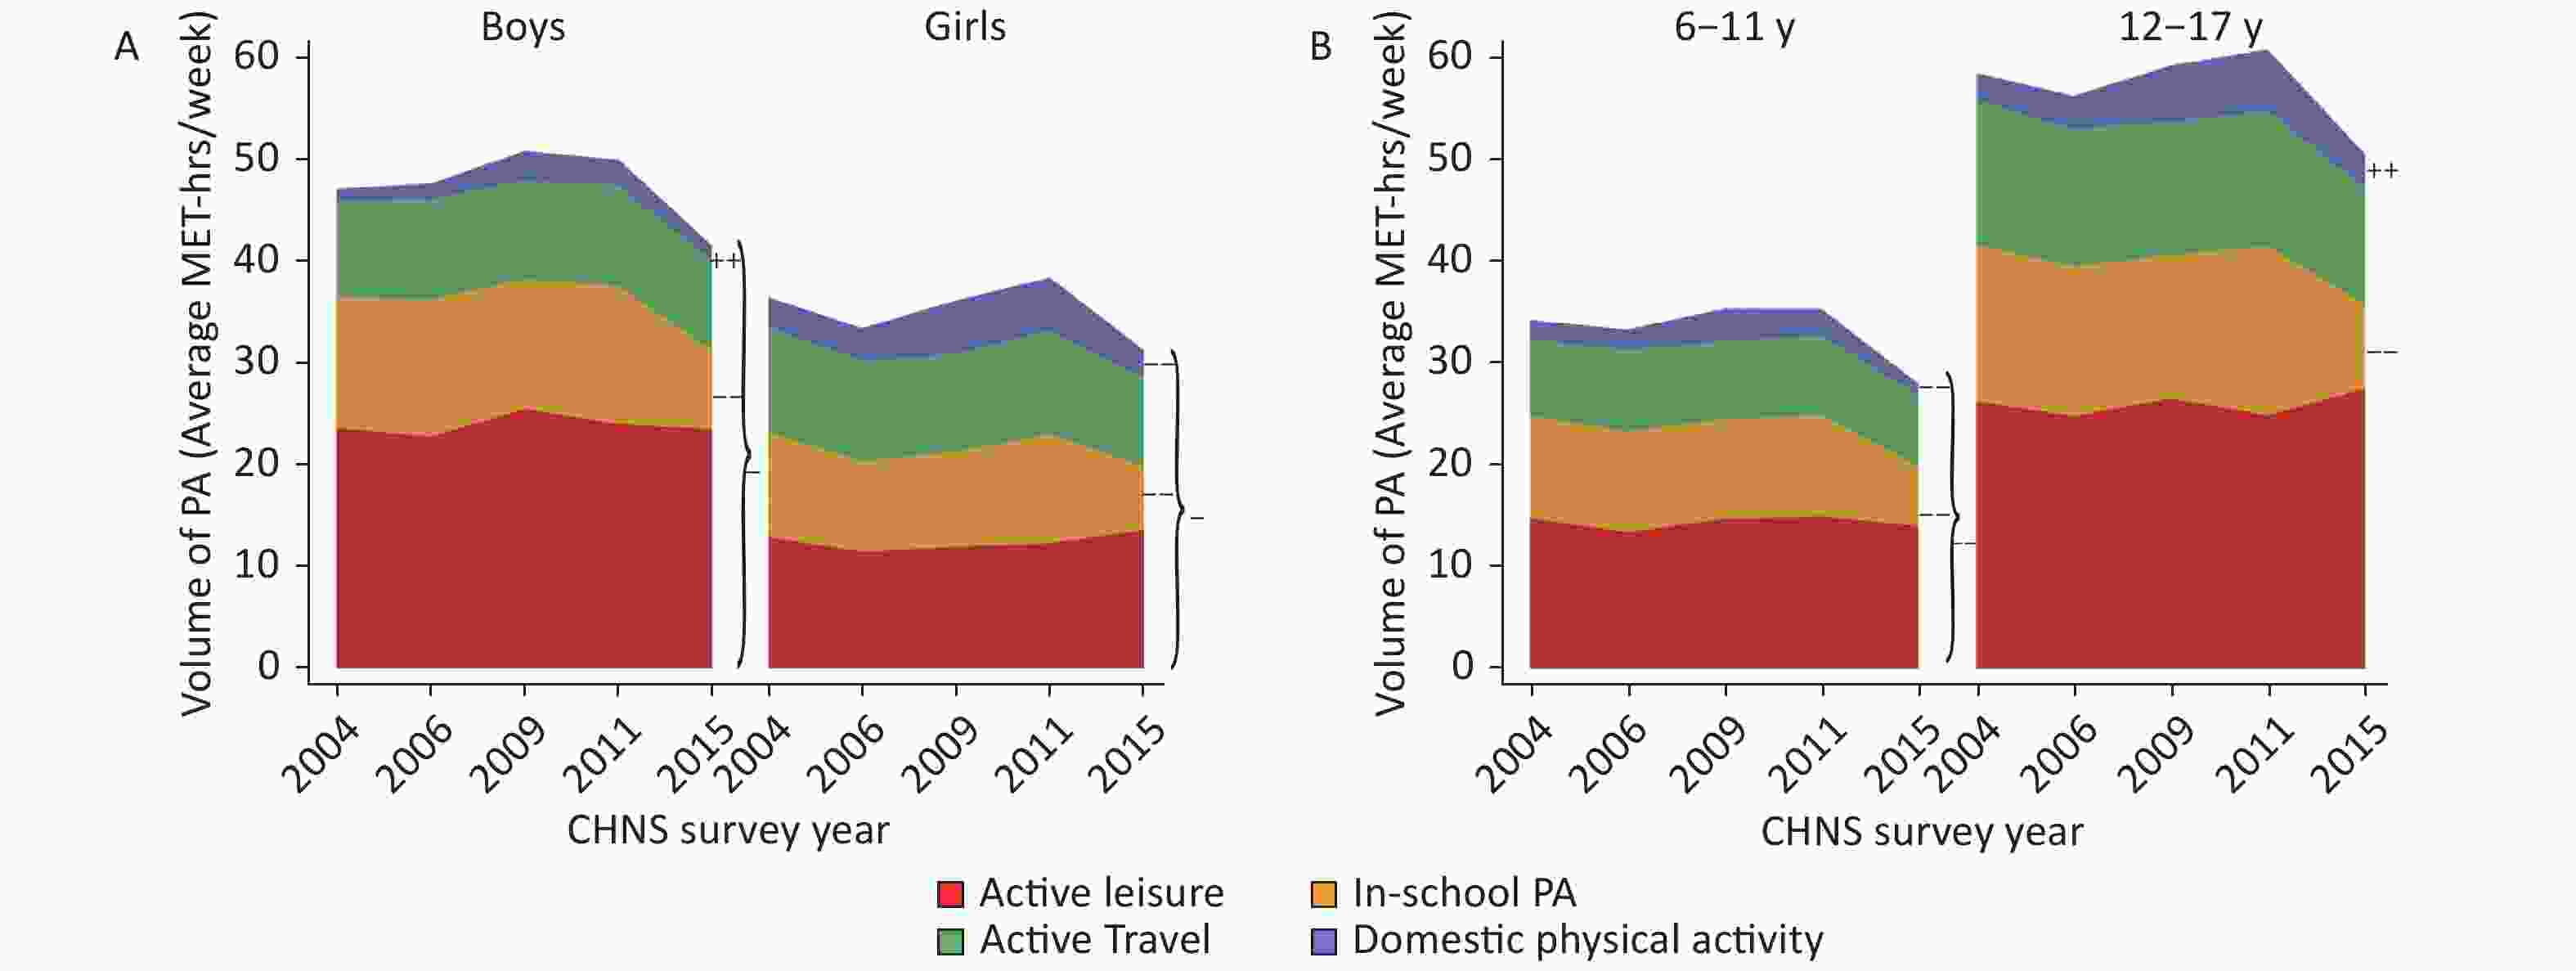
Figure 1. Trends of physical activity (metabolic equivalent of task-hrs/week) among Chinese children based on their demographic characteristics, including gender (A) and age (B)
Age Across all survey years, the total physical activity among children aged 12–17 years was higher than that among children aged 6–11 years (P < 0.001). Particularly, a more profound difference was observed in active leisure (P < 0.001). From 2004 to 2015, the total physical activity among the 6–11-year-old group decreased from 34.2 ± 1.9 MET-hrs/week to 28.0 ± 1.7 MET-hrs/week (P < 0.001), whereas there was no evidence of a change in the 12–17-year-old group. Over the 11 years, the in-school physical activity decreased by 4.1 MET-hrs/week (P < 0.001) and 7.1 MET-hrs/week (P < 0.001) among the 6–11-year-old group and 12–17-year-old group, respectively. From 2004 to 2015, the domestic physical activity among the 6–11-year-old group decreased by 0.71 MET-hrs/week (P < 0.001), whereas that among the 12–17-year-old group increased by 0.70 MET-hrs/week (P < 0.001). See Figure 1B.
Urbanization Level There was no evidence of a difference in the total physical activity among the three urbanization groups across all survey years. The urbanization level increased with total physical activity but decreased with domestic physical activity (P < 0.001). From 2004 to 2015, the total physical activity among the high urbanization group and the medium urbanization group decreased from 49.4 ± 3.2 MET-hrs/week to 40.9 ± 3.0 MET-hrs/week (P = 0.037) and from 41.6 ± 3.0 MET-hrs/week to 35.7 ± 2.8 MET-hrs/week (P = 0.031), respectively, with a substantial decrease from 2011 to 2015 (P < 0.001). In contrast, there was no significant change among the low urbanization group. From 2004 to 2015, the in-school physical activity among the low, medium, and high urbanization groups decreased by 2.4 MET-hrs/week (P = 0.005), 4.2 MET-hrs/week (P < 0.001), and 5.6 MET-hrs/week (P < 0.001), respectively. Over the 11 years, the domestic physical activity among the low urbanization group showed an overall upward trend (P < 0.001), whereas that among the medium urbanization group decreased by 1.1 MET-hrs/week (P = 0.007). See Figure 2A.
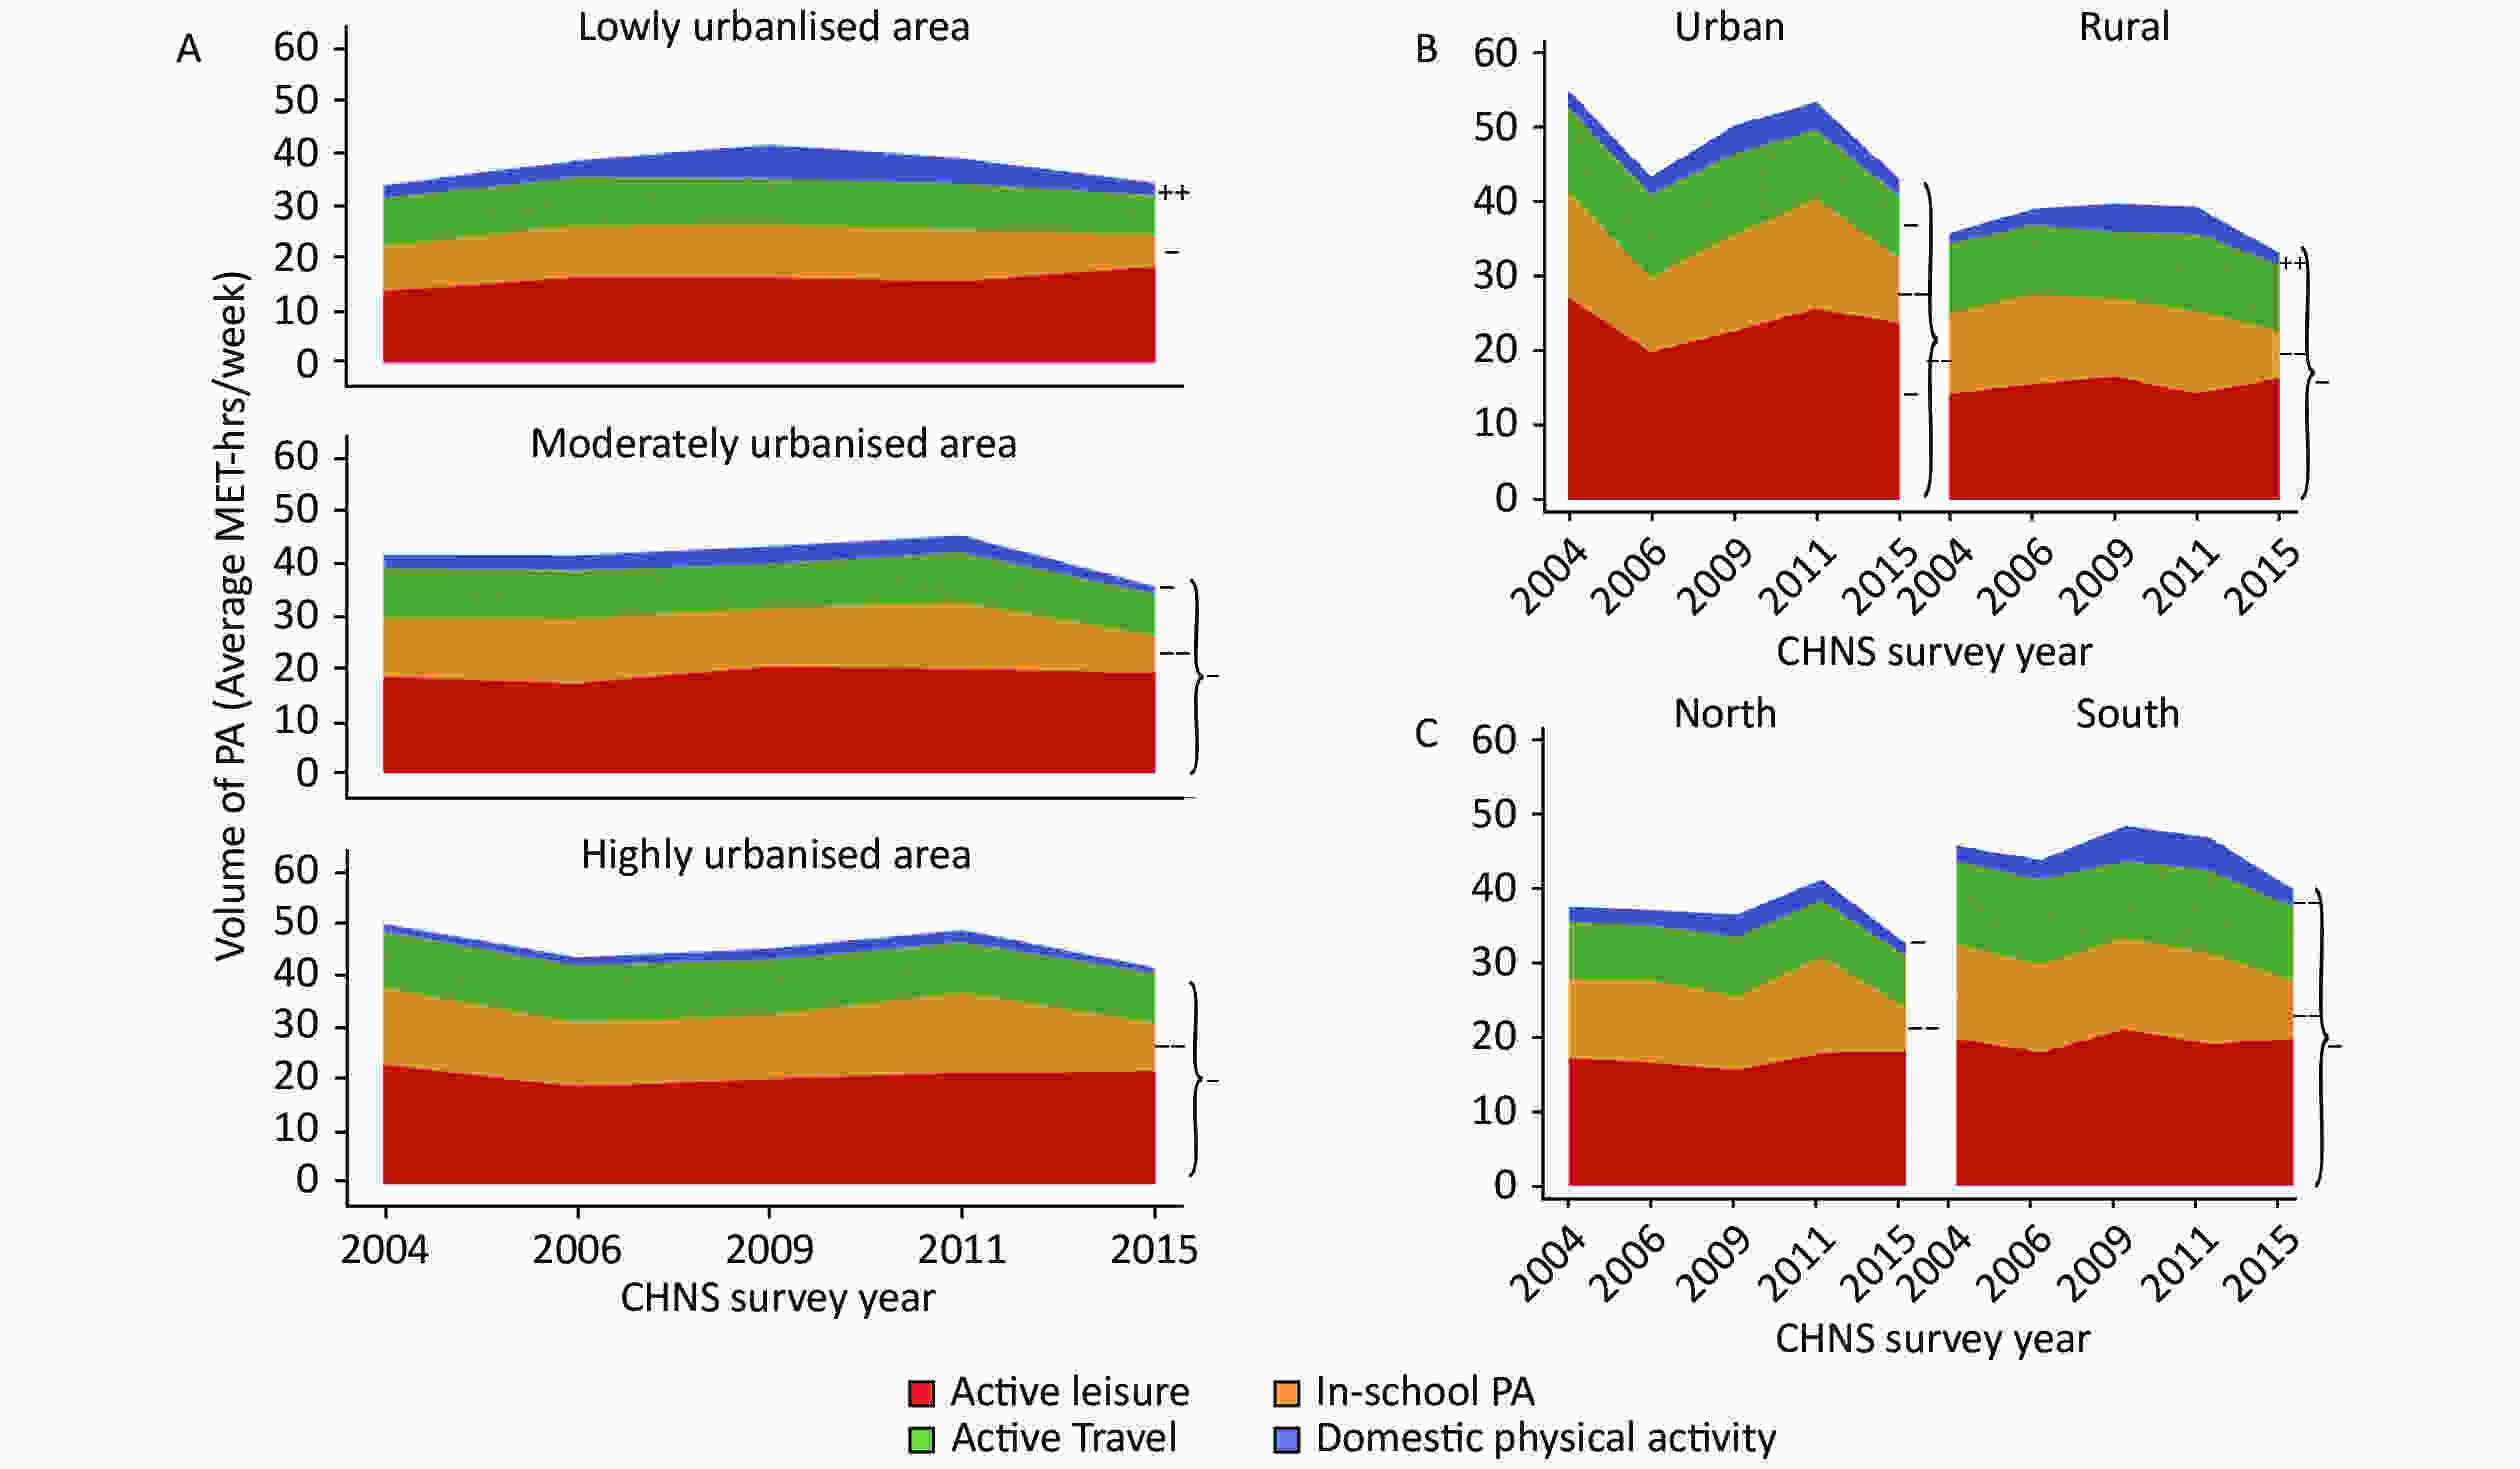
Figure 2. Trends of physical activity (metabolic equivalent of task-hrs/week) among Chinese children based on their social characteristics, including urbanization level (A), residential area (B), and region (C)
Residential Area The total physical activity among urban children was higher than that among rural children, specifically in 2004 and 2011. From 2004 to 2015, the total physical activity among the urban children and rural children decreased from 54.3 ± 3.6 MET-hrs/week to 42.4 ± 3.2 MET-hrs/week (P < 0.001) and from 35.7 ± 2.1 MET-hrs/week to 32.9 ± 1.9 MET-hrs/week (P = 0.003), respectively. Over the 11 years, the in-school physical activity among the urban and rural children decreased by 5.3 MET-hrs/week (P < 0.001) and 4.5 MET-hrs/week (P < 0.001), respectively. The active leisure and active travel among urban children decreased by 3.5 MET-hrs/week (P = 0.013) and 3.0 MET-hrs/week (P = 0.008), respectively, whereas those among rural children remained stable. The domestic physical activity among rural children showed an upward trend (P < 0.001), whereas that among urban children remained stable. See Figure 2B.
Region The total physical activity among children residing in the south was higher than that residing in the north as a whole (P = 0.002). Similar results were observed for in-school physical activity (P < 0.001), active travel (P = 0.001), and domestic physical activity (P < 0.001). From 2004 to 2015, the total physical activity among the south group decreased from 45.3 ± 2.2 MET-hrs/week to 39.4 ± 2.0 MET-hrs/week (P = 0.002), whereas that among the north group remained stable. Over the 11 years, the in-school physical activity among the north and south groups decreased by 4.7 MET-hrs/week (P < 0.001) and 4.8 MET-hrs/week (P < 0.001), respectively, and similar results were observed in domestic physical activity (P < 0.024). See Figure 2C.
This study fills in the gap of previous studies by exploring the trends in four domains of physical activity among Chinese children. Regardless of gender, age, urbanization level, residential area, or region, the in-school physical activity of Chinese children showed a downward trend over the 11 years. Similarly, a systematic review of the global trends in physical activity concludes that the physical activity among children showed a downward trend over the 10 years before and after the beginning of the twenty-first century, mainly due to a decrease in in-school physical activity[5]. Our study found that from 2004 to 2015, the active leisure and active travel among rural children remained stable, whereas those among urban children showed a downward trend. Regarding domestic physical activity, an upward trend was observed among children of male gender, aged 12–17 years, and residing in area with low urbanization level and rural areas.
In this study, we found that the trends in total physical activity differed by levels of urbanization, residential area, and region. Specifically, we found a stable trend for children residing in area with low urbanization level and children from the north, but a downward trend for those residing in area with medium to high urbanization levels and children from the south was observed. Furthermore, the total physical activity among urban children decreased more substantially than that among rural children. Our findings imply that social and economic changes that were observed as a result of urbanization may have negative impact on physical activity among Chinese children, and those residing in area with medium to high levels of urbanization, urban areas, and the south are more prone to be affected. Similarly, a comprehensive study of the trends in physical activity among school-aged children in South Africa shows that for the South African countries undergoing rapid social and economic development, urbanization is a major factor that contributed to the decrease in the physical activity among children aged 5–17 years in the past 30 years[6]. As such, intervention measures to promote physical activity among children should be tailored to local conditions[7]. In the new era of rapid urbanization in China, it is important to continuously monitor the changes in physical activities among children and implement tailored physical activity promotion strategies.
There are several limitations to note when interpreting the results of this study. First, the CHNS project was not a nationally representative survey, but findings of previous studies using CHNS data are consistent with the results of the Chinese National Nutrition and Health Survey[8, 9]. The data from all survey years were treated as cross-sectional data. Second, the measures of physical activity are based on self-report, raising the potential for recall bias, and the physical activity questionnaire was developed based on the US Surveys without formal reliability and validity testing that may not be appropriate for Chinese children. Third, the physical activity survey in the CHNS project does not cover specific types of activities, such as rope skipping, skating, hiking, and weightlifting, although it covers the vast majority of the activities performed by Chinese children on a daily basis. Finally, the metabolic equivalent coding system for physical activity adapted in this study was derived from the United States. Its applicability to Chinese children still needs to be confirmed.
In conclusion, from 2004 to 2015, the total physical activity of children aged 6–17 years in China showed a downward trend, which was mainly contributed by the decrease in in-school physical activity. Regarding geographical differences, a significant decrease in total physical activity was observed among children residing in medium and high urbanization communities, the south and urban areas, which warrants effective physical activity intervention measures to be formulated and implemented in these areas. To create a supportive environment for physical activity, more efforts should be put to promote physical activity in school and reduce the impact of the social and economic changes brought by urbanization.
We would like to thank all the project staff, participants and their parents, teachers, and institutions from the CHNS project. We thank the National Institute for Nutrition and Health, Chinese Center for Disease Control and Prevention.
Recent Trends in Physical Activity among Chinese Children Based on Their Demographic and Social Characteristics
doi: 10.3967/bes2021.054
Funds:
This study was supported by National Scientific and Technological Basic Resources Investigation Program “Research and application of nutrition and health system for children aged 0–18 years in China” [2017FY101100]; The China Health and Nutrition Survey was funded by the NIH to Carolina Population Center at the University of North Carolina at Chapel Hill [P2C HD050924, T32 HD007168]; research grants from the NIH [R01 HD30880, P30DK056350, R01 HD38700]; and the NIH Fogarty grant [D43 TW009077] for their financial support for the CHNS data collection and relative files from 2004 to 2015
- Received Date: 2020-08-09
- Accepted Date: 2020-11-18
-
Key words:
- Physical activity /
- Child /
- China /
- Trends
Abstract: Aimed to explore the trends in physical activity among Chinese children, data of 4,341 children aged 6−17 years who participated in at least one round of “China Health and Nutrition Survey” from 2004 to 2015 were analyzed. Repeated measures mixed models were applied to test the trends in physical activity, which were further analyzed after applying stratification on gender, age, urbanization level, residential area and region. The volume of total physical activity in Chinese children aged 6–17 years showed a downward trend from 2004 to 2015, especially among children residing in medium and high urbanization communities, the south and urban areas of China, so that more efforts need to be put to promote their physical activity.
| Citation: | YANG Xi, LEUNG Alice Waiyi, ZHAI Yi, ZHAO Wen Hua. Recent Trends in Physical Activity among Chinese Children Based on Their Demographic and Social Characteristics[J]. Biomedical and Environmental Sciences, 2021, 34(5): 404-409. doi: 10.3967/bes2021.054

|

 Quick Links
 DownLoad:
