

-
Childhood obesity is known to have adverse consequences on short- and long-term health, including adult physical morbidity and premature mortality[1]. Globally, the incidence of obesity among children increased more than tenfold from 1975 to 2016. By 2016, more than 300 million children and adolescents worldwide were overweight or obese[2]. In China, childhood obesity has been a significant public health concern[3]. According to World Health Organization (WHO) standards, the prevalence of overweight among children and adolescents in China rose from 1.9% in 1991 to 10.8% in 2015, and that of obesity rose from 5.4% in 1991 to 16.2% in 2015[4]. Sedentary lifestyles are the leading causes of the rising trend in childhood obesity and shorter life expectancy[5]. Emerging evidence suggests that sedentary behaviors are trending upward in younger children, with a negative impact on the physical, psychological, social, and cognitive health of children[6,7].
Current national and international guidelines consistently recommend that accumulated screen time for children should be restricted to less than 2 hours per day[8-11]. A more stringent recommendation for school-aged children—less than one hour per day—is proposed in the Healthy China Action Plan (2019–2030)[12]. With accelerated urbanization and rapid socio-economic growth, there have been substantial lifestyle changes among the Chinese population[13]. Children are considered a vulnerable group to such changes, in which the shift to sedentary lifestyles is largely attributed to modernization. Emerging epidemiological evidence suggests that urbanization is linked to obesity and increased risk of cardiovascular disease through encouraging unhealthy lifestyle changes, such as sedentary behaviors[14-16]. Furthermore, Chinese used to place a very high value on education[17], which might be conducive to a sedentary lifestyle among children. Data from the China Health and Nutrition Survey (CHNS) indicates that children, regardless of gender and age, spent significantly more time in sedentary behaviors from 1997 to 2006[18]. Yet, there remains a huge gap in tracking and monitoring sedentary behaviors among Chinese children and youth. In particular, little is known about recent trends in sedentary behaviors among Chinese children, and few studies have examined such trends according to demographic and social characteristics[19-21]. Enhancing children’s health helps to lay a positive foundation for future population health. Therefore, there is a pressing need to examine the trends in sedentary behaviors in the midst of rapid socio-economic changes in China. Such findings can provide important information for policy actions to address obesity. As China is a typical example of developing countries, such findings could provide insight for combating the global sedentary behavior trend among children.
Using data from the CHNS, the objectives of this study are (1) to examine the trends in sedentary time among Chinese children aged 6 to 17 years from 2004 to 2015, according to demographic and social characteristics, and (2) to assess the changes in sedentary levels to understand the national trends of recommended sedentary time guidelines.
-
CHNS is a nationwide, ongoing cohort study jointly run by the National Institute for Nutrition and Health (Chinese Center for Disease Control and Prevention, China CDC) and the Carolina Population Center at the University of North Carolina (Chapel Hill, NC, US). This project commenced in 1989, collecting data from eight provinces, including Guangxi, Guizhou, Henan, Hunan, Hubei, Jiangsu, Liaoning, and Shandong. In 1997, Heilongjiang replaced Liaoning, which was later re-included in 2000. After adding three megacities (Beijing, Chongqing, and Shanghai) in 2011, the project comprised a total of 12 provinces and cities. The sampling method involved a multistage, random cluster process. Briefly, in the first stage, two cities (one provincial capital and one middle-income, prefecture-level city) and four counties per province (one high-income, two middle-income, and one low-income) were randomly selected. In the second stage, two urban and two suburban communities per city, one community in the capital city, and three villages per county were randomly selected. In the final stage, 20 households per community were randomly selected, with all members of the households included in the study. The hierarchical data structure of the CHNS project encompassed substantial variability in geography, economic development, and public resources. The detailed survey design has been previously published in detail[22]. Ethical approval has been obtained from the medical ethics committees of the National Institute for Nutrition and Health, of the China CDC, and the hospital ethics committee of the University of North Carolina.
In 2004, CHNS incorporated surveillance of sedentary behaviors. Thereafter, four more rounds of follow-up surveys were conducted in 2006, 2009, 2011, and 2015. The five survey rounds from 2004 to 2015 provided valuable data for assessing the current trends in sedentary behaviors among Chinese children. In this study, we included subjects who participated in at least one of the five rounds of follow-up surveys.
-
Sedentary behaviors were assessed by a questionnaire adapted from the US Health Interview Surveys developed by Professor Barry Popkin of the University of North Carolina and Professor Barbara Ainsworth of Arizona State University[23]. The questionnaire asked children to report the average daily time spent in educational sedentary behaviors, screen-based sedentary behaviors, and Arts & Play on weekdays and weekends, as well the average daily time spent in passive travel before and after school. Therefore, sedentary behaviors were classified into four domains: first, educational sedentary behaviors that including extracurricular reading, writing, and painting; second, screen-based sedentary behaviors that including TV-based activities (watching TV, videos, and video disks), game-based activities (playing computer games, smartphone games, and game consoles) and Internet-based activities (chatting online, watching programs online or on smartphones); third, passive travel as passengers commuting on bicycles, buses, subways, cars, taxis, motorcycles, etc.; and fourth, Arts & Play that including play with chess, toy cars, puppets, etc. The questionnaires were completed by the interviewers.
The outcome measures included domain-specific sedentary time (h/week), total sedentary time (h/week), and sedentary levels (%). The weekly time spent in educational sedentary behaviors, screen-based sedentary behaviors, and Arts & Play was calculated by the following formula: average daily time spent in each domain on weekdays x 5 + average daily time spent in that domain on weekends x 2. The weekly time spent in passive travel was calculated by multiplying the daily time spent in passive travel by 7. Subsequently, the total sedentary time was obtained by summing the weekly time spent in all four domains of sedentary behavior. Sedentary levels were estimated by stratifying daily screen time into three ranks using the international recommendation of less than 2 hours screen time per day as a cut-off point[8, 21, 24, 25]: low (< 2 h), moderate (2–4 h), and high (≥ 4 h). The percentage of children at each level was included in the analysis.
-
Demographic and social characteristics included age, gender, ethnicity, annual family income, paternal and maternal education levels, urbanicity index, residential area (urban/rural), and region (north/south). Age was rounded down to the latest birthday. As children generally enter secondary school after 12 years old, age was stratified into two groups (6–11 and 12–17 years). Paternal and maternal education were stratified into three groups: low (primary or below), middle (secondary completed), and high (college or higher) education levels. The urbanicity index was obtained through a comprehensive evaluation of 12 dimensions of urbanization for each community, including population density, economic activity, traditional markets, modern markets, transportation infrastructure, sanitation, communication, housing, education, diversity, health infrastructure, and social services[26]. A score from 0 to 10 was assigned to each dimension, based on data provided from official records or local area administrators. The urbanicity index has demonstrated good internal consistency (Cronbach’s alpha > 0.85), test-retest reliability (r > 0.90), fair to good criterion-related validity (kappa coefficient = 0.21–0.53, Spearman’s rank correlation coefficient = 0.75–0.78), and good construct validity[26]. In this study, the urbanicity index for each survey year was compiled. According to the urbanicity index ranking in the top 1/3, 1/3 < to < 2/3, and the bottom 1/3, urbanization of community was stratified into three groups, representing low, medium, and high levels of urbanization.
-
All data analyses were performed using SAS 9.4 (SAS Institute Inc., Cary, NC, USA). We first deleted all observations with more than 5% missing values, time spent in sedentary behaviors > 70 h/week, or time in physical activity > 112 h/week. For those with less than 5% of the data missing, the random discrete distribution method was applied to impute the missing values. Statistical significance was set at P < 0.05. Demographic data were presented as frequency (percentage). The Cochran–Armitage trend test was performed to analyze the trends according to gender, age, residential area, and region across all survey years. For ethnicity, the Fisher’s exact test was performed as the expected count was less than 5. For ordinal multilevel data (i.e., urbanization level, and paternal and maternal education levels), the Mantel–Haenszel chi-square test was performed.
Repeated-measures mixed-effects models were conducted using total sedentary time and domain-specific sedentary time as dependent variables; survey years were treated as an independently categorical variable, while adjusting for all demographic and social characteristics and the random effect of community. The adjusted means ± SD of the dependent variables were reported. The trends were examined and the differences across survey years were compared using the Bonferroni method. The trends were further analyzed after applying stratification on gender, age, urbanization level, residential area, and region. The repeated-measures mixed-effects model takes into account the internal connection of the observations in different survey years, as well as the aggregation of the observations on the community level. The hypothesis test revealed that the -2_log-likelihood value fitted by the random slope model was significantly smaller than the random intercept model (P < 0.01), implying that the random slope model was superior to the random intercept model. For this reason, the random slope model was adopted. Additionally, we employed a random-effect model, adjusting for the influence of other factors and the random effect of community, to examine the differences in sedentary outcomes by demographic and social characteristics across all survey years.
To examine the trends in sedentary levels across all survey years, the random-effects ordinal regression model was conducted, using the Newton–Raphson Ridge method to optimize parameter estimation, controlling for the random effect of communities and adjusting for age, gender, ethnicity, paternal and maternal education levels, annual family income, urbanicity index, residential area, and region. As the dependent variable was stratified into three ordered categories, the cumulative logit link function was used, and the multinomial distribution function fitting polynomial probability distribution was selected to develop the random-effects ordinal regression model. Furthermore, considering the non-independence of repeated measurement and the errors distributed at the community level, both fixed-effect and random-effect parameters were applied[27].
-
This study comprised 4,341 Chinese children and a total of 6,936 observations. The majority of the children (59.0%) participated in the survey once, whereas 26.1%, 11.2%, 3.5%, and 0.2% of them participated in the survey twice, three times, four times, and five times, respectively. The mean age of the children was 11.0 ± 3.3 years. Table 1 shows a summary of the participant characteristics in the five survey years. There was no significant difference in the gender proportions across surveys. However, the proportion of children in the 6–11 year group (P < 0.001), the high-family-income group (P < 0.001), and the south group (P = 0.030) significantly increased over time.
Variables CHNS year Statistics (P-value) 2004 2006 2009 2011 2015 N 1,593 1,267 1,141 1,544 1,391 Gender (%)a Boys 854 (53.6) 677 (53.4) 644 (56.4) 791 (51.2) 728 (52.3) Z = −0.304 (Unilateral P = 0.381) Girls 739 (46.4) 590 (46.6) 497 (43.6) 753 (48.8) 663 (47.7) Age (n, %)a 6–11 years 838 (52.6) 788 (62.2) 743 (65.1) 1,027 (66.5) 1,057 (76.0) Z = 3.38 (Unilateral P < 0.001) 12–17 years 755 (47.4) 479 (37.8) 398 (34.9) 517 (33.5) 334 (24.0) Ethnicity (n, %)b Han 1,374 (86.3) 1,065 (84.1) 957 (83.9) 1,353 (87.6) 1,212 (87.1) Z = −0.458 (Unilateral P = 0.323) Minority 219 (13.7) 202 (15.9) 182 (16.0) 189 (12.3) 169 (12.2) Unknown 0 0 2 (0.1) 2 (0.1) 10 (0.7) Family income level (n , %)a Low (< 50,000 Yuan) 1,584 (99.4) 1,249 (98.6) 1,082 (94.8) 1,346 (87.2) 969 (69.7) Z = −7.443 (Unilateral P < 0.001) High (> 50,000 Yuan) 9 (0.6) 18 (1.4) 59 (5.2) 198 (12.8) 422 (30.3) Paternal education levels (n, %)c Low (primary or below) 204 (12.8) 198 (15.6) 153 (13.4) 225 (14.6) 195 (14.0) Χ2 = 0.000 (P = 0.995) Middle (secondary completed) 1,203 (75.5) 938 (74.0) 871 (76.3) 1,122 (72.6) 1,041 (74.8) High (college or higher) 186 (11.7) 131 (10.4) 117 (10.3) 197 (12.8) 155 (11.2) Maternal education levels (n, %)c Low (primary or below) 307 (19.3) 271 (21.4) 225 (19.7) 315 (20.4) 283 (20.4) Χ2 = 0.002 (P = 0.966) Middle (secondary completed) 1,102 (69.1) 870 (68.7) 805 (70.6) 1,040 (67.4) 960 (69.0) High (college or higher) 184 (11.6) 126 (9.9) 111 (9.7) 189 (12.2) 148 (10.6) Urbanization level of communityc Low 534 (33.5) 416 (32.8) 380 (33.3) 513 (33.2) 460 (33.1) Χ2 = 0.01 (P = 0.911) Middle 533 (33.5) 417 (32.9) 376 (33.0) 509 (33.0) 451 (32.4) High 526 (33.0) 434 (34.3) 385 (33.7) 522 (33.8) 480 (34.5) Residential areas (n, %)a Urban 444 (27.9) 370 (29.2) 308 (27.0) 583 (37.8) 486 (34.9) Z = 1.540 (Unilateral P = 0.062) Rural 1,149 (72.1) 897 (70.8) 833 (73.0) 961 (62.2) 905 (65.1) Region (n, %)a North 679 (42.6) 500 (39.5) 402 (35.2) 494 (32.0) 446 (32.1) Z = −1.88 (Unilateral P = 0.03) South 914 (57.4) 767 (60.5) 739 (64.8) 1,050 (68.0) 945 (67.9) Sedentary behaviors (h/week)d 23.9 ± 0.6 26.9 ± 0.6 27.0 ± 0.6 27.9 ± 0.6 25.7 ± 0.6 F = 15.17 (P < 0.001) Educational sedentary behaviors 12.9 ± 0.4 13.4 ± 0.4 12.7 ± 0.4 13.1 ± 0.4 12.3 ± 0.4 F = 2.19 (P = 0.068) Screen-based sedentary behaviors 9.9 ± 0.4 12.4 ± 0.5 13.4 ± 0.5 13.6 ± 0.4 12.8 ± 0.4 F = 20.37 (P < 0.001) TV-based activities 9.2 ± 0.4 10.2 ± 0.4 10.3 ± 0.4 9.6 ± 0.3 8.4 ± 0.3 F = 8.23 (P < 0.001) Game-based activities 0.6 ± 0.1 1.2 ± 0.1 1.3 ± 0.1 1.7 ± 0.1 1.9 ± 0.1 F = 25.37 (P < 0.001) Internet-based activities 0.2 ± 0.2 1.2 ± 0.2 2.1 ± 0.2 2.8 ± 0.2 2.7 ± 0.2 F = 50.69 (P < 0.001) Passive travel 1.5 ± 0.3 1.2 ± 0.3 1.4 ± 0.4 1.8 ± 0.3 2.8 ± 0.3 F = 5.45 (P < 0.001) Arts & Play 1.0 ± 0.1 1.1 ± 0.1 1.1 ± 0.1 1.2 ± 0.1 0.6 ± 0.1 F = 8.83 (P < 0.001) Sedentary behaviors (min/day)d Weekday 172.6 ± 4.9 194.4 ± 5.1 193.2 ± 5.2 197.5 ± 4.7 199.0 ± 4.6 F = 9.18 (P < 0.001) Weekend 286.7 ± 8.0 320.7 ± 8.3 327.9 ± 8.4 343.2 ± 7.6 273.2 ± 7.5 F = 26.23 (P < 0.001) Note. aUsing Cochran–Armitage trend test; bUsing Fisher’s exact test; cUsing Mantel–Haenszel chi-square test; dUsing the repeated-measures mixed models to test the trends after adjusting other demographic and social characteristics. Statistics index P < 0.05 is shown in bold. CHNS: China Health and Nutrition Survey. Table 1. Distribution and trends of demographic and social characteristics and sedentary behaviors among Chinese children aged 6–17 years old from 2004 to 2015
-
As shown in Table 1, the total sedentary time among children aged 6–17 years increased by 7.5%, from 23.9 ± 0.6 h/week in 2004 to 25.7 ± 0.6 h/week in 2015 (P < 0.001). Educational and screen-based sedentary behaviors were the two major types of sedentary behaviors. Over the 11 years, time spent in educational sedentary behaviors remained stable, while time spent in Arts & Play fell by 40.0% (0.4 h/week, P < 0.001), and time spent in screen-based sedentary behaviors and passive travel increased by 13.5 times (2.9 h/week, P < 0.001) and 3.2 times (1.3 h/week) (P < 0.001), respectively. Among screen-based sedentary behaviors, time spent in Internet-based and game-based activities increased by 2.5 h/week (P < 0.001) and 1.3 h/week (P < 0.001), respectively, with a substantial increase between 2004 and 2006 (P < 0.001). By contrast, time spent in TV-based activities fell by 8.7% (P < 0.001), with a substantial decline between 2009 and 2015 (P < 0.001). From 2004 to 2015, total sedentary time on weekdays increased by 15.3% (26.4 min/day, P < 0.001). Total sedentary time on weekends increased by 19.7% (56.5 min/day, P < 0.001) from 2004 to 2011 and decreased by 25.6% (70.0 min/day, P < 0.001) from 2011 to 2015.
-
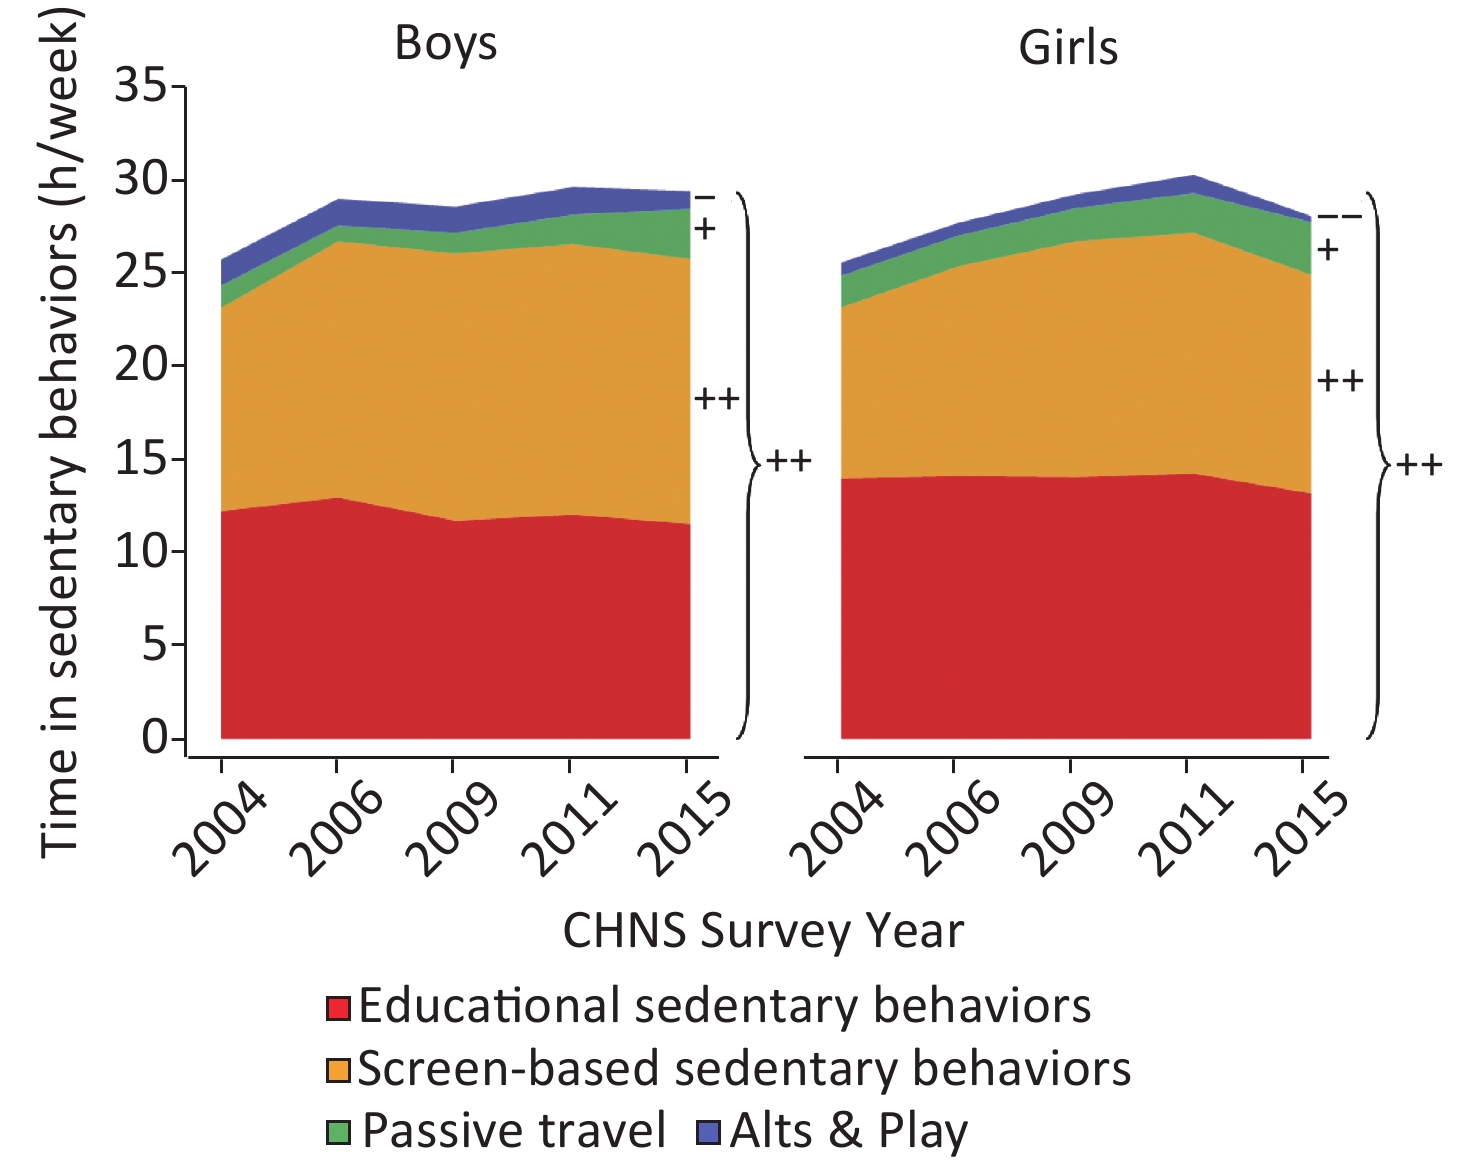
Across all survey years, there was no evidence of a gender difference in total sedentary time. However, boys reported spending more time than girls in screen-based sedentary behaviors and Arts & Play (P ≤ 0.038). By contrast, girls reported spending more time than boys in educational sedentary behaviors (P ≤ 0.049). Among the four domains of sedentary behavior, screen-based sedentary behaviors contributed to the largest proportion of the total sedentary time among boys, while educational sedentary behaviors contributed to the largest proportion of the total sedentary time among girls. From 2004 to 2015, the total sedentary time among boys and girls increased by 2.2 h/week (P < 0.001) and 1.3 h/week (P < 0.001), respectively. The total sedentary time among boys increased substantially until 2006 and leveled off thereafter, while among girls it decreased significantly after reaching a peak in 2011. Over the 11 years, the domain-specific trends were consistent between boys and girls. Specifically, the time spent in screen-based sedentary behaviors among boys and girls increased by 3.3 h/week (P < 0.001) and 2.5 h/week (P < 0.001), respectively; the time spent in passive travel among boys and girls increased by 1.5 h/week (P < 0.001) and 1.1 h/week (P = 0.023), respectively; and the time spent in Arts & Play among boys and girls both decreased by 0.4 h/week (P = 0.004, P < 0.001) (Figure 1).
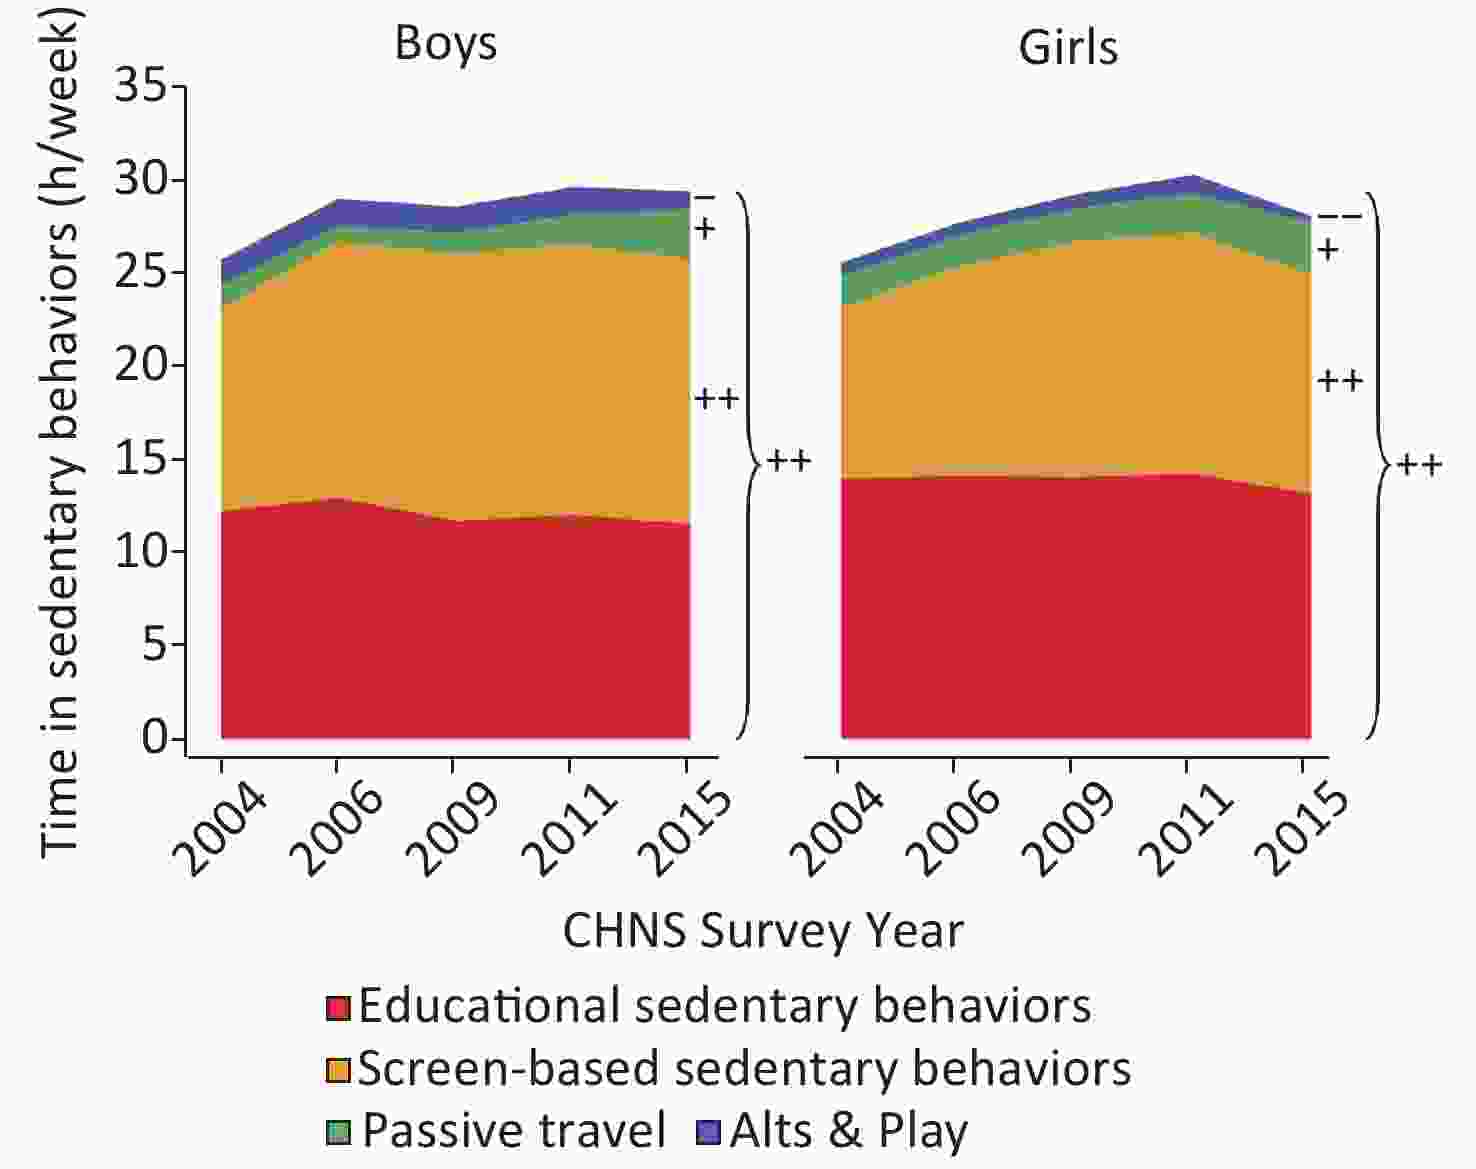
Figure 1. Trends of time spent in sedentary behaviors among Chinese boys and girls aged 6–17 years old, from 2004 to 2015.
-
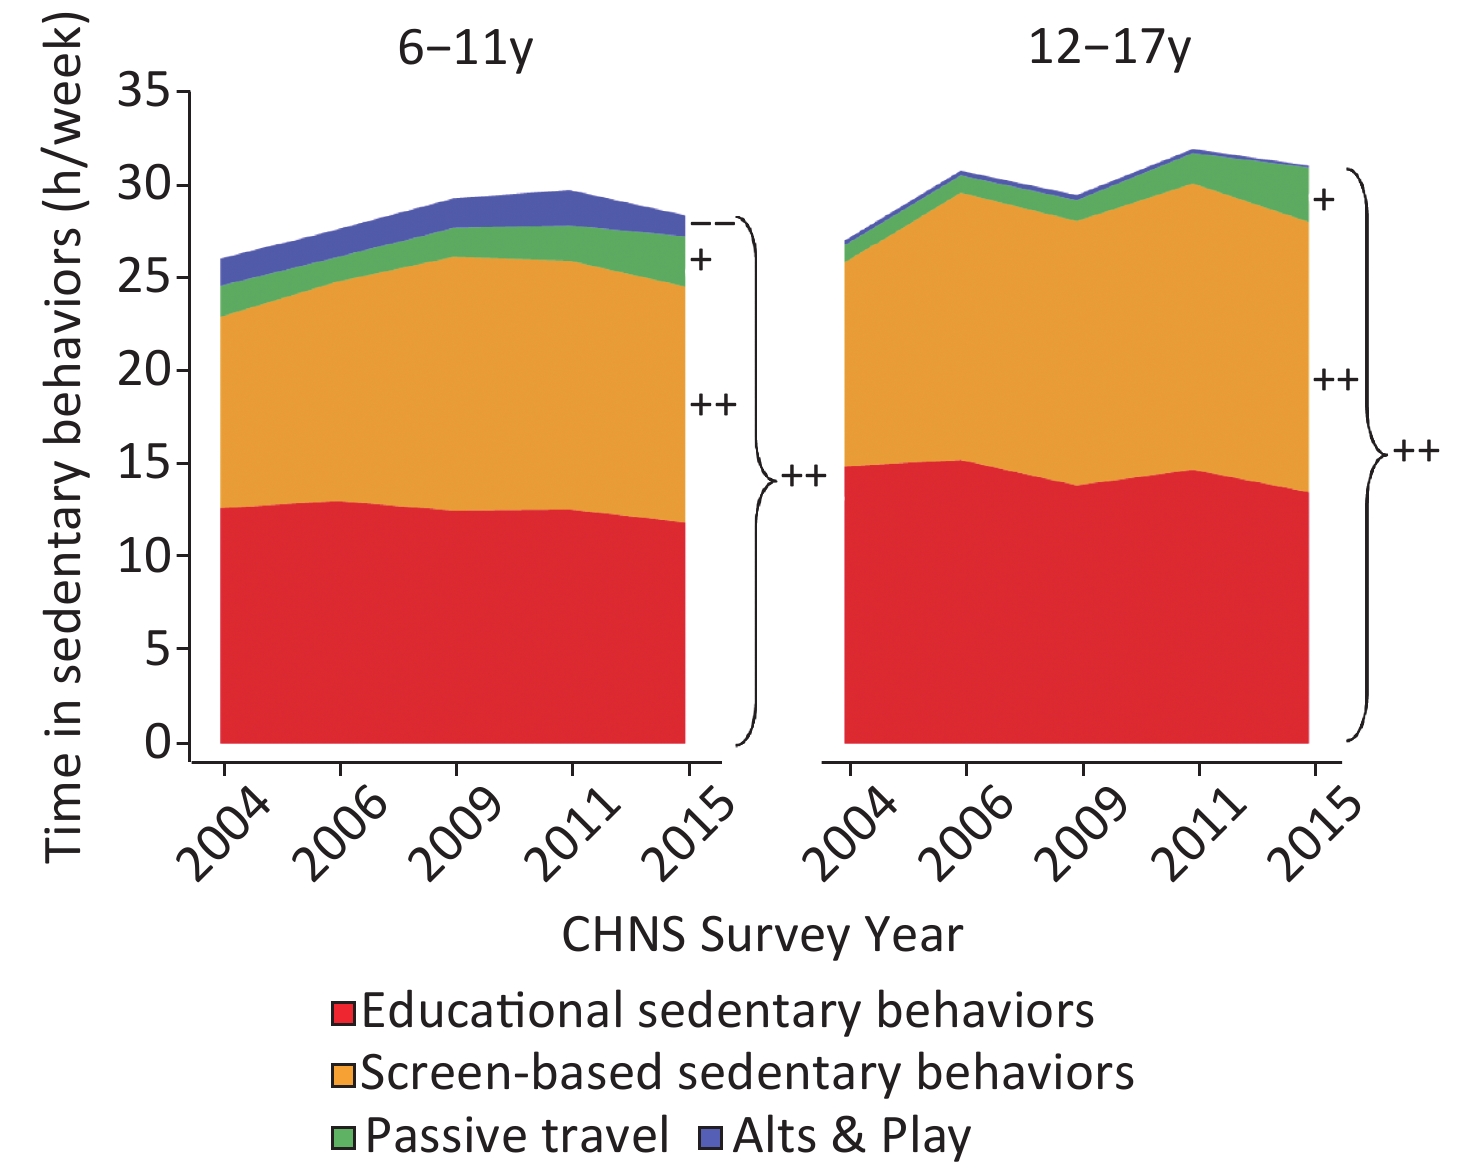
Across all survey years, the total sedentary time among children aged 12–17 years was higher than that among children aged 6–11 years (P < 0.001). A similar result was observed for time spent in educational sedentary behaviors (P ≤ 0.010). However, the time spent in Arts & Play among the 6–11 years age group was higher than that among the 12–17 years age group (P < 0.001). From 2004 to 2015, a statistically significant trend toward increased total sedentary time was observed in both age groups (P < 0.001). In particular, the time spent in screen-based sedentary behaviors among the 6–11 and 12–17 years age groups increased by 3.3 h/week (P < 0.001) and 2.5 h/week (P < 0.001), respectively; the time spent in passive travel increased by 1.5 h/week (P < 0.001) and 1.1 h/week (P < 0.001), respectively. By contrast, a statistically significant trend toward decreased time spent in Arts & Play was observed in the 6–11 years age group only. Among those aged 12–17 years, the contribution of screen time toward total sedentary time rose from 40.4% to 46.8% over the 11 years and became the largest contributor to total sedentary time in 2015 (Figure 2).
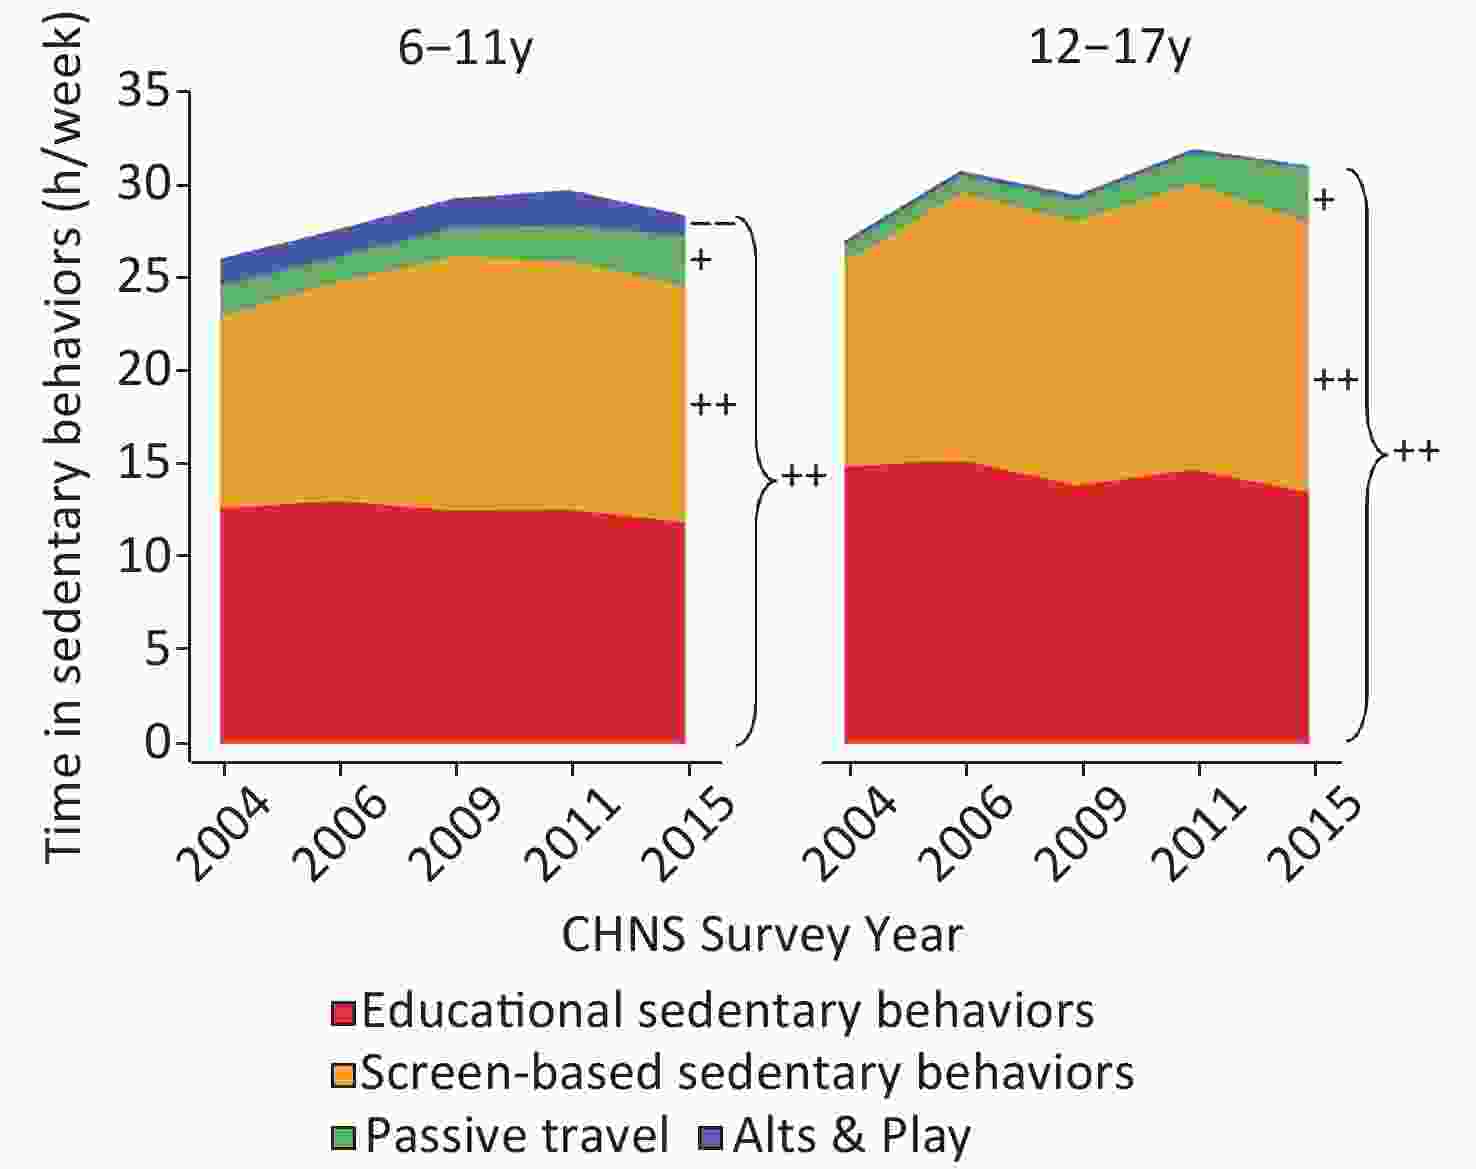
Figure 2. Trends of time spent in sedentary behaviors among Chinese children aged 6–11 and 12–17 years old from 2004 to 2015.
-
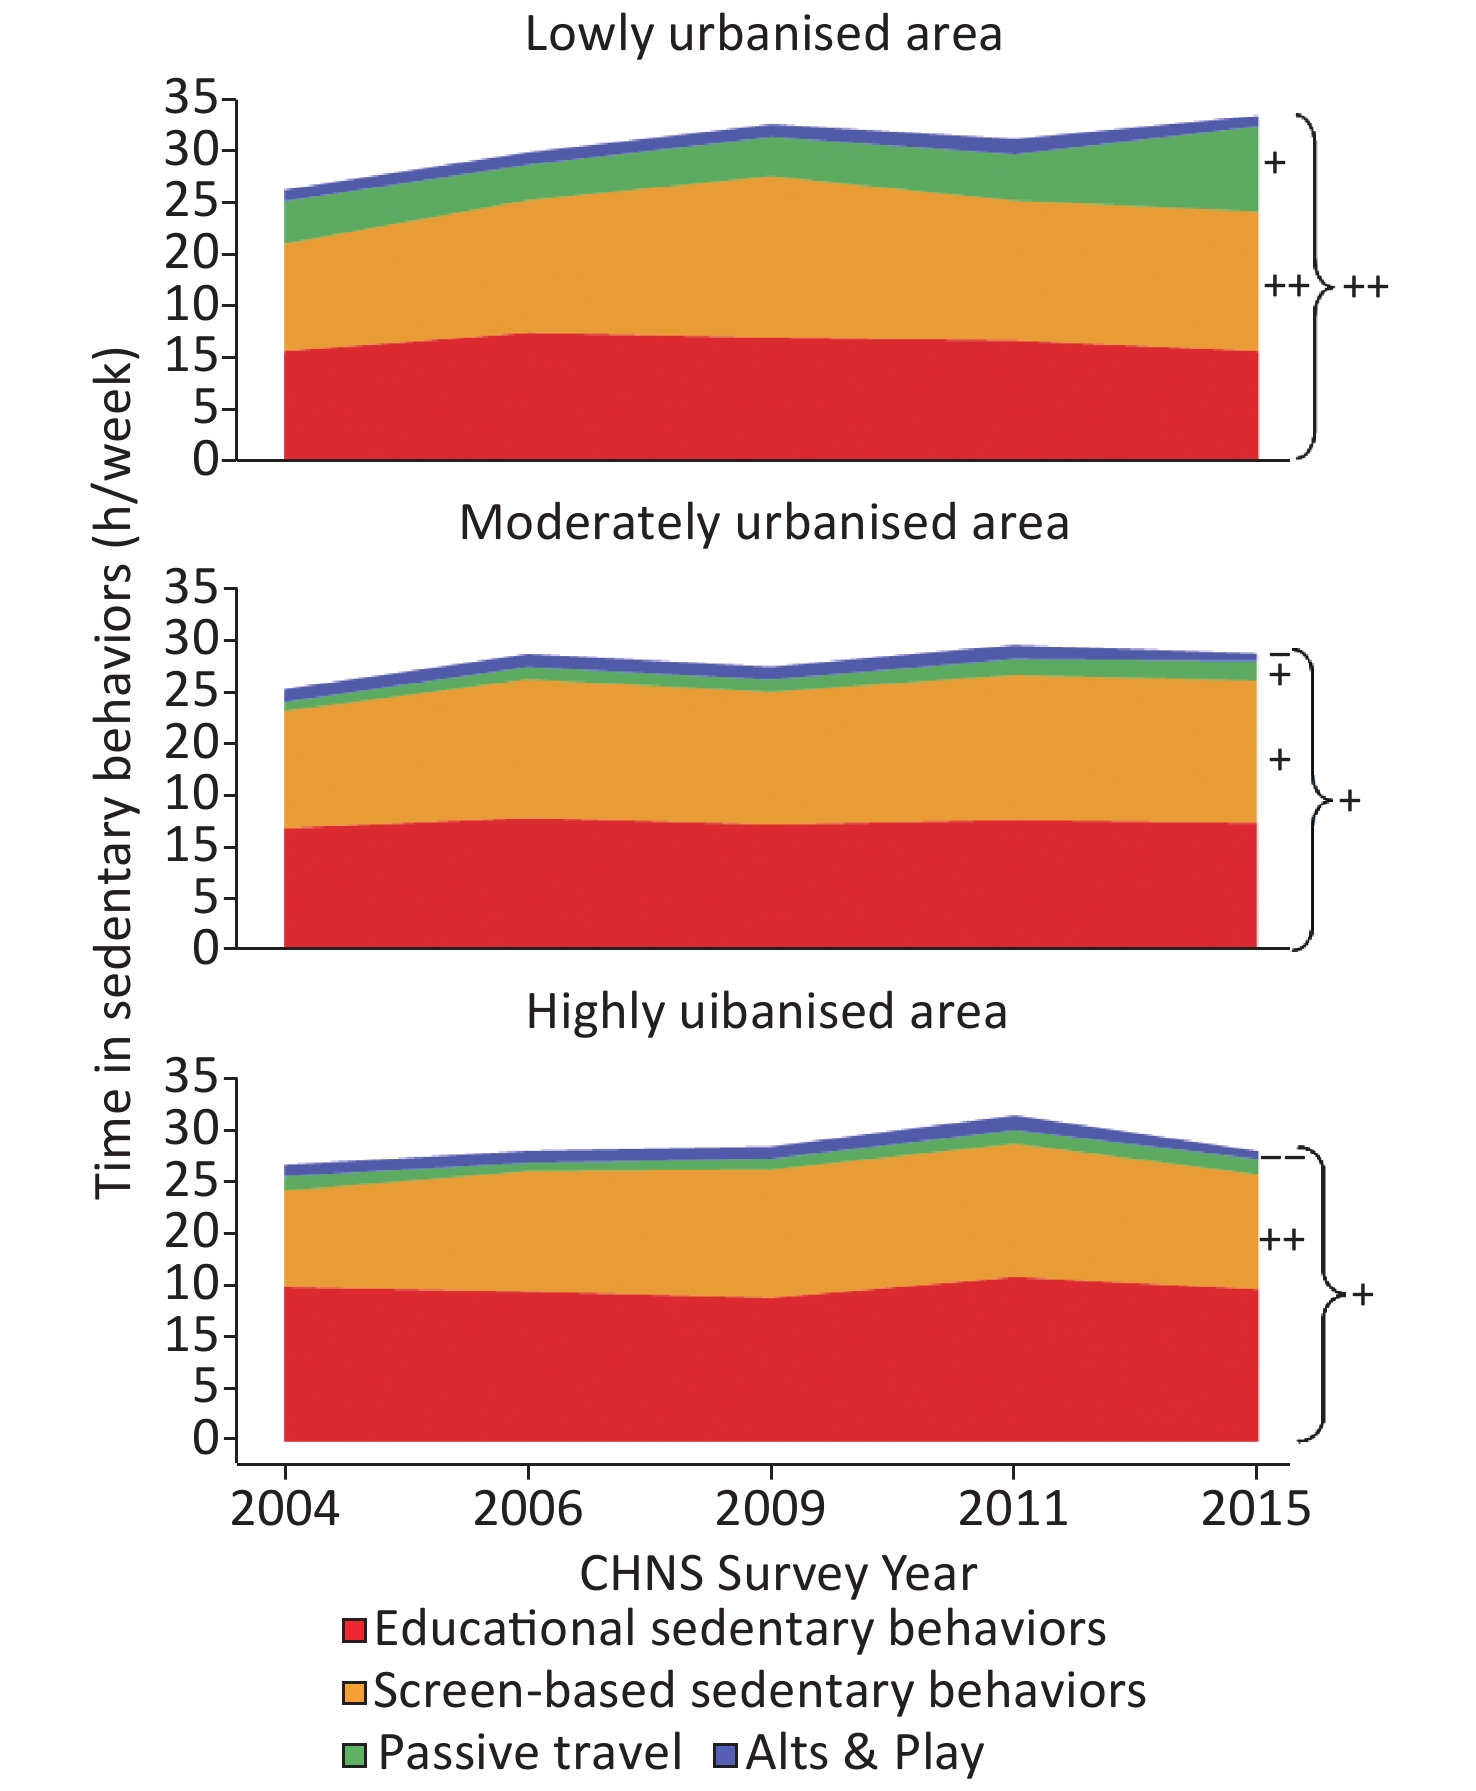
The total sedentary time increased with urbanization (P < 0.001). Across all survey years, the total sedentary time among the high-urbanization group was slightly higher than that among the low urbanization group (P < 0.001). The high-urbanization group reported spending more time in educational sedentary behaviors (P < 0.001) but less time in screen-based sedentary behaviors (P < 0.001) and passive travel (P < 0.001), as compared to the low urbanization group. From 2004 to 2015, the total sedentary time among the low-, medium-, and high-urbanization groups increased by 3.1 h/week (P < 0.001), 2.3 h/week (P = 0.012) and 1.3 h/week (P = 0.042), respectively. Notably, a more prominent increase was observed among the low urbanization group, a rise of 27%. Over the 11 years, the time spent in screen-based sedentary behaviors among the low-, medium-, and high-urbanization groups increased by 3.1 h/week (P < 0.001), 2.4 h/week (P = 0.011) and 1.8 h/week (P < 0.001), respectively. Statistically significant trends toward increased time spent in passive travel were observed among the low- and medium-urbanization groups (P = 0.011, P = 0.032), while statistically significant trends toward decreased time spent in Arts & Play was observed among the medium- and high-urbanization groups (P = 0.029, P < 0.001) (Figure 3).

Figure 3. Trends of time spent in sedentary behaviors among Chinese children aged 6–17 years old residing in the community with different urbanization levels from 2004 to 2015.
-
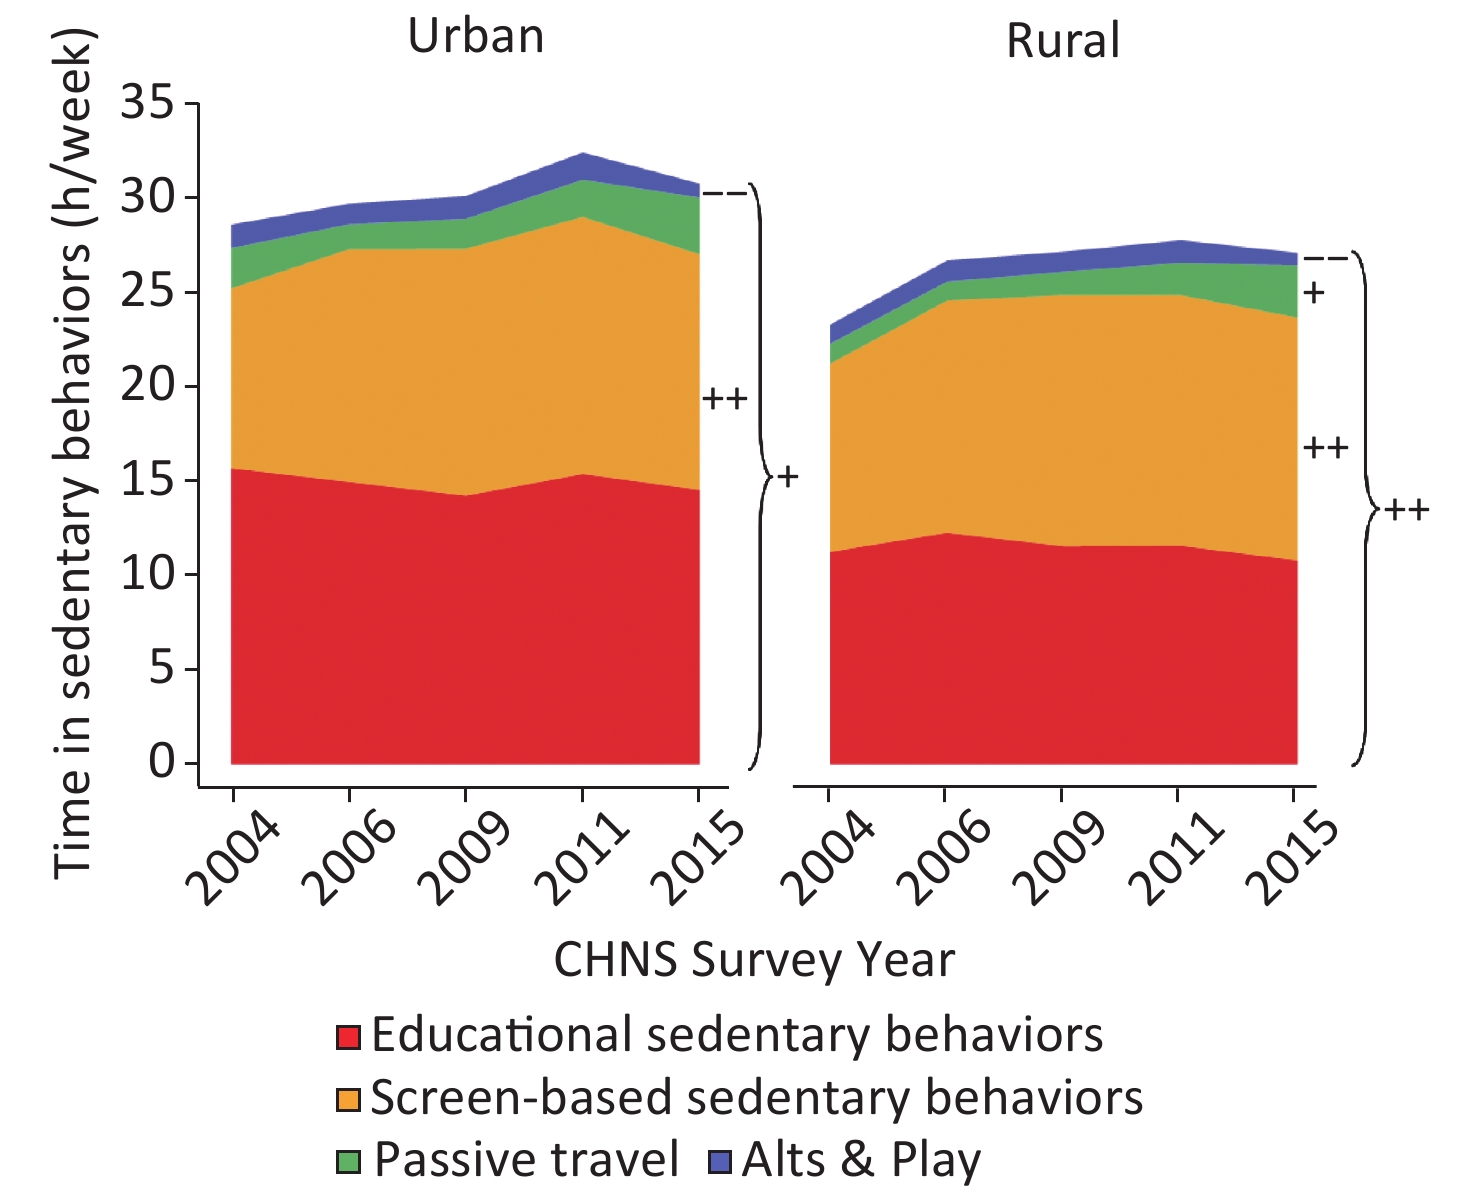
Across all survey years, the total and domain-specific sedentary times among urban children were higher than those among rural children (P ≤ 0.050). From 2004 to 2015, the total sedentary time among urban and rural children increased by 1.3 h/week (P = 0.002) and 2.0 h/week (P < 0.001), respectively. Over the 11 years, the time spent by urban and rural children in screen-based sedentary behaviors both increased by 2.9 h/week (P < 0.001). The time spent by rural children in passive travel increased by 2.6 times (P = 0.005), while that among urban children remained constant. By contrast, the time spent in Arts & Play among urban and rural children decreased by 0.5 h/week (P < 0.001) and 0.3 h/week (P < 0.001), respectively (Figure 4).
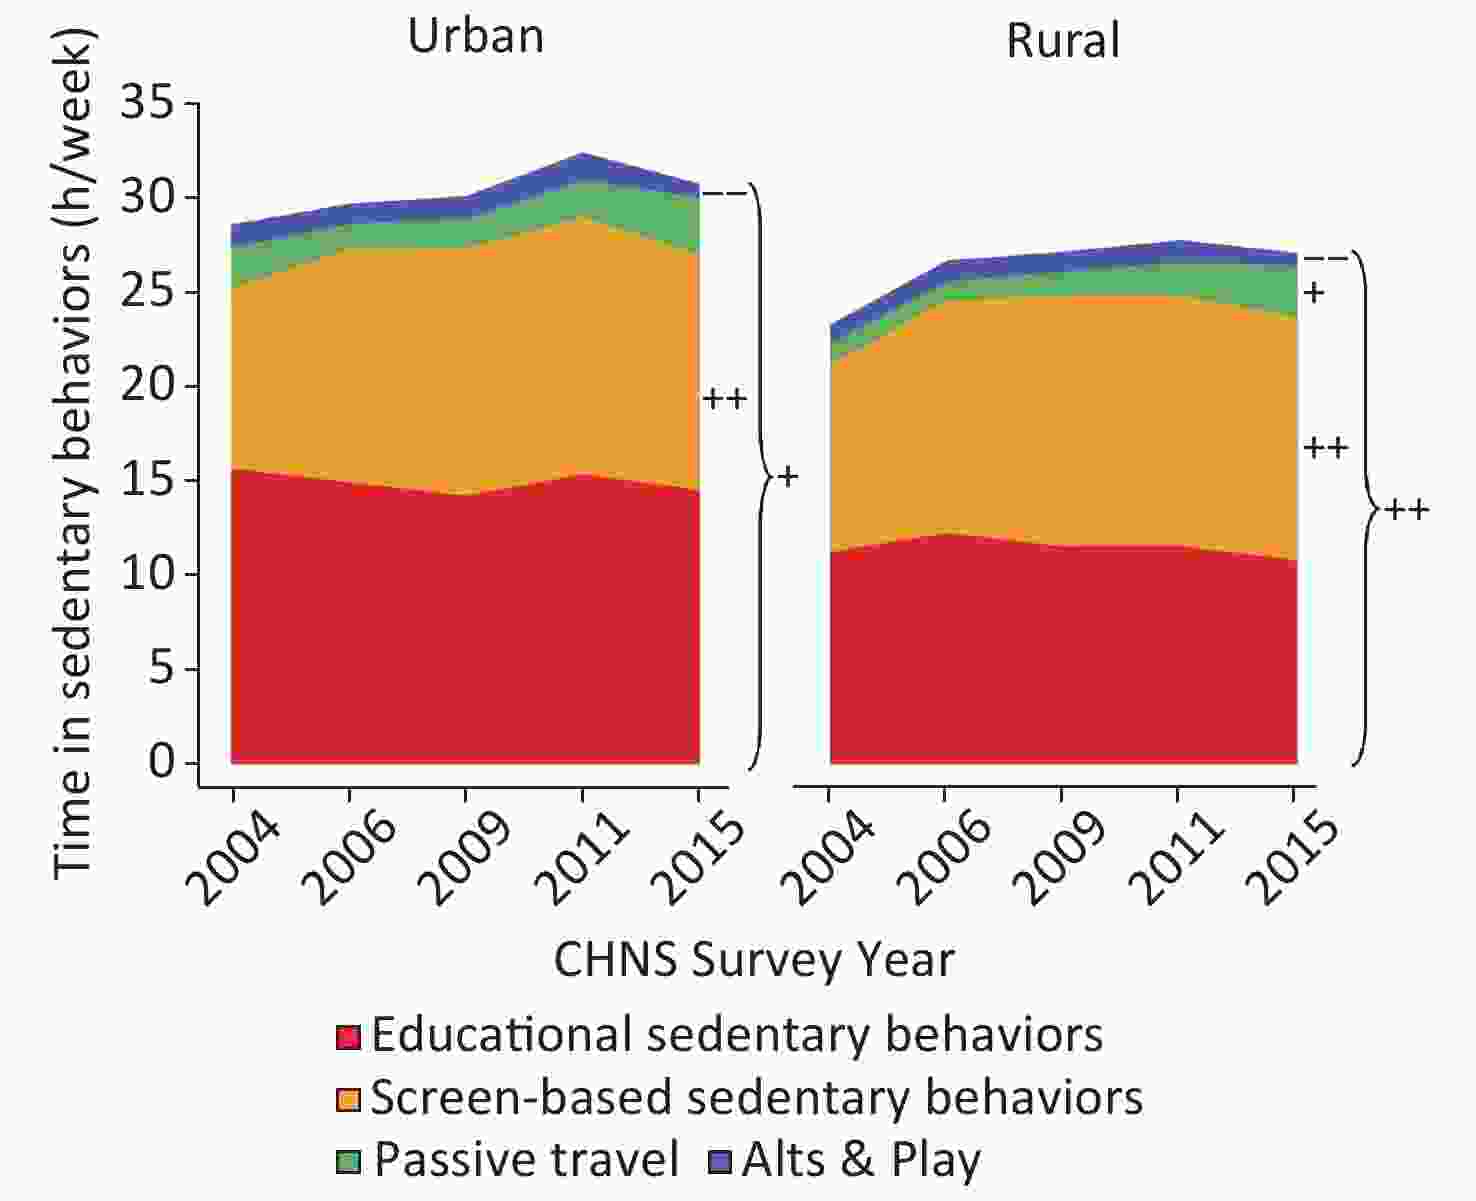
Figure 4. Trends of time spent in sedentary behaviors among Chinese children aged 6–17 years old residing in urban and rural areas of China from 2004 to 2015.
-
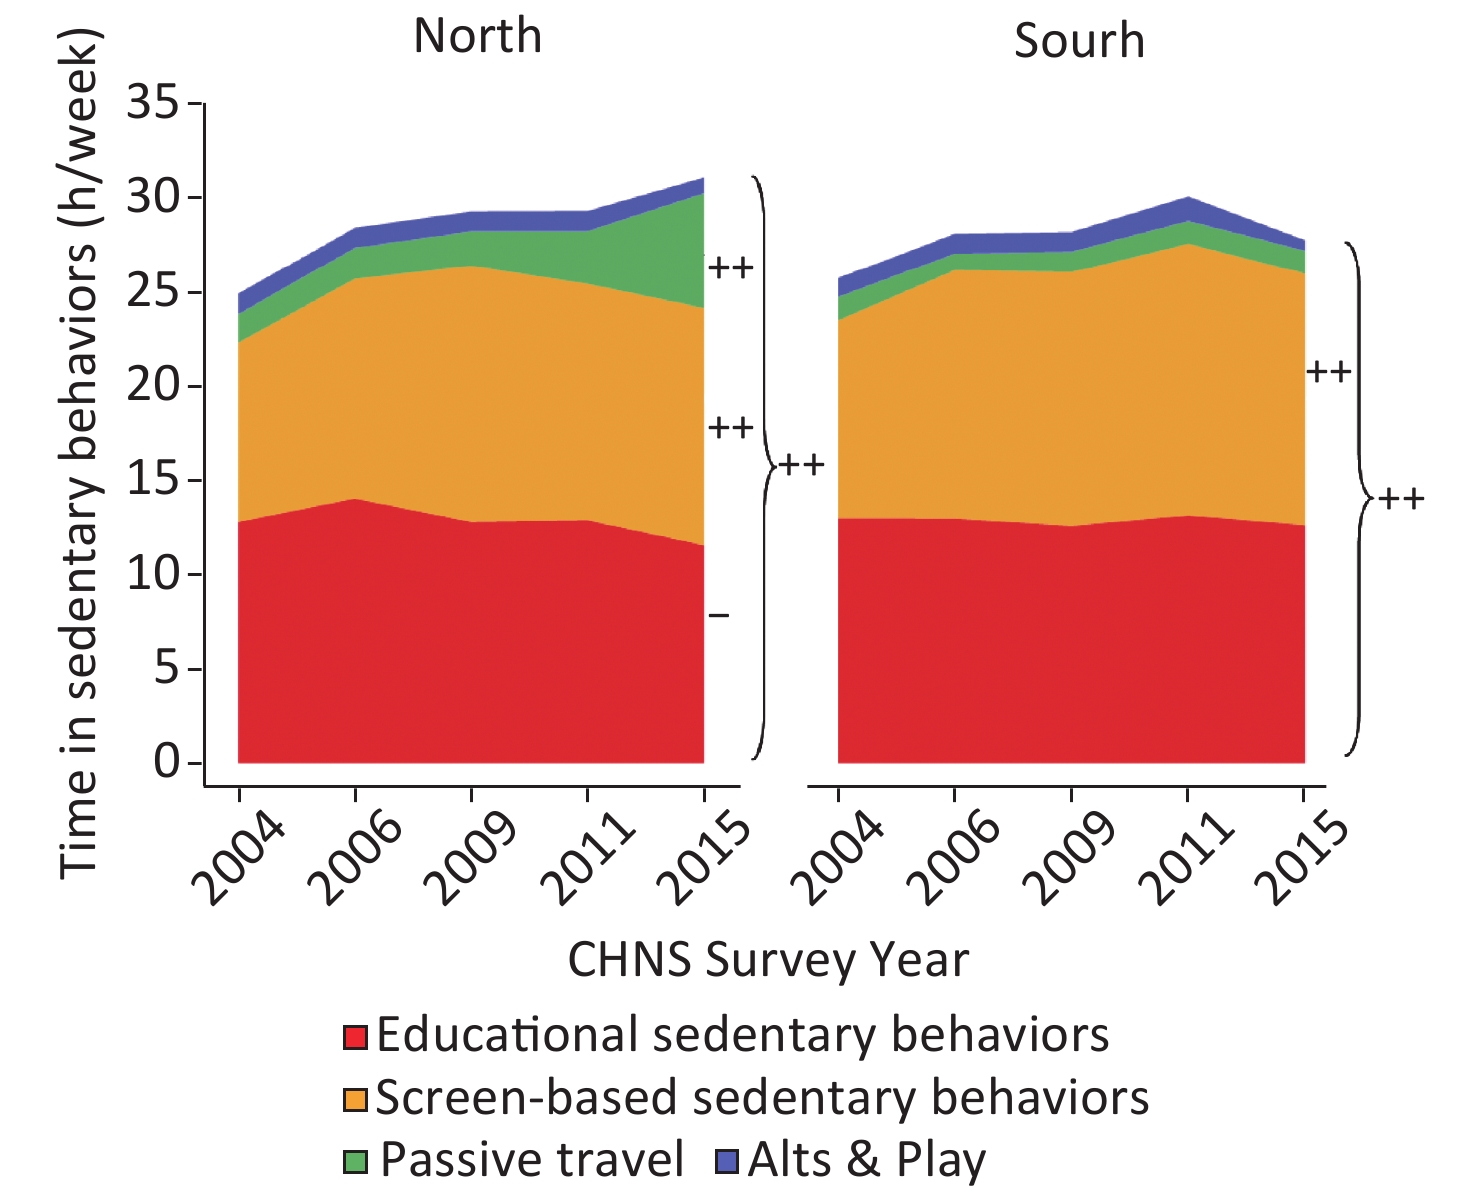
Across all survey years, there was no evidence of a regional difference in total sedentary time. Still, southern children reported spending more time in screen-based sedentary behaviors (P = 0.037) but less time in passive travel (P = 0.042) compared to northern children. From 2004 to 2015, statistically significant trends toward increased total sedentary time and time spent in screen-based sedentary behaviors were observed for both groups (P < 0.001). Specifically, the time spent in screen-based sedentary behaviors among northern and southern children increased by 3.1 h/week (P < 0.001) and 2.9 h/week (P < 0.001), respectively. Over the 11 years, the time spent in passive travel among northern children increased by four times (P < 0.001), while educational sedentary behaviors decreased by 10% (P < 0.001). Surprisingly, the trends in the time spent in passive travel and educational sedentary behaviors remain stable among southern children (Figure 5).
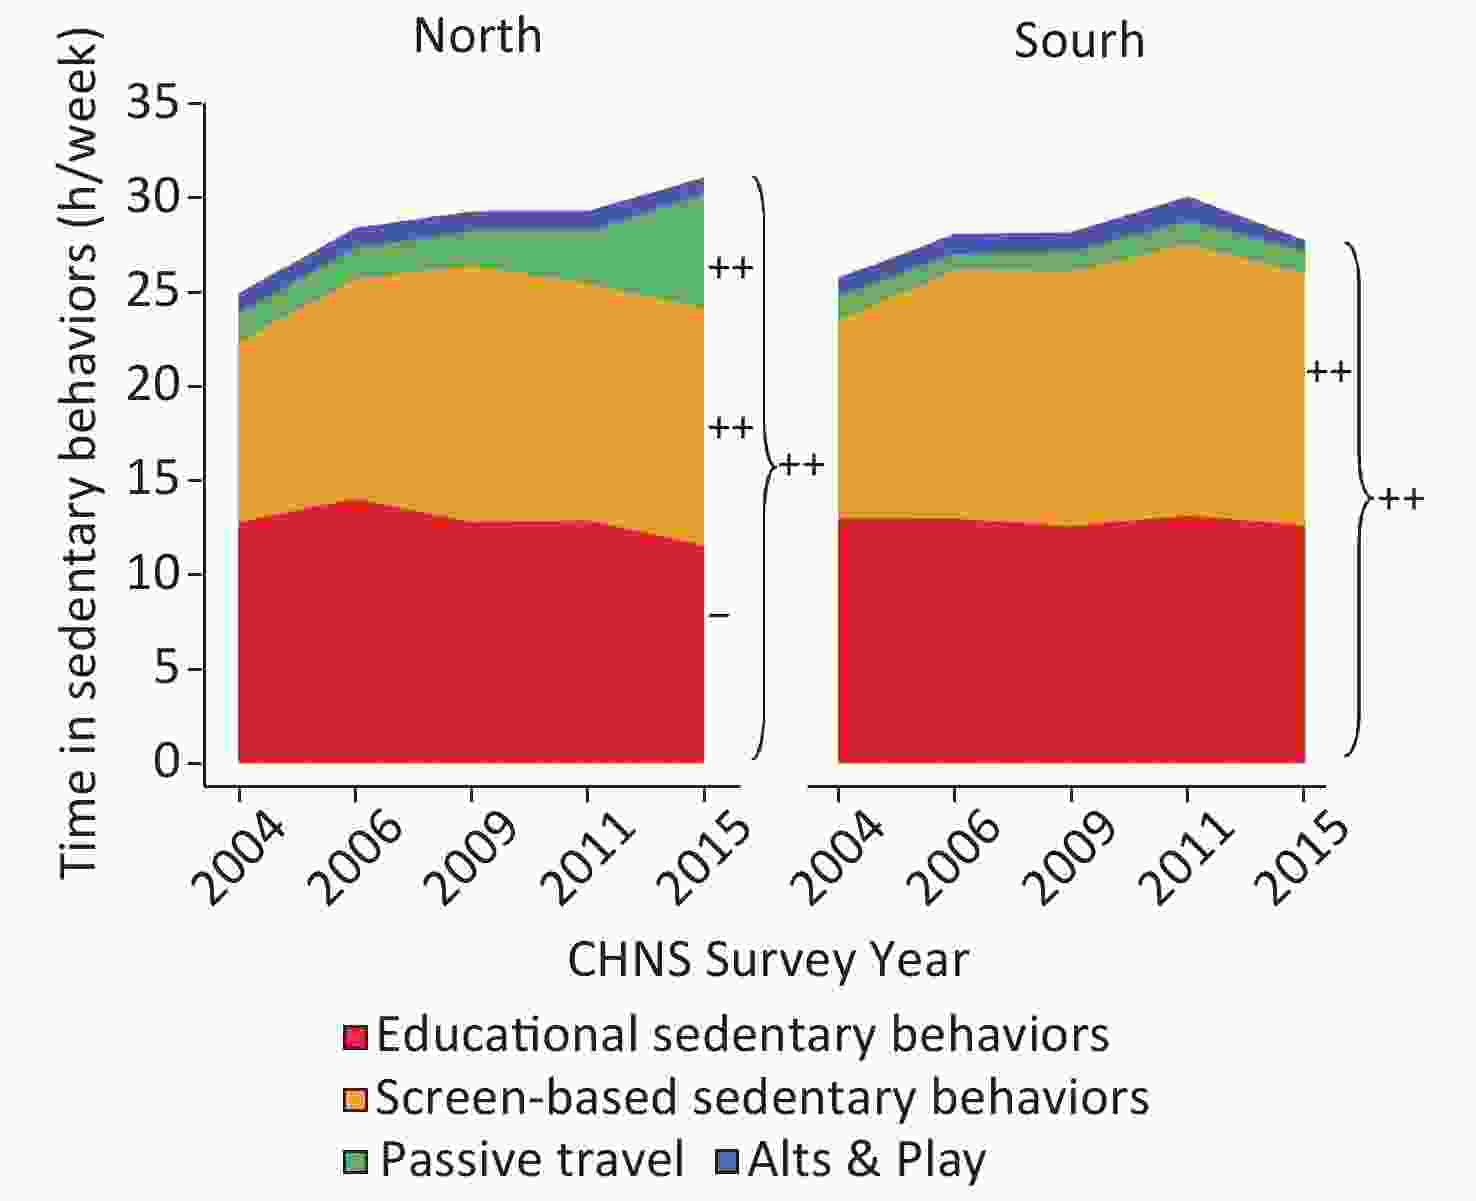
Figure 5. Trends of time spent in sedentary behaviors among Chinese children aged 6–17 years old residing in the north and south of China from 2004 to 2015.
-
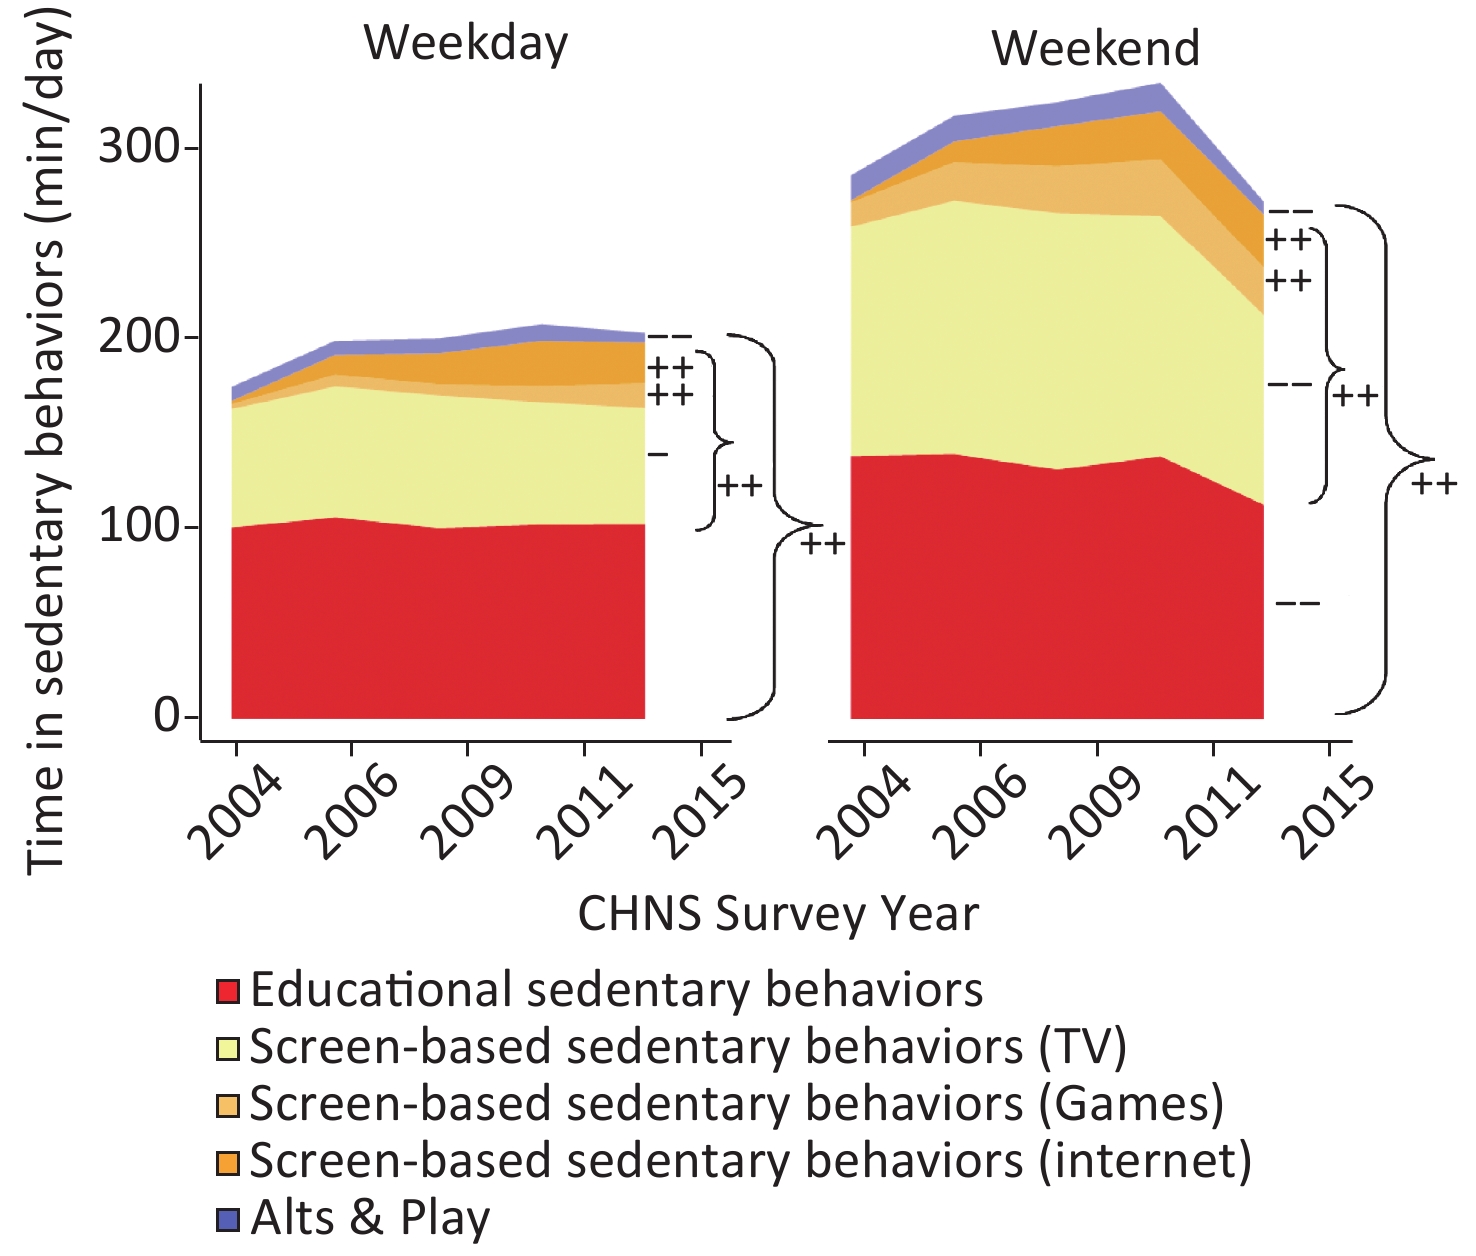
The total time spent in educational sedentary behaviors, screen-based sedentary behaviors, and Arts & Play on weekends was 1.5 times greater on weekdays. Educational and screen-based sedentary behaviors were the predominant types of sedentary behaviors on weekdays and weekends. On weekdays, total time spent in the three domains from 2004 to 2015 (P < 0.001) increased 16.1%. In the 11 years, the time spent on screen-based sedentary behaviors on weekdays and weekends increased by 27.1 min/day (P < 0.001) and 19.4 min/day (P < 0.001), respectively. Within the sub-domains of screen-based sedentary behaviors, significant increases in the time spent on game-based and Internet-based activities were observed on weekdays and weekends, with the largest increase observed in time spent on Internet-based activities on weekends (P < 0.001). By contrast, significant decreases in time spent on TV-based activities were observed on weekdays and weekends (P < 0.05) with more profound decreases on weekends. Consistent decreases were observed in time spent in Art & Play on weekdays and weekends (P < 0.001). With regard to time spent on educational sedentary behaviors, there was a consistent decrease from 2004 to 2015 of 18.5% on weekends (P < 0.001), but not on weekdays (Figure 6).
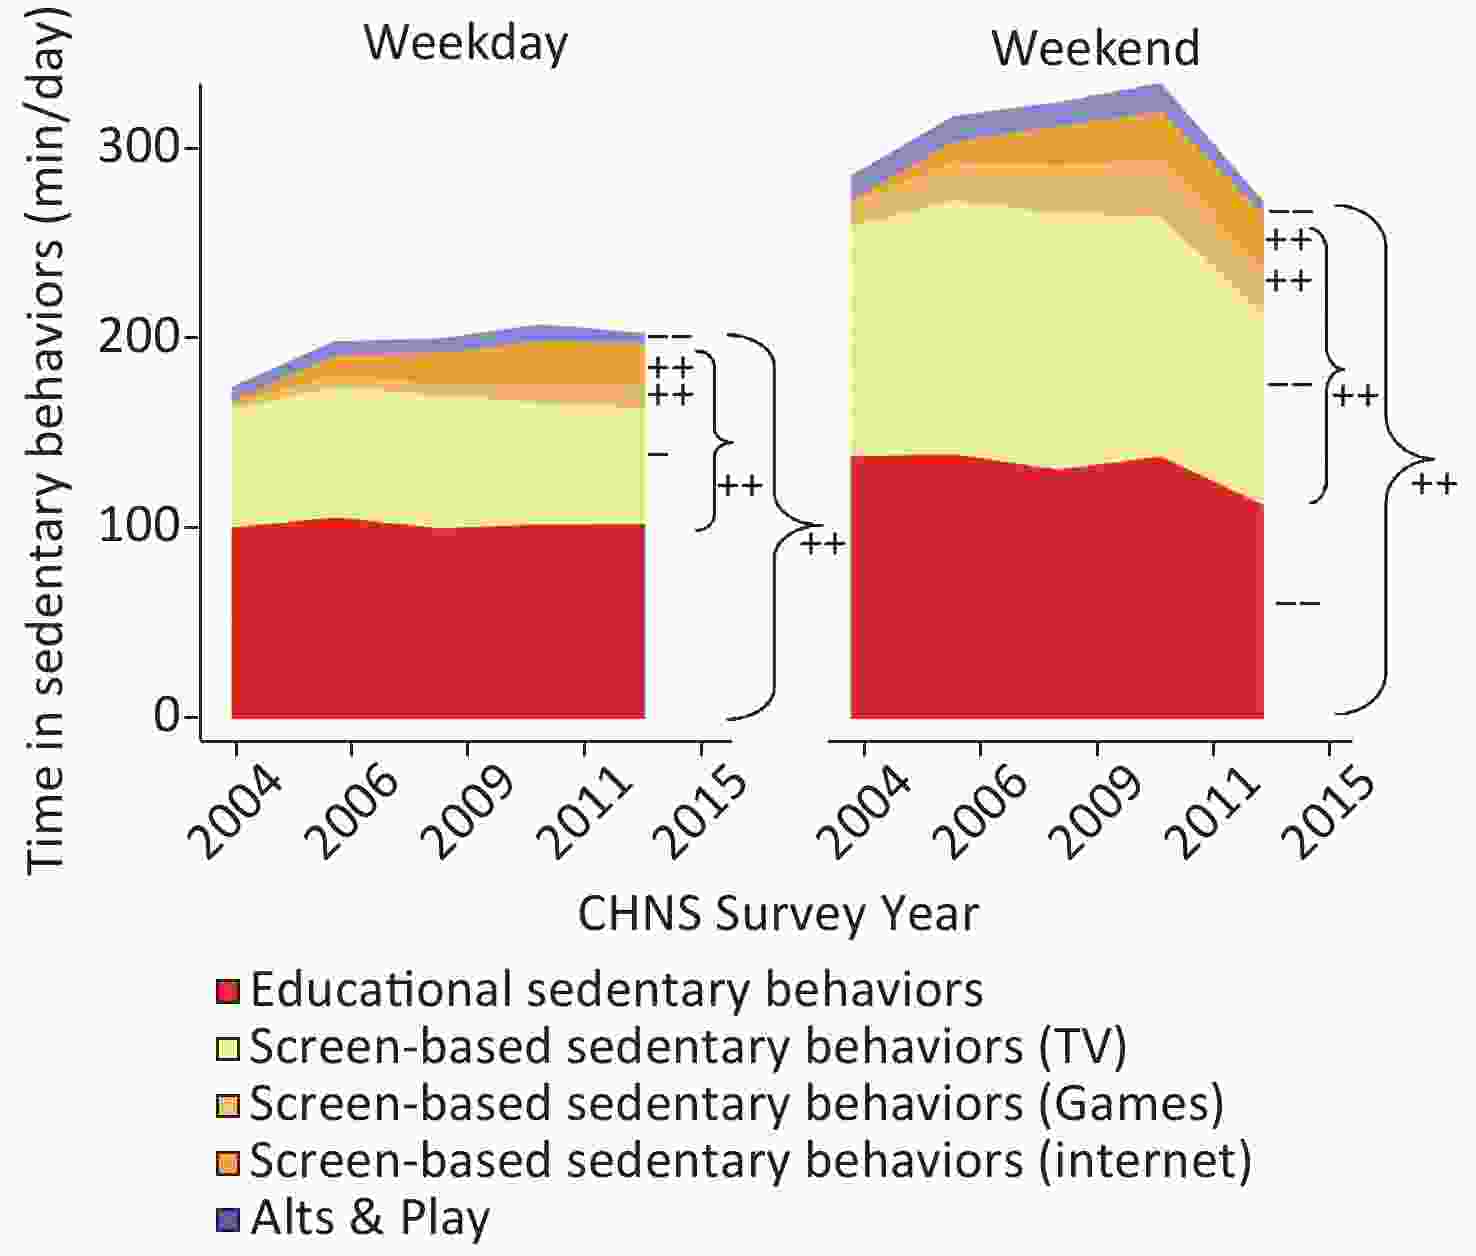
Figure 6. Trends of time spent in sedentary behaviors on weekdays and weekends among Chinese children aged 6–17 years old from 2004 to 2015.
-
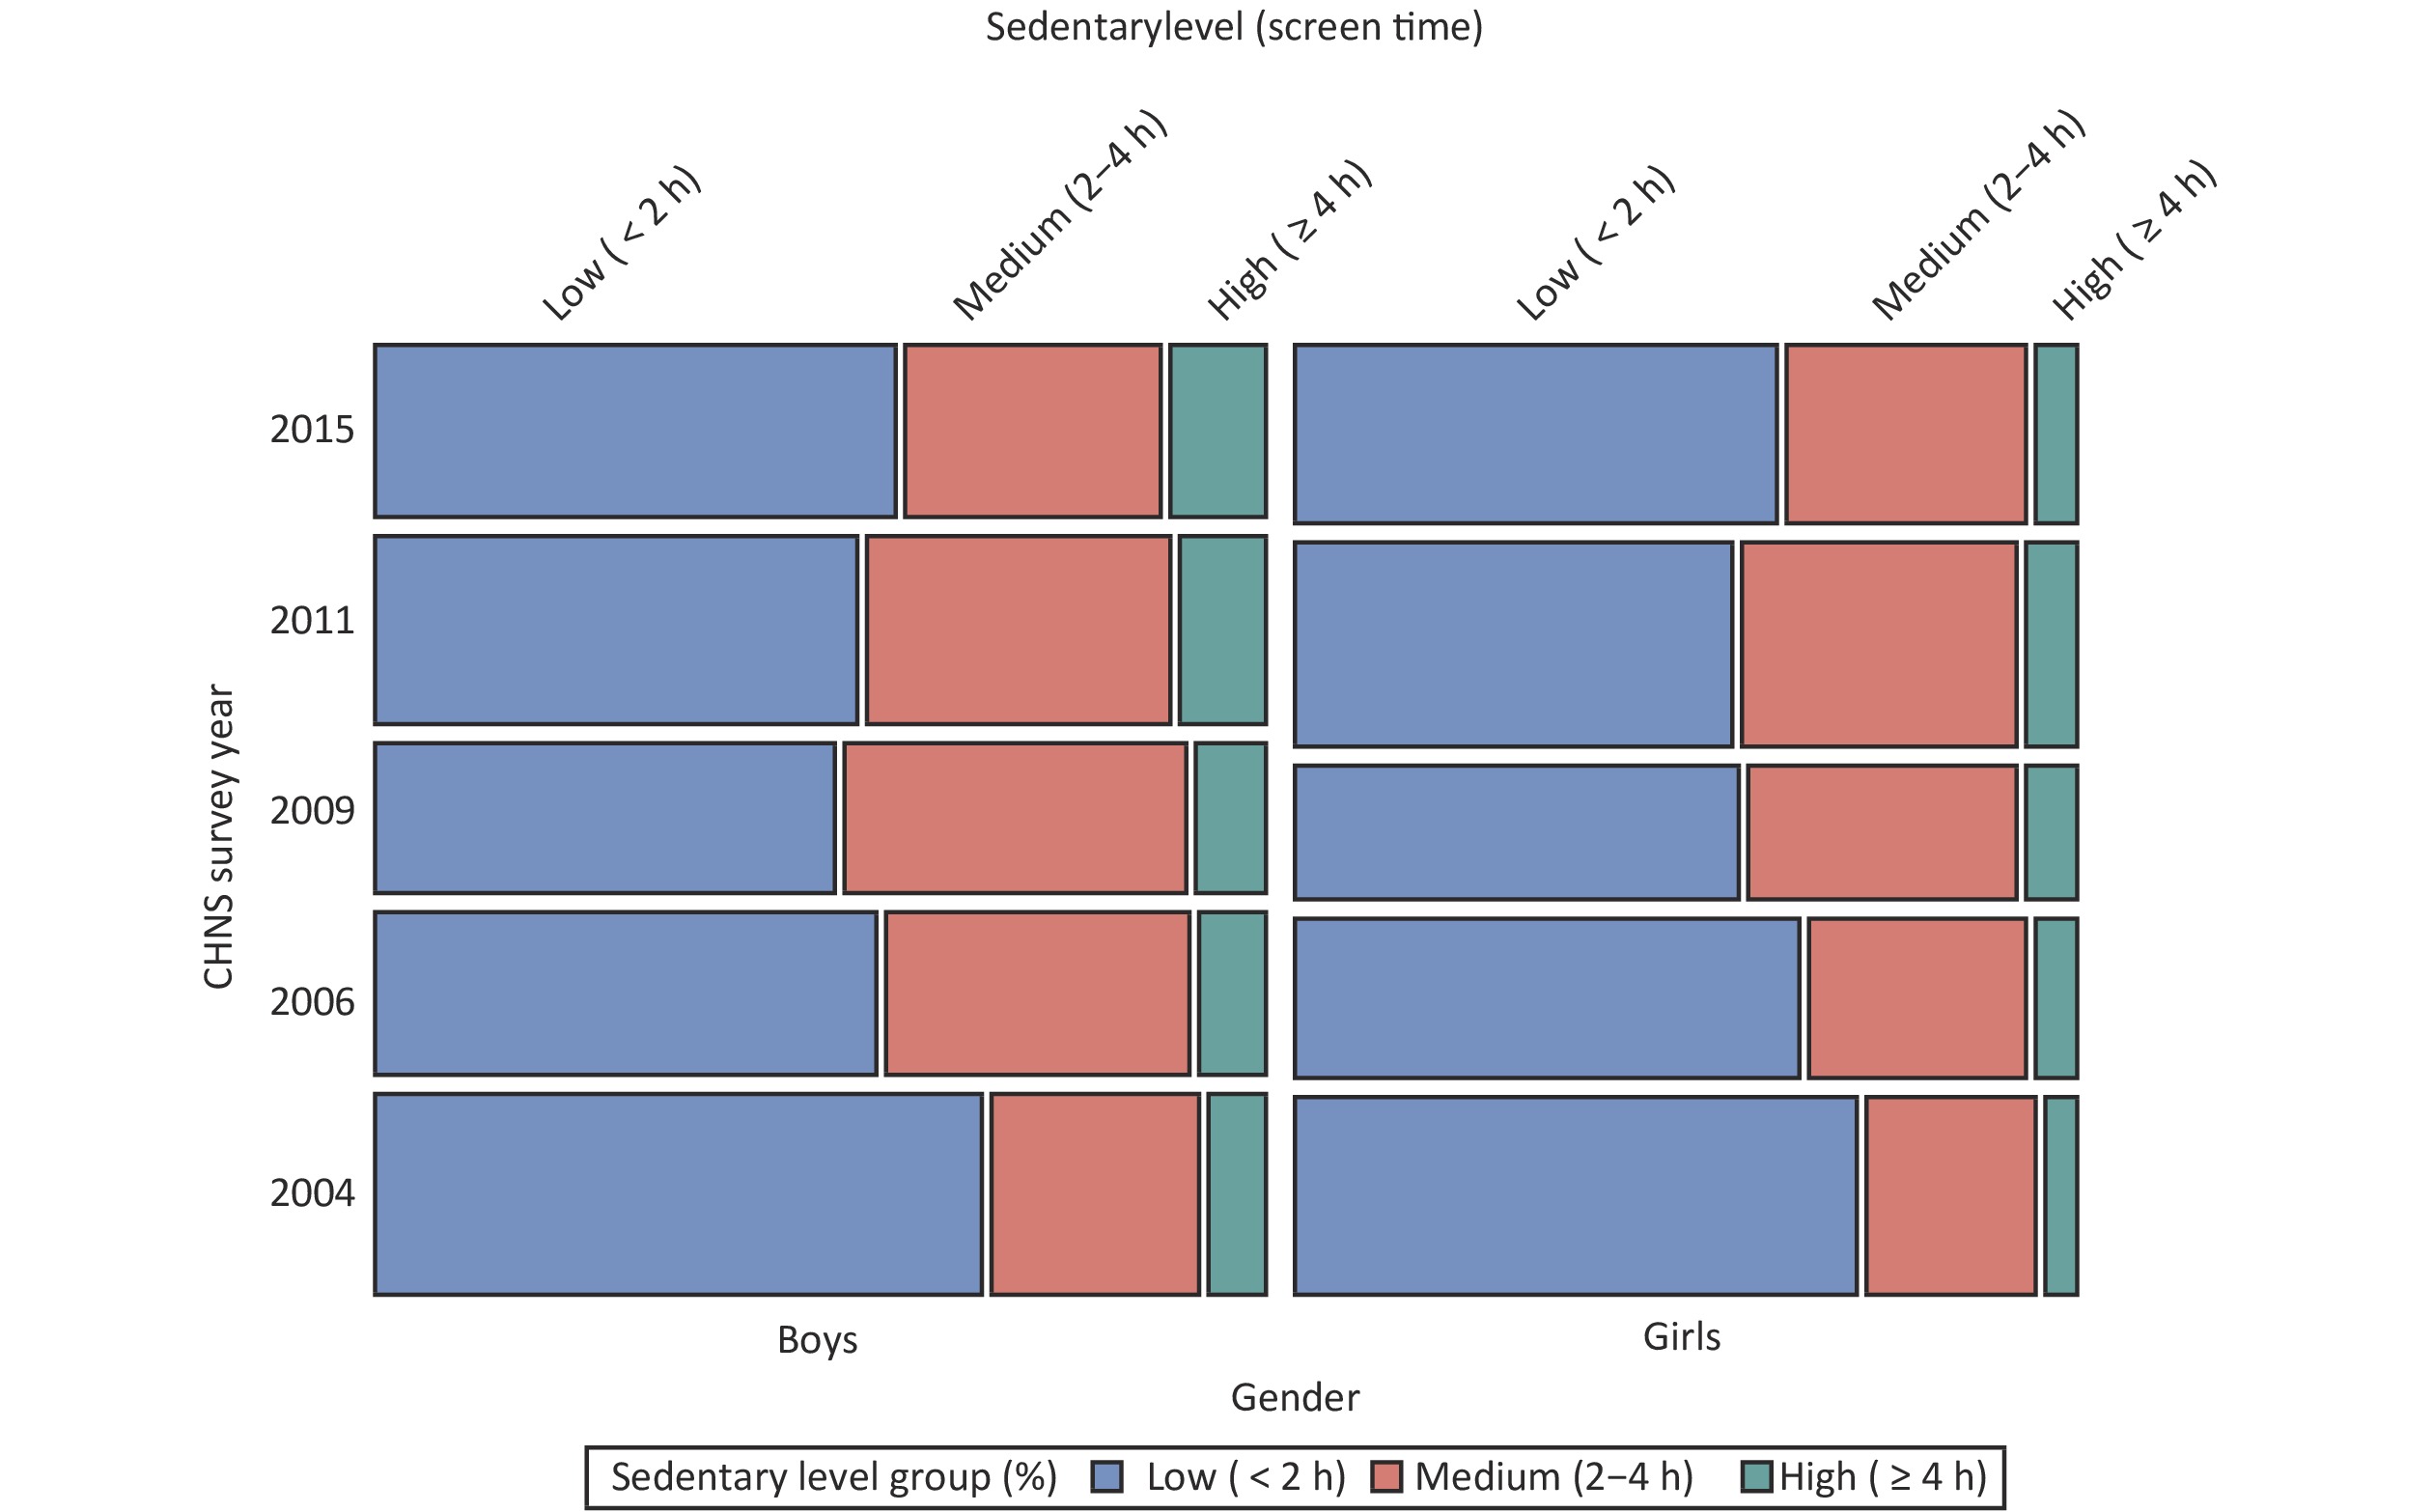
Compared to 2004, the proportion of children with low sedentary levels (screen time < 2 h/day) fell in later survey years (P < 0.001). At the same time, the proportion of children with high sedentary levels (screen time ≥ 4 h/day) increased with time (P < 0.001). Over the 11 years, the proportion of children with low sedentary levels declined from 71.6% to 61.4% (OR = 0.51, 95% CI: 0.42–0.63, P < 0.001) while the proportion of children with high sedentary levels rose from 5.3% to 8.3% (OR = 1.95, 95% CI: 1.58–2.41, P < 0.001). The random-effects ordinal regression model shows that the sedentary levels were significant different between communities (P = 0.040), as well as the trends of sedentary levels (P = 0.049). Gender stratification analysis (Figure 7) shows that there was a consistent decrease in proportion with low sedentary levels but a consistent increase in proportion with high sedentary levels among both boys and girls (P < 0.001). In 2015, the proportion with low sedentary levels among boys and girls were 59.6% and 63.4%, respectively. The proportion of boys with high sedentary was nearly double that of girls.
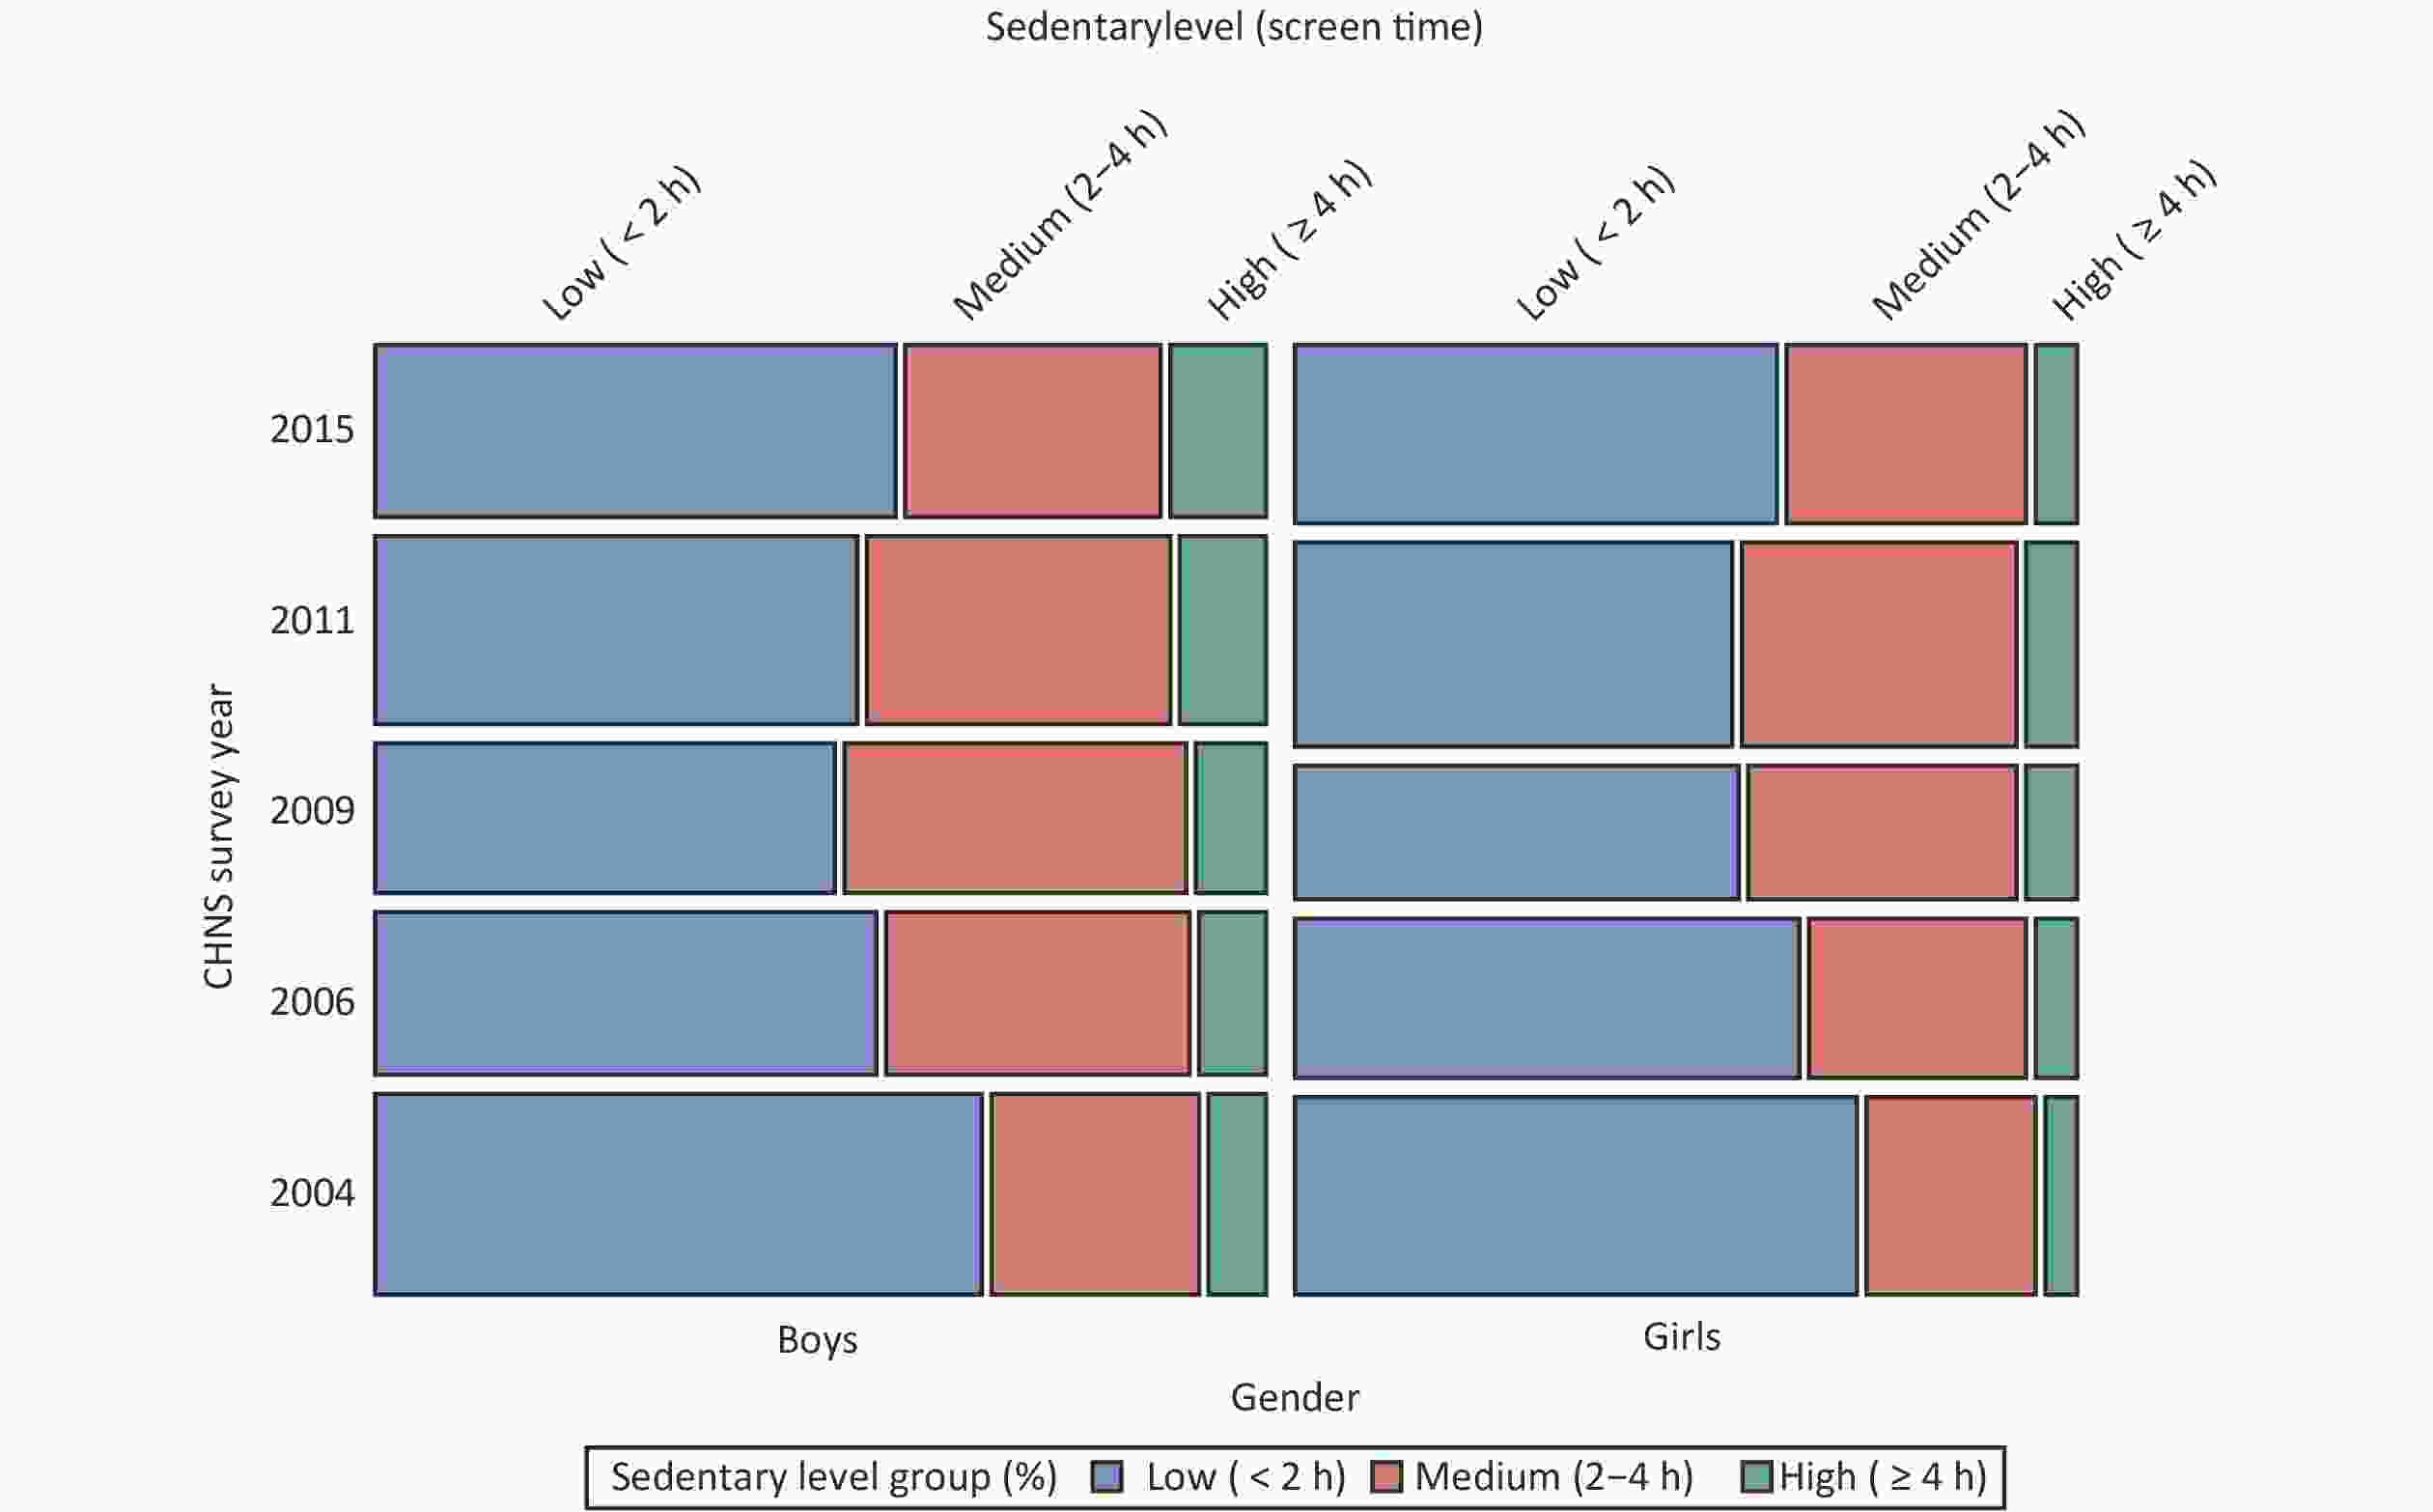
Figure 7. Trends of sedentary levels among Chinese children from 2004 to 2015.
-
Regardless of gender, age, urbanization level, residential area or region, there was a rising trend toward increased total sedentary time among Chinese children aged 6–17 years from 2004 to 2015. Similarly, a recent finding from the US National Health and Nutrition Examination Survey suggests a rising trend toward increased total sitting time among American youth aged 12–19 years from 2007 to 2016[28]. In this study, the proportion of children with low sedentary levels (screen time < 2 h/day) decreased from 71.6% in 2004 to 61.4% in 2015, while that of children with high sedentary levels (screen time > 4 h/day) increased by 3%. In the last decade, studies conducted in Western countries, including the US[28], Australia[29], Brazil[30], and others[31] showed that only one-third of children met the screen time recommendation of less than 2 hours per day. Although the proportion of Chinese children meeting the screen time recommendation was higher than that of Western children, the declining trend observed among Chinese children warrants attention. Findings from the Canadian Health Measures Survey indicated that the proportion of 6–11 year-old children with low sedentary levels increased from 25% in 2011 to 38% in 2015 and reached 78% in 2017, while that of 12–17 year-old children decreased from 37% in 2011 to 20% in 2015 and rebounded to 35% in 2017[32]. In view of the increasing trend of sedentary time among Chinese children, there is an urgent need to formulate measures to curb the trend.
We found the total sedentary time among Chinese children increased with urbanization, which implies that urbanization reinforces sedentary behaviors. From a systematic review, sedentary behavior among school-age children in Sub-Saharan Africa shows that urbanization is a major factor that contributed to the increase in sedentary behaviors among children aged 5–17 years in the past 30 years[33]. In this study, we found a greater increase in total sedentary time among rural children and among the low urbanization group, as compared to urban children and among the medium-high-urbanization groups. These findings imply that children residing in areas with low urbanization are more vulnerable to the negative impact of rapid urbanization on sedentary behavior. As such, more efforts should be put toward creating a supportive environment for children’s active lifestyles when accelerating rural urbanization.
In this study, we note that the domain-specific trends in sedentary time from 2004 to 2015 were inconsistent. Specifically, a rising trend was observed for time spent in screen-based sedentary behaviors, whereas a declining trend and a stable trend were observed for time spent in Arts & Play and educational sedentary behaviors, respectively. These findings probably reflect the fact that new forms of entertainment have replaced traditional modes of play during the rapid urbanization process. A recent review of sedentary behavior surveillance data in Canada shows that, from 2007 to 2017, there was a consistent trend toward an increase in leisure screen time among children aged 6–17 years, whereas the time spent in leisure reading remained fairly stable[34]. Despite different measures used, these findings are largely consistent with our own. On the other hand, a rising trend was also observed in passive travel, which reflects the impact of the increasing popularity of convenient modern means of transportation during the rapid urbanization process.
Increased screen time contributed to the largest share of the rise in total sedentary time. Notably, there was a consistent trend toward increased screen time on weekdays, weekends, and across all demographic characteristics. This finding corroborates with previous studies conducted in Canada[34], Korea[35], and Brazil[36]. In 2015, the average screen time among Chinese children was 1.8 h/day, which corroborates with the finding of the 2017 Physical Activity and Fitness in China-The Youth Study that the average screen time among Chinese children aged 7–19 years was 1.9 h/day[37]. These figures are almost double that of the upper limit (one-hour screen time per day) recommended in the Healthy China Action Plan (2019–2030). As such, effective interventions and policies targeting screen-time reductions are highly warranted to curb sedentary behaviors among Chinese children.
With regard to the sub-domains of screen time, we found a 13.5 times increase in time spent on Internet-based activities, a 3.2 times increase in time spent on game-based activities but an 8.7% decrease in time spent on TV-based activities. Of note, the increase in screen time was more profound on weekends, with the largest increase observed in time spent in Internet-based activities. This is probably due to a surge in electronic products and Internet penetration over the last decade. According to data from the National Bureau of Statistics of China, from 2000 to 2013, the number of computers per 100 households in urban areas increased from 9.7 to 87.0; in rural areas, that ratio rose from 0.5 to 21. Meanwhile, the penetration rate of mobile phones increased by 12 times, and the number of color TVs dropped by 1.7 times[38]. A study examining the trends in screen-time behaviors among adolescents aged 11–15 years in 30 countries indicates that, from 2002 to 2010, the slight decrease in time spent in TV viewing was offset by a sharp increase in time spent in computer use for gaming and non-gaming purposes across all countries[39]. Similar trends are noted in national representative surveys among Canadian adolescents aged 12–17 years from 2005 to 2017[34]. Our study adds to the existing knowledge by uncovering similar trends in China. Such findings underscore that the key to reducing sedentary behaviors among Chinese children in the new era is to limit screen time, especially time spent in Internet-based and game-based activities.
The rising trend in passive travel may be explained by the rapid growth of car ownership in China. According to data from the National Bureau of Statistics of China, the number of household cars per 100 households increased by ten times from 2004 to 2015[38]. In this study, time spent in passive travel among children residing in urban areas and areas with high urbanization remained stable. By contrast, that among children residing in rural areas and areas with low-to-medium levels of urbanization increased, with more prominent rises observed from 2011 to 2015. These findings imply that urbanization has a significant impact on transportation use among less developed areas, while such impact is less pronounced among more developed areas. On the other hand, this study shows that the time spent in educational sedentary behaviors among children was generally stable from 2004 to 2015, except for a downward trend observed on weekends and among northern children. This finding supports the effectiveness of the recent “academic burden alleviation” policy implemented in primary and secondary schools. Under the burden reduction policy, the schools have strictly controlled the amount of homework, which led to lesser educational sedentary time[40]. In this regard, the policy coverage should be further expanded to reduce educational sedentary behaviors and target children of different age groups and regions.
It is worth noting that different types of sedentary behaviors may have different impacts on health. For example, indulging in screen-based entertainment has an adverse impact on eye health[41]; TV-based behaviors may be associated with elevated levels of various cardio-metabolic risk factors[42]; online communication may enhance self-esteem and quality of friendship among adolescents[43]. In view of our finding that different trends were observed among the four domains of sedentary behaviors, future studies should assess domain-specific sedentary behaviors and their impact on health. Given the lack of relevant guidelines, an international consensus should be reached regarding the classification system of sedentary behaviors, to allow comparison of sedentary trends among children on an international scale.
There are some notable limitations in this study. First, the participants in the CHNS project sample were not nationally representative, although the findings of previous studies using CHNS data were in line with the results of the Chinese National Nutrition and Health Survey[44,45]. Second, the data from CHNS survey years were treated as cross-sectional data. Third, the sedentary behaviors were measured by self-reporting questionnaires, which are subject to recall bias, and the reliability and validity of the questionnaire were not formally tested. Finally, the questions related to passive travel do not separate transportation use on weekdays and weekends. Some broad categories are not expanded to show sub-categories. For example, Internet-based activities can be further stratified into two sub-groups based on learning and entertainment purposes.
-
From 2004 to 2015, the total sedentary time among children aged 6–17 years in China described an upward trend, which was mainly attributed to the increase in screen time. In particular, greater increases were observed among children residing in rural areas and areas with lower urbanization levels than their city counterparts and areas with medium-to-high-urbanization levels. In light of the adverse impact of sedentary behaviors, more concerted efforts should be put toward identifying and implementing effective measures to reduce sedentary behaviors, particularly screen-based behaviors, alongside the efforts to accelerate urbanization.
-
Dr. YANG Xi contributed to the conception of the study, analysis and interpretation of data, and drafted the manuscript. Dr. LEUNG Wai Yi contributed to the interpretation of the results and article writing. Dr. CHEN Yuan Sheng and Dr. OUYANG Yi Fei assisted with the data analyses. Prof. ZHAO Wen Hua directed all aspects of the study, including the design of the study protocols, administration of data analyses and critical revision of the manuscript.
-
We thank the National Institute for Nutrition and Health, and China Center for Disease Control and Prevention. We are also grateful for funding from the NIH to the Carolina Population Center at the University of North Carolina at Chapel Hill (P2C HD050924, T32 HD007168), research grants from the NIH (R01 HD30880, P30DK056350, R01 HD38700) and the NIH Fogarty grant (D43 TW009077), and for the CHNS data collection and relative files from 2004 to 2015.
-
The authors declare that they have no competing interests.
Recent Trends in Sedentary Behaviors among Chinese Children According to Demographic and Social Characteristics
doi: 10.3967/bes2021.083
Funds:
This work was funded by the National Scientific and Technological Basic Resources Investigation Program “Research and application of nutrition and health system for children aged 0–18 years in China” [2017FY101100]
- Received Date: 2020-09-07
- Accepted Date: 2021-02-22
-
Key words:
- Sedentary behaviors /
- Child /
- China /
- Trends
Abstract:
| Citation: | YANG Xi, LEUNG Wai Yi, CHEN Yuan Sheng, OUYANG Yi Fei, ZHAO Wen Hua. Recent Trends in Sedentary Behaviors among Chinese Children According to Demographic and Social Characteristics[J]. Biomedical and Environmental Sciences, 2021, 34(8): 593-605. doi: 10.3967/bes2021.083

|

 Quick Links
 DownLoad: