


-
In recent years, the incidences of thyroid diseases have gradually increased, and they may be associated with the development of diagnostic technologies, elevated public health awareness, nuclear radiation, environmental pollution, changes in lifestyle, work stress, excessive iodine intake, and other factors. Because obesity can cause changes to the hypothalamic-pituitary-thyroid axis and deiodinase[1], obesity may be closely related to the high rate of thyroid diseases. The relationship between obesity and hypothyroidism has been widely confirmed, but the relationship between obesity and subclinical thyroid diseases still remains unclear. Obesity may also have an influence on thyroid autoimmunity (TAI) because obesity can increase the level of adipokines such as leptin and interleukin-6 (IL-6), which are crucial to maintain immune balance[2]. As one of the major diseases caused by obesity, Metabolic syndrome (MS) may be also related to the occurrence of thyroid diseases and their association has achieved widespread attention. Although several studies have explored the relationship among obesity, MS and thyroid diseases, all of them are incomplete and systematic studies are needed to clarify such associations.
To figure out the relationship among obesity, MS and thyroid diseases, a cross-sectional survey was performed in Heze and Jining, Shandong Province, China. The inclusion criteria and the exclusion criteria were used to select the subjects. The inclusion criteria were as following: body mass index (BMI) ≥ 18.5, 40 ≤ age ≤ 65, years. The exclusion criteria were as following: patients with thyroid nodules, goiters, thyroid surgeries, severe liver and kidney diseases and malignant tumors, pregnant women, and those who were taking drugs related to thyroid diseases. Informed consent was obtained from all individual participants included in the study. For subjects who met the inclusion criteria, a questionnaire was used to acquire basic information and a physical examination was carried out to understand their health status. Fasting blood was collected to measure levels of thyroid function, glucose and lipids.
Thyroid function indicators, including thyroid stimulating hormone (TSH), free triiodothyronine (FT3), free thyroxine (FT4), antibody to thyroid-peroxidase (TPOAb) and antibody to thyroglobulin (TGAb), were determined by chemiluminescence immunoassays (Siemens Healthcare Diagnostics Inc., Tarrytown, NY, USA). The reference range was 0.27 μIU/mL−4.2 μIU/mL to TSH, 3.1 pmol/L−6.8 pmol/L to FT3, 11.5 pmol/L to 22.7 pmol/L to FT4, 0 to 60 U/mL to TPOAb, 0 to 60 U/mL to TGAb. The triglyceride (TG), total cholesterol (TC), low-density lipoprotein cholesterol (LDL-c), high-density lipoprotein cholesterol (HDL-c) and fasting blood glucose (FBG) levels were evaluated using an automatic biochemical analyzer (HITACHI 3100). Serum iodine was analyzed by plasma-mass spectrometry (PerkinElmer NexION 350).
The diagnosis of obesity is based on the levels of BMI: normal BMI: 18.5 ≤ BMI < 24, overweight: 24 ≤ BMI < 28, obesity: BMI ≥ 28. The standard of IDF/AHA/NHLBI/WHF/IAS/IASO-2009 was adopted to diagnose MS. Patients who met three or more criteria were defined as having MS: 1) WC ≥ 90 cm in males, WC ≥ 80 cm in females; 2) TG ≥ 150 mg/dL; 3) HDL-c < 40 mg/dL in males, HDL-c < 50 mg/dL in females; 4) Systolic blood pressure (SBP) > 130 mmHg or diastolic blood pressure (DBP) > 85 mmHg, or a history of hypertension; 5) FBG > 100 mg/dL, or a history of hyperglycemia. The diagnostic criteria for thyroid diseases were as following: 1) Hypothyroidism-TSH > 4.2 μIU/mL, FT4 < 11.5 pmol/L; 2) Subclinical hypothyroidism (SCH)-TSH > 4.2 μIU/mL, FT3 and FT4 within normal range; 3) Hyperthyroidism-TSH < 0.27 μIU/mL, FT3 > 6.8 pmol/L or FT4 > 22.7 pmol/L; 4) Subclinical hyperthyroidism- TSH < 0.27 μIU/mL, FT3 and FT4 within normal range; 5) Positive TPOAb- TPOAb > 60 U/mL; 6) Positive TGAb- TGAb > 60 U/mL; 7) TAI: Positive TPOAb or positive TGAb.
Normally distributed data were expressed with
$\bar{x}\pm s$ and skewed data were described as the Median (P25, P75). One-way analysis of variance and Kruskal–Wallis H analysis were used for the statistical analysis of normally distributed and skewed data, respectively. The Cochran-Mantel-Haenszel test was used for the statistical analysis of the categorical data. Binary logistic regression was used to identify the main risk factors of diseases. Statistical significance was set at P < 0.05. SAS 9.1 was used to analyze the Cochran-Mantel-Haenszel test and SPSS19.0 was used for the other data analysis.Based on the BMI data of the 1,018 subjects, 429 (42.14%) were diagnosed as overweight, 280 (27.50%) as obesity, and all others as normal (30.36%) (Supplementary Table S1 available in www.besjournal.com). Compared to the normal group, the obesity and overweight groups had higher TG, TC, LDL-c, FBG, SBP, DBP, WC, and lower HDL-c levels. The obesity and overweight groups also had a higher prevalence of MS than the normal group. Binary logistic regression revealed that being overweight and obese were risk factors for MS after controlling for age and gender (Supplementary Table S2 available in www.besjournal.com). Although obesity was closely related to MS, there were still some differences between obesity and MS. Nearly 50% of obese patients were diagnosed as MS (-) and 55.55% of MS patients were non-obese. Consistency analyses showed that obesity and MS had a weak consistency (K = 0.253, P = 0.000). As a result, it was necessary to investigate the effects of obesity and MS on thyroid diseases, separately.
Variable Normal BMI (n = 309) Overweight (n = 429) Obesity (n = 280) P Gender Male 104 123 73 Female 205 306 207 0.117 Age 51.20 ± 6.15 51.59 ± 5.18 52.02 ± 4.99 0.190 BMI (kg/m2) 22.21 ± 1.30 25.98 ± 1.11* 30.60 ± 2.40*# 0.000 Serum iodine (μg/L) 81.74 (69.83–91.33) 78.47 (69.65–90.09) 79.63 (69.58–91.10) 0.361 TG (mg/dL) 116.18 ± 67.94 146.84± 115.80* 184.60 ± 135.22*# 0.000 TC (mg/dL) 194.36 ± 36.88 201.23 ± 41.01* 205.54 ± 40.25* 0.002 HDL-c (mg/dL) 63.18 ± 13.28 59.40 ± 12.43* 55.49 ± 12.43*# 0.000 LDL-c (mg/dL) 116.20± 33.44 124.24± 33.83* 128.35± 33.21* 0.000 FBG (mg/dL) 82.03 ± 24.68 86.59 ± 28.70* 88.07 ± 27.85* 0.018 SBP (mmHg) 121.81 ± 18.72 125.32 ± 16.24* 132.21 ± 18.45*# 0.000 DBP (mmHg) 81.15 ± 12.63 84.15 ± 16.35* 88.67 ± 15.71*# 0.000 WC (cm) 80.96 ± 6.14 90.33 ± 5.97* 101.31 ± 7.48*# 0.000 MS, n (%) 29 (9.38) 146* (34.03) 140*# (50) 0.000 Note. *Compared with the normal BMI group, #compared with the overweight group. Table S1. The components of MS according to different BMI status
Variable Crude OR (95% CI) P Adjusted OR (95% CI) P BMI Normal BMI Reference Reference Overweight 4.98 (3.23–7.66) 0.000 4.98 (3.23–7.69) 0.000 Obesity 9.65 (6.16–15.11) 0.000 9.55 (6.07–15.02) 0.000 Note. Adjusted OR: adjusted by age and gender. Table S2. The risk of MS according to the BMI status
Compared to the normal group, both the obesity and overweight groups had higher TSH (Table 1). Both correlation analyses and multiply linear regression analyses indicated that BMI and TSH were significantly positively correlated (R2 = 0.87, P = 0.006) (Supplementary Table S3 and Supplementary Figure S1 available in www.besjournal.com). Compared to the overweight and normal groups, the obesity group also had a higher incidence of TPOAb positivity. Furthermore, obesity was also a risk factor for TPOAb positivity after controlling for age and gender (Supplementary Table S4 available in www.besjournal.com). The obesity group also had a higher prevalence of SCH and TAI than the overweight and normal groups. After controlling for age and gender, obesity remained a risk factor for SCH and TAI (Supplementary Table S5 available in www.besjournal.com). There were no differences in the prevalence of hypothyroidism, hyperthyroidism and subclinical hyperthyroidism between the three groups (Table 1).
Variable Normal BMI (n = 309) Overweight (n = 429) Obesity (n = 280) P TSH (μIU/mL) 2.18 (1.55–2.93) 2.31* (1.69–3.50) 2.54* (1.78–3.77) 0.001 FT3 (pmol/L) 5.31 ± 0.82 5.29 ± 1.16 5.19 ± 0.58 0.295 FT4 (pmol/L) 16.20 ± 2.75 16.27 ± 3.04 16.24 ± 2.85 0.961 Positive TPOAb, n (%) 24 (7.76) 33 (7.69) 38*# (13.57) 0.024 Positive TGAb, n (%) 34 (11.00) 42 (9.79) 42 (15) 0.135 Hypothyroidism, n (%) 1 (0.32) 1 (0.23) 3 (1.07) 0.272 SCH, n (%) 33 (10.67) 69* (16.08) 56* (20) 0.015 Hyperthyroidism, n (%) 4 (1.29) 1 (0.23) 1 (0.35) 0.133 Sub-hyperthyroidism, n (%) 0 6 (1.39) 1 (0.35) 0.056 TAI, n (%) 40 (12.94) 48 (11.18) 54*# (19.28) 0.012 Note. *Compared with the normal BMI group, #compared with the overweight group. TSH: thyroid stimulating hormone; FT3: free triiodothyronine; FT4: free thyroxine; TPOAb: antibody to thyroid-peroxidase; TGAb: antibody to thyroglobulin; SCH: Subclinical hypothyroidism; TAI: thyroid autoimmunity. Table 1. The Thyroid function, thyroid diseases according to different BMI status
Variable β S. E t P BMI 0.479 0.194 2.469 0.014 Gender 0.052 0.024 2.172 0.030 FT4 -0.213 0.030 -7.074 0.000 TPOAb 1.987 0.383 5.191 0.000 Table S3. Evaluation of the impact factors of TSH by multiply linear regression
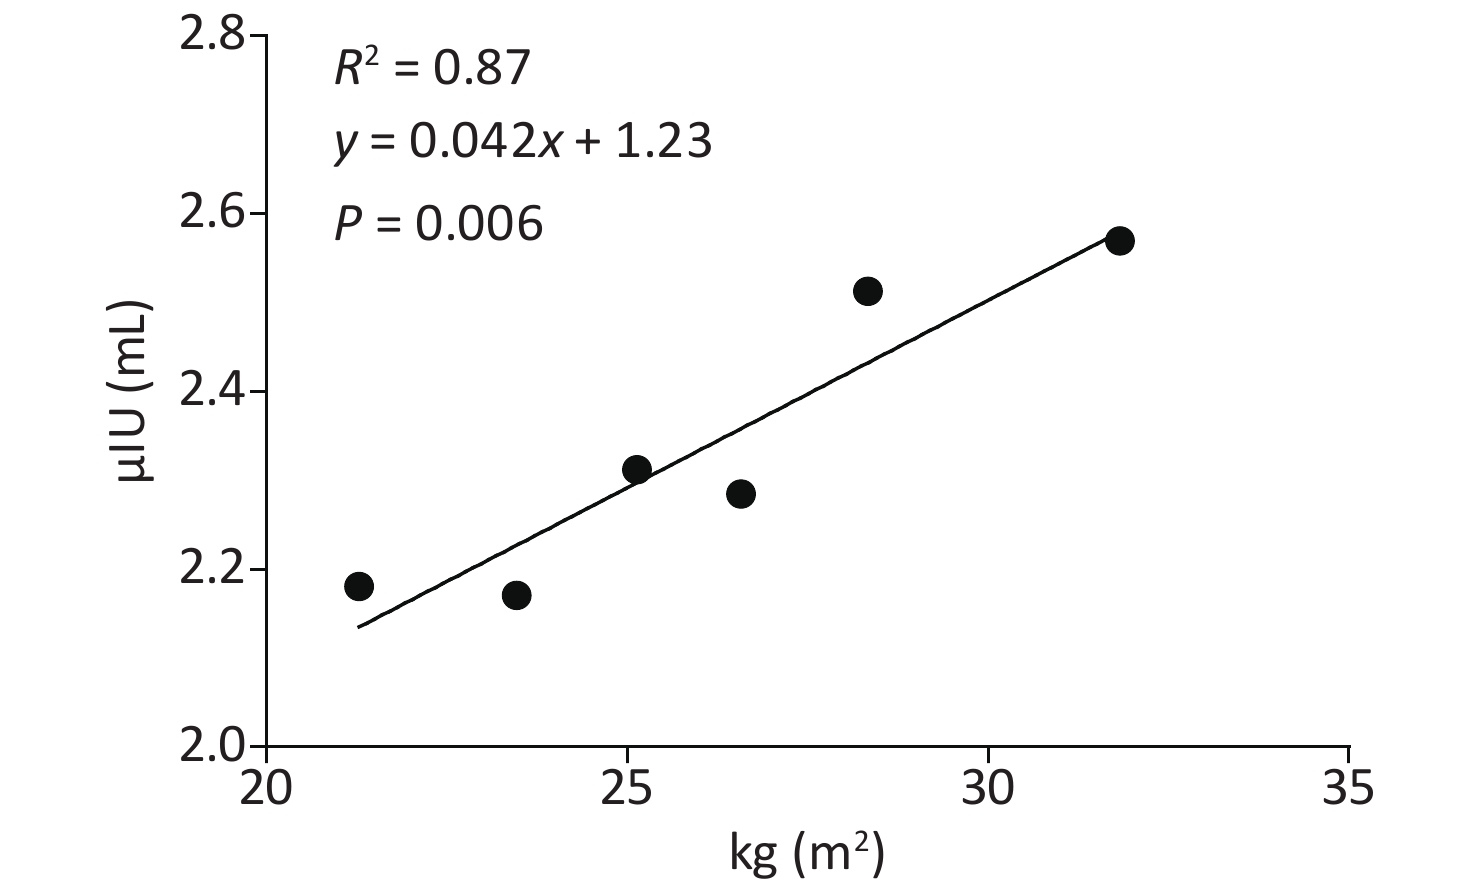
Figure S1. The correlation between BMI and TSH.
Variable Crude OR (95% CI) P Adjusted OR (95% CI) P BMI Normal BMI Reference Reference Overweight 0.99 (0.57–1.71) 0.970 0.99 (0.56–1.72) 0.973 Obesity 1.86 (1.08–3.19) 0.023 1.87 (1.08–3.24) 0.024 Note. Adjusted OR: adjusted by age and gender. Table S4. The risk of TPOAb according to the BMI status
Variable Crude OR (95% CI) P Adjusted OR (95% CI) P SCH BMI Normal BMI Reference Reference Overweight 1.55 (0.99–2.42) 0.055 1.44 (0.91–2.27) 0.112 Obesity 2.18 (1.36–3.49) 0.001 1.98 (1.23–3.21) 0.005 MS MS (-) Reference Reference MS (+) 1.08 (0.75–1.56) 0.656 0.99 (0.68–1.44) 0.972 TAI BMI Normal BMI Reference Reference Overweight 0.89 (0.56–1.39) 0.612 0.85 (0.53–1.35) 0.499 Obesity 1.73 (1.10–2.72) 0.017 1.66 (1.04–2.64) 0.032 MS MS (–) Reference Reference MS (+) 0.73 (0.48–1.09) 0.133 0.69 (0.45–1.06) 0.092 Note. Adjusted OR: adjusted by age and gender. Table S5. The risks of Thyroid Diseases according to Metabolic status or BMI status
According to the diagnostic criteria, 315 subjects (30.94%) were diagnosed with MS. Compared to the MS (-) group, the MS (+) group had higher TSH levels, higher FT4 levels, and lower FT3/FT4 levels. However, there were no differences in the prevalence of thyroid diseases between subjects with and without MS (Table 2). Nor was MS a risk factor for thyroid diseases after controlling for age and gender (Supplementary Table S5 available in www.).
Variable MS (−) (n = 703) MS (+) (n = 315) P Gender Male 213 87 Female 490 228 0.386 Age (y) 51.17 ± 5.64 52.53 ± 4.88* 0.000 TSH (μIU/mL) 2.23 (1.60−3.24) 2.46* (1.80−3.61) 0.008 FT3 (pmol/L) 5.30 ± 1.06 5.19 ± 0.55 0.075 FT4 (pmol/L) 16.04 ± 3.04 16.69 ± 2.50* 0.001 FT3/FT4 0.33 ± 0.04 0.32 ± 0.07* 0.001 TPOAb, n (%) 73 (10.38) 22 (6.98) 0.071 TGAb, n (%) 88 (12.51) 30 (9.52) 0.126 SCH, n (%) 105 (14.93) 53 (16.82) 0.525 TAI, n (%) 106 (15.07) 36 (11.42) 0.090 Note. *Compared with the MS (−) group. TSH: thyroid stimulating hormone; FT3: free triiodothyronine; FT4: free thyroxine; TPOAb: antibody to thyroid-peroxidase; TGAb: antibody to thyroglobulin; SCH: Subclinical hypothyroidism; TAI: thyroid autoimmunity. Table 2. The thyroid function, thyroid diseases in MS (-) and MS (+) groups
To comprehensively analyze the influence of MS and obesity on thyroid function and thyroid diseases, subjects were divided into different groups according to their metabolic statuses and BMIs. In MS (-) subjects, the obesity group had higher levels of TSH than those in the overweight and normal groups (Table 3). Meanwhile, obesity remained a risk factor for SCH and TAI after controlling for age and gender in MS (-) subjects (Supplementary Table S6 available in www.besjournal.com). However, the effect of obesity on thyroid diseases and thyroid function was insignificant in MS (+) subjects (Supplementary Table S7 available in www.besjournal.com).
Variable MS (−) P MS (+) P Normal BMI
(n = 280)Overweight
(n = 283)Obesity
(n = 140)Normal BMI
(n = 29)Overweight
(n = 146)Obesity
(n = 140)Gender Male 97 88 28 7 35 45 Female 183 195 112 0.008 22 111 95 0.275 Age (y) 51.01 ± 6.24 51.13 ± 5.24 51.56 ± 5.14 0.634 52.97 ± 4.87 52.49 ± 4.97 52.47 ± 4.81 0.879 TSH (μIU/mL) 2.14 (1.54−2.92) 2.31* (1.65−3.48) 2.39* (1.71−3.67) 0.014 2.55 (1.75−2.97) 2.30 (1.75−3.55) 2.69 (1.82−3.84) 0.259 FT3 (pmol/L) 5.32 ± 0.84 5.34 ± 1.38 5.20 ± 0.60 0.452 5.18 ± 0.70 5.19 ± 0.50 5.19 ± 0.57 0.988 FT4 (pmol/L) 16.16 ± 2.72 16.11 ± 3.36 15.64 ± 2.95 0.219 16.60 ± 3.06 16.57 ± 2.26 16.84 ± 2.63 0.650 TPOAb, n (%) 23 (8.21) 27 (9.54) 23 (16.42) 0.066 1 (3.44) 6 (4.10) 15 (10.71) 0.052 TGAb, n (%) 31 (11.07) 30 (10.60) 27# (19.28) 0.094 3 (10.34) 12 (8.21) 15 (10.71) 0.672 SCH, n (%) 30 (10.71) 47 (16.60) 28 (20) 0.068 3 (10.34) 22 (15.06) 28 (20) 0.242 TAI, n (%) 37 (13.21) 36 (12.72) 33*# (23.57) 0.031 3 (10.34) 12 (8.21) 21 (15) 0.145 Note. *Compared with the normal BMI group, #compared with the overweight group. TSH: thyroid stimulating hormone; FT3: free triiodothyronine; FT4: free thyroxine; TPOAb: antibody to thyroid-peroxidase; TGAb: antibody to thyroglobulin; SCH: Subclinical hypothyroidism; TAI: thyroid autoimmunity. Table 3. Thyroid function and thyroid diseases in different metabolic statuses and different BMIs
Variable Crude OR (95% CI) P Adjusted OR (95% CI) P SCH BMI Normal BMI Reference Reference Overweight 1.64 (1.00–2.69) 0.050 1.54 (0.93–2.57) 0.091 Obesity 2.34 (1.32–4.15) 0.004 1.92 (1.06–3.46) 0.029 TAI BMI Normal BMI Reference Reference Overweight 1.02 (0.62–1.67) 0.937 0.98 (0.59–1.64) 0.965 Obesity 2.24 (1.31–3.81) 0.003 1.99 (1.15–3.46) 0.013 Note: Adjusted OR: adjusted by age and gender. Table S6. The risks of thyroid diseases according to the BMI status in MS (-) subjects
Variable Crude OR (95% CI) P Adjusted OR (95% CI) p SCH BMI Normal BMI Reference Reference Overweight 1.53 (0.42–5.51) 0.509 1.54 (0.42–5.58) 0.508 Obesity 2.16 (0.61–7.66) 0.231 2.34 (0.65–8.41) 0.189 TAI BMI Normal BMI Reference Reference Overweight 0.77 (0.20–2.94) 0.709 0.77 (0.20–2.95) 0.710 Obesity 1.52 (0.42–5.51) 0.516 1.62 (0.44–5.87) 0.462 Note. Adjusted OR: adjusted by age and gender. Table S7. The risks of thyroid diseases according to the BMI status in MS (+) subjects
Due to the aging population, increases in life expectancy, and changing lifestyles, obesity and its associated diseases have become a public problem. The relationship between obesity and MS was confirmed in the current study and also in the published literature[3]. The underlying mechanisms mainly involve lipidic toxicity, fat accumulation, insulin resistance, oxidative stress, and inflammatory factors. Although obesity is closely related to MS, obesity and MS had a weak consistency in this study. Thus, this study analyzed the effects of obesity and MS on thyroid diseases separately.
It is well known that obesity is closely associated with hypothyroidism, suggesting that obesity may be related to thyroid function. This study also discovered that obese subjects had higher TSH and a higher prevalence of SCH than subjects in the normal group. This is consistent with studies by Stichel and other researchers[4]. The positive relationship between obesity and high TSH may be related to a compensatory enhancement of TSH because of a reduced expression of the TSH receptor gene in adipose and a high level of thyrotropin-releasing hormone induced by high levels of leptin in obese patients. Similar to Song et al.[5], this study also found that the obesity group had a higher prevalence of TAI and TPOAb than the normal group, but had no effect on TGAb levels. The relationship between obesity and TPOAb may be not only related to the high levels of IL-6 and tumor necrosis factorα (TNF-α) in obese patients, but also high levels of leptin which can suppress the functions of T-regulatory cells and in turn increase TPOAb production. Furthermore, this study also found that the effect of obesity on thyroid diseases was more significant in MS (-) subjects than in MS (+) subjects. Because severe obesity is more likely to lead to MS, early intervention of obesity may be a more economical way to deal with high prevalence of thyroid diseases. Furthermore, this manner is effective because some researchers had confirmed that thyroid function can return to normal after weight loss[6].
Similar to the findings of Ifeoma et al.[7], this study found that MS was not a risk factor for SCH and TAI. A meta-analysis of eight studies by Eftekharzadeh et al. also found that MS was not associated with SCH[8]. However, a cohort study of 66,822 adults by Chang et al. reported that subjects with MS had higher incidences of SCH than subjects without MS[9]. The inconsistent results of MS on SCH may be due to the different study populations, different inclusion or exclusion criteria, and different diagnostic standards of diseases. Although there may be some associations between MS and TAI in theory, this study did not find their association even in different age subgroups or gender subgroups and additional epidemiological investigations are needed to clarify their relationships. The effects of MS on thyroid diseases are different from obesity which may be due to some different pathogenic mechanisms in two diseases. For example, there are some special types of MS caused by single gene mutations which accompanied by obvious insulin resistance and without obesity[10].
The strengths of our study included the following: 1) Previous studies separately analyzed the effects of obesity and metabolic syndrome on thyroid diseases and this study systematically analyzed their relationships in a cross-sectional study. 2) The effects of MS on TAI had not been reported before and the finding in this study can help us better understand the pathogenesis of thyroid diseases.
The limitations of our study included the following: 1) This was a cross-sectional study, and therefore, the causal relationships between obesity, MS and thyroid diseases could not be determined. Prospective studies are needed to verify such relationships. 2) Females made up a large proportion of the study population and this may have influenced the stability of the results in a certain extent. This study adopted the Ochran-Mantel-Haenszel test and Logistic Regression analyses to control for the effects of gender.
This study concluded that obesity, rather than MS, was a risk factor for SCH and TAI. Moreover, the effect of obesity on thyroid diseases was more significant in MS (-) subjects than in MS (+) subjects.
HTML

 20421Supplementary Materials.pdf
|

|

 Quick Links
 DownLoad: