

-
At the end of December 2019, a novel infectious respiratory syndrome outbreak named the Coronavirus Disease 2019 (COVID-19) spread rapidly, affecting all continents with more than 120,000,000 cases and causing more than 2,500,000 deaths worldwide[1].
Several authors have reported that the number of deaths attributed to COVID-19 varies with meteorological factors, such as temperature and humidity[2]. This variation in fatalities may encompass two different meteorological factor effects: an enhancement of the virus transmission between individuals[3–6], or an increase in the fatality rate within infected individuals. Both of these aspects are essential. Knowledge on meteorological factors that may favor virus transmission is important for prevention. For instance, breathing dry and cold air might lead to bronchial constriction and decreased mucociliary clearance, thereby increasing respiratory virus infection susceptibility[7]. Non-biological mechanisms may also enhance viral transmission, such as indoor crowding and poor ventilation on cold days[8]. Knowledge of meteorological factors that influence the fatality of infections may yield insights into the mechanisms involved in fatal infections. For example, the latter could depend on concurrent infections by other microorganisms with a peak incidence depending on certain meteorological factors or could rely on greater viral inocula upon exposure to SARS-CoV-2[9].
While several studies have investigated whether meteorological factors may increase the transmission of the virus, to our knowledge, no studies have investigated whether meteorological factors may increase the infection fatality rate (IFR). The latter is the proportion of deaths among all SARS-CoV-2 infected individuals, including all asymptomatic and undiagnosed subjects. The IFR is different from the more investigated "case fatality rate," which is the proportion of deaths among people diagnosed with COVID-19. Meteorological factors will likely have different effects on SARS-CoV-2 transmission, COVID-19 mortality, COVID-19 case fatality rate, and SARS-CoV-2 IFR. It is necessary to know these different effects to obtain an overall picture and plan based on a solid foundation.
In this study, we accurately estimated the IFR of each Spanish province and used Spearman correlations to explore potential associations of several meteorological factors with the IFR across the provinces during the 2020 winter/spring peak of the pandemic (weeks 10–16 of 2020).
-
In this study, we focused on the first wave because it was safe to assume that: a) all populations were at risk of infection, and b) all subsequent SARS-CoV-2 serologically positive individuals had an infection during the wave. In successive waves, a non-negligible part of the population would be immune, and only a part of the subsequent SARS-CoV-2 serologically positive individuals would have had the infection during the wave, hampering the estimations.
On the other hand, we focused on Spain because: a) it was one of the most affected countries during the first wave of the disease[10] likely partly due to its aging population (Table 1); b) it is varied enough to have variable climates (Table 2), and c) the government conducted a large and accurate population-representative SARS-CoV-2 serologic study after the first wave[11].
Province Population Age ($\bar x $ ± SD) Females (%) Serological test sample A Coruña 1,123,482 47.2 ± 23.5 52.0 1,275 Alacant 1,885,215 43.8 ± 23.2 50.4 1,573 Albacete 389,830 43.6 ± 23.4 50.0 1,059 Almería 715,405 40.4 ± 22.7 49.4 985 Araba 329,856 44.6 ± 23.7 51.0 686 Asturias 1,018,777 48.5 ± 23.2 52.2 1,545 Ávila 158,930 47.6 ± 24.2 49.6 665 Badajoz 670,782 43.7 ± 23.4 50.6 1,585 Barcelona 5,635,042 43.0 ± 23.4 51.5 3,693 Bizkaia 1,142,920 46.1 ± 23.7 51.9 1,194 Burgos 355,778 46.7 ± 23.8 49.8 883 Cáceres 390,987 46.3 ± 23.7 50.1 1,202 Cádiz 1,254,632 41.9 ± 22.7 50.4 1,382 Cantabria 582,356 45.8 ± 23.3 51.3 1,504 Castelló 574,902 43.5 ± 23.3 50.4 801 Ceuta 84,030 38.0 ± 22.5 49.4 829 Ciudad Real 494,128 44.1 ± 23.6 50.5 1,162 Córdoba 784,257 43.5 ± 23.4 51.0 1,118 Cuenca 199,829 45.8 ± 23.9 49.5 850 Girona 767,120 42.4 ± 23.4 50.2 904 Granada 925,059 42.6 ± 23.1 50.5 1,007 Guadalajara 262,405 41.8 ± 23.0 49.2 815 Gipuzkoa 716,530 45.2 ± 23.9 51.4 950 Huelva 528,058 41.9 ± 22.7 50.7 929 Huesca 220,656 45.6 ± 24.0 49.5 732 Illes Balears 1,210,747 41.7 ± 22.2 50.0 1,356 Jaén 628,842 43.7 ± 23.4 50.4 1,056 La Rioja 315,928 44.6 ± 23.7 50.7 1,323 Las Palmas 1,151,351 42.3 ± 21.6 50.3 1,242 León 459,138 49.1 ± 23.7 51.3 884 Lleida 435,603 43.5 ± 23.6 49.3 710 Lugo 328,154 49.9 ± 23.9 51.5 814 Madrid 6,747,422 42.5 ± 23.1 52.1 3,185 Málaga 1,683,270 42.4 ± 22.8 50.9 1,463 Melilla 84,496 35.7 ± 22.8 49.7 927 Murcia 1,504,608 40.8 ± 22.9 50.0 1,387 Navarra 656,485 43.4 ± 23.7 50.6 1,737 Ourense 306,802 50.8 ± 24.0 51.8 686 Palencia 159,846 48.2 ± 23.6 50.4 740 Pontevedra 943,806 45.9 ± 23.3 51.5 1,295 Salamanca 331,049 48.3 ± 24.1 51.3 807 Santa Cruz de Tenerife 1,085,957 43.4 ± 22.1 50.7 1,082 Segovia 154,230 45.9 ± 23.9 49.7 539 Sevilla 1,957,196 41.6 ± 22.8 51.1 1,786 Soria 89,913 47.5 ± 24.4 49.2 705 Tarragona 814,300 42.9 ± 23.4 50.1 1,011 Teruel 133,291 46.6 ± 24.3 49.3 685 Toledo 699,195 42.4 ± 23.5 49.5 1,180 València 2,568,534 43.4 ± 23.2 51.1 1,912 Valladolid 520,716 46.2 ± 23.5 51.2 1,082 Zamora 171,629 50.9 ± 23.9 50.3 644 Zaragoza 976,494 44.5 ± 23.6 51.1 1,331 Table 1. Description of the Spanish provinces and the sample of the serological study
Item Mediana 5%−95% percentilea Meteorological factors Temperature (°C) Average 13 9−16 Minimum 8 4−14 Maximum 17 14−21 Humidity Relative (%) 76 67−83 Dew point (°C) 8 4−12 Solar irradiance Maximum ultraviolet index (0−11+) 5 4−6 Diffuse horizontal (W/m2) 45 44−47 Global horizontal (W/m2) 253 240−270 Pressure (millibar) Surface 986 911−1,016 Sea level 1,017 1,015−1,018 Wind Average speed (m/s) 4 3−5 Maximum speed (m/s) 7 6−8 Gust speed (m/s) 7 6−8 Average direction (degrees) 175 140−208 Maximum direction (degrees) 330 285−360 Precipitation (mm) Average 0.2 0.0−1.5 GPM 0.2 0.0−0.8 Cloud coverage (%) Average 68 57−74 SARS-CoV-2 variables Number of deaths Raw excess 328 10−1,383 Likely due to COVID-19 445 82−1,451 Likely prevented by the lockdown 125 23−461 Seroprevalence (%) Raw 3.3 1.5−12.0 Infection fatality rate Raw 1.5 0.1−3.2 Adjusted for age×sex and considering the
deaths prevented by the lockdown2.0 0.8−3.3 Note. aGiven the lack of normality of some variables, we found it more appropriate to report the median and percentiles (across provinces). GPM, gallons per minute. Table 2. Descriptive data on meteorological factors and SARS-CoV-2 variables (adjusted for age-sex distribution) during the study period (weeks 10−16 of 2020)
-
The number of COVID-19 deaths is unknown. Deaths in individuals infected by SARS-CoV-2 may be due to other causes, especially as most deaths occur in people with pre-existing diseases. Conversely, official statistics may have attributed many COVID-19 deaths to other causes, such as nonspecific pneumonia[12]. A recent article by Faust et al.[13] showed that in the United States, only 38% of all-cause excess deaths (the gap between observed and expected deaths) in adults between 25 and 44 years recorded during the pandemic were officially attributed to COVID-19. It is reasonable to assume that a similar failure to diagnose occurred in Spain, where less than 2% of COVID-19 cases were tested[12]. To circumvent this uncertainty, we estimated the number of deaths as excess deaths compared to the previous year's same period. We retrieved this information separately for each 5-year age range and sex stratum within each province from the Spanish National Statistics Institute[14].
However, the differences in mortality between the investigated period and the same period of the previous year might also depend on the short-term protective effects of lockdown restrictions on causes of death unrelated to COVID-19. The government obliged most individuals to stay at home and forbid most work activities, leading, for example, to lower pollution levels[15] and decreased car accidents[16]. Notably, the Spanish government applied the same lockdown restrictions in all regions. Therefore, these protective effects should be similar across provinces and unrelated to the prevalence of the infection.
To estimate these prevented COVID-19-unrelated deaths, we modeled the excess deaths as:
$$\begin{split} &\left[ {{\rm{excess}}\;{\rm{deaths}}} \right] = \left[ {{\rm{COVID - 19}}\;{\rm{deaths}}} \right] -\\ &\left[ {{\rm{prevented}}\;{\rm{COVID - 19 - unrelated}}\;{\rm{deaths}}} \right]\end{split}$$ (1) We used standard least-squares minimization to fit the model. In each iteration of the minimization, we estimated the excess deaths in each province as the multiplication of the stratum SARS-CoV-2 seropositive individuals (see section 2.2. Number of infections) and country-level IFR odds. We also estimated the province-prevented-COVID-19-unrelated deaths by multiplying the province population and a country-level constant. Finally, we calculated the squared difference between the estimated excess deaths and observed excess deaths. Given that both IFR and the prevented COVID-19-unrelated deaths might depend on age and sex, we performed this correction after adjusting for the demographic distribution (see section 2.4. Adjustment for varying age × sex distributions across provinces).
-
We estimated the number of infections as the sum of the estimated SARS-CoV-2 seropositive individuals and the estimated COVID-19 deaths. We obtained seroprevalence (proportion of persons with detected SARS-CoV-2 antibodies) data from a large national study conducted by the National and regional ministries of health and the Instituto de Salud Carlos III. The study included 60,897 individuals representing the population (Table 1) tested between April 27 and May 11, 2020[11], approximately two weeks after the investigation period. The researchers conducted two-stage random sampling stratified by province and municipality size, reporting precise estimates of the seroprevalence for the 52 provinces and strata of a 5-year age range and sex at the national level. To estimate the number of seropositive individuals in a given age × sex stratum within a given province, we multiplied the estimated seroprevalence by the number of persons. Population data were retrieved from the Spanish National Statistics Institute[17].
-
We estimated the IFR of a province as:
$$ IFR = \frac{{\left[ {{\rm{COVID - 19}}\;{\rm{deaths}}} \right]}}{{\left[ {{\rm{SARS - CoV - 2}}\;{\rm{infections}}} \right]}} $$ (2) Therefore, IFR was considered the mortality associated with SARS-CoV-2 infection (including symptomatic and asymptomatic cases).
-
Between-province differences in age × sex distribution might drive some between-province differences in IFR. Some regions have a significant percentage of older individuals, who are more vulnerable to COVID-19, and thus show substantially higher IFR. In contrast, other areas have younger populations that may be more resilient to SARS-CoV-2 infection and have a lower IFR.
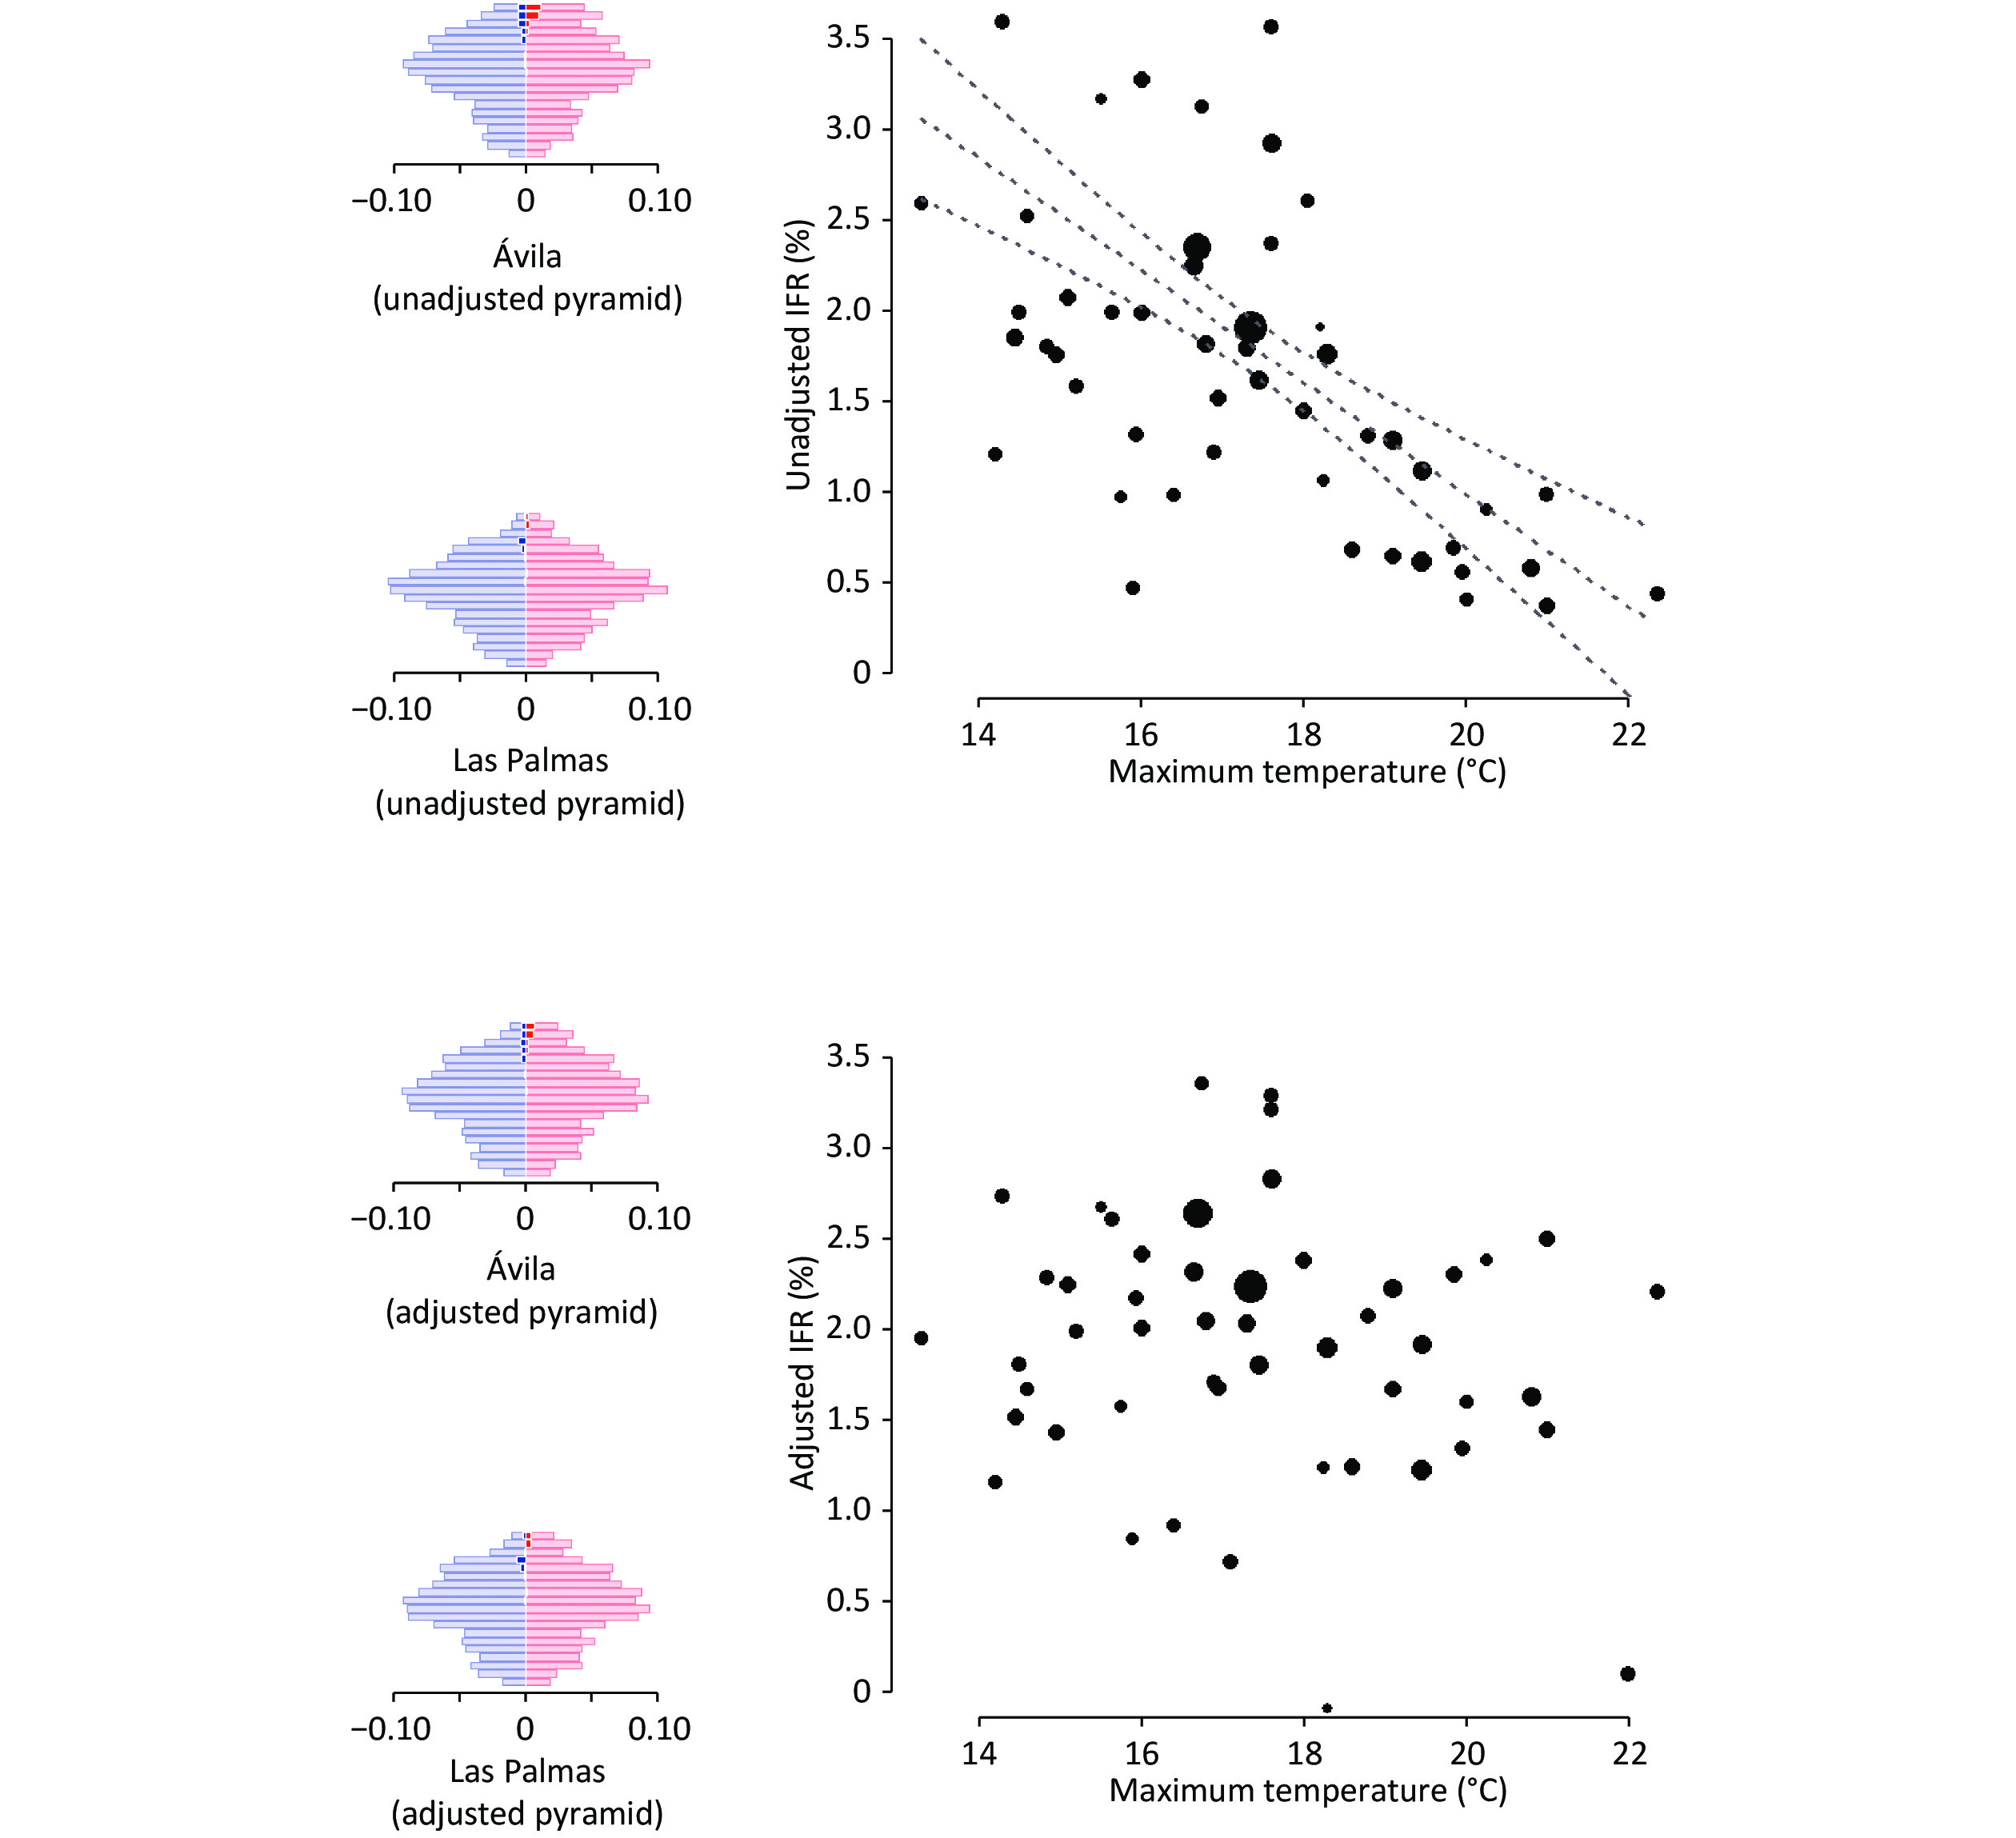
To avoid these confounding effects, we adjusted the number of deaths and infections in each province's stratum to match the age-sex distribution in the whole Spanish population (Figure 1). For instance, the percentage of ≥ 90-year-old men in Barcelona was 0.33047%, while it was 0.35573% in the rest of Spain (1.0764 times more). Thus, we multiplied the deaths and infections of this stratum in Barcelona by 1.0764.

Figure 1. Association between temperature and SARS-CoV-2 infection fatality rate (IFR) before and after adjusting for differences in age and sex and considering COVID-19-unrelated deaths prevented by lockdown measures. We also show the population pyramids of the individuals infected with SARS-CoV-2 in two example provinces: one with an older population and colder weather (Ávila, in central Spain and with the highest capital above sea level), and one with a younger population and warmer weather (Las Palmas, in the Canary Islands, close to the African mainland). In the pyramids, each row represents a 5-year age range, the width of the left/blue part is proportional to the age stratum size in males, and the width of the right/red part is proportional to the age stratum size in females. The dark blue and dark red parts represent the estimated excess deaths.
-
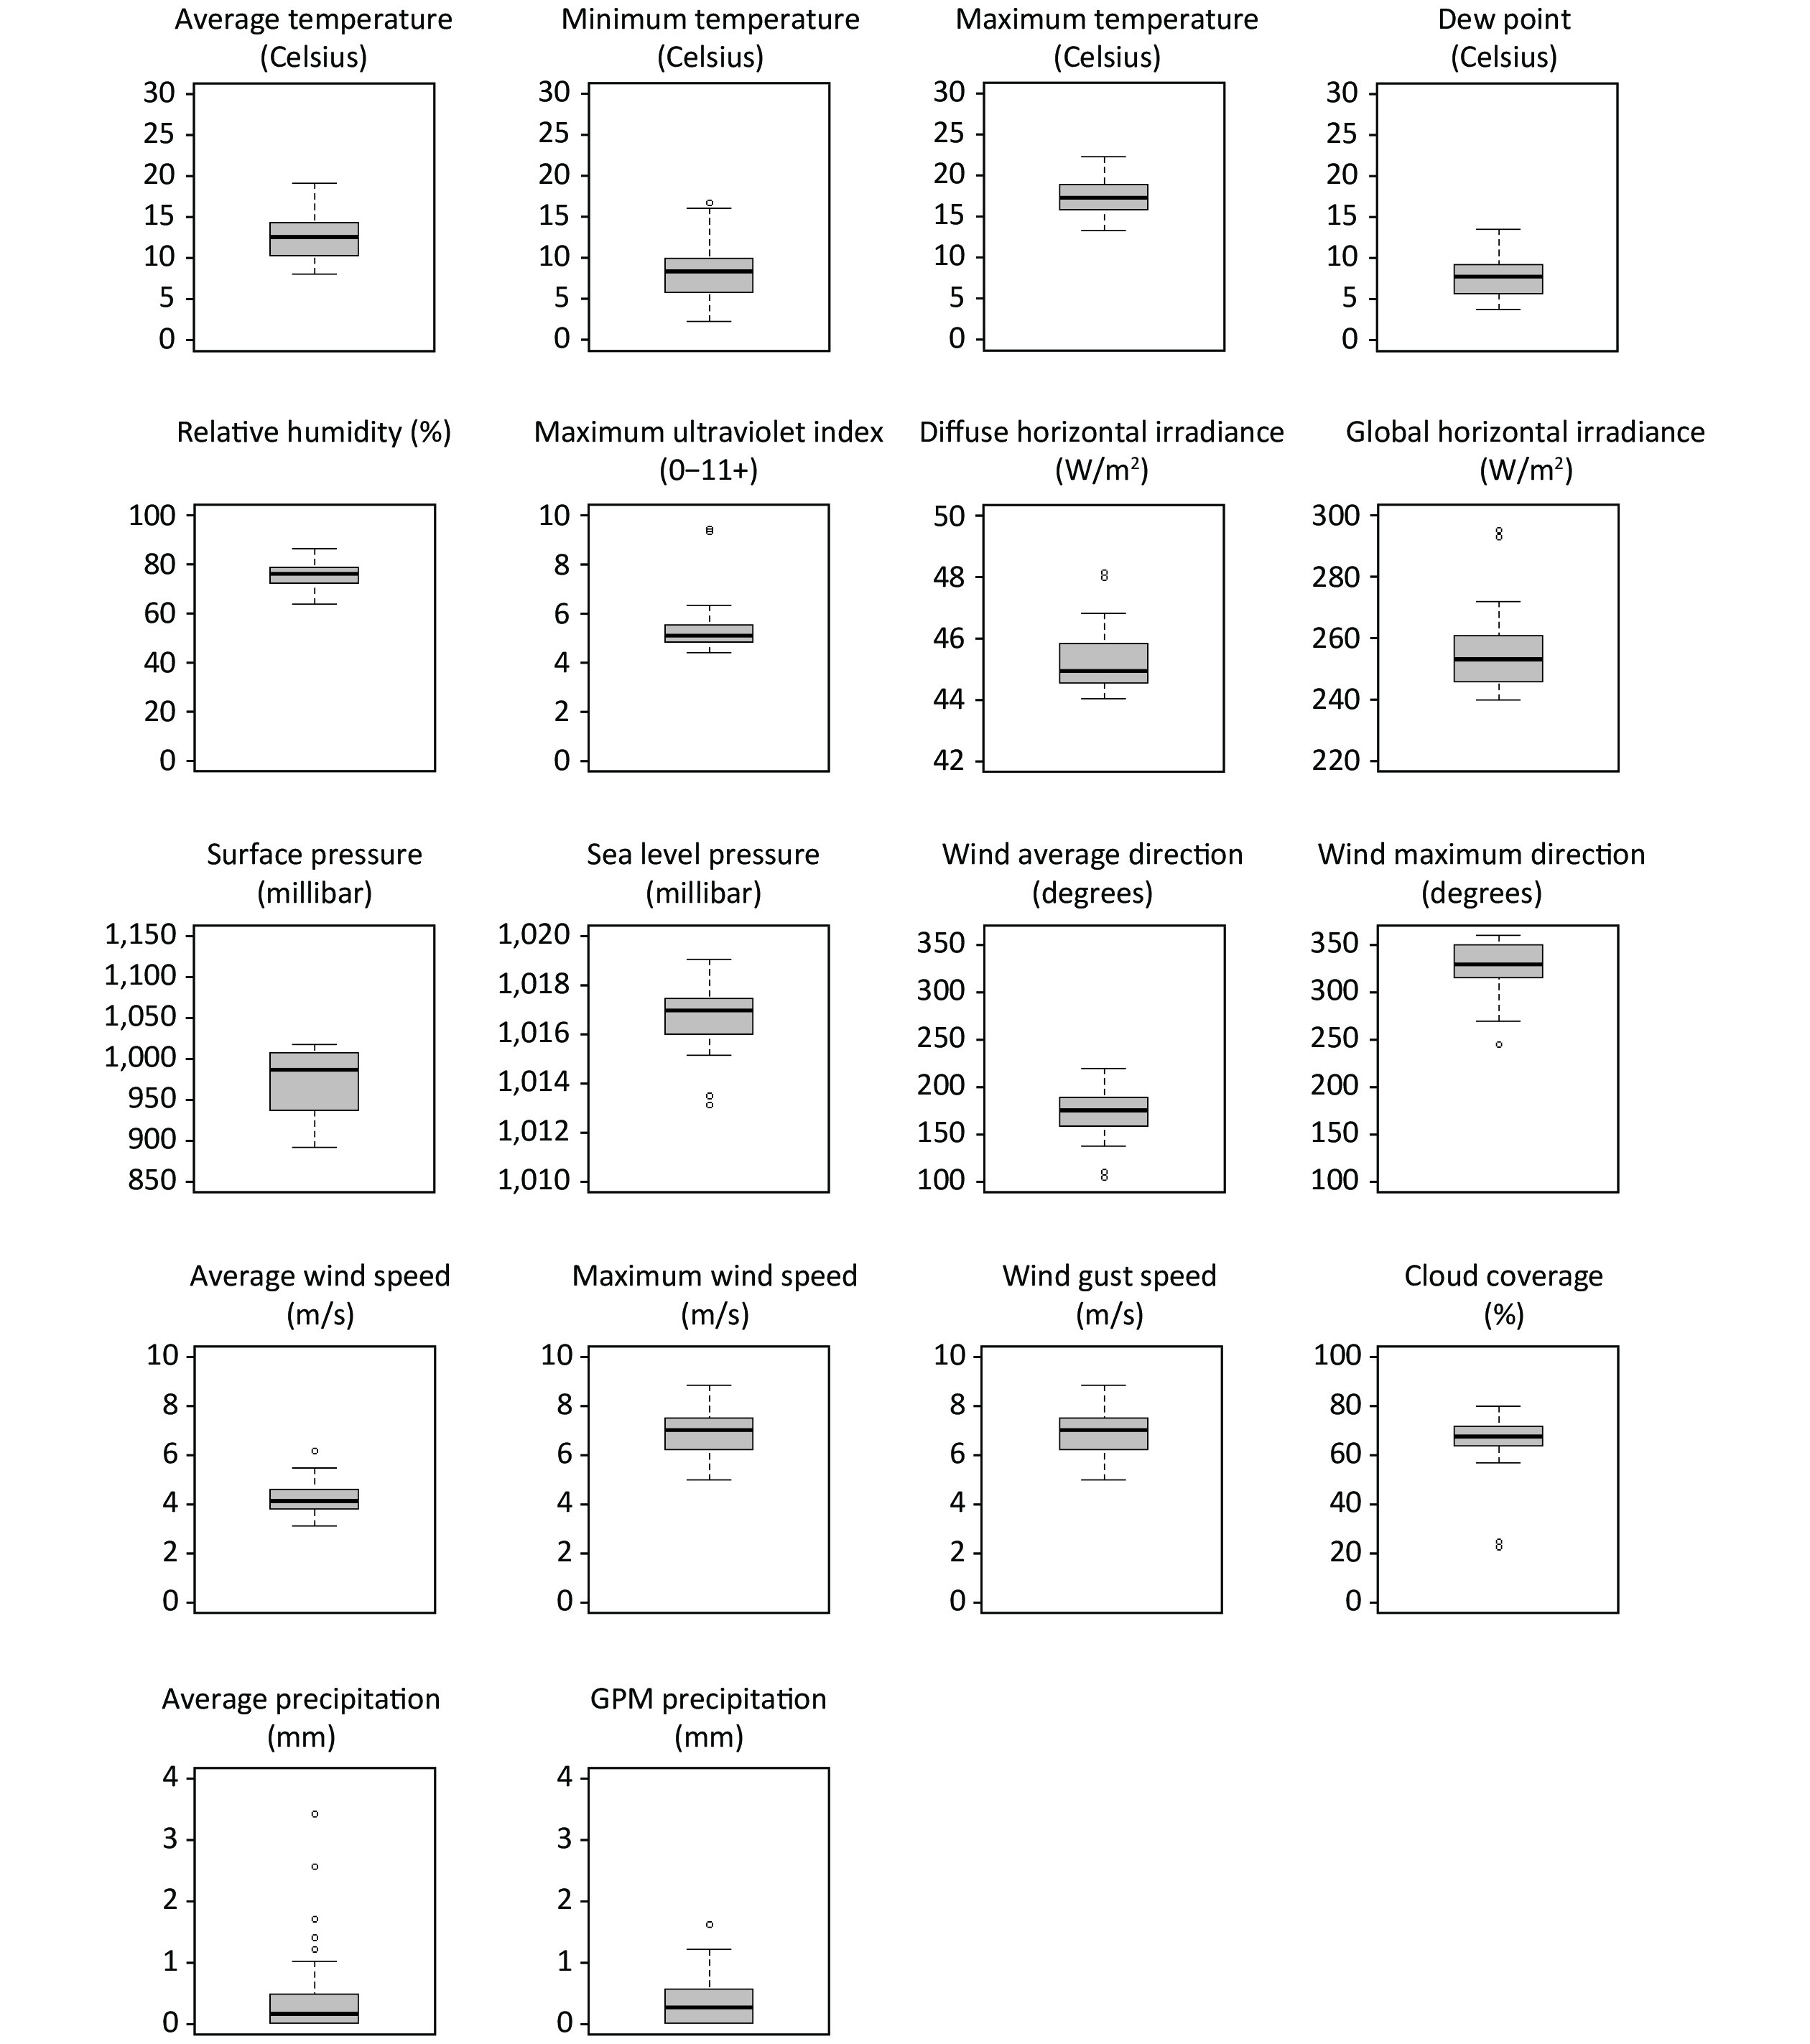
As in previous work[3], we accessed the Weatherbit application-programming interface (weatherbit.io) to compile geolocalized information on daily measures of the meteorological factors during weeks 10–16 of 2020 and averaged the daily measures. This application contains historical data from multiple weather stations. We included average, minimum, and maximum temperature (°C); average relative humidity (%) and dew point (°C); maximum ultraviolet index (0–11+) and average diffuse and global horizontal solar irradiance (W/m2); average surface and sea level pressure (millibar); average and maximum 2-minute wind speed and direction (m/s and degrees) and wind gust speed (m/s); average precipitation (mm); and cloud coverage (%) (Figure 2).
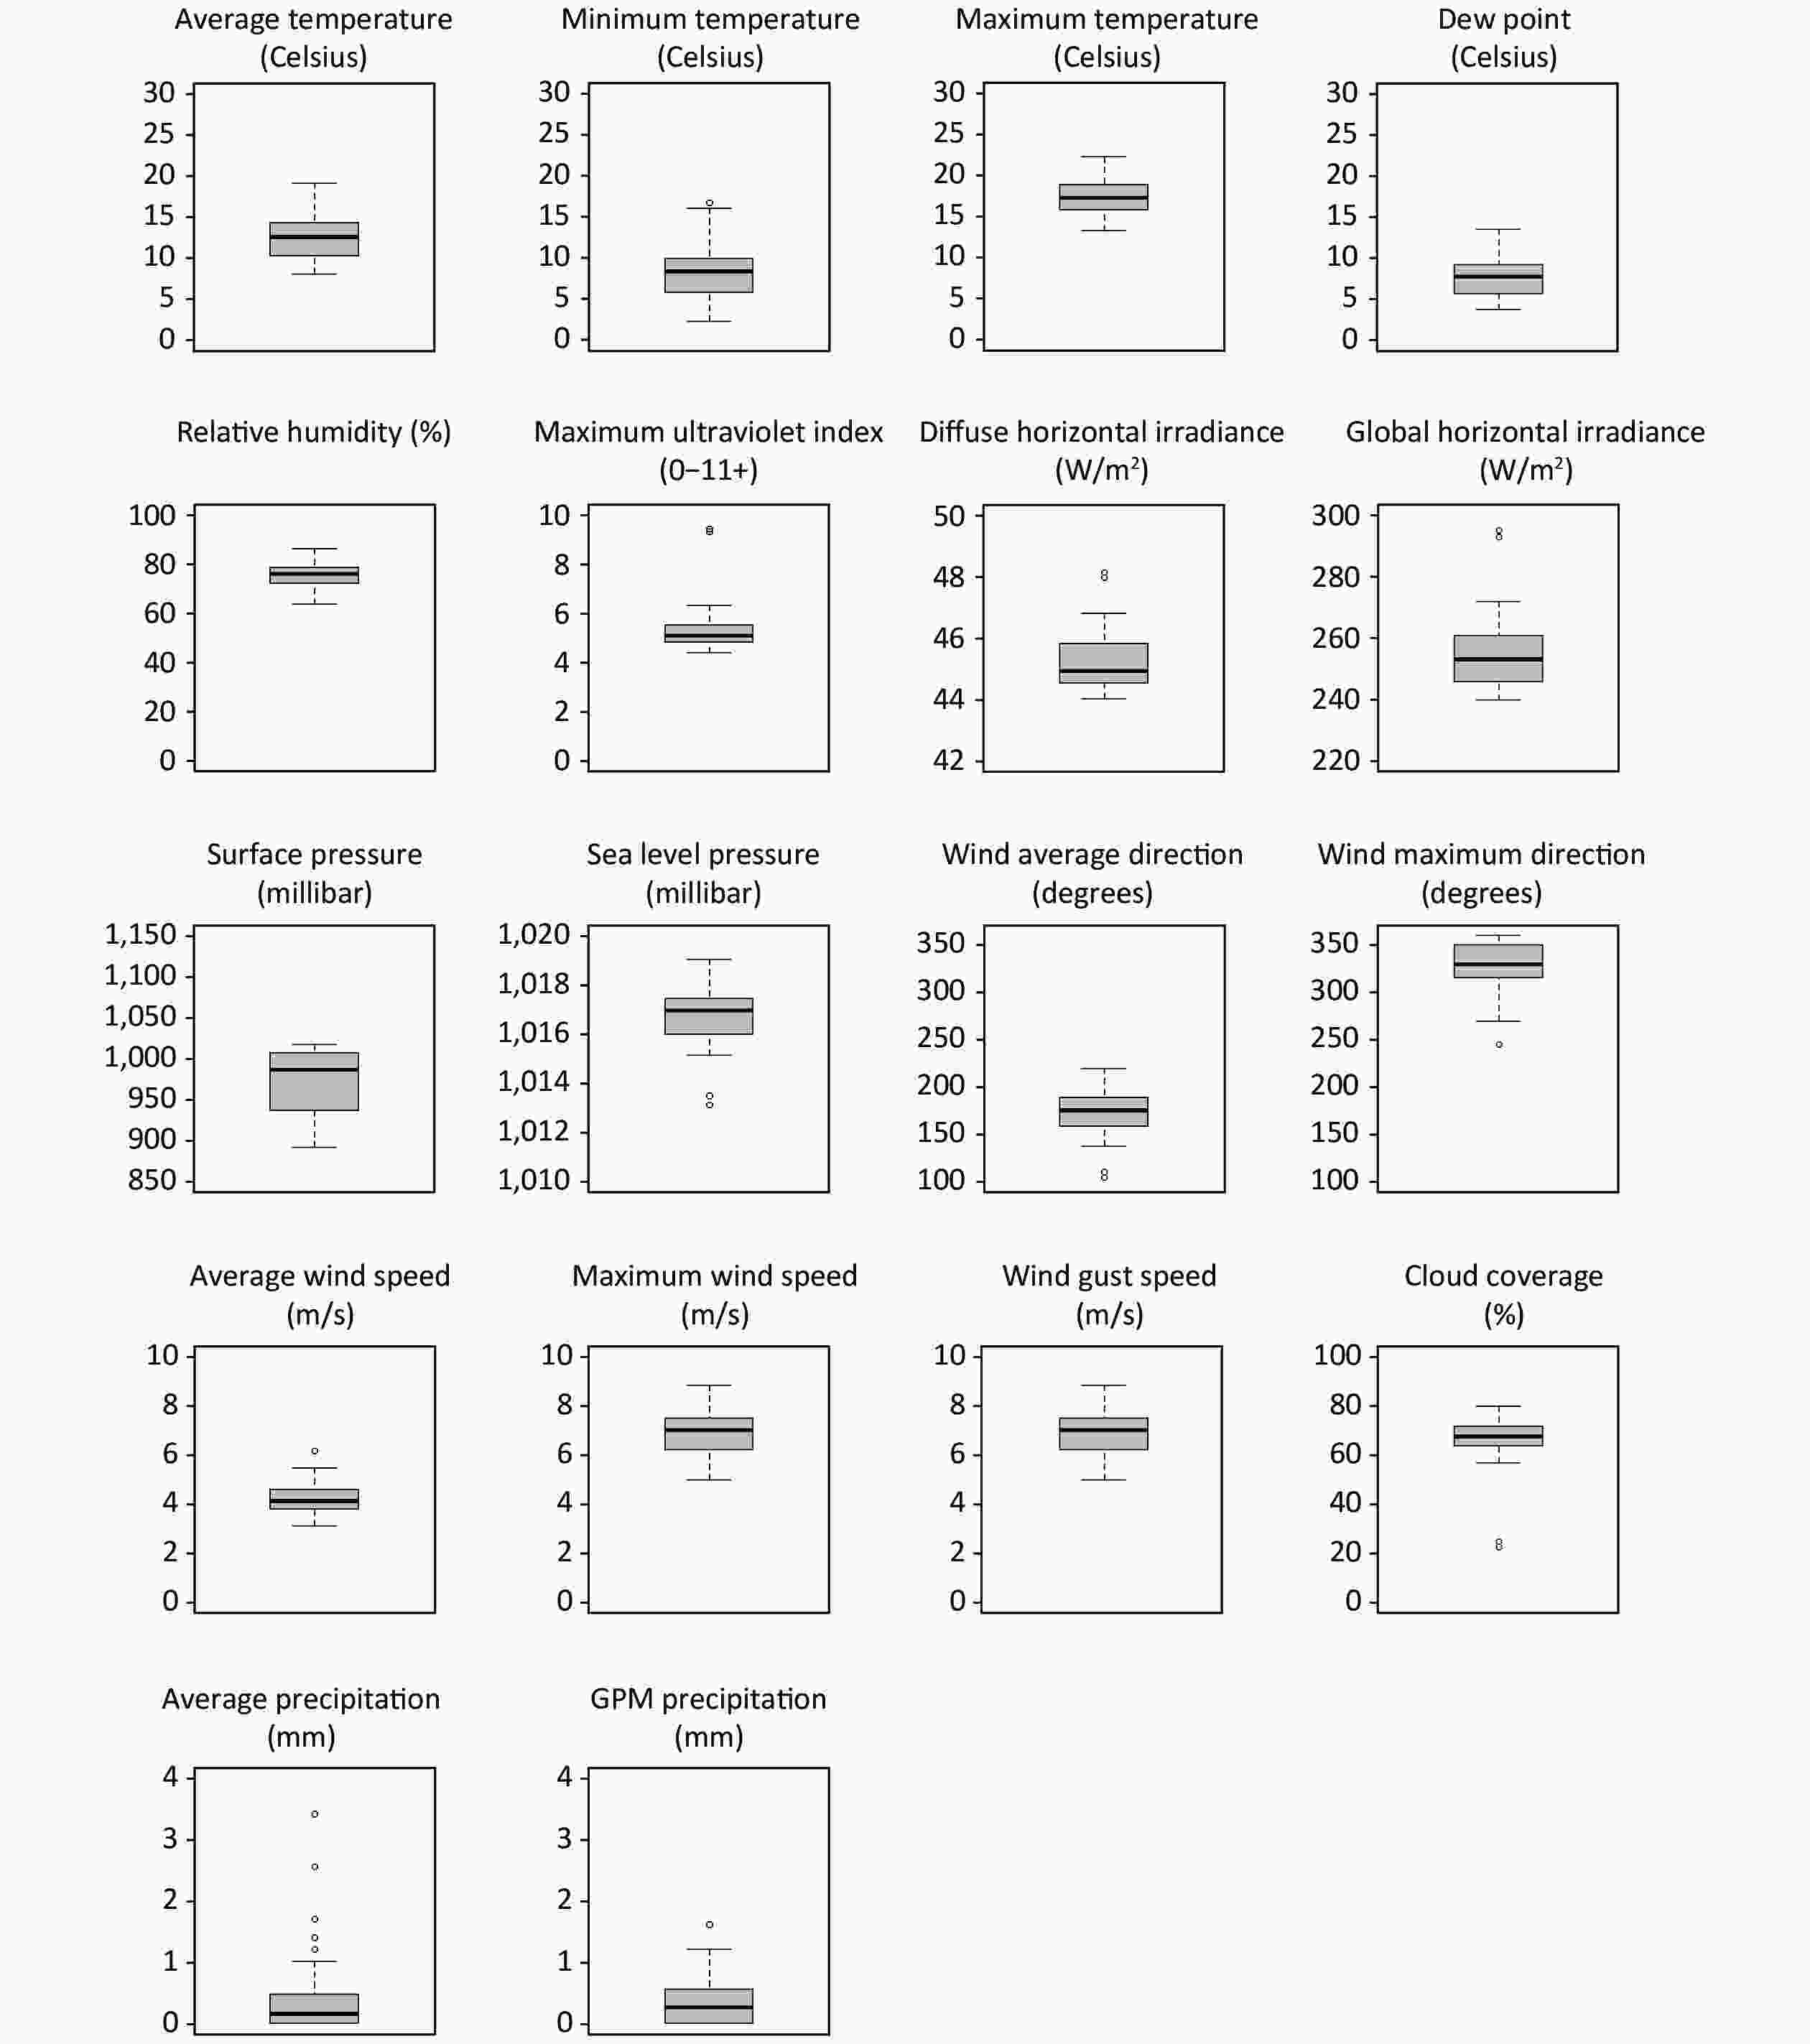
Figure 2. Boxplots of the climatic meteorological factors across the 52 Spanish provinces during the study period (weeks 10−16 of 2020). GPM, gallons per minute.
Meteorological factors might have little influence on the illness after hospital admission, but the median time from hospital admission to death was only one week[18]. Similarly, some patients might have incurred infection several days before the investigated interval. However, the weather on the days before the interval should be similar to the average weather during the interval. For these reasons and the sake of simplicity, we discarded lagged analyses.
-
We tested the potential relationship between each meteorological factor and IFR using Spearman correlations, correcting multiple testing using the false discovery rate method. All analyses were conducted using R version 4.0[19].
-
The estimated excess deaths were 43,237, and the estimated number of infections when ignoring the protective effects of lockdown measures was 2,418,250, resulting in a country-level unadjusted IFR of 1.8%. The effect of age on IFR was very large: IFR was 0.03% in < 50-year-old, 0.22% in 50–59-year-old, 0.9% in 60–69-year-old, 3.3% in 70–79-year-old, 12.6% in 80–89-year-old, and 26.5% in ≥ 90-year-old. Conversely, the IFR was similar in men and women (1.9% and 1.7%, respectively).
The unadjusted IFR (i.e., without considering the demographic differences between provinces and the COVID-19-unrelated deaths) varied significantly between provinces (5%–95% percentiles: 0.1%–3.2%). A critical portion of this variability disappeared when we adjusted the analyses for age×sex and considered the COVID-19-unrelated deaths prevented by lockdown measures (5%–95% percentiles: 0.8%–3.3%). In some provinces with older populations, such as Salamanca (mean age = 48.3 years), a larger proportion of older people had inflated the unadjusted IFR to > 3%. After age×sex adjustment, the IFR decreased to 2%–3%. Conversely, in some provinces with younger populations, such as Murcia (mean age = 40.8 years), a smaller proportion of young people shrunk the unadjusted IFR to < 1%. After age×sex adjustment, the IFR increased to 2%–3%. Similarly, in some provinces with smaller seroprevalence, such as Pontevedra (seroprevalence = 2.3%), the prevented COVID-19-unrelated deaths counteracted the small number of COVID-19 deaths, to the point that the unadjusted IFR was < 0%. After considering the prevention of COVID-19-unrelated deaths, the IFR increased to nearly 1%.
When we adjusted the IFR for age×sex and considered the prevented COVID-19-unrelated deaths, the estimated COVID-19 deaths increased to 52,630, and the country-level adjusted IFR to 2.2%. These adjustments also changed the provinces' relative positions in the IFR, to the point that the correlation between unadjusted and adjusted IFR was only 0.7.
The unadjusted IFR showed strong relationships with several meteorological factors (Table 3), as well as with seroprevalence (Spearman rho = 0.53, P < 0.001). None of these associations were statistically significant when adjusting for age×sex and considering the prevention of COVID-19-unrelated deaths.
Variables Spearman’s rho P-valuea Unadjusted IFR Maximum temperature (Celsius) −0.60 < 0.001 Average temperature (Celsius) −0.58 < 0.001 Average dew point (Celsius) −0.55 < 0.001 Minimum temperature (Celsius) −0.54 < 0.001 Average diffuse horizontal irradiance (W/m2) −0.54 < 0.001 Maximum ultraviolet index (0−11+) −0.50 0.001 Average pressure (mb) −0.48 0.001 Global horizontal solar irradiance −0.35 0.026 Cloud coverage 0.32 0.042 Adjusted IFR (for age-sex distribution and considering
COVID-19-unrelated deaths prevented by the lockdown) (none)Note. aCorrected for multiple testing using the false discovery rate method. Table 3. Association of meteorological factors with SARS-CoV-2 infection fatality rate
-
This study explored the association between meteorological factors and SARS-CoV-2 IFR across 52 Spanish provinces during the pandemic's 2020 winter/spring peak. Several meteorological factors showed a significant association with the unadjusted IFR, but none remained significant after adjusting for age×sex and considering the COVID-19-unrelated deaths prevented by lockdown restrictions.
Thus, our results highlight the importance of adjusting for age-sex distribution when comparing COVID-19 mortality across regions. We hypothesize that a likely reason why the analyses without adjusting for age differences led to a spurious correlation between maximum temperature and IFR might be that colder provinces had older people. To obtain more information about the relationship between age distribution and temperature, we correlated each province's maximum temperature with the percentage of individuals above a given age. Effectively, colder regions had more older individuals; this relationship was maximum when we set the threshold at 90-years: the correlation between maximum temperature and percentage of ≥ 90-year-old individuals indicated a Spearman rho value of −0.81 (P < 0.001). The increase in the proportion of older people in cold provinces is beyond the scope of this study. This increase might be related to diverse phenomena, such as the potential protective role of mild coldness or possible emigration of younger people from colder to warmer regions. The reasons why IFR is higher in older individuals might also vary, including frailty or even a higher susceptibility of nasal cuts, allowing more viral access to the bloodstream.
Our results also highlight the importance of considering COVID-19-unrelated deaths prevented by lockdown measures. We hypothesize that a likely reason why the analyses without considering these prevented deaths led to a plethora of findings might be that the unadjusted IFR was strongly correlated with seroprevalence. Previous studies have shown that meteorological factors modulate the incidence of the SARS-CoV-2 virus[3]. We suggest that the positive correlation between the unadjusted IFR and seroprevalence is likely a statistical artifact. In provinces with high prevalence, the number of prevented COVID-19-unrelated deaths was inferior to the number of COVID-19 deaths, causing only a slight reduction in the unadjusted IFR. Conversely, in provinces with low prevalence, the number of prevented COVID-19-unrelated deaths had a magnitude similar to the number of COVID-19 deaths, causing a massive reduction in the unadjusted IFR.
Alternatively, one might argue that if the actual COVID-19-unrelated deaths are sensibly inferior to our estimates, the IFR would be higher in provinces with high prevalence, possibly due to a health system's overload. The unprecedented increase in intensive care unit demand during the epidemic would support this possibility.
The role of meteorological factors in the COVID-19 pandemic is a critical topic to be investigated to address the threat of new waves of the virus. However, this role is still unclear, even concerning virus transmission. For example, early studies reported a negative correlation between temperature and new daily cases of COVID-19[20]. However, Kumar et al. recently provided evidence that high temperatures might not be associated with low transmissibility[21].
This study has some limitations. First, despite the variety of climates in Spain, the range of some meteorological factors was limited (Table 2), given that the investigated period only included late winter and early spring. Second, some COVID-19 deaths may have occurred after the analysis period. Third, some individuals with antibodies during the seroprevalence study might have had an infection outside the investigated period. Alternatively, some individuals infected during the analyzed period might not have developed antibodies at the time of the seroprevalence study; the latter possibility may be especially relevant. Some studies have found that many individuals do not produce antibodies, leading to the chance that the true IFR is substantially lower than that estimated in this study. Fourth, we could not discard potential differences between the sample of the serological survey and the population. However, these possible differences should be minimal, given that the serological study conducted a two-stage random sampling stratified by province and municipality size with all residents invited to participate[11]. Fifth, the use of excess deaths compared to the previous year's corresponding period may reduce the uncertainty concerning the official COVID-19 death toll, albeit with some uncertainty. Another potential cause of uncertainty is that excess death and infection information was obtained from different sources. Finally, we did not investigate the effects of air pollution variables, which would be of great interest. We preferred not to include them in this study because pollution levels might be very heterogeneous within a province (e.g., within the Madrid province, nitric oxide may range from 1 to 34 depending on the station)[22]. Conversely, meteorological factors generally have similar values within a province.
-
Recent studies have reported that the number of COVID-19 deaths varies with meteorological factors such as temperature and humidity. However, we show that the association between meteorological factors and COVID-19 deaths is unclear after adjusting for the age-sex distribution of the population and considering the COVID-19-unrelated prevented deaths.
We strongly suggest that other groups further explore the relationships between meteorological factors and SARS-CoV-2 IFR. Knowledge about the influence of meteorological factors on COVID-19 deaths will help prepare healthcare systems worldwide to know if the increase in transmission with cold temperatures will result in a proportional increase in severe cases, for example, or, conversely, the number of severe cases will increase more than the overall number of cases. In addition, to minimize the effects of the pandemic, we should focus on protecting the most vulnerable and highest-risk people that may be more affected by certain meteorological factors, for example, due to an increase in comorbid infections.
-
None.
-
SOLANES Aleix: Writing - review & editing. LAREDO Carlos: Conceptualization, Writing - review & editing. GUASP Mar: Conceptualization, Writing - review & editing. FULLANA Miquel Angel: Writing - review & editing. FORTEA Lydia: Writing - review & editing. GARCIA-OLIVÉ Ignasi: Writing - review & editing. SOLMI Marco: Writing - review & editing. Shin Jae Il: Writing - review & editing. URRA Xabier: Conceptualization, Writing - review & editing. RADUA Joaquim : Conceptualization, Formal analysis, Writing - original draft.
No Effects of Meteorological Factors on the SARS-CoV-2 Infection Fatality Rate
doi: 10.3967/bes2021.120
- Received Date: 2021-01-21
- Accepted Date: 2021-04-12
-
Key words:
- Climate /
- COVID-19 /
- Infection fatality rate /
- SARS-CoV-2 /
- Temperature /
- Weather
Abstract:
| Citation: | SOLANES Aleix, LAREDO Carlos, GUASP Mar, FULLANA Miquel Angel, FORTEA Lydia, GARCIA-OLIVÉ Ignasi, SOLMI Marco, SHIN Jae Il, URRA Xabier, RADUA Joaquim. No Effects of Meteorological Factors on the SARS-CoV-2 Infection Fatality Rate[J]. Biomedical and Environmental Sciences, 2021, 34(11): 871-880. doi: 10.3967/bes2021.120

|


 Quick Links
 DownLoad: