


-
Coronavirus disease 2019 (COVID-19) has inarguably caused the most challenging pandemic. In less than 2 years, greater than 200 million cases of COVID-19 and 4.5 million deaths have been reported worldwide[1]. The treatment strategy of an emerging infectious disease is a huge challenge for clinical practitioners because of missing key knowledge about the disease. Although most COVID-19 patients present with mild symptoms, some COVID-19 patients develop severe complications and even death[2]. Therefore, it is essential to improve the management of patients with severe infections to reduce the mortality of COVID-19. Because severe acute respiratory syndrome coronavirus 2 (SARS-CoV-2) belongs to the Coronavirus family, clinical physicians tend to use antiviral drugs in COVID-19 treatment. However, the effectiveness of antiviral therapy in COVID-19 is controversial.
This historical cohort study was conducted in four hospitals located in Wuhan, including Zhongnan Hospital of Wuhan University, Wuhan Third Hospital, Union Jiangbei Hospital, and the First People's Hospital of Jiangxia District. All study methods were carried out with all the relevant national regulations, institutional policies, and in accordance with the tenets of the Declaration of Helsinki. This study was approved by the Ethics Committees of these hospitals.
All patients 18 years of age and older with severe COVID-19 who were treated at 1 of the 4 hospitals between 8 January and 9 March 2020 were enrolled in the current study. All the patients receiving antiviral treatments, including ribavirin, oseltamivir, abidor, interferon, and lopinavir/ritonavir, comprised the antiviral group. The patients receiving non-antiviral treatments comprised the control group. Among the 138 patients with severe COVID-19, 109 (79.0%) and 29 (21.0%) were in the antiviral and control groups, respectively. The daily doses of ribavirin, oseltamivir, abidor, interferon, and lopinavir/ritonavir were 0.8 g, 150 mg, 400 mg, 8 million IU, and 800 mg, respectively. The cumulative duration of antiviral treatment was defined as the period between the date of the first prescription and the date of completing the last prescription.
The primary outcomes were the in-hospital death rate and duration of hospitalization. The secondary outcomes included ICU admission, length of stay in the ICU, use of mechanical ventilation, length of mechanical ventilation, and the development of complications. The complications in COVID-19 patients consisted of acute respiratory distress syndrome (ARDS), sepsis, septic shock, acute kidney injury (AKI), acute cardiac injury, and disseminated intravascular coagulation (DIC).
The demographic and clinical data of the patients, and the prescription and dispensing of drugs were extracted from the electric medical records. The covariates of analysis were defined as follows: patient characteristics; co-morbidities; surgical history; clinical signs and symptoms; ventilation mode at admission; vital signs and laboratory findings; and treatments other than antiviral therapy.
Descriptive data are expressed as the mean ± standard deviation (SD) or median with interquartile range (IQR) or range for continuous variables. The number and percentage were used for describing categorical variables. The antiviral and control groups were compared using a t-test for normally distributed data, Mann-Whitney test for non-normally distributed or graded variables, and a chi-square (χ2) test or Fisher’s exact test for discrete variables. Kaplan-Meier analysis was applied for survival time analysis during hospitalization. The log-rank test was used to compare the length of hospitalization in surviving patients and deaths. Survival analysis was stratified by the combined treatments in surviving patients and deaths. Cox regression analysis was used to evaluate the association between antiviral treatment and risk of death in patients with severe COVID-19 infection. All analyses were performed using R software (version 3.6.3; R Foundation for Statistical Computing). Two-sided P values < 0.05 were considered to indicate statistical significance.
A total of 138 patients [90 (65.2% males)] with severe COVID-19 infections were enrolled in our study. The mean age was 65.4 years (SD: ± 12.6; Table 1). Only 8 (5.8%) patients were smokers. Eighty-six patients (63.3%) had co-existing disorders, including hypertension, diabetes, coronary heart disease, renal insufficiency, chronic lung disease, cerebrovascular diseases, and malignant tumors (Table 1). Forty patients (29.0%) had a single co-morbidity and 46 (33.3%) had ≥ 2 co-morbidities. The most common initial symptoms were fever, cough, expectoration, dyspnea, fatigue, breathlessness, and wheezing (Table 1). The general characteristics were similar between patients in the antiviral and control groups. Moreover, no statistical differences in vital signs and most laboratory findings were detected between the antiviral and control groups (Supplementary Table S1, available in www.besjournal.com).
Characteristics Total (n = 138) Antiviral treatment P Yes (n = 109) No (n = 29) Age, mean ± SD, years 65.38 ± 12.60 65.43 ± 12.84 65.17 ± 11.88 0.922 Sex, n (%) 0.201 Female 48 (34.8) 35 (32.1) 13 (44.8) Male 90 (65.2) 74 (67.9) 16 (55.2) BMI, mean ± SD, kg/m2 23.37 ± 3.47 23.35 ± 3.29 23.44 ± 4.06 0.909 Smoking, n (%) 0.871 Yes 8 (5.8) 7 (6.4) 1 (3.4) No 130 (94.2) 102 (93.6) 28 (96.6) Co-morbidities, n (%) Hypertension 60 (43.5) 46 (42.2) 14 (48.3) 0.558 Diabetes 24 (17.4) 20 (18.3) 4 (13.8) 0.545 Coronary heart disease 22 (15.9) 16 (14.7) 6 (20.7) 0.617 Renal insufficiency 14 (10.1) 8 (7.3) 6 (20.7) 0.077 Chronic lung disease 10 (7.2) 8 (7.3) 2 (6.9) 1.000 Cerebrovascular disease 10 (7.2) 5 (4.6) 5 (17.2) 0.053 Malignant tumor 8 (5.8) 5 (4.6) 3 (10.3) 0.238 Presence of co-morbidities, n (%) 0.084 0 52 (37.7) 42 (38.5) 10 (34.5) 1 40 (29.0) 37 (33.9) 3 (10.3) 2 32 (23.2) 21 (19.3) 11 (37.9) ≥ 3 14 (10.1) 9 (8.2) 5 (17.2) Surgery history within 6 months, n (%) 5 (3.6) 5 (4.6) 0 (0) 0.538 Signs and symptoms, n (%) Any 138 (100) 109 (100) 29 (100) 1.000 Fever 117 (84.8) 90 (82.6) 27 (93.1) 0.266 Highest temperature, °C 0.053 37.3−38.0 37 (31.6) 24 (26.7) 13 (48.1) 38.1−39.0 64 (54.7) 51 (56.7) 13 (48.1) > 39.0 16 (13.7) 15 (16.7) 1 (3.7) Cough or sputum production 111 (80.4) 81 (93.5) 20 (69.0) 0.080 Chest distress/dyspnea 87 (63.0) 67 (61.5) 20 (69.0) 0.457 Fatigue 88 (63.8) 69 (63.3) 19 (65.5) 0.825 Breathlessness or wheezing 73 (52.9) 55 (50.5) 18 (62.1) 0.266 Diarrhea 16 (11.6) 14 (12.8) 2 (6.9) 0.574 Nausea or vomiting 3 (2.2) 2 (1.8) 1 (3.4) 0.510 Ventilation mode at admission, n (%) 0.229 Inhaling oxygen 121 (87.7) 97 (89.0) 24 (82.7) Mechanical ventilation 15 (10.9) 10 (9.2) 5 (17.2) Note. Data are presented by number (%) or mean ± SD. P values were calculated by t-test, χ2-test, Mann-Whitney test, or Fisher’s exact test, as appropriate. COVID-19, coronavirus disease 2019; SD, standard deviation. Table 1. General characteristics of severe COVID-19 patients at baseline
Five different antiviral drugs were used in the antiviral group. Ribavirin (36.2%) and oseltamivir (32.6%) were the antiviral drugs used most often, followed by abidor (16.7%), interferon (11.6%), and lopinavir/ritonavir (5.1%; Supplementary Table S2, available in www.besjournal.com). The duration of antiviral treatment varied with the drug used, ranging from 3 days for lopinavir/ritonavir to 9 days for interferon. The majority of patients [85 (78.0%)] were treated with one antiviral drug.
Antiviral treatment Total (n = 138) Drugs and use 109 (79.0) Ribavirin 50 (36.2) Dose, median (range), g/d 0.8 (0.4–1.5) Duration of therapy, median (range), d 5 (1–10) Oseltamivir 45 (32.6) Dose, mg/d 150 Duration of therapy, median (range), d 5 (2–13) Abidor 23 (16.7) Dose, median (range), g/d 0.4 (0.4–0.6) Duration of therapy, median (range), d 6 (3–14) Interferon 16 (11.6) Dose, median (range), million IU/d 8 (6–10) Duration of therapy, median (range), d 9 (1–15) Lopinavir/ritonavir 7 (5.1) Dose, mg/d 800 Duration of therapy, median (range), d 3 (2–8) Therapy strategy Monotherapy 85 (61.6) Combined therapy 24 (15.9) Note. Data are presented by number (%) or median (range). COVID-19, coronavirus disease 2019; d, day(s). Table S2. Antiviral treatment in severe COVID-19 patients
In the control group, the primary treatment involved antibiotics (93.1%), followed by glucocorticoids (62.1%) and vasoactive drugs (34.5%). Patients in the antiviral group also received antibiotics (97.2%), glucocorticoids (73.4%) and vasoactive drugs (30.4%) (Supplementary Table S3, available in www.besjournal.com). Only the duration of glucocorticoid therapy was significantly different between the antiviral and control groups (P < 0.05). The median duration of glucocorticoid therapy in the antiviral group was 4.0 days (IQR: 2.0–9.0) and 8.0 days (IQR: 3.8–15.3) in the control group. Moreover, the frequency of high-flow oxygen use in the antiviral group was significantly less than the control group (28.4% vs. 48.3%, P < 0.05). The non-invasive ventilation utilization rate in the antiviral group was also significantly less than the control group (28.4% vs. 51.7%, P < 0.05), while the invasive mechanical ventilation utilization rates were similar in both groups (51.4% vs. 58.6%, P > 0.05).
Treatments Total (n = 138) Antiviral treatment P Yes (n = 109) No (n = 29) Antibiotics 133 (96.4) 106 (97.2) 27 (93.1) 0.615 Glucocorticoids 98 (71.0) 80 (73.4) 18 (62.1) 0.232 Initial dose, median (IQR), mg/d 40 (40–80) 40 (40–80) 40 (40–60) 0.554 Duration of therapy, median (IQR), d 4 (2–9) 4 (2–9) 8 (3.75–15.25) 0.014 Vasoactive drugs 42 (30.4) 32 (29.4) 10 (34.5) 0.594 Duration of therapy, median (IQR), d 4 (0.75–9.25) 4 (0.25–7.75) 4.5 (0.75–11) 0.592 High-flow oxygen therapy 45 (32.6) 31 (28.4) 14 (48.3) 0.043 Non-invasive ventilation 46 (33.3) 31 (28.4) 15 (51.7) 0.018 Invasive mechanical ventilation 73 (52.9) 56 (51.4) 17 (58.6) 0.487 Prone position ventilation 12 (8.7) 9 (8.3) 3 (10.3) 1.000 CRRT 7 (5.1) 4 (3.7) 3 (10.3) 0.327 Duration of therapy, median (IQR), d 2 (0–8) 3 (1.25–7.75) 0 (0–0) 0.285 Note. Data are presented by number (%) or median (IQR). P values were calculated by χ2-test, Mann-Whitney test, or Fisher’s exact test, as appropriate. COVID-19, coronavirus disease 2019; IQR, interquartile range; d, days. Table S3. Application of other treatments in severe COVID-19 patients
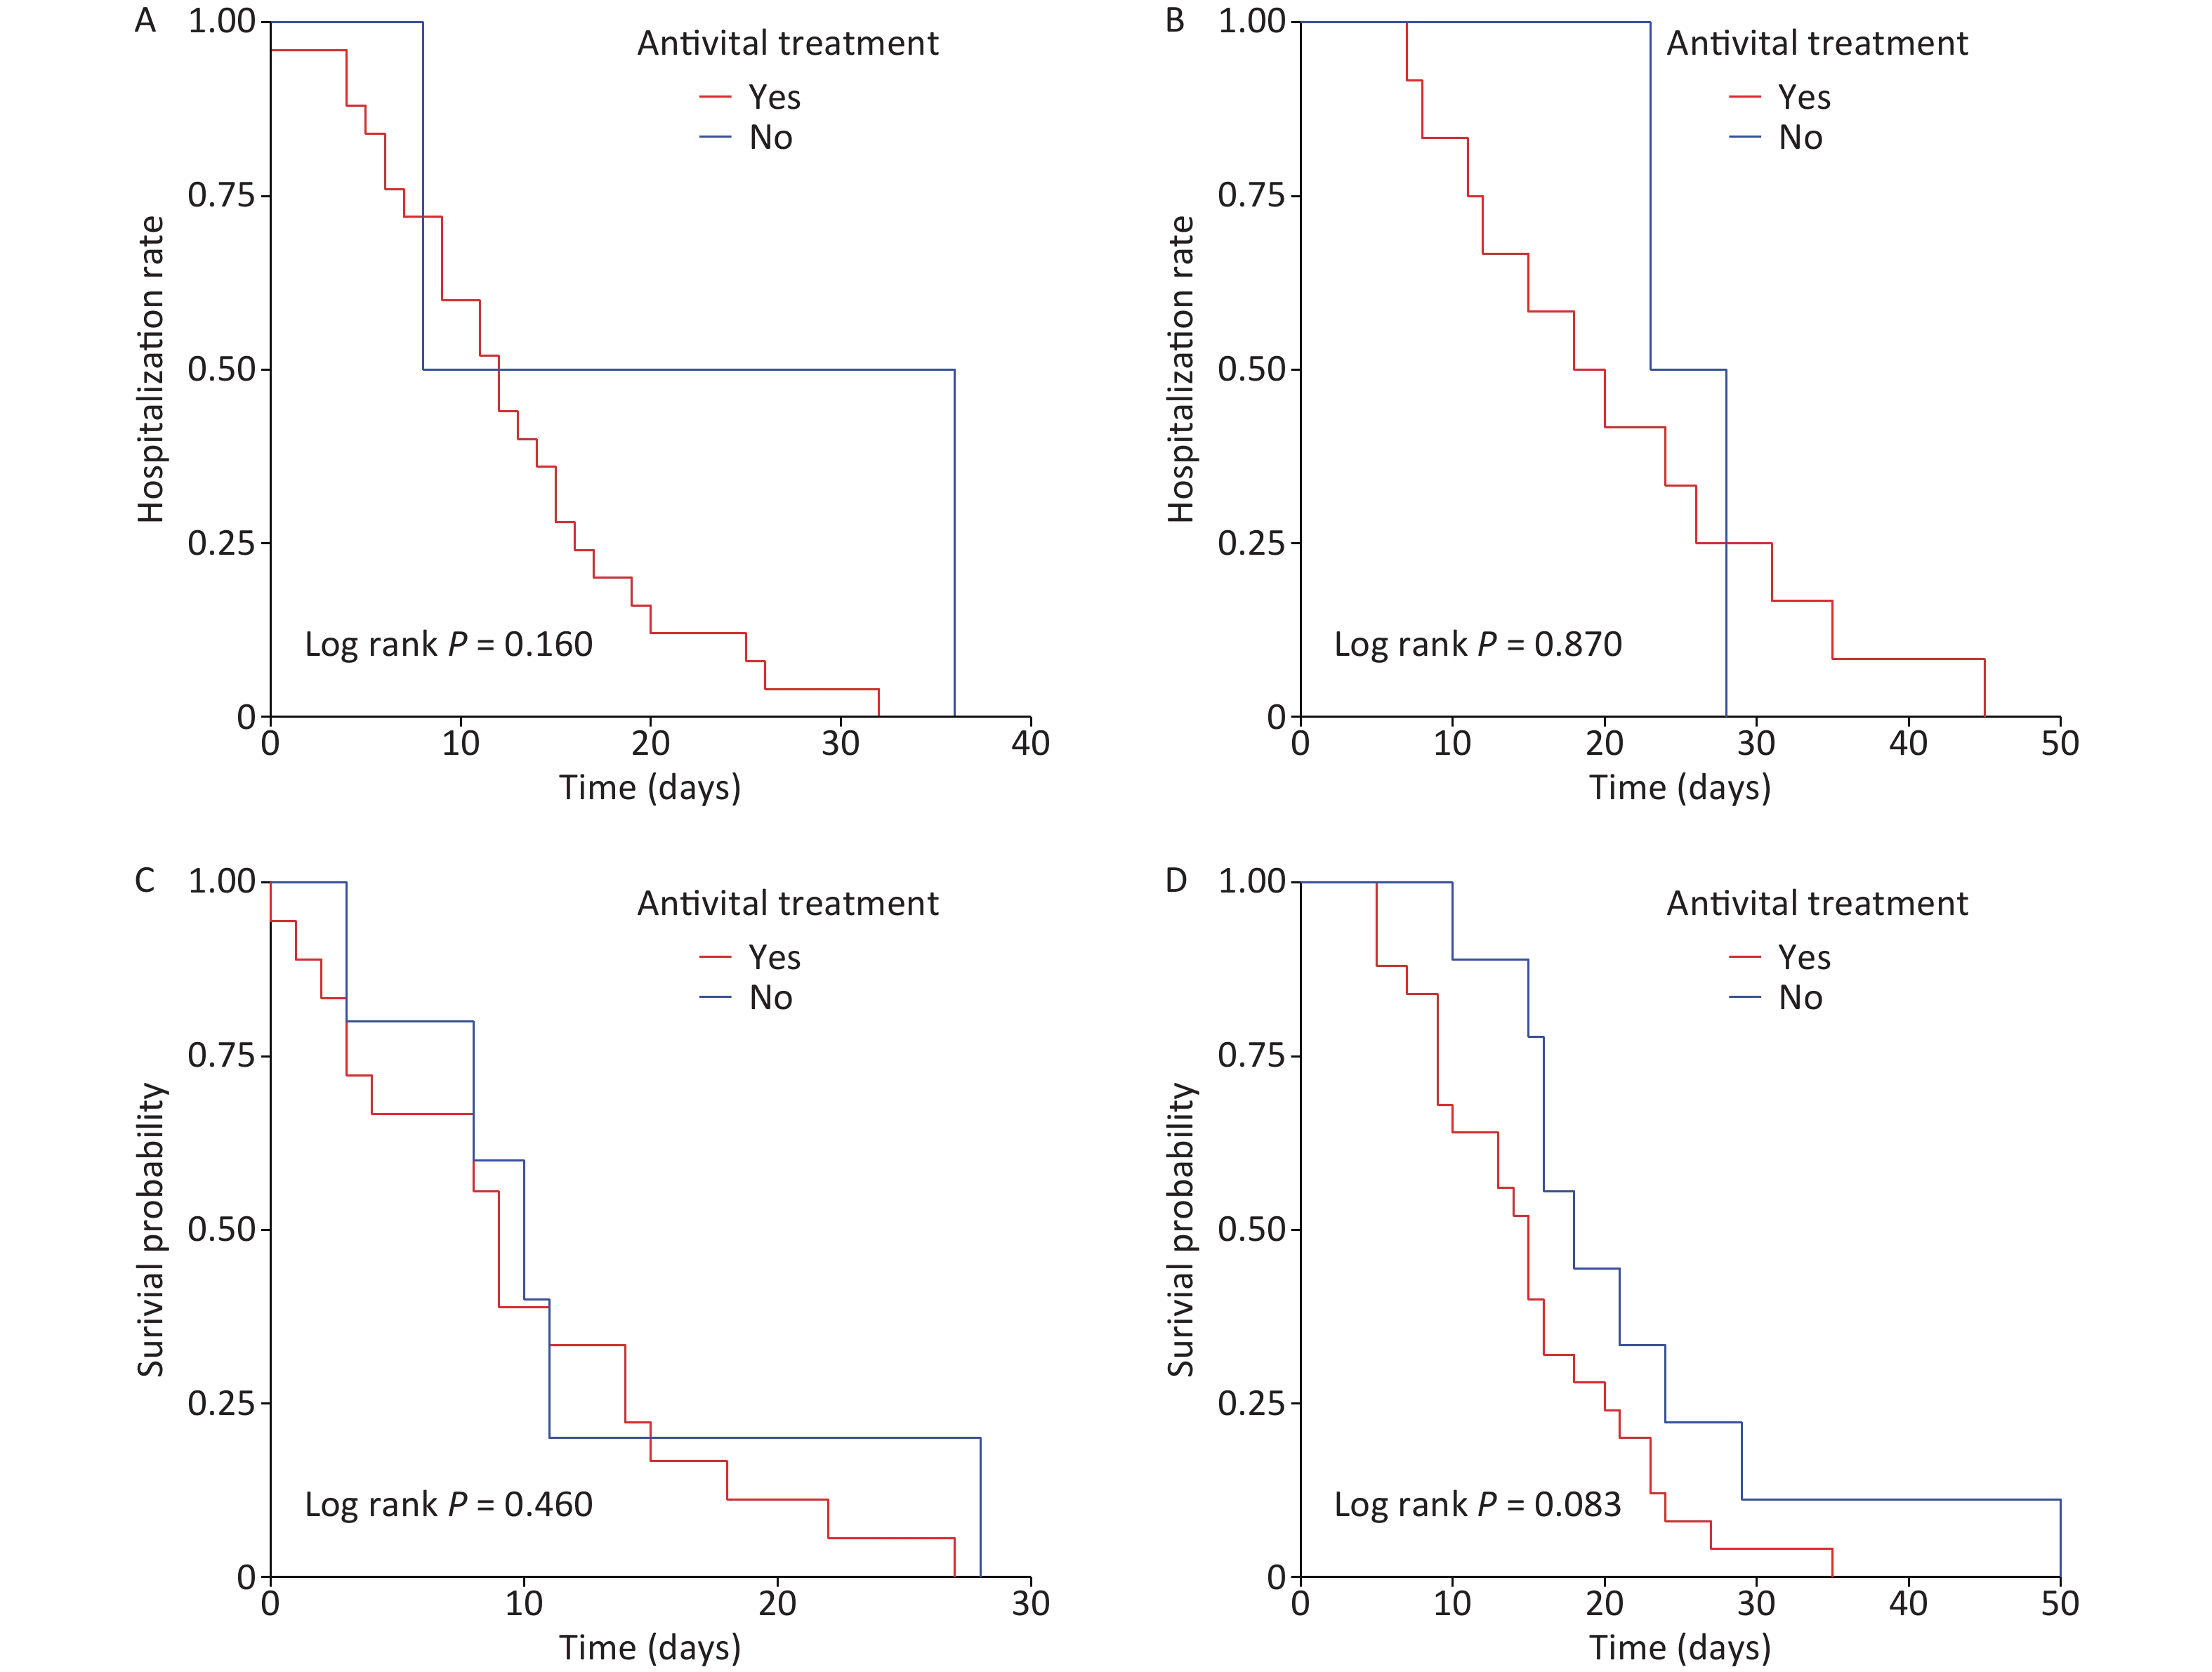
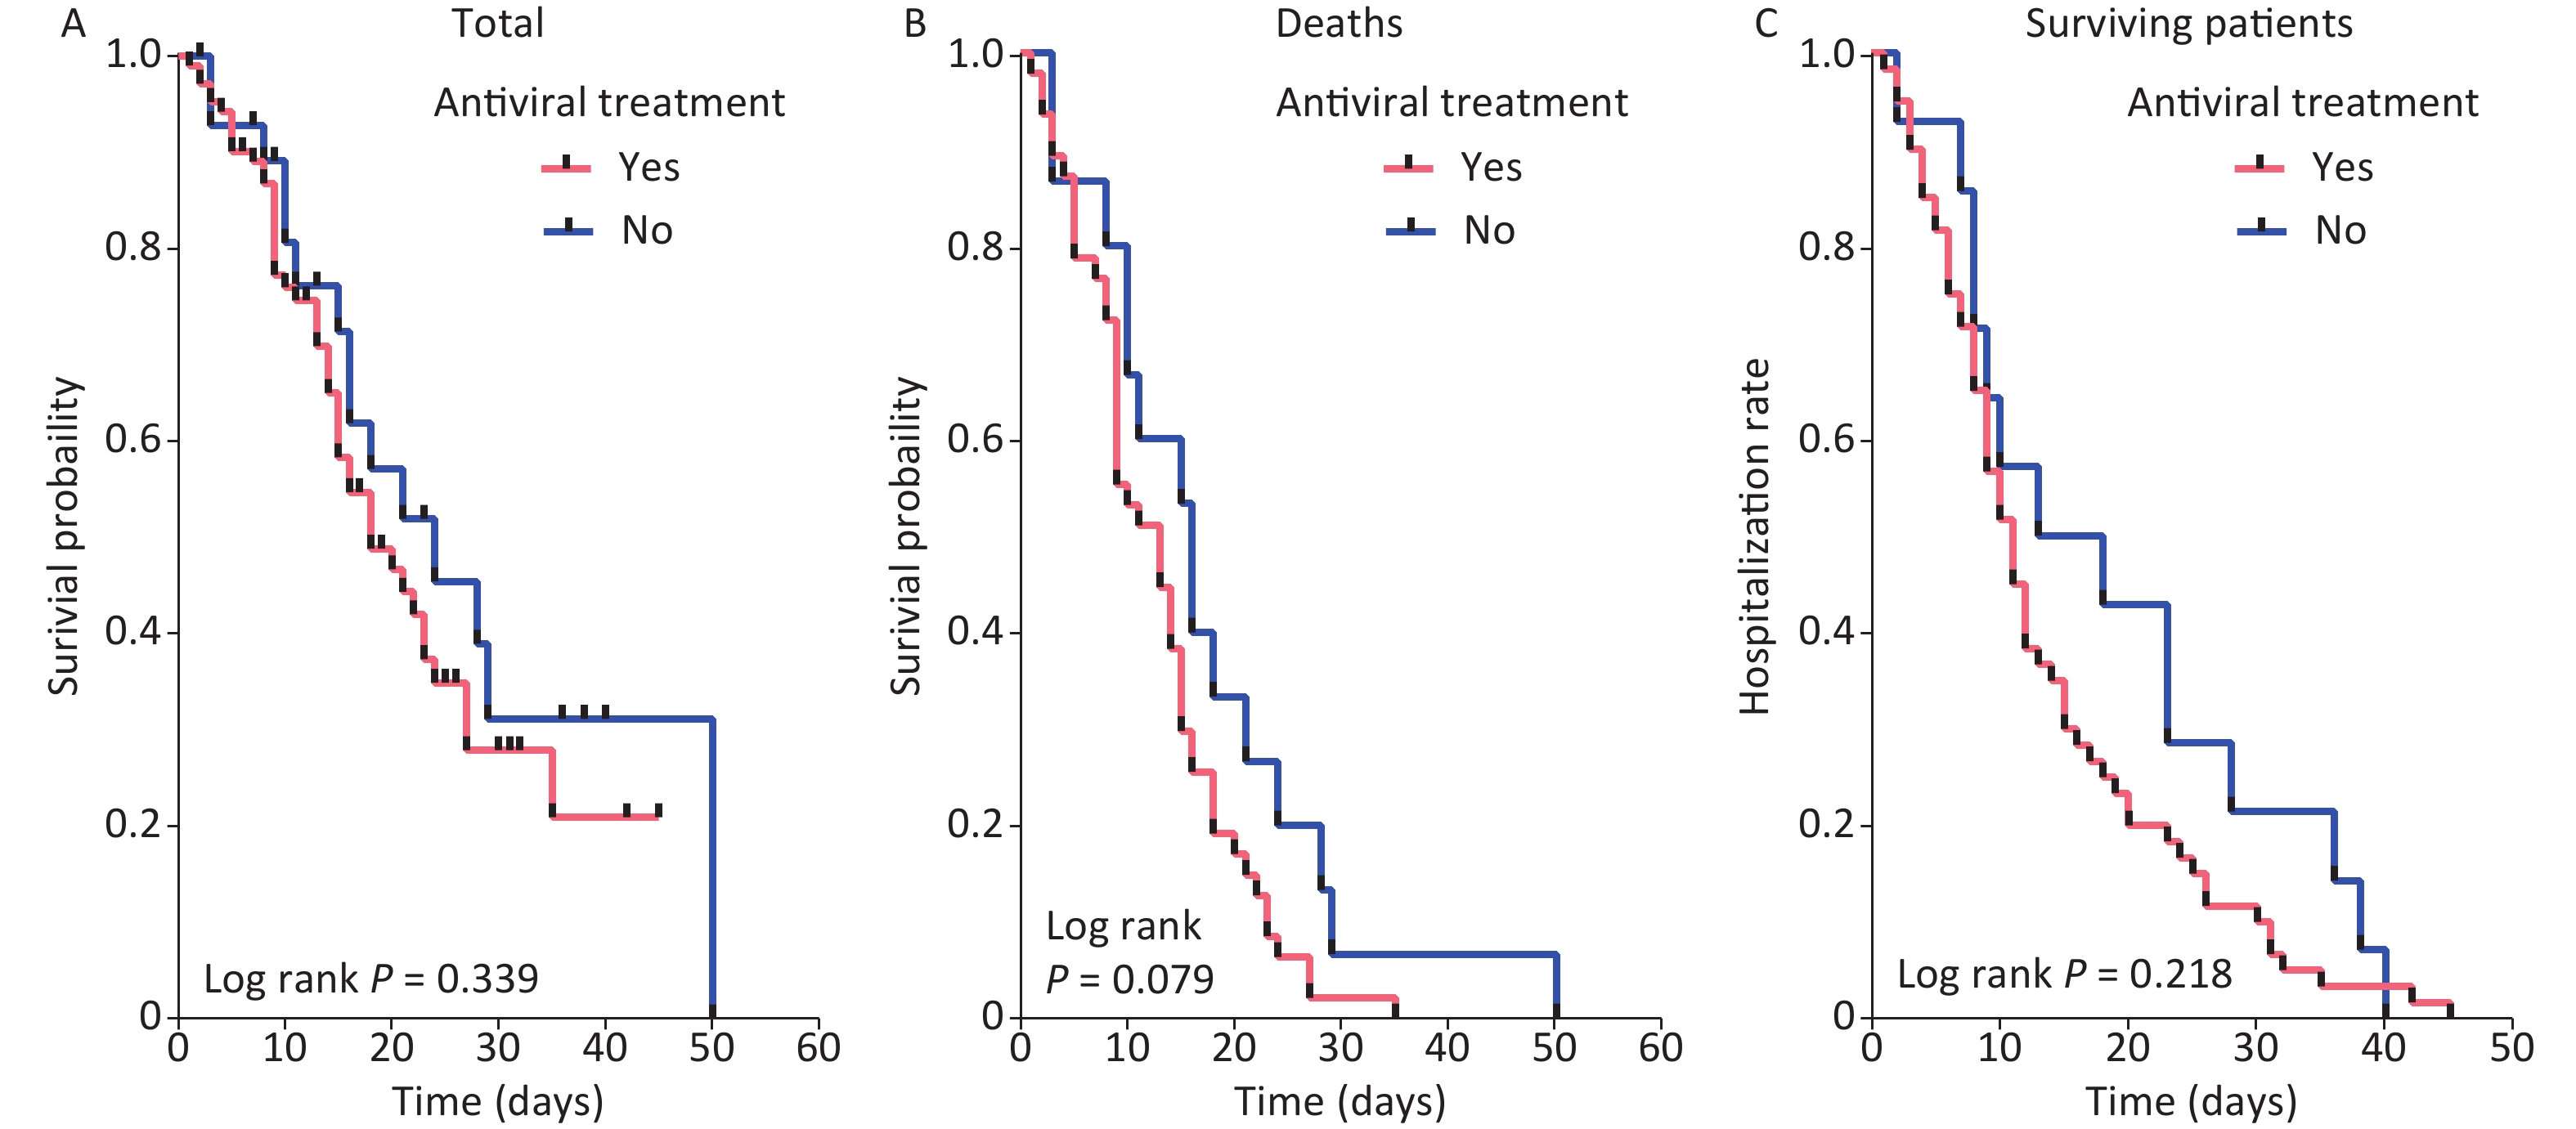
Sixty-three patients (45.7%) died during hospitalization and 75 (54.3%) were discharged to home in stable condition. The case-fatality rates were similar between the antiviral and control groups (44.0% vs. 51.7%, P > 0.05; Supplementary Table S4, available in www.besjournal.com). Moreover, the length of hospitalization among the patients with severe COVID-19 in the antiviral group (median: 11.0, IQR: 6.5–18.0) was similar to the control group (median: 16, IQR: 8.5–26.0, P > 0.05; Supplementary Table S4 and Figure 1A). The in-hospital survival time did not differ significantly between these two groups (Figure 1B). The length of hospitalization among the surviving patients were not statistically different between the two groups (Figure 1C). In addition, the survival analyses stratified by combined treatments were not significantly different with respect to survival time or length of hospital stay between the antiviral and control groups (Supplementary Figures S1–S3, available in www.besjournal.com).

Figure 1. Kaplan-Meier curves of antiviral treatment in all patients (A), deaths (B), and surviving patients (C)
Variables Total (n = 138) Antiviral treatment P Yes (n = 109) No (n = 29) Outcomes Death 63 (45.7) 48 (44.0) 15 (51.7) 0.460 Duration of hospitalization 11 (7.75–19.25) 11 (6.5–18.0) 16 (8.5–26.0) 0.339 ICU admission 131 (94.9) 106 (97.2) 25 (86.2) 0.053 Mechanical ventilation 73 (52.9) 56 (51.4) 17 (58.6) 0.487 Complications Respiratory failure 105 (76.1) 85 (78.0) 20 (69.0) 0.312 ARDS 70 (50.7) 59 (54.1) 11 (37.9) 0.121 Sepsis 48 (34.8) 44 (40.4) 4 (13.8) 0.008 Acute cardiac injury 38 (27.5) 30 (27.5) 8 (27.6) 0.995 Acute liver injury 36 (26.1) 29 (26.6) 7 (24.1) 0.788 Acute kidney injury 31 (22.5) 26 (23.9) 5 (17.2) 0.448 Septic shock 24 (17.4) 22 (20.2) 2 (6.9) 0.093 DIC 11 (8.0) 6 (5.5) 5 (17.2) 0.091 Arrhythmias 10 (7.2) 10 (9.2) 0 (0.0) 0.197 Gastrointestinal bleeding 7 (5.1) 6 (5.5) 1 (3.4) 1.000 Acute cerebrovascular disease 5 (3.6) 5 (4.6) 0 (0.0) 0.538 Note. Data are presented by number (%). P values were calculated by χ2-test or Fisher’s exact test, as appropriate. ARDS, acute respiratory distress syndrome; COVID-19, coronavirus disease 2019; DIC, disseminated intravascular coagulation; ICU, intensive care unit. Table S4. Outcomes and complications of severe COVID-19 patients
Cox regression analysis was used to assess risk of death in patients. Antiviral treatment was not significantly associated with risk of death in patients with severe COVID-19 in the multivariate model (HR = 2.123, 95% CI: 0.880–5.122; Table 2). We also found that no other treatments reduced the risk of death from severe COVID-19, which may be due to the small sample size of surviving patients.
Variables β SE Wald P HR 95% CI Antiviral treatment 0.753 0.449 2.810 0.094 2.123 0.880–5.122 Renal insufficiency 0.090 0.579 0.024 0.877 1.094 0.352–3.400 Cerebrovascular disease 1.082 0.561 3.720 0.054 2.949 0.983–8.852 Presence of co-morbidities 0 Ref 1 −1.124 0.454 6.146 0.013 0.325 0.134–0.790 2 −0.037 0.483 0.006 0.940 0.964 0.374–2.486 ≥ 3 −0.536 0.849 0.398 0.528 0.585 0.111–3.089 Highest temperature, ℃ 37.3−38.0 Ref 38.1−39.0 −0.349 0.419 0.692 0.405 0.705 0.310–1.605 > 39.0 −0.354 0.492 0.519 0.471 0.702 0.268–1.840 Cough or sputum production 0.025 0.421 0.003 0.953 1.025 0.449–2.340 High-flow oxygen therapy 0.342 0.361 0.900 0.343 1.408 0.694–2.855 Non-invasive ventilation 0.748 0.396 3.567 0.059 2.114 0.972–4.595 Duration of glucocorticoids therapy −0.038 0.024 2.406 0.121 0.963 0.919–1.010 Note. CI, confidence interval; COVID-19, coronavirus disease 2019; HR, hazard ratio; Ref, reference; SE, standard error. Table 2. Risk analysis of death in patients with severe COVID-19 in the multivariate Cox model
Our study showed that the risk of mortality during the clinical course among patients with severe COVID-19 infection did not improve with the use of antiviral drugs. Indeed, oseltamivir has no documented activity against SARS-CoV-2 in vitro[3]. In a single-center case series no benefit of oseltamivir treatment was reported[4]. In addition, one randomized controlled trial showed that antiviral drugs (lopinavir–ritonavir) did not accelerate clinical improvement, reduce mortality, or diminish the detection of throat viral RNA in patients with severe COVID-19 infection[5]. However, the clinical effects of antiviral treatment are still a matter of debate. A study involving molecular docking confirmed the effectiveness of ribavirin, remdesivir, sofosbuvir, galidesivir, and tenofovir as potent drugs in treating SARS-CoV-2 infection[6]. Numerous antiviral drugs, including atazanavir, remdesivir, efavirenz, ritonavir, lopinavir, and darunavir, have inhibitory effects against SARS-CoV-2 in drug-target interaction deep learning models[7], and interferon has been shown to be effective in the treatment of early-stage COVID-19 infections[8]. Our study, however, showed that the risk of mortality and clinical course in patients with severe COVID-19 infections did not improve with the use of antiviral drugs.
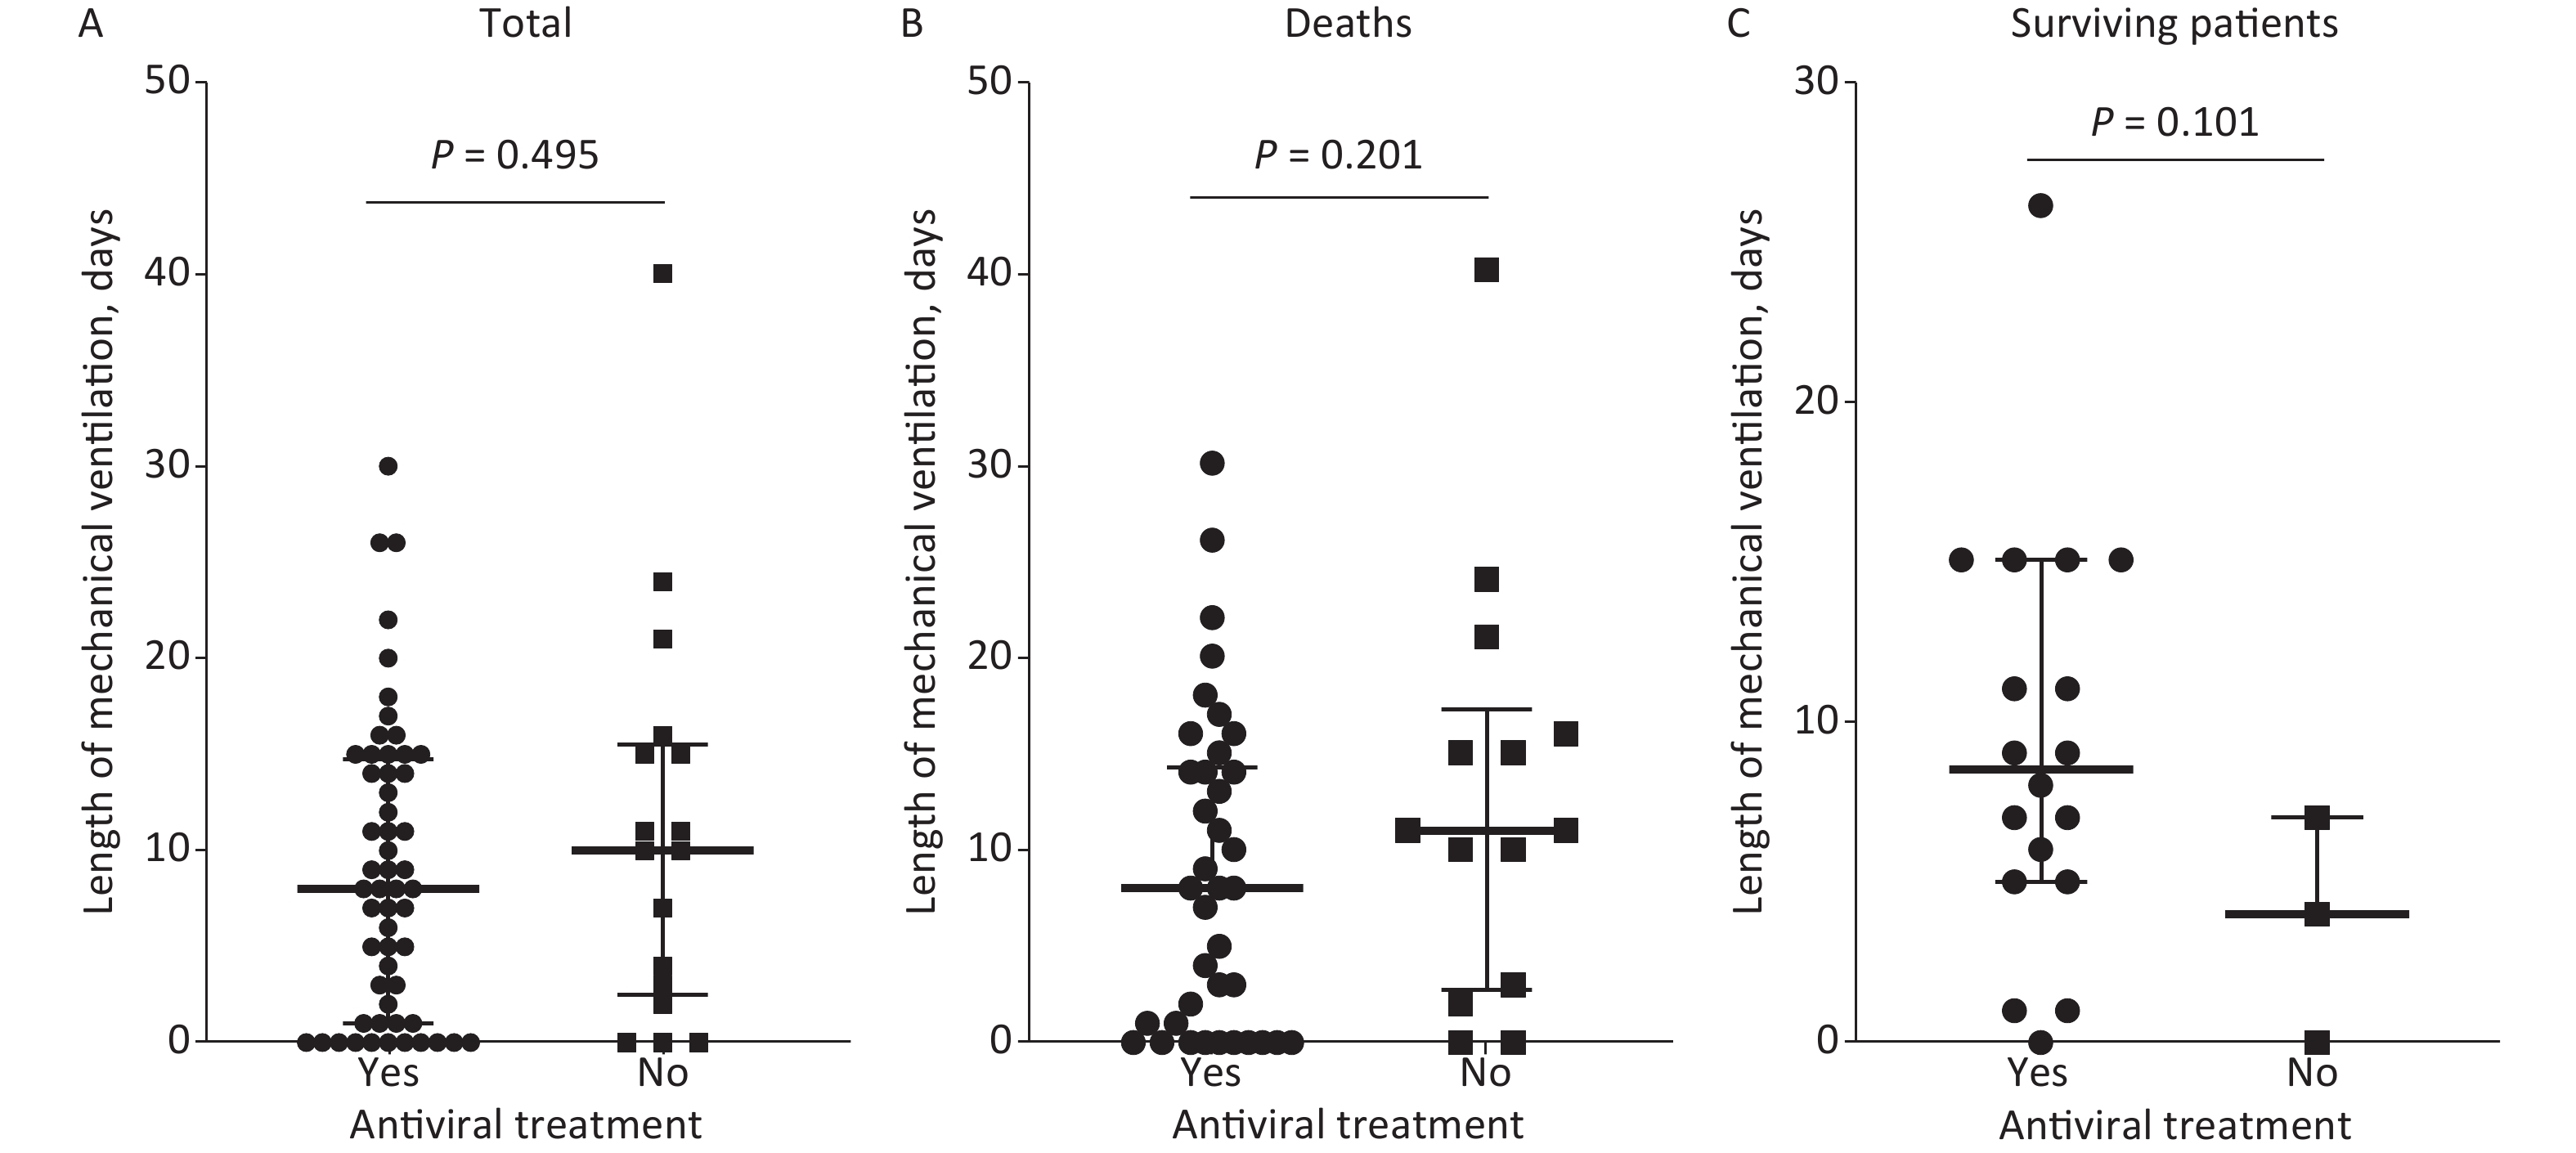
One hundred thirty-one patients (94.9%) were admitted to the ICU [106 (97.2%) from the antiviral group and 25 (86.2%) from the control group; Supplementary Table S4]. The length of ICU stay among patients with severe COVID-19 in the antiviral group was significantly shorter than the control group [median (IQR), 9 (3–14) days vs. 15 (7–23.5) days, P < 0.05; Supplementary Figure S4A, available in www.besjournal.com]. The length of ICU stay culminating in death was shorter in the antiviral group (median: 7.0 days, IQR: 3.0–14.3 days) than the control group (median: 15.5 days, IQR: 8.3–21.8 days, P < 0.05; Supplementary Figure S4B). The length of ICU stay among surviving patients was similar in both groups (Supplementary Figure S4C). Fifty-six (51.4%) and 17 (58.6%) patients received mechanical ventilation in the antiviral and control groups, respectively. The rates of ICU admission, mechanical ventilation, and the length of mechanical ventilation did not differ between the two groups (P > 0.05; Supplementary Table S4 and Supplementary Figure S5, available in www.besjournal.com).
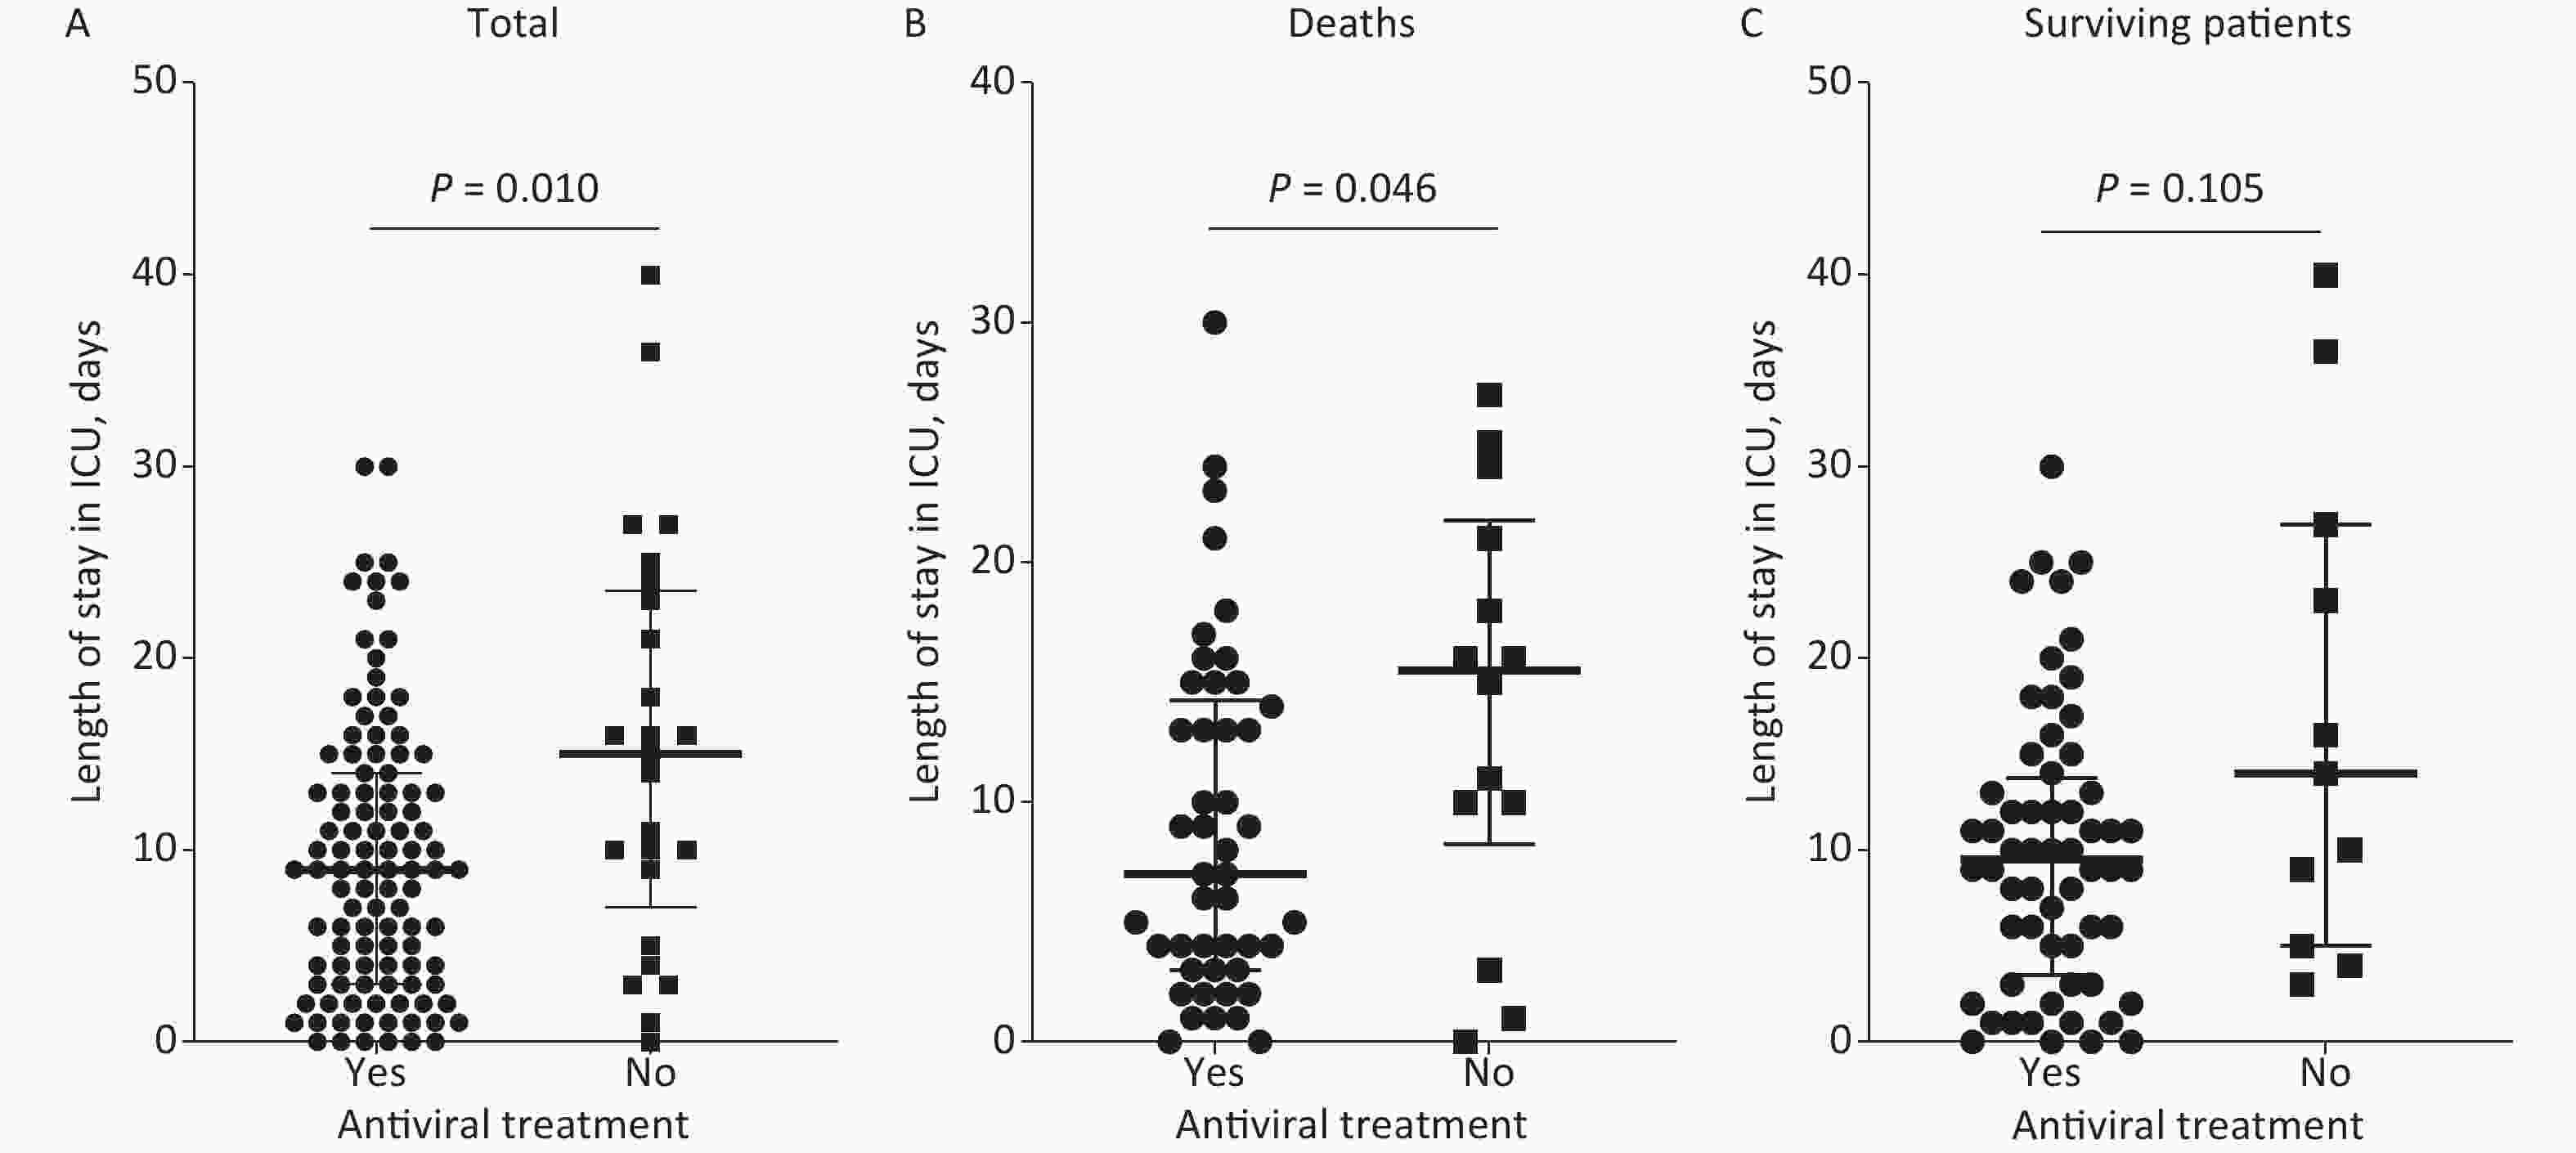
Figure S4. Length of ICU stay by antiviral treatment in all patients (A), deaths (B), and surviving patients (C). ICU, intensive care unit.

Figure S5. Length of mechanical ventilation by antiviral treatment in all patients (A), deaths (B), and surviving patients (C).
One hundred twenty patients (87.0%) developed complications [99 patients (90.8%) were in the antiviral group and 21 (72.4%) in the control group]. Respiratory failure (76.1%) was the most common complication, followed by ARDS (50.7%), sepsis (34.8%), acute cardiac injury (27.5%), acute liver injury (26.1%), acute kidney injury (22.5%), septic shock (17.4%), DIC (8.0%), arrhythmias (7.2%), gastrointestinal bleeding (5.1%), and acute cerebrovascular disease (3.6%; Supplementary Table S4). Only the incidence of sepsis was significantly greater in the antiviral group compared with the control group (40.4% vs. 13.8%, P < 0.01). The incidence of the remaining complications was similar in both groups (Supplementary Table S4).
The incidence of sepsis was higher in the antiviral group in our study. Although bacterial infections are usually regarded as a leading cause of sepsis, one study suggested that viral infections may also cause sepsis syndrome[9]. In patients with severe COVID-19 infections, alveolar macrophages produce various pro-inflammatory cytokines and chemokines in response to SARS-CoV-2 infection[10]. Indeed, viral infections might lead to increased macrophage infiltration and the immune pathogenesis caused by a systemic cytokine storm[10], leading to viral sepsis, multiple organ dysfunction, and even death.
Our historical cohort study had some limitations. First, an antiviral drug use history was used to determine antiviral treatment exposure, while the assignment of antiviral treatment was subject to the situation and environment of the hospital. The full extent of exposure may not have been captured. Second, our study did not analyze the antiviral effect on virus status among patients with severe COVID-19 because we did not perform viral load testing. Third, a small sample size in the control group may have resulted in an imbalance between the antiviral and control groups. Finally, our findings were based on a historical cohort study. Randomized controlled trials involving antiviral drugs with multiple study sites should be planned to better evaluate the effectiveness of antiviral drugs in patients with severe COVID-19 infection.
In conclusion, no clinical benefit was demonstrated in patients with severe COVID-19 infection receiving antiviral treatment. Randomized controlled trials to better assess the efficacy of antiviral treatment in patients with severe COVID-19 infection should not be delayed.
Authors’ Contributors ZGZ, WJX, YZ, and QH conceived and designed the study. LYY, RNL, MM, ZZH, LH, and XZX performed data extraction from the electric medical records system. GYD, HFH, PW, LYY, XJW, and XLZ performed data analysis and figure illustrations. XLZ, GYD, HFH, and WJX discussed the data and wrote the manuscript. ZGZ, WJX, YZ, and QH supervised the study. All authors approved the final draft for submission.
Acknowledgments The authors thank Mrs. Yu Yang, Wei Fan, and Xiaopeng Tu for their assistance in sample collection.
Ethics Approval and Consent to Participate This study was approved by the Ethics Committees of Zhongnan Hospital of Wuhan University, Wuhan Third Hospital, Union Jiangbei Hospital, and the First People's Hospital of Jiangxia District. Written informed consent was obtained from all the patients’ legal representatives in accordance with the ethical standards of the Ethics Committees of Zhongnan Hospital of Wuhan University, Wuhan Third Hospital, Union Jiangbei Hospital, and the First People's Hospital of Jiangxia District.
Confilects of Interest The authors have no conflicts of interest to disclose.

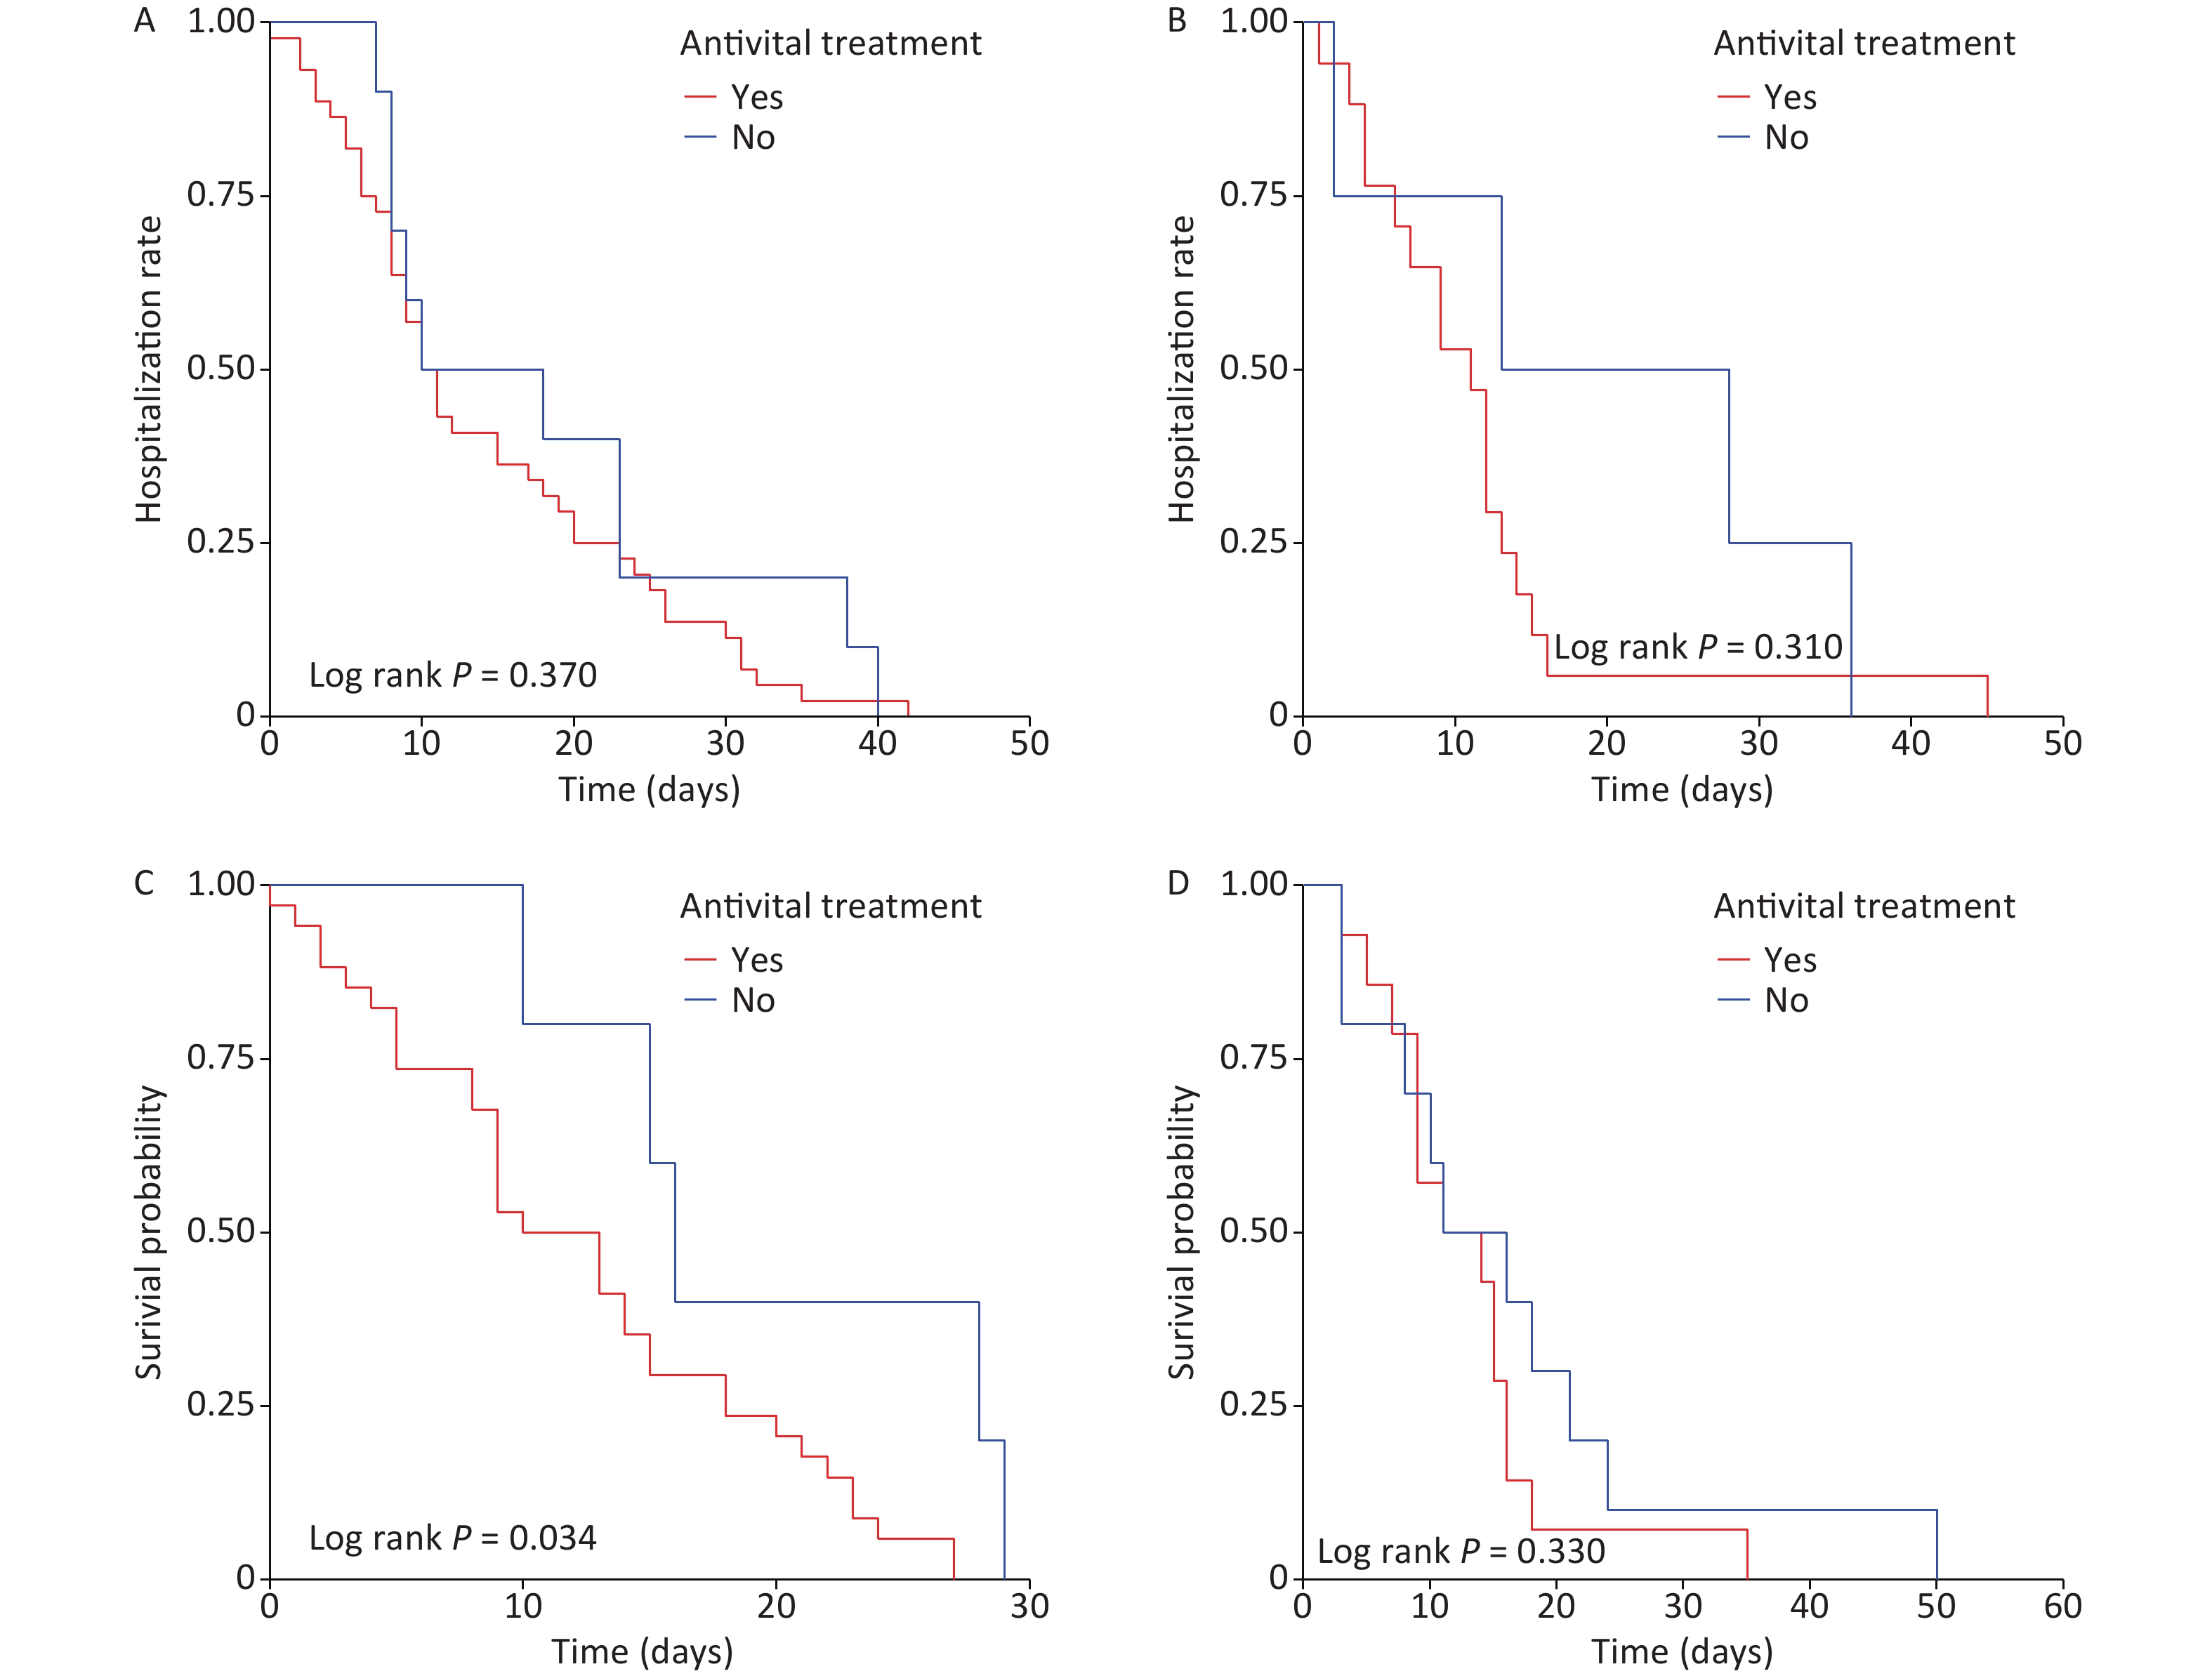
Figure S1. Adjusted Kaplan-Meier curves of antiviral treatment stratified by duration of glucocorticoid therapy. (A) Kaplan-Meier curves of surviving patients stratified by duration of glucocorticoid therapy ≤ 4 days, (B) Kaplan-Meier curves of surviving patients stratified by duration of glucocorticoid therapy > 4 days, (C) Kaplan-Meier curves of deaths stratified by duration of glucocorticoid therapy ≤ 4 days, and (D) Kaplan-Meier curves of deaths stratified by duration of glucocorticoid therapy > 4 days.
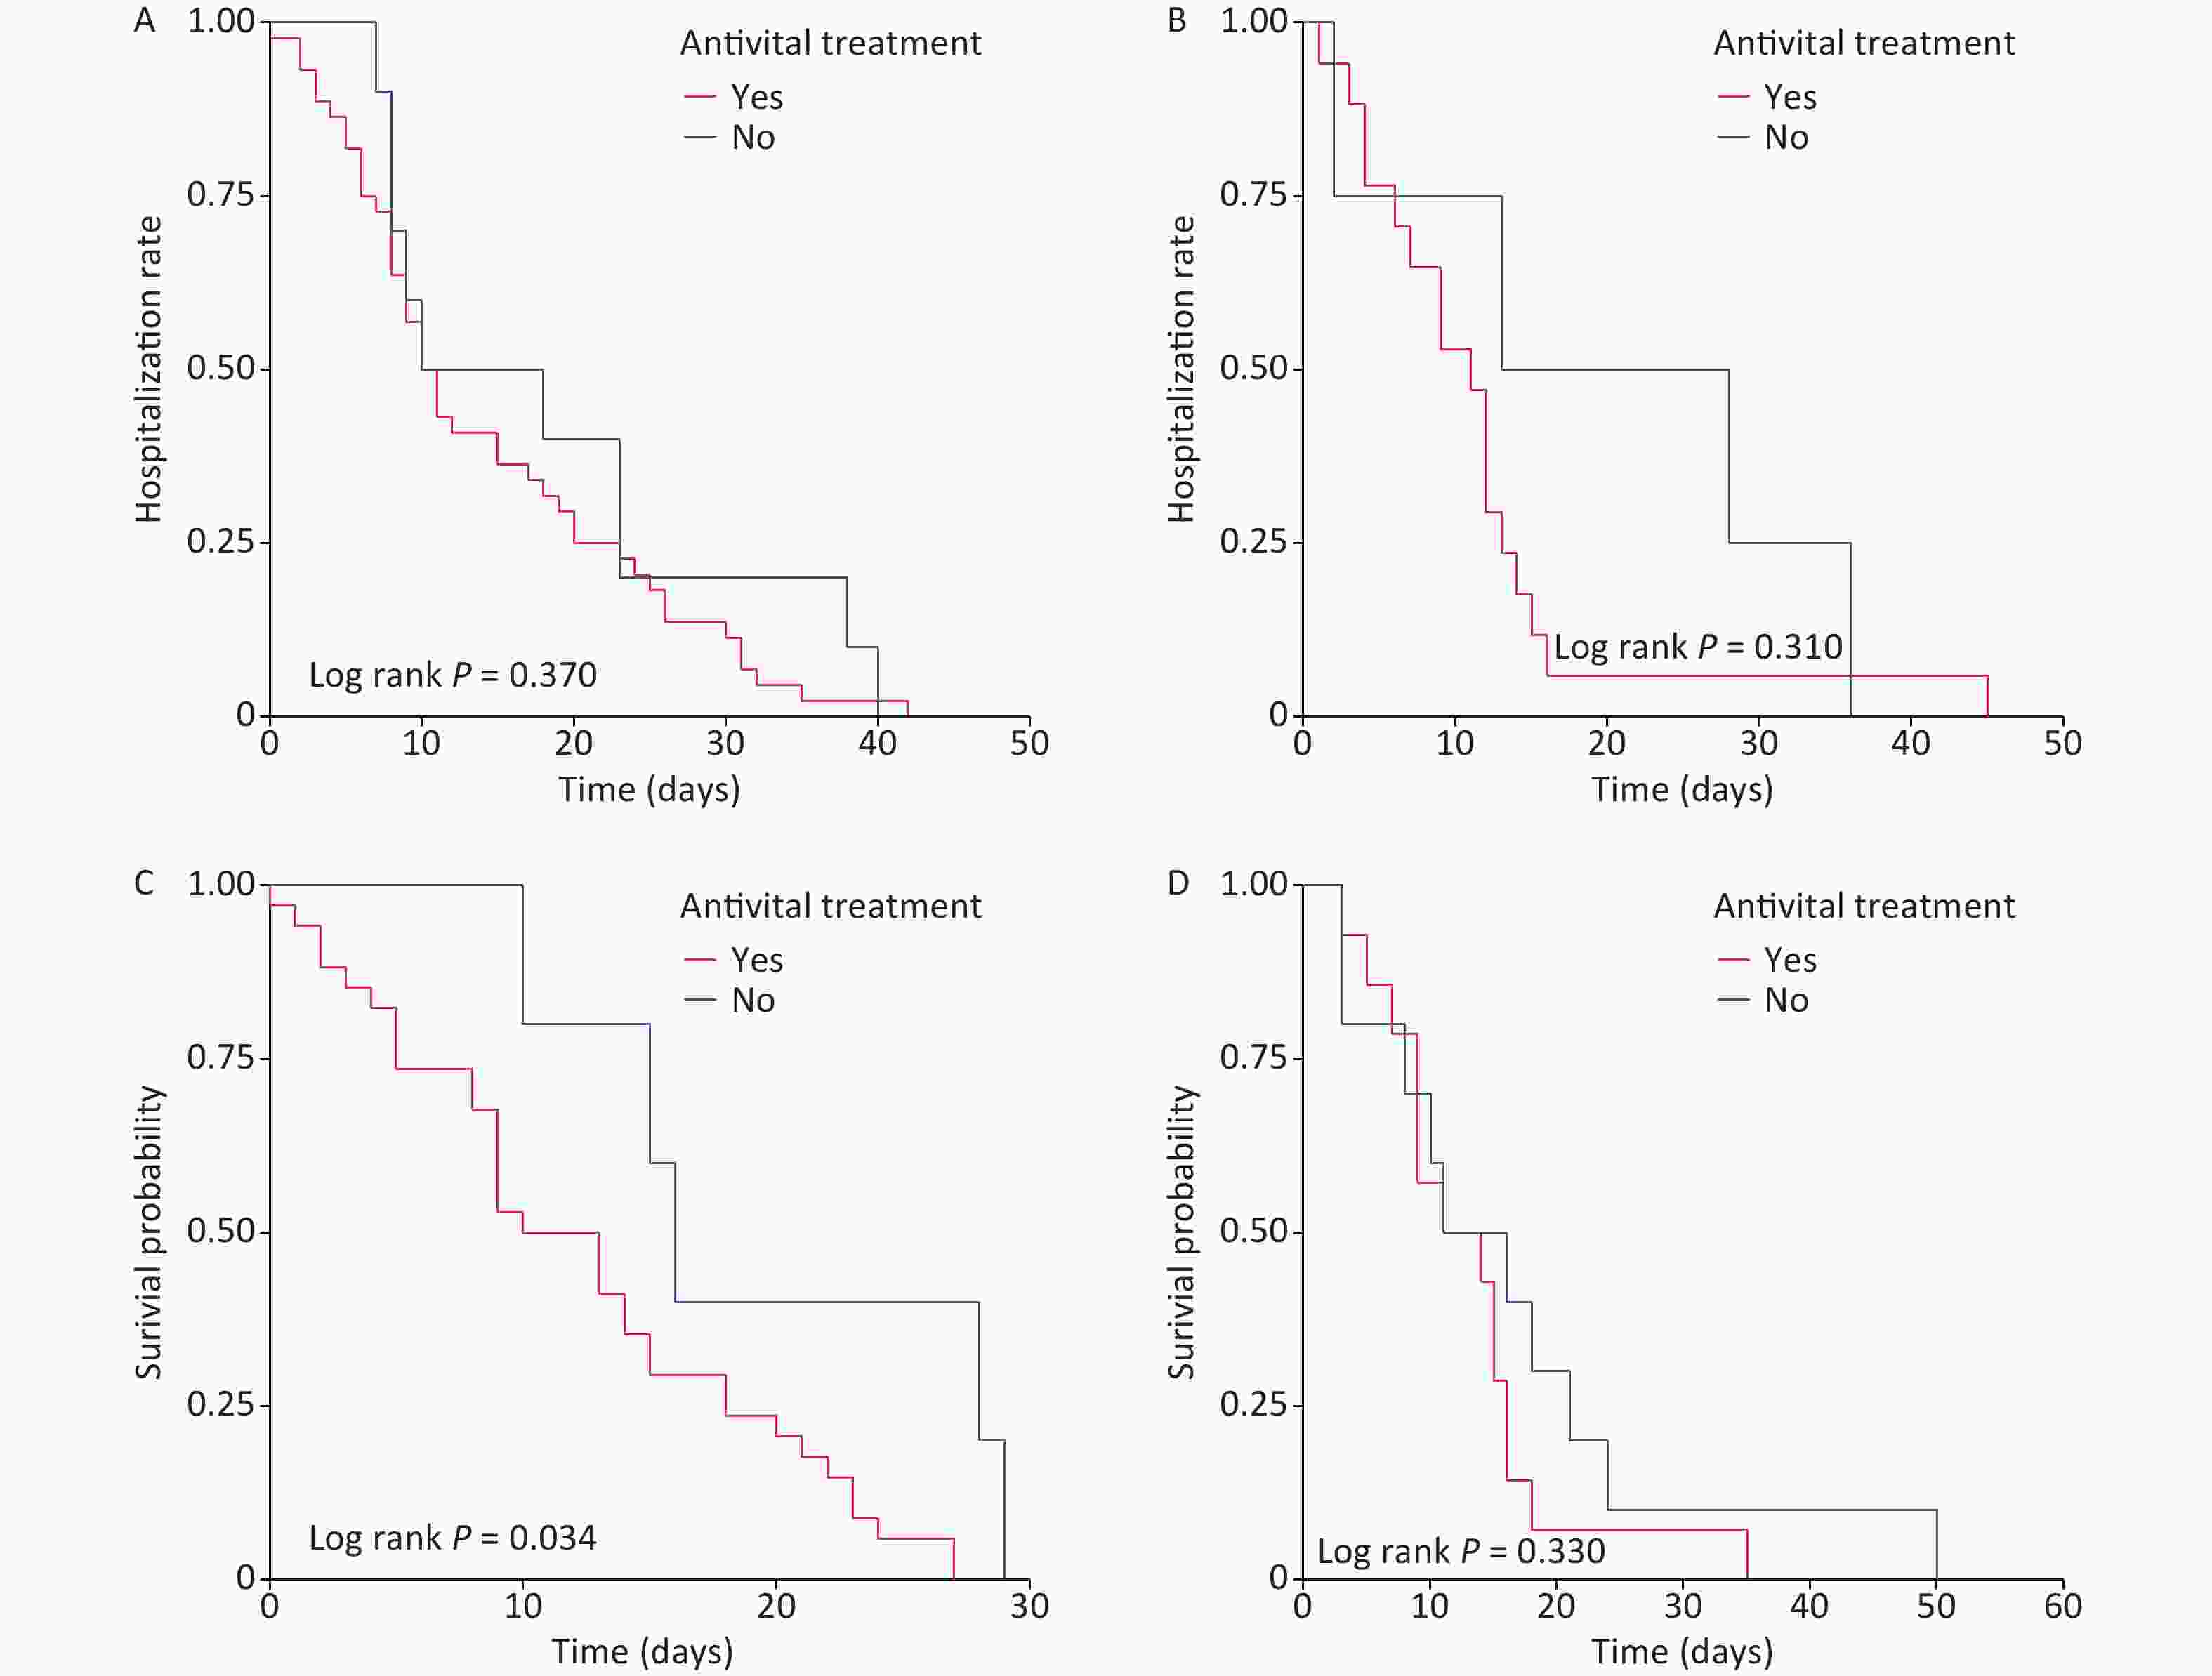
Figure S2. Adjusted Kaplan-Meier curves of antiviral treatment stratified by high-flow oxygen therapy. (A) Kaplan-Meier curves of surviving patients without high-flow oxygen therapy, (B) Kaplan-Meier curves of surviving patients with high-flow oxygen therapy, (C) Kaplan-Meier curves of deaths without high-flow oxygen therapy, and (D) Kaplan-Meier curves of deaths with high-flow oxygen therapy.

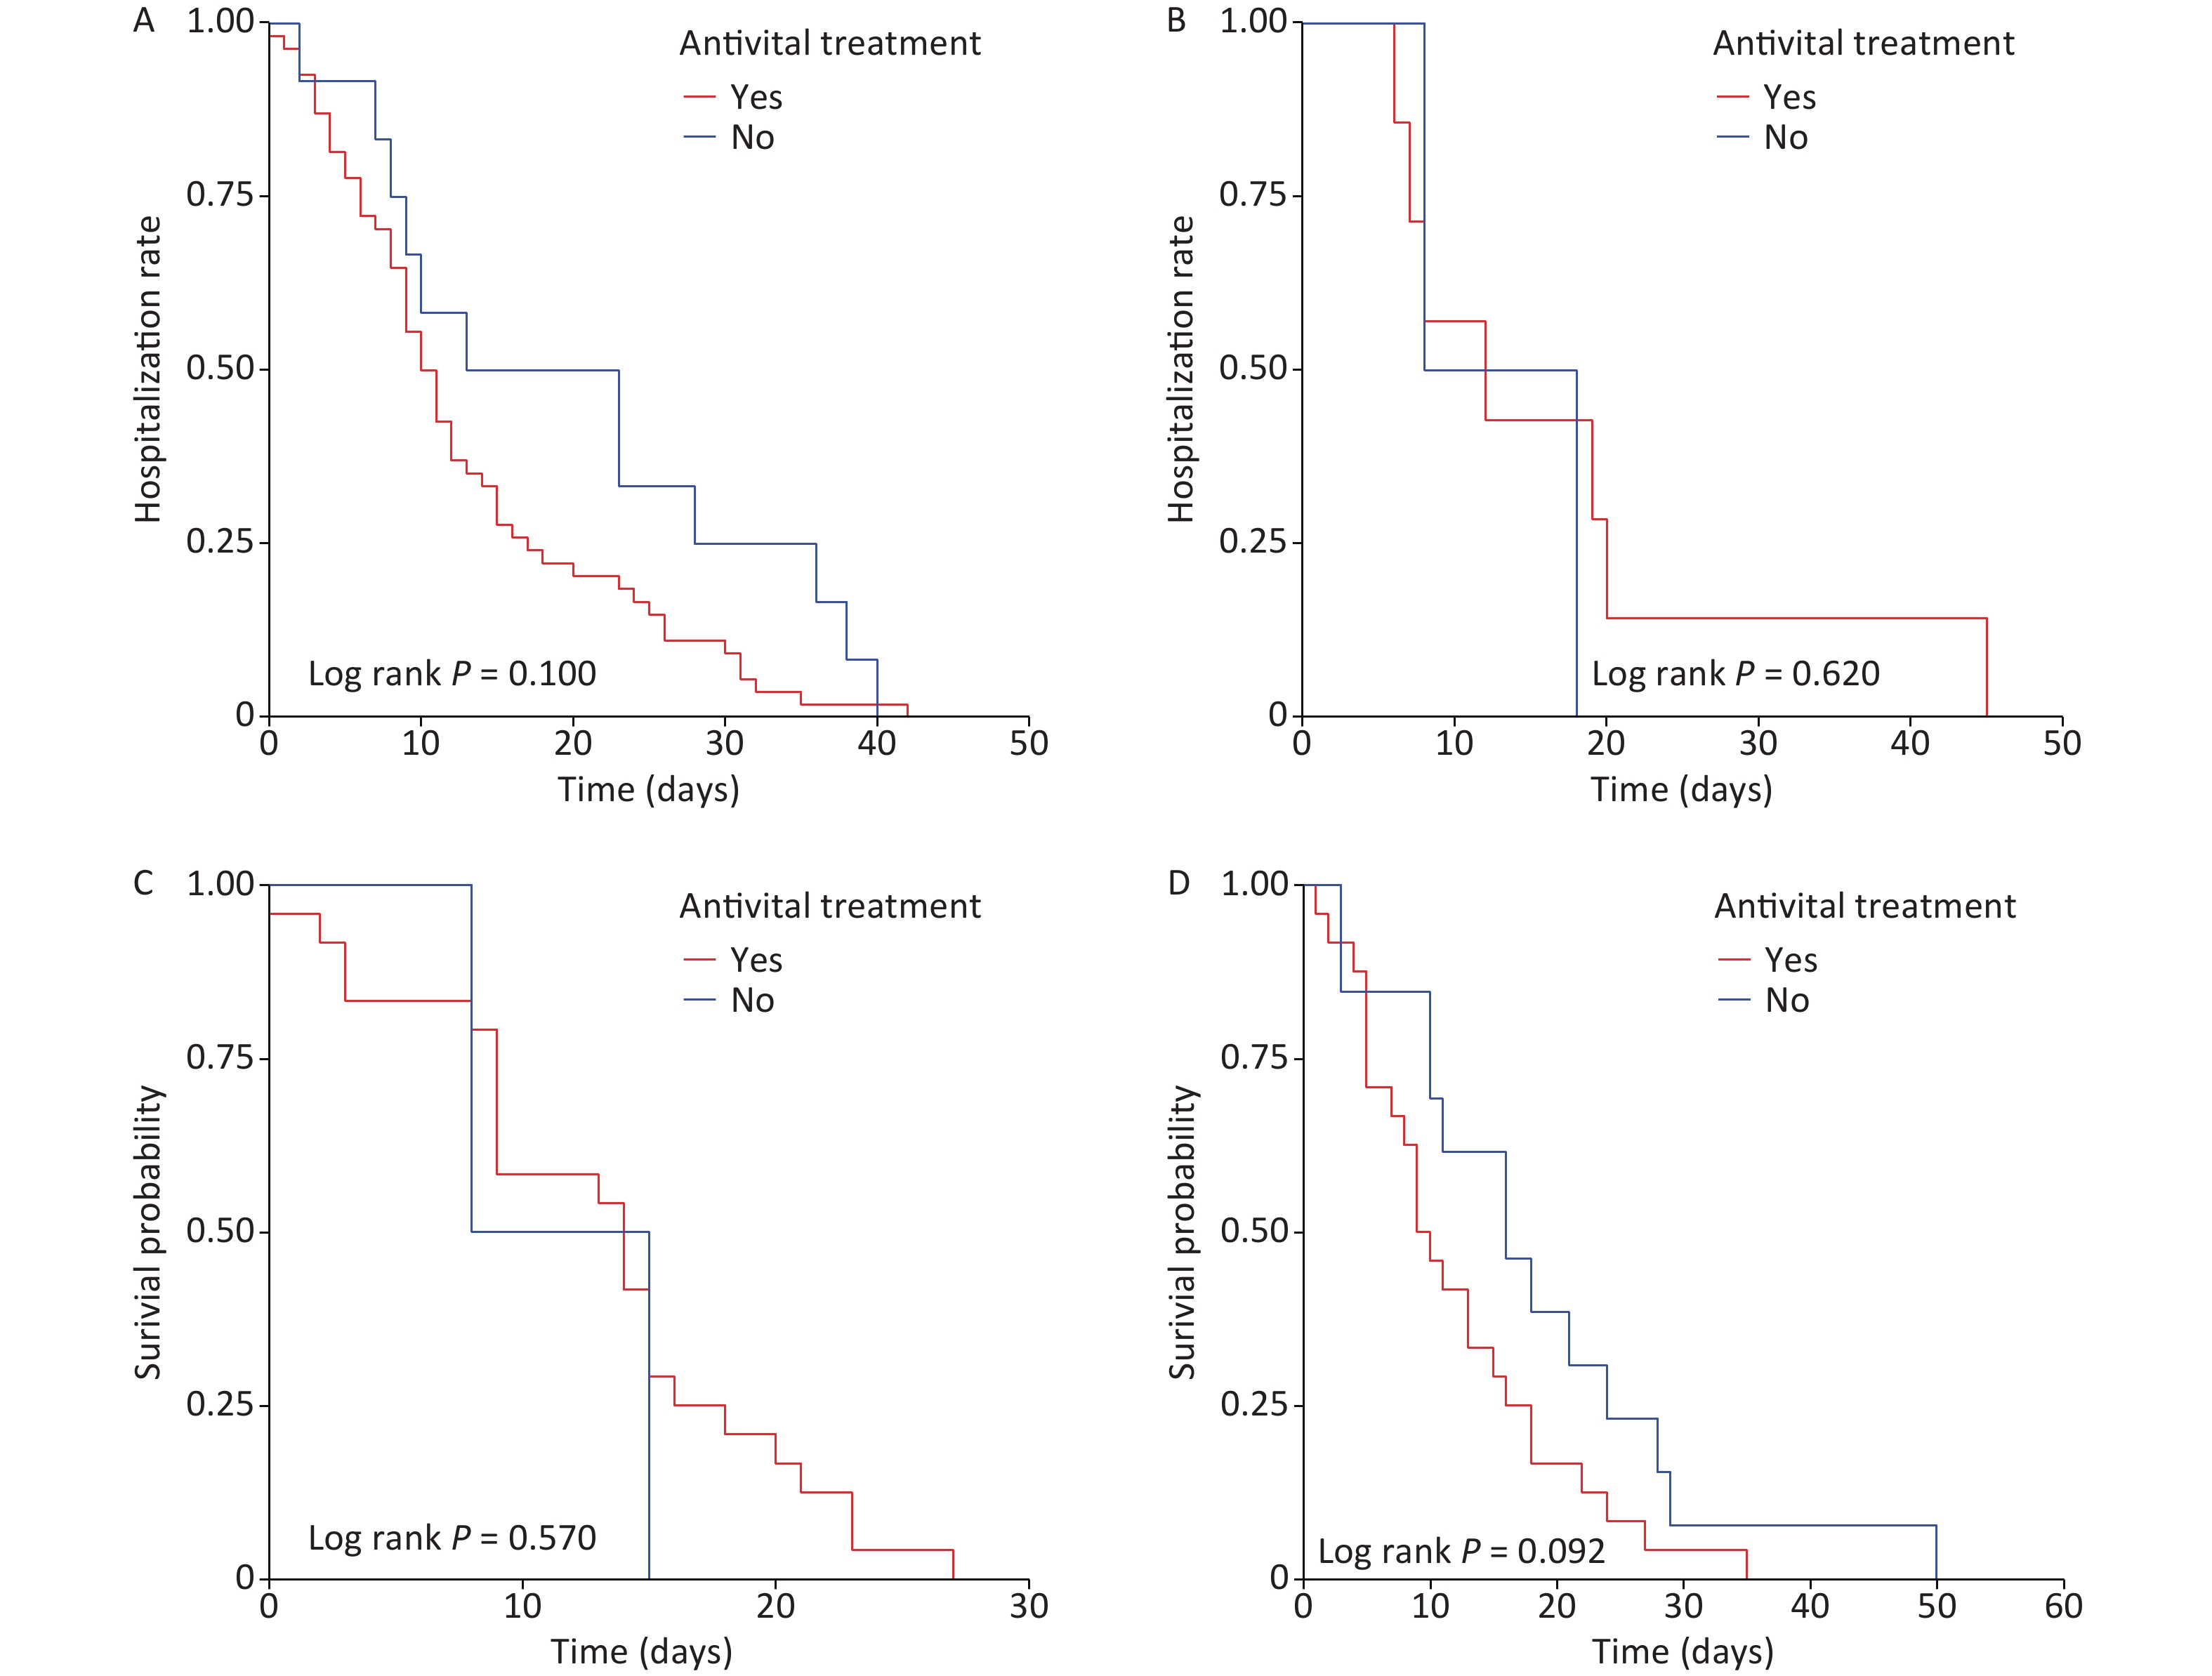
Figure S3. Adjusted Kaplan-Meier curves of antiviral treatment stratified by non-invasive ventilation. (A) Kaplan-Meier curves of surviving patients without non-invasive ventilation, (B) Kaplan-Meier curves of surviving patients with non-invasive ventilation, (C) Kaplan-Meier curves of deaths without non-invasive ventilation, and (D) Kaplan-Meier curves of deaths with non-invasive ventilation.
Item Total (n = 138) Antiviral treatment P Yes (n = 109) No (n = 29) Vital signs Systolic blood pressure (mmHg; normal range 90–140) 130 (120–140) 130 (120–140) 130.5 (110.5–141.5) 0.720 Increased 1 (0.7) 1 (0.9) 0 (0.0) 0.670 Decreased 30 (21.7) 23 (21.1) 7 (24.1) Diastolic blood pressure (mmHg; normal range 60–90) 80 (70–85) 80 (72–84.75) 74.5 (64.25–86) 0.247 Increased 7 (5.1) 6 (5.5) 1 (3.4) 0.932 Decreased 11 (8.0) 9 (8.3) 2 (6.9) Heart rate (beats per minute; normal range 60–100) 90 (80–101) 90 (80-101) 88 (80–100) 0.635 Increased 35 (25.4) 30 (27.5) 5 (17.2) 0.258 Axillary temperature (℃; normal range 36.2–37.3) 36.8 (36.5–37.7) 36.8 (36.6–37.7) 37.0 (36.5–37.8) 0.885 Increased 50 (36.2) 36 (33.0) 14 (48.3) 0.129 Respiratory rate (breaths per minute; normal range 12–20) 23 (20–27) 23 (20–26) 23 (20–29.5) 0.318 21–29 62 (45.6) 49 (45.4) 13 (46.4) 0.165 ≥ 30 23 (16.9) 16 (14.8) 7 (25.0) Oxygen saturation (%; normal range ≥ 94) 89 (84.75–95) 89.5 (85–94) 88.5 (83.25–95.75) 0.664 Decreased 100 (72.5) 80 (73.4) 20 (69.0) 0.635 Laboratory finding s Leucocytes (109/L; normal range 3.5–9.5) 7.68 (5.20–11.05) 6.79 (4.75–10.90) 8.10 (6.79–11.25) 0.088 Increased 43 (31.4) 33 (30.6) 10 (34.5) 0.661 Decreased 11 (8.0) 9 (8.3) 2 (6.9) Neutrophils (109/L; normal range 1.8–6.3) 6.47 (3.86–9.89) 6.09 (3.44–9.93) 7.24 (5.36–9.99) 0.086 Increased 72 (52.6) 52 (48.1) 20 (69.0) 0.043 Lymphocytes (109/L; normal range 1.1–3.2) 0.58 (0.36–0.92) 0.58 (0.36–0.89) 0.63 (0.34–1.22) 0.477 < 1.0 111 (81.0) 90 (83.3) 21 (72.4) 0.183 ≥ 1.0 26 (19.0) 18 (16.7) 8 (27.6) Erythrocyte (1012/L; normal range 4.3–5.8) 4.00 (3.65–4.49) 4.05 (3.66–4.51) 3.92 (3.43–4.39) 0.192 Decreased 92 (67.2) 71 (65.7) 21 (72.4) 0.453 Haemoglobin (g/L; normal range 130–175) 121 (108–131) 121 (108–134) 118 (105–126) 0.365 Decreased 101 (73.7) 77 (71.3) 24 (82.8) 0.209 Platelet count (109/L; normal range 125–350) 172.0 (118.0–237.5) 173.0 (127.0–240.3) 164.0 (98.5–212.5) 0.307 Decreased 35 (25.5) 26 (24.1) 9 (31.0) 0.341 Procalcitonin (ng/mL; normal range < 0.5) 0.28 (0.06–1.28) 0.28 (0.06–1.29) 0.46 (0.05–1.23) 0.786 Increased 59 (44.4) 46 (44.2) 13 (44.8) 0.954 IL-6 (pg/mL; normal range 0.0–7.0) 0 (0–5.77) 0 (0-0) 62.13 (2.43–86.22) < 0.001 Increased 10 (23.8) 3 (9.4) 7 (70.0) < 0.001 ESR (mm/h; normal range 0.0–15.0) 45 (26–63) 43 (23–55) 45 (35–75) 0.458 Increased 25 (86.2) 16 (88.9) 9 (81.8) 1.000 D-dimer (ng/mL; normal range 0.0–500.0) 1.90 (0.52–6.21) 1.11 (0.41–5.03) 71.15 (2.44–2197.00) < 0.001 Increased 12 (9.9) 2 (2.2) 10 (35.7) < 0.001 Fibrinogen (mg/dL; normal range 238–498) 4.17 (3.01–5.43) 3.85 (2.86–5.01) 182.50 (4.15–453.50) < 0.001 Increased 7 (5.6) 3 (3.0) 4 (15.4) < 0.001 Decreased 106 (84.8) 92 (92.9) 14 (53.8) ALT (U/L; normal range 9.0–50.0) 33.95 (22.63–48.75) 35.00 (23.00–52.00) 30.00 (20.00–42.5.) 0.310 Increased 32 (23.5) 28 (26.2) 4 (13.8) 0.163 AST (U/L; normal range 15.0–40.0) 39.4 (28.40–59.443) 41.0 (28.6–59.9) 36.0 (5.9–10.2) 0.518 Increased 65 (47.8) 54 (50.5) 11 (37.9) 0.282 TBLI (μmol/L; normal range 5.0–21.0) 10.85 (7.48–16.65) 10.50 (7.50–16.51) 13.00 (7.44–18.30) 0.314 Increased 19 (14.0) 15 (14.0) 4 (13.8) 0.771 Albumin (g/L; normal range 40.0–55.0) 33.00 (29.43–36.00) 33.10 (29.80–36.20) 31.10 (27.80–33.05) 0.013 Decreased 125 (91.9) 97 (90.7) 28 (96.6) 0.516 Creatinine (μmol/L; normal range 64.0–104.0) 78.90 (57.73–105.30) 78.80 (58.80–105.40) 79.00 (46.70–101.75) 0.557 Increased 36 (26.5) 29 (27.1) 7 (24.1) 0.679 BUN (mmol/L; normal range 2.8–7.6) 6.66 (4.88–10.07) 6.60 (4.90–8.90) 7.35 (4.30–17.72) 0.508 Increased 51 (37.5) 37 (34.6) 14 (48.3) 0.290 hs-cTnI (pg/mL; normal range 0.0–26.2) 0.03 (0.01–0.29) 0.02 (0.01–0.10) 1.02 (0.01-131.10) 0.002 Increased 7 (6.2) 4 (4.7) 3 (11.1) 0.449 Blood glucose (mmol/L; normal range 3.9–6.1) 7.01 (5.89–10.17) 6.90 (5.89–10.40) 7.30 (5.87–10.17) 0.930 Increased 83 (68.6) 66 (69.5) 17 (65.4) 0.827 pH (normal range 7.35–7.45) 7.42 (7.36–7.46) 7.42 (7.36–7.46) 7.43 (7.31–7.46) 0.670 Increased 30 (28.3) 26 (28.6) 4 (26.7) 0.745 Decreased 24 (22.6) 20 (22.0) 4 (26.7) PaO2 (mmHg; normal range 80–100) 68.35 (46.75–81.73) 68.40 (47.00–81.60) 60.00 (40.00–96.00) 0.680 Decreased 76 (71.7) 65 (71.4) 11 (73.3) 0.954 PaCO2 (mmHg; normal range 35–45) 39.50 (33.70–48.05) 39.10 (33.70–47.70) 41.90 (33.60–57.00) 0.379 Increased 34 (32.4) 28 (31.1) 6 (40.0) 0.606 HCO3- (mmol/L; normal range 21.4–27.3) 24.50 (18.70–29.25) 24.75 (20.90–29.18) 21.00 (16.50–30.10) 0.174 Increased 43 (41.0) 38 (42.2) 5 (33.3) 0.123 Decreased 30 (28.6) 22 (24.4) 8 (53.3) Lactate (mmol/L; normal range 0.5–1.6) 2.26 (1.50–3.10) 2.26 (1.50–3.15) 2.10 (1.36–3.08) 0.693 Increased 68 (68.7) 62 (69.7) 6 (60.0) 0.575 Note. Data are presented by number (%) or median (IQR). P values were calculated by Mann-Whitney test, χ2-test, or Fisher’s exact test, as appropriate. ALT, alanine aminotransferase; AST, aspartate aminotransferase; BUN, blood urea nitrogen; COVID-19, coronavirus disease 2019; ESR, erythrocyte sedimentation rate; HCO3-, bicarbonate concentration; IL-6, interleukin-6; IQR, interquartile range; hs-cTnI, high sensitivity troponin; PaO2, partial pressure of oxygen in artery; PaCO2, partial pressure of carbon dioxide in artery; pH, potential-of-hydrogen; TBLI, total bilirubin. Denominator used for calculating the percentage may not be the total number because of missing data. Table S1. Vital signs and laboratory findings of severe COVID-19 patients at admission
HTML
 Supplementary Materials21298.pdf
|

|

 Quick Links
 DownLoad: