


-
Since the first case of acquired immune deficiency syndrome (AIDS) was detected in the United States in 1981, this disease has spread to every corner of the world. Despite the annual incidence of AIDS showing a slight decline since 1997, it remains a major cause of infectious disease-related death worldwide. Unlike global epidemiological trends, the number of notified AIDS cases has increased in recent years in China[1]. Moreover, among the class B notifiable infectious diseases, AIDS was responsible for the highest mortality rate from 2008 to 2019, still failing to be identified as a vaccine-preventable disease[1]. Thus, to provide more unambiguous and quantitative direction for the effective formulation of preventive planning strategies and for the reasonable allocation of limited resources, a forecasting model with high precision and accuracy to understand the future epidemic behaviors of AIDS is required. During the model-building process, accurate statistics are vital to ensure the forecasting accuracy of the model.
Since December 2019, coronavirus disease 2019 (COVID-19) has rapidly evolved into a major global public health issue. Confronted with this unprecedented crisis, countries have taken various measures to stop the continued spread of COVID-19. In China, a series of effective measures were implemented, and these measures played an important role in stopping the spread of COVID-19[2]. However, it is discovered that these rigorous prevention and control strategies and measures also had an effect on the incidence and mortality rates of other diseases; however, further studies are needed to measure the impacts. To date, there are no reports on the effect of such interventions on AIDS case numbers in China.
Time series analysis is frequently used to provide predictions that aid the development of effective prevention and control strategies. The causal impacts of strict counter-virus measures on AIDS case numbers can be assessed with intervention analysis under the Bayesian structural time series (BSTS) model that can generate a counterfactual prediction in a synthetic control series to describe outcomes in the absence of the intervention[3]. Therefore, the current study aims to estimate the effect of counter-COVID-19 measures on the reduction in AIDS case notifications and to predict the epidemic patterns using the BSTS model. Our findings offer insight that will aid the development of effective strategies to control AIDS case numbers in China in the future.
The monthly number of AIDS cases and population data from 31 provinces in mainland China from January 2004 to December 2020 were collected. All cases were checked medically and diagnosed in accordance with the diagnostic criteria for HIV/AIDS before being reported to the Chinese Centre for Disease Control. Considering the effects of COVID-19 on the epidemiological trend of AIDS, the data from January 2004 to December 2019 were only used when exploring the usefulness and flexibility of the BSTS model in forecasting trends in the AIDS epidemics. The average annual percentage change (AAPC) and annual percentage change (APC) were employed to describe the epidemic patterns of AIDS[4]. The BSTS model was used to perform causal inference and time series forecasting. The mean absolute deviation (MAD), root mean square error (RMSE), mean absolute percentage error (MAPE), mean error rate (MER), and root mean square percentage error (RMSPE) were adopted to judge the forecasting performance of the BSTS model[4]. All statistical analyses were performed using R software (Version 3.4.3).
During the study period, there were a total of 643,800 case notifications (2.866 per 100,000 persons). A notable upward trend was observed in case numbers [AAPC = 20.446, 95% confidence interval (CI) 16.685 to 24.329; t = 11.493, P < 0.001] that comprised two stages: an upsurge from 2004 to 2010 (APC = 41.731, 95% CI 31.421 to 52.849; t = 10.062, P < 0.001) and then a slow increase from 2011 to 2020 (APC = 6.127, 95% CI 3.825 to 8.481; t = 5.907, P < 0.001) (Supplementary Figure S1, available in www.besjournal.com). The primary reason for this variation may be China's action planning on the prevention and control of AIDS (2006–2010), which stated that by 2010, the number of people living with HIV in China must be reduced to less than 1.5 million, and therefore a series of AIDS prevention measures were implemented. The incidence of AIDS showed a trough in January/February and a peak in December each year, and this seasonal pattern became more marked since 2010 (Supplementary Figure S2, available in www.besjournal.com). The effect of the spring festival may be closely related to the seasonality of AIDS.
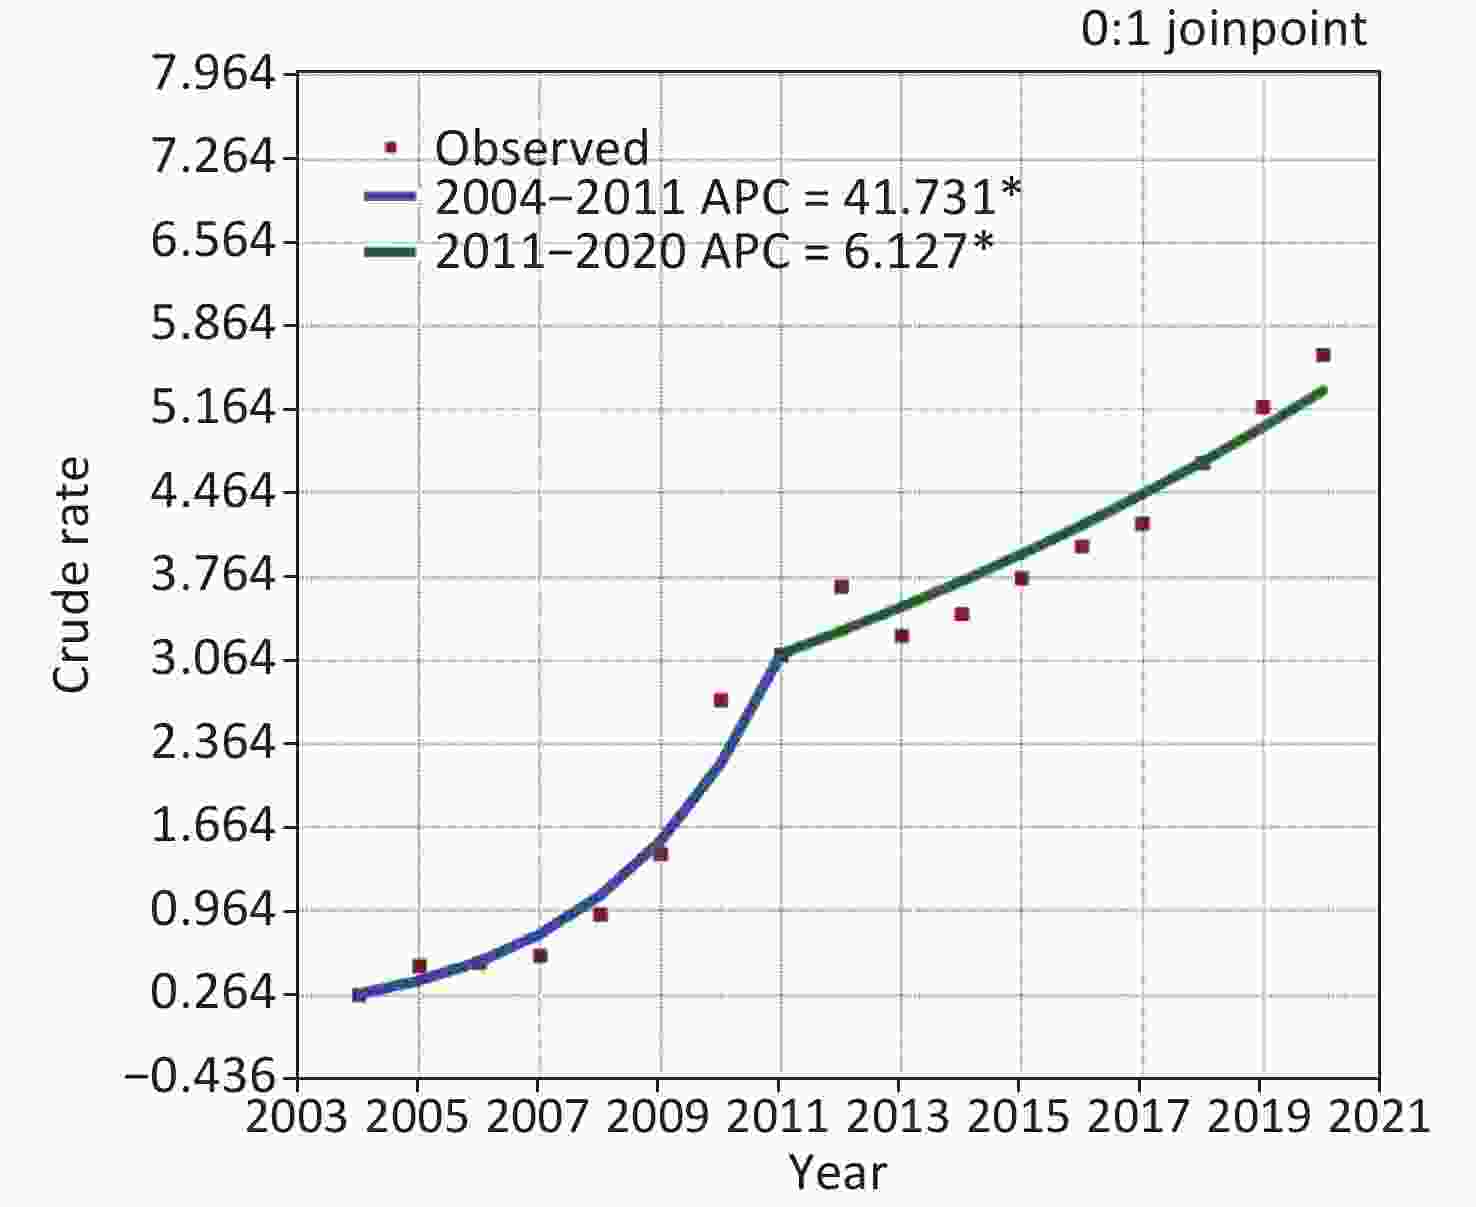
Figure S1. Joinpoint regression plot showing the AIDS epidemiological trends during 2004–2020. *Showed that the annual percent change (APC) is statistically significant.
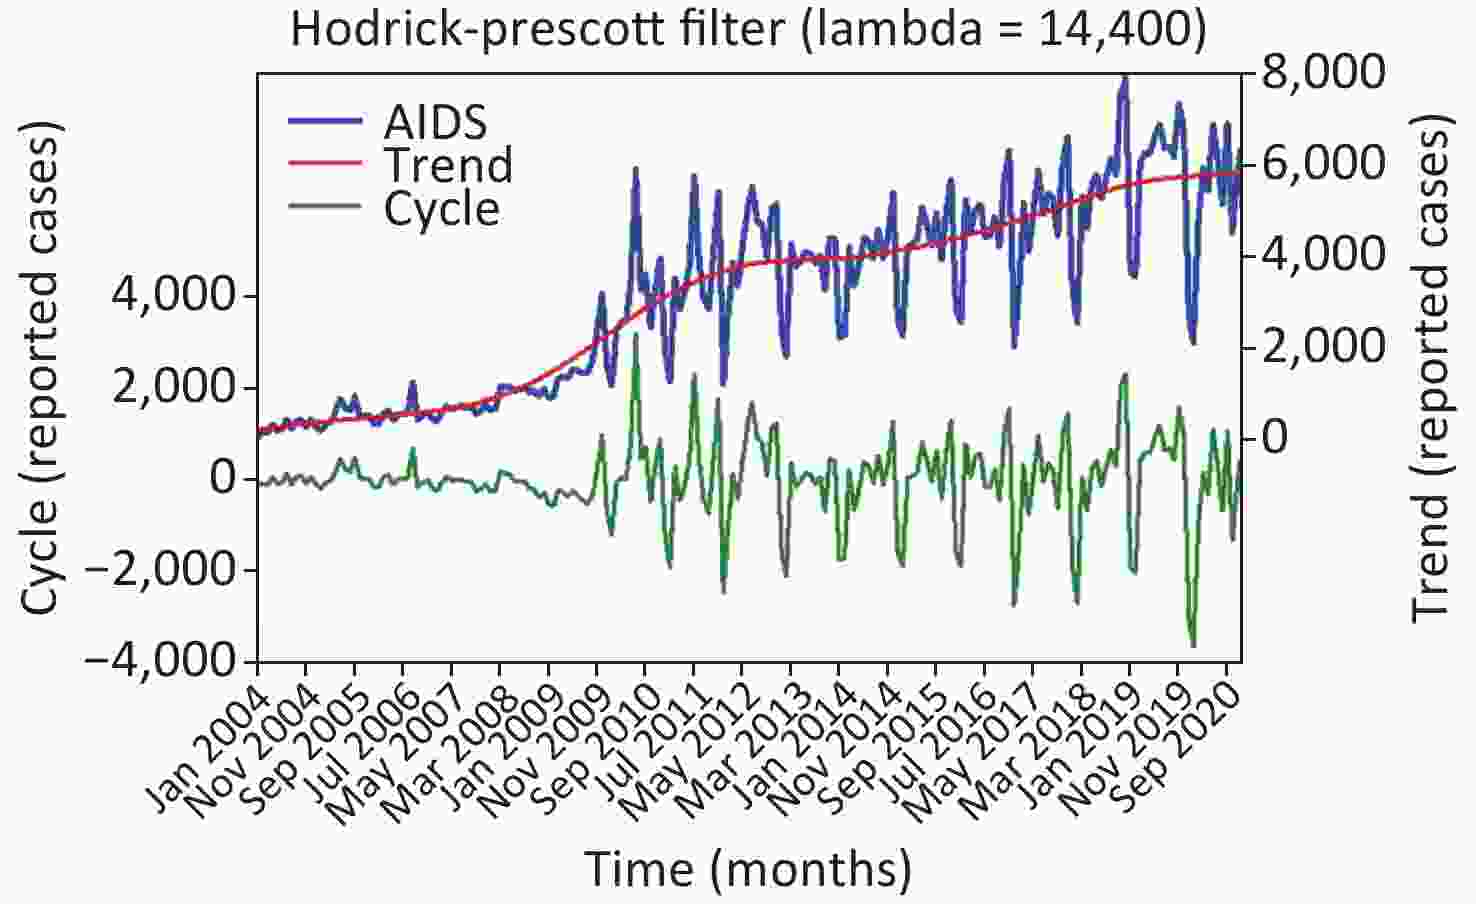
Figure S2. Time series plot showing the AIDS incidence and the decomposed tend and cyclicity based on the Hodrick-Prescott filter technique.
The year 2020 was regarded as a period of intervention when performing intervention analysis using the BSTS method. In estimating the causal effect of interventions on case number reduction by use of the BSTS method, the seasonality, time effects, and the population were deemed as covariates. The predicted expected case notifications are provided in Table 1, suggesting a monthly average decrease in AIDS case notifications of 41% (95% CI 24% to 58%) from January–March 2020, 19% (95% CI 14% to 46%) from January–June 2020, and 16% (95% CI 7.3% to 24%) from January–December 2020 owing to the COVID-19 pandemic. The BSTS model can infer the temporal changing trends of potential effects, incorporate prior empirical information on the parameters, and deal with a complex covariate structure[3]. Considering that the Bayesian confidential interval and posterior probability of a causal effect under the BSTS model rejected the reduction in AIDS case notifications owing to the COVID-19 outbreak as a random event, this confirmed reliable evidence for a true causal impact (Table 1, Supplementary Figures S3 and S4, available in www.besjournal.com). This result suggested that COVID-19 may have resulted in medium- and longer-term impacts for the AIDS epidemic, which corroborated a previous finding that COVID-19 may have medium- and longer-term impacts on disease patterns[5]. There are a number of possible explanations for these effects[5, 6]. First, people with chronic conditions or mild symptoms were discouraged from seeking medical help to reduce congestion in hospitals. Second, the stringent prevention and control measures and the mandatory requirement for the negative results of nucleic acid testing may have resulted in reluctance among people infected with HIV to have a medical diagnosis and examination. Third, many hospitals declined non-urgent service requests, especially when the medical system was overburdened during the peak of the COVID-19 outbreak. Fourth, there has been a significant decrease in the number of people administered preventive AIDS treatment, and a decrease in spending on AIDS diagnostic, therapeutic, and prevention services. Fifth, AIDS-specialized medical personnel and molecular diagnostic platforms may have been reallocated to the COVID-19 response. Sixth, the stringent anti-contagion policies restricted the movement of people, and the sudden economic disruption may have made it difficult for people infected with HIV to visit hospitals. Seventh, there are some similarities between the clinical features of AIDS (e.g., influenza-like symptoms, systemic fatigue, loss of appetite, fever, and cough) and COVID-19, resulting in concerns about stigma. Lastly, there have been delays in reporting HIV infections during the COVID-19 pandemic.
Months Average cases Predictions
(95% CI)Absolute effect
(95% CI)Cumulative cases Predictions
(95% CI)Absolute effect
(95% CI)Relative effect,
% (95% CI)P Prob. of causal
effect, %1 2,759 5,355
(3,797, 6,920)−2,596
(−4,161, −1,038)2,759 5,355
(3,797, 6,920)−2,693
(−4,295, −1,141)−48
(−78, −19)0.002 99.80 1−2 2,446 5,437
(4,308, 6,531)−2,991
(−4,085, −1,862)4,892 10,874
(8,615, 13,062)−5,982
(−8,170, −3,723)−55
(−75, −34)0.001 99.90 1−3 3,233 5,520
(4,553, 6,425)−2,286
(−3,191, −1,320)9,700 16,559
(13,659, 19,274)−6,859
(−9,574, −3,959)−41
(−58, −24)0.001 99.90 1−4 3,915 5,602
(4,708, 6,478)−1,687
(−2,563, −793)15,660 22,409
(18,831, 25,911)−6,749
(−10,251, −3,171)−30
(−46, −14)0.001 99.90 1−5 4,229 5,684
(4,919, 6,486)−1,456
(−2,257, −690)21,144 28,422
(24,594, 32,431)−7,278
(−11,287, −3,450)−26
(−40, −12)0.001 99.90 1−6 4,676 5,767
(4,963, 6,520)−1,090
(−1,844, −286)28,059 34,600
(29,777, 39,120)−6,541
(−11,061, −1,718)−19
(−32, −5)0.004 99.60 1−7 4,883 5,849
(5,185, 6,526)−966
(−1,642, −301)34,183 40,943
(36,292, 45,680)−6,760
(−11,497, −2,109)−17
(−28, −5.1)0.003 99.70 1−8 4,919 5,931
(5,627, 6,628)−1,013
(−1,709, −348)39,349 47,449
(42,135, 53,025)−8,100
(−13,676, −2,786)−17
(−29, −5.9)0.002 99.80 1−9 5,142 6,013
(5,401, 6,646)−872
(−1,504, −259)46,276 54,121
(48,607, 59,813)−7,845
(−13,537, −2,331)−14
(−25, −4.3)0.004 99.60 1−10 5,082 6,096
(5,482, 6,715)−1,013
(−1,633, −400)50,822 60,957
(54,822, 67,153)−10,135
(−16,331, −4,001)−17
(−27, −6.6)0.001 99.90 1−11 5,150 6,178
(5,608, 6,790)−1,028
(−1,640, −458)56,646 67,958
(61,685, 74,690)−11,312
(−18,044, −5,039)−17
(−27, −7.4)0.002 99.80 1−12 5,263 6,260
(5,719, 6,784)−997
(−1,521, −457)63,154 75,124
(68,634, 81,407)−11,970
(−18,253, −5,480)−16
(−24, −7.3)0.002 99.80 Note. CI, confidence interval Table 1. Causal effects of the COVID-19 pandemic on the reductions in the monthly average and cumulative number of AIDS cases from January–December 2020
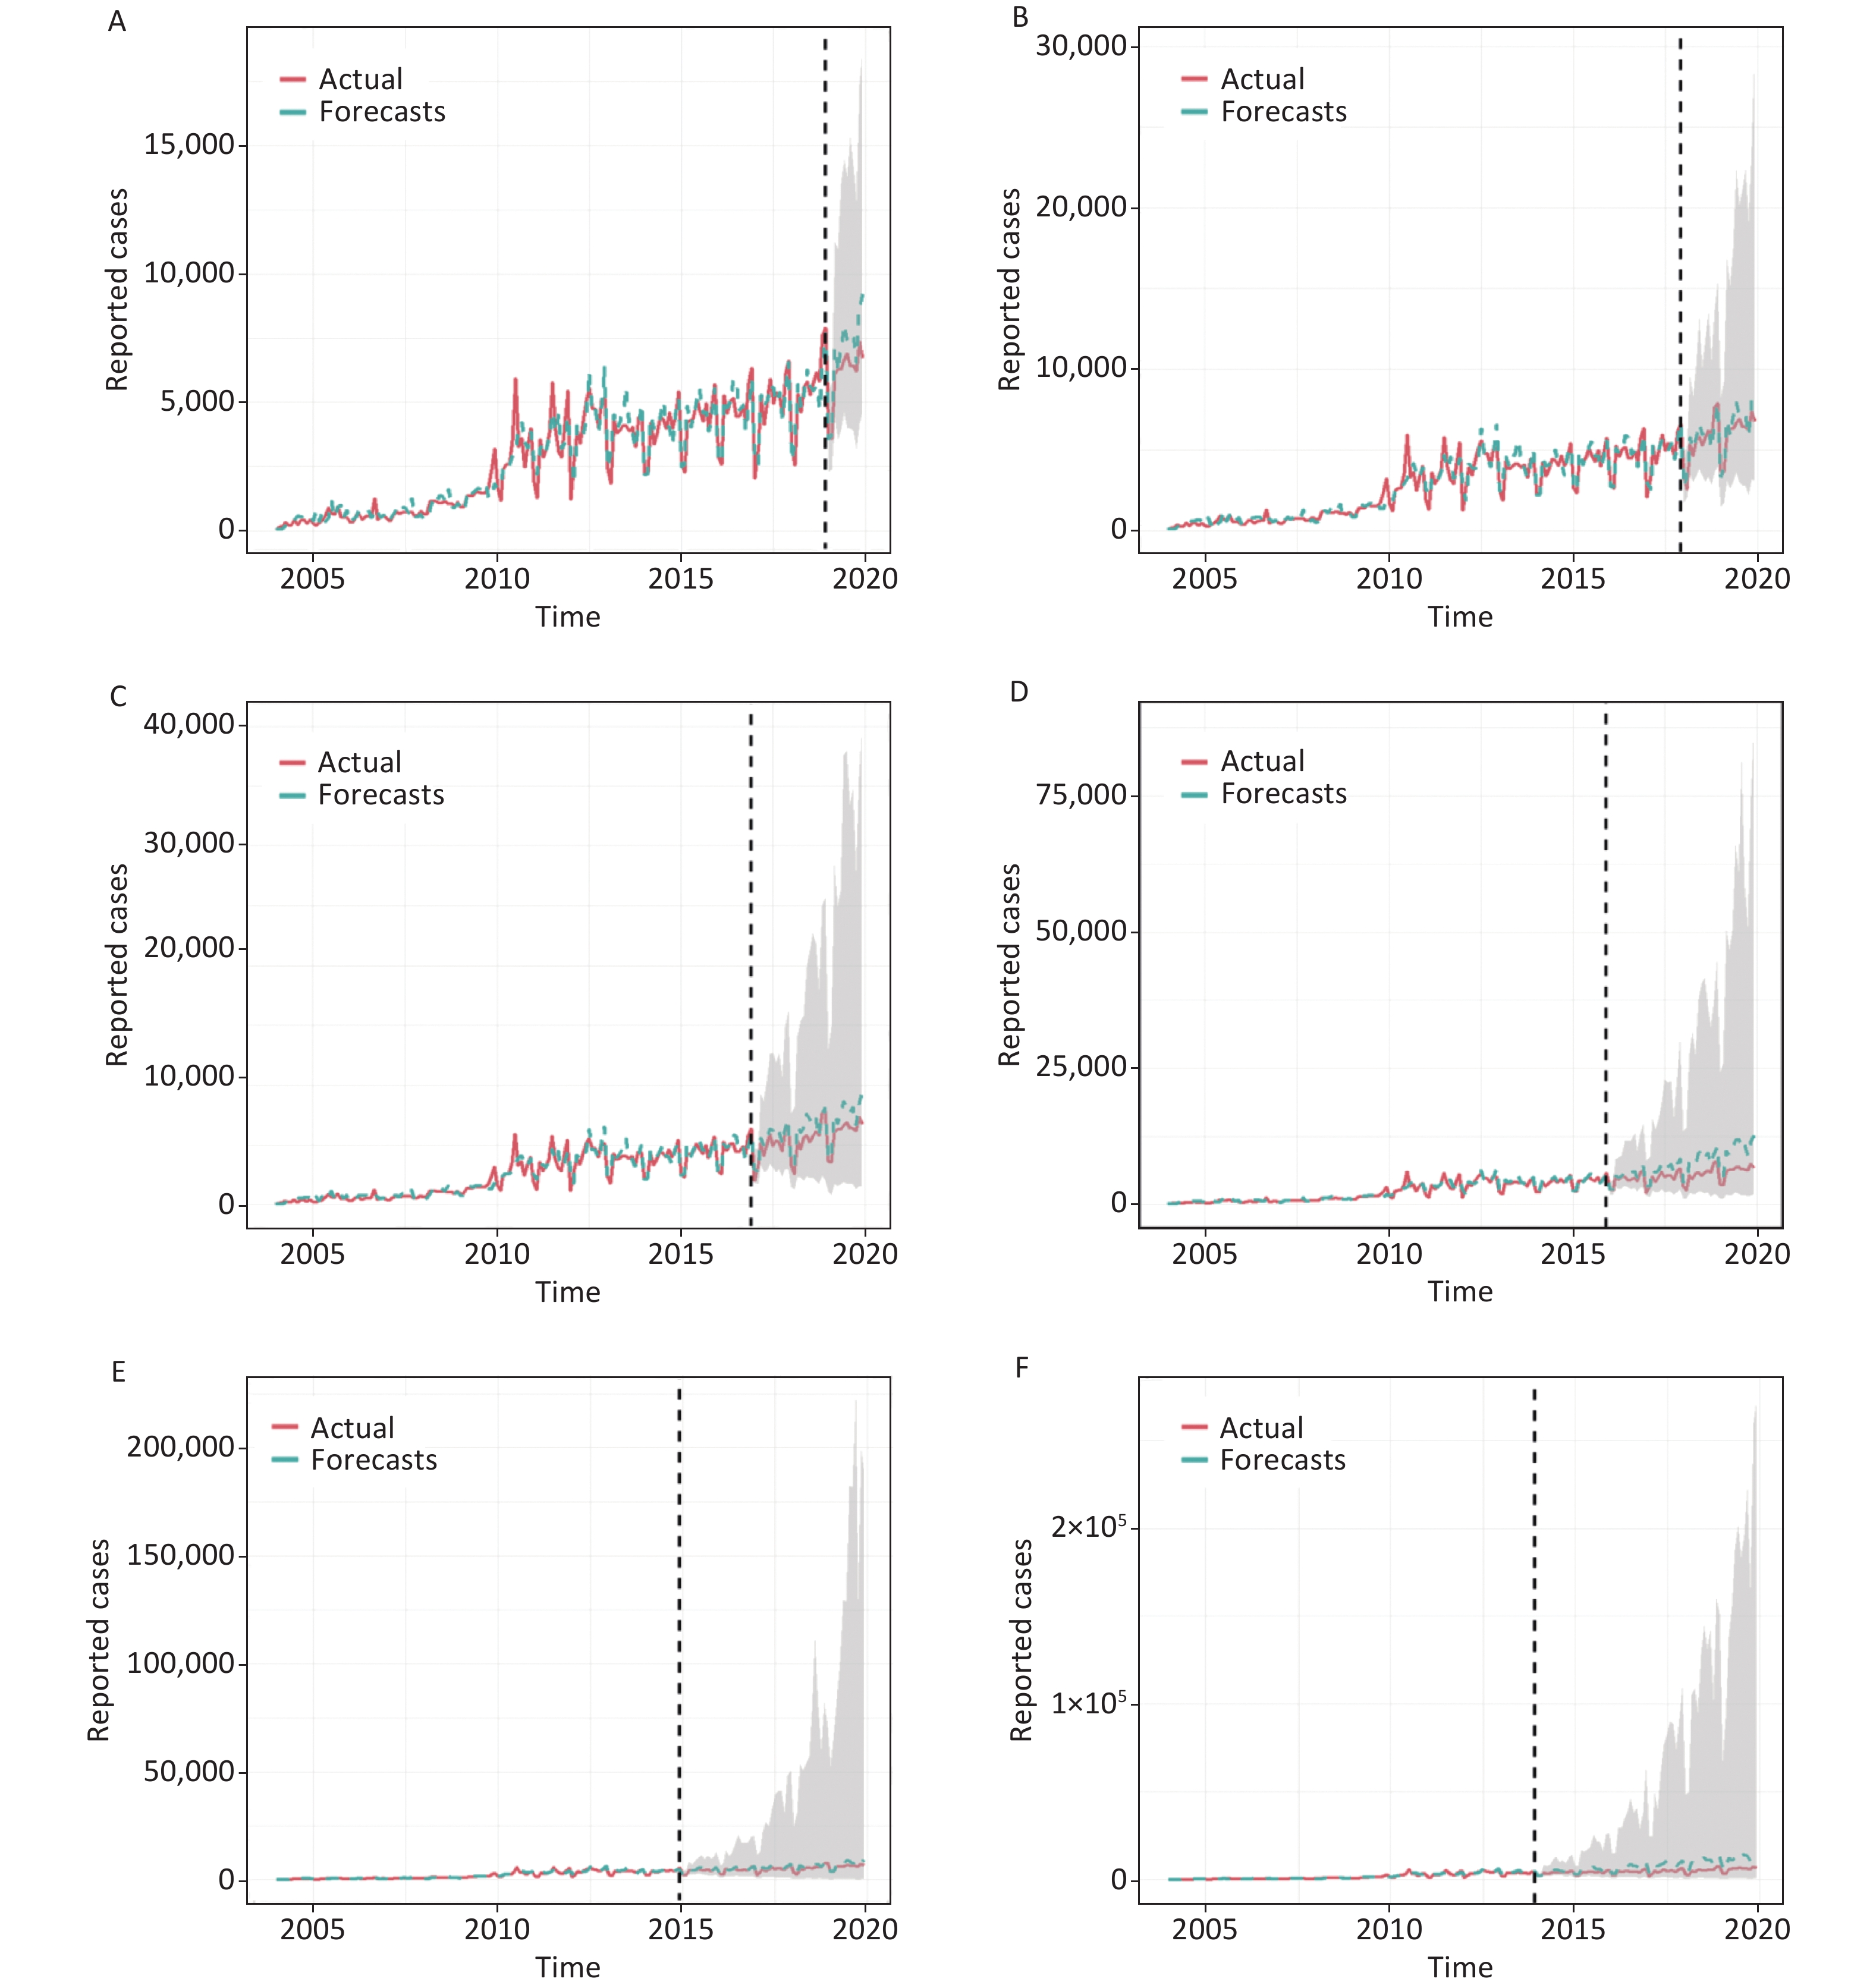
The expected figures were forecasted by averaging across the 500 Markov Chain Monte Carlo (MCMC) draws under the BSTS model (Supplementary Tables S1–S6, available in www.besjournal.com). Table 2 lists the values of MAD, RMSE, MAPE, MER, and RMSPE, which measure the predictive ability of the BSTS model. Accurate forecasts for the 12, 24, 36, 48, and 60 holdout periods were obtained because of the low error rates (this can be attributed to the BSTS model accurately showing the stochastic behavior of a time series and generating a projection based on the Bayesian model averages[7]). Whereas, an unacceptable forecast for the 72 holdout period was obtained owing to the large values of the above-mentioned five indices, especially the MAPE value, which was greater than 50% (Supplementary Figure S5, available in www.besjournal.com).
BSTS Models Testing horizons MAD MAPE RMSE MER RMSPE 12-step ahead prediction 874.248 13.469 1,110.482 0.144 0.167 24-step ahead prediction 604.931 11.062 723.140 0.105 0.131 36-step ahead prediction 890.655 16.853 1,088.463 0.163 0.202 48-step ahead prediction 2,062.473 37.534 2,541.301 0.392 0.440 60-step ahead prediction 767.230 15.228 1,020.522 0.151 0.199 72-step ahead prediction 3,140.360 59.821 3,889.489 0.644 0.698 Note. BSTS, Bayesian structural time series model; MAD, mean absolute deviation; MAPE, mean absolute percentage error; RMSE, root mean square error; MER, mean error rate; RMSPE, root mean square percentage error. Table 2. Comparisons of the predictive performance under the BSTS models
Time Observed values Forecasts Lower 95% CI Upper 95% CI Jan-19 3,688 3,585 2,312 5,456 Feb-19 3,587 3,705 2,392 5,749 Mar-19 6,086 7,096 4,435 11,251 Apr-19 6,277 6,243 3,561 10,956 May-19 6,291 7,160 3,953 13,509 Jun-19 6,642 7,998 4,629 14,462 Jul-19 6,912 7,419 4,017 13,787 Aug-19 6,404 7,495 3,994 15,313 Sep-19 6,435 7,645 3,919 14,208 Oct-19 6,207 6,554 3,210 12,858 Nov-19 7,366 8,685 4,182 17,364 Dec-19 6,735 9,262 4,648 18,713 Note. BSTS, bayesian structural time series; CI, confidence interval. Table S1. Projection into the next 12 months with the best BSTS model
Time Observed values Forecasts Lower 95% CI Upper 95% CI Jan-14 2,245 2,248 1,364 3,811 Feb-14 2,289 2,326 1,417 4,103 Mar-14 4,221 4,551 2,796 8,753 Apr-14 3,369 4,071 2,337 7,789 May-14 3,823 4,300 2,242 8,564 Jun-14 4,432 5,176 2,632 11,535 Jul-14 4,354 6,050 3,237 13,252 Aug-14 3,997 5,118 2,518 10,324 Sep-14 4,611 5,095 2,510 11,326 Oct-14 3,999 4,216 2,080 9,447 Nov-14 4,464 5,388 2,334 12,817 Dec-14 5,411 5,983 2,389 14,747 Jan-15 2,597 2,886 1,249 8,076 Feb-15 2,294 2,991 1,121 8,015 Mar-15 4,238 5,855 2,103 16,965 Apr-15 4,299 5,358 1,821 15,957 May-15 4,401 5,732 2,180 17,290 Jun-15 5,089 6,551 2,356 19,142 Jul-15 4,701 7,366 2,031 25,922 Aug-15 4,268 6,224 1,919 22,123 Sep-15 4,967 6,304 1,843 21,615 Oct-15 3,955 5,018 1,325 16,571 Nov-15 5,040 6,926 1,817 25,702 Dec-15 5,707 7,242 1,651 26,487 Jan-16 2,862 3,499 780 14,964 Feb-16 2,582 3,619 773 15,472 Mar-16 5,255 7,045 1,596 29,623 Apr-16 4,574 6,511 1,430 29,495 May-16 5,041 7,017 1,527 34,917 Jun-16 5,159 7,990 1,740 38,840 Jul-16 4,459 8,977 1,779 463,46 Aug-16 4,469 7,771 1,604 38,165 Sep-16 4,877 7,892 1,443 40,796 Oct-16 4,244 6,228 1,004 29,315 Nov-16 5,743 8,205 1,686 38,088 Dec-16 6,335 9,241 1,489 62,837 Jan-17 2,053 4,246 804 24,857 Feb-17 3,325 4,470 826 24,584 Mar-17 5,179 8,495 1,276 49,529 Apr-17 4,140 7,744 1,220 40,241 May-17 5,025 8,628 1,425 61,772 Jun-17 5,916 9,532 1,397 76,932 Jul-17 4,950 10,786 1,551 82,617 Aug-17 5,400 9137 1237 90,036 Sep-17 5,283 9,181 1,195 89,067 Oct-17 4,485 7,446 862 74,554 Nov-17 6,136 9,671 1,319 91,413 Dec-17 6,622 10,857 1,249 109,528 Jan-18 3,309 5,181 606 48,530 Feb-18 2,559 5,157 582 49,770 Mar-18 5,331 10,082 1,226 105,203 Apr-18 4,642 9,580 925 109,208 May-18 5,593 10,171 1,086 95,111 Jun-18 5,809 11,679 1,260 128,081 Jul-18 5,289 12,890 1,174 144,514 Aug-18 5,750 11,262 935 131,632 Sep-18 6,155 11,565 799 141,919 Oct-18 5,823 9,189 664 102,419 Nov-18 7,622 11,952 1,042 159,851 Dec-18 7,897 12,981 959 151,496 Jan-19 3,688 6,427 538 67,619 Feb-19 3,587 6,515 476 91,573 Mar-19 6,086 12,569 971 138,145 Apr-19 6,277 11,290 724 155,486 May-19 6,291 12,570 814 188,043 Jun-19 6,642 14,170 873 201,496 Jul-19 6,912 16,199 1,331 183,713 Aug-19 6,404 13,710 916 196,102 Sep-19 6,435 13,720 863 222,283 Oct-19 6,207 11,039 589 166,215 Nov-19 7,366 141,95 829 260,006 Dec-19 6,735 16,142 885 272,946 Note.BSTS, bayesian structural time series; CI, confidence interval. Table S6. Projection into the next 72 months with the best BSTS model
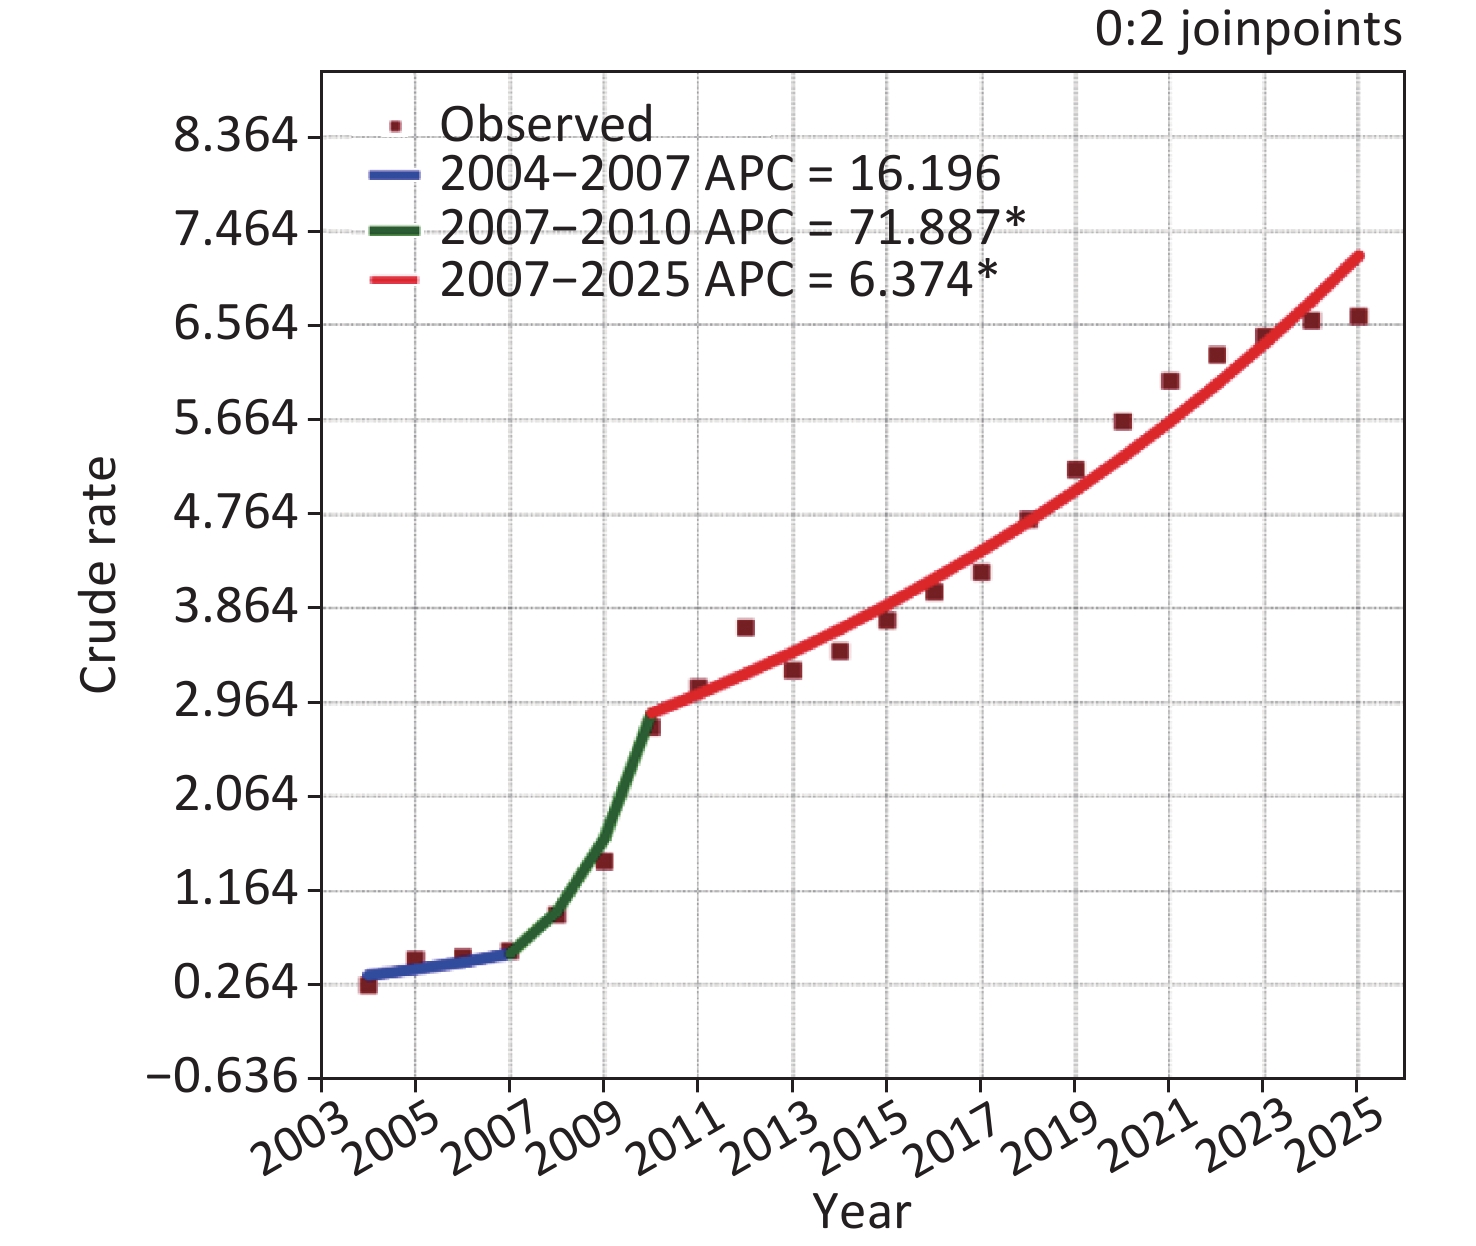
At present, the WHO has proposed an ambitious target for AIDS prevention, with a 75% reduction in new infections, including key populations, from 2010 to 2020, and the end of the AIDS epidemic as a public health threat by 2030[8]. Accordingly, we re-erected the BSTS model based on 17 complete years of data (including the modified 2020 data) to forecast the AIDS epidemic from January 2021 to December 2025. The results showed that the estimated incident rates will continue to surge (APC = 6.374, 95% CI 5.541 to 7.213; t = 16.855, P < 0.001) reaching a comparatively high level of 94,870 cases (95% CI 1,620 to 5,611,911) in 2025, which will be 2.593-fold higher than the 36,594 cases recorded in 2010 (Supplementary Table S7, Figures S6 and S7, available in www.besjournal.com). Currently, an estimated 70% of individuals infected with HIV globally occur in low- and middle-income settings, mainly in eastern and southern Africa, western and central Africa, and the Asian–Pacific region[9], and achieving set objectives will also depend on whether efforts in these settings accelerate or stall. Moreover, China's new AIDS cases accounted for 23% of the total number of new infections in the Asian–Pacific region in 2019[9]. These findings indicate that AIDS will still plague China and achieving the goal of ending the AIDS epidemic by 2030 poses a great challenge[8]. Therefore, to tackle such a major public health problem, intervention strategies need to be strengthened and new effective prophylaxis methods for AIDS need to be proactively explored. In addition, it is estimated that more than 60% of AIDS cases are infected through heterosexual sex, and student infections are increasing in China[10], thus there is an imminent need to implement HIV screening and popularize earlier sex education (from age 9) according to UNESCO guidance.
Time Forecasts Lower 95% CI Upper 95% CI Jan-21 3,997 2,570 6,051 Feb-21 4,029 2,744 6,276 Mar-21 7,365 4,578 11,810 Apr-21 6,796 4,239 10,739 May-21 7,340 4,303 12,784 Jun-21 8,096 4,501 13,923 Jul-21 7,905 4,592 14,086 Aug-21 7,717 4,192 15,547 Sep-21 7,780 4,325 15,556 Oct-21 6,792 3,493 13,938 Nov-21 8,348 4,260 16,684 Dec-21 8,923 4,320 19,075 Jan-22 4,205 1,838 10,566 Feb-22 4,331 1,630 10,914 Mar-22 7,804 3,282 18,627 Apr-22 6,971 2,796 19,686 May-22 7,854 2,662 24,626 Jun-22 8,462 2,885 26,701 Jul-22 8,349 2,543 29,112 Aug-22 8,113 2,312 29,307 Sep-22 7,987 2,466 28,822 Oct-22 6,987 1,814 27,818 Nov-22 8,734 2,159 36,316 Dec-22 9,077 2,204 41,700 Jan-23 4,383 932 21,373 Feb-23 4,359 824 26,530 Mar-23 8,055 1,700 42,445 Apr-23 7,354 1,399 46,078 May-23 8,076 1,407 54,858 Jun-23 8,753 1,531 69,291 Jul-23 8,451 1,195 68,181 Aug-23 8,417 1,238 92,746 Sep-23 8,258 1,042 68,585 Oct-23 7,251 838 67,220 Nov-23 8,917 975 98,745 Dec-23 9,380 983 99,853 Jan-24 4,436 391 47,999 Feb-24 4,545 364 58,966 Mar-24 8,161 616 123,931 Apr-24 7,552 472 129,781 May-24 8,209 480 142,703 Jun-24 9,008 583 187,843 Jul-24 8,725 426 189,636 Aug-24 8,648 426 224,957 Sep-24 8,502 384 171,097 Oct-24 7,510 307 163,992 Nov-24 9,163 297 267,638 Dec-24 9,575 327 312,094 Jan-25 4,594 141 158,220 Feb-25 4,651 114 182,361 Mar-25 8,332 230 324,672 Apr-25 7,598 157 307,727 May-25 8,367 147 400,556 Jun-25 9,073 190 522,450 Jul-25 8,714 134 535,229 Aug-25 8,604 122 576,059 Sep-25 8,463 104 548,544 Oct-25 7,485 100 525,668 Nov-25 9,453 97 726,947 Dec-25 95,36 84 803,479 Note.BSTS, bayesian structural time series; CI, confidence interval. Table S7. Projection into time windows between January 2021 and December 2025 with the best BSTS model
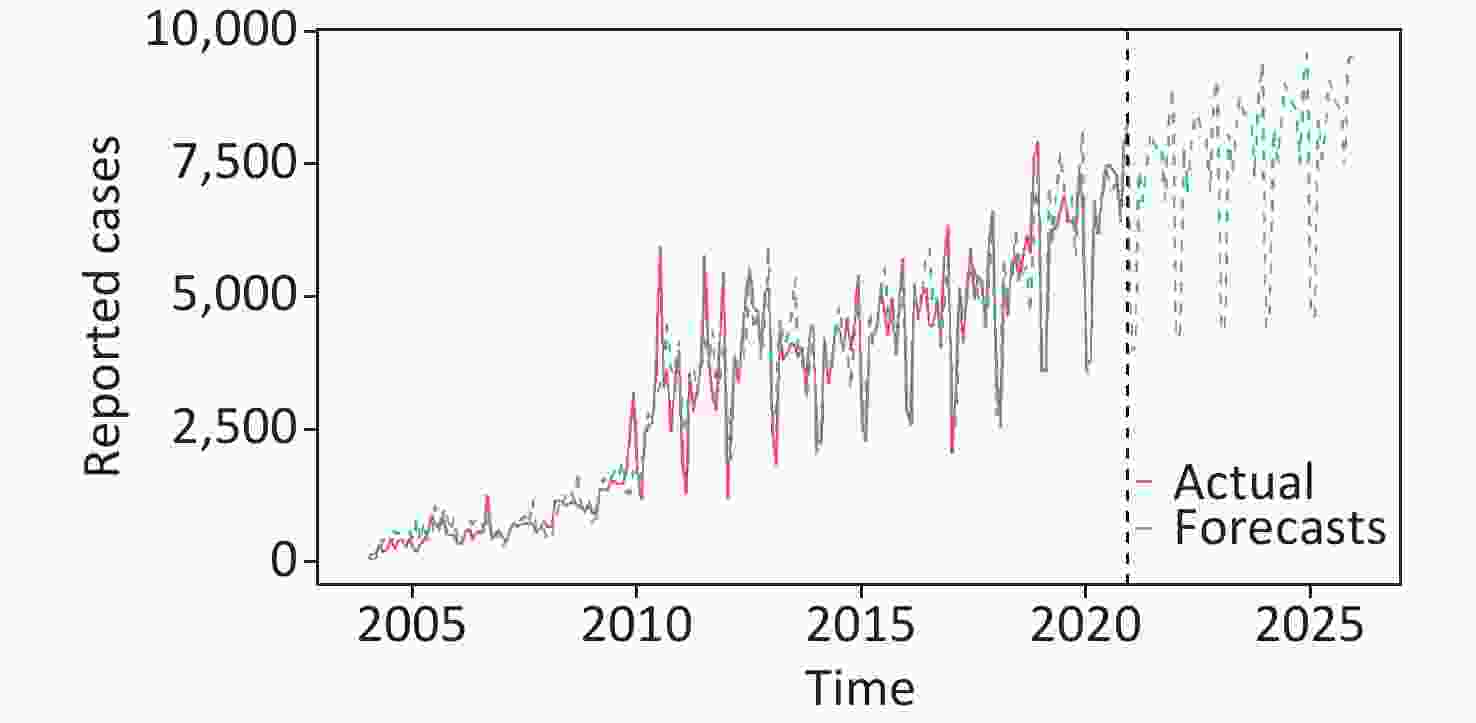
Figure S6. Time series plot showing the forecasting results until 2025. This plot displays the actual series in red, and the fitting and forecasting results as a blue line. It seemed that the BSTS method predicted a rising trend from January 2021 to December 2025.
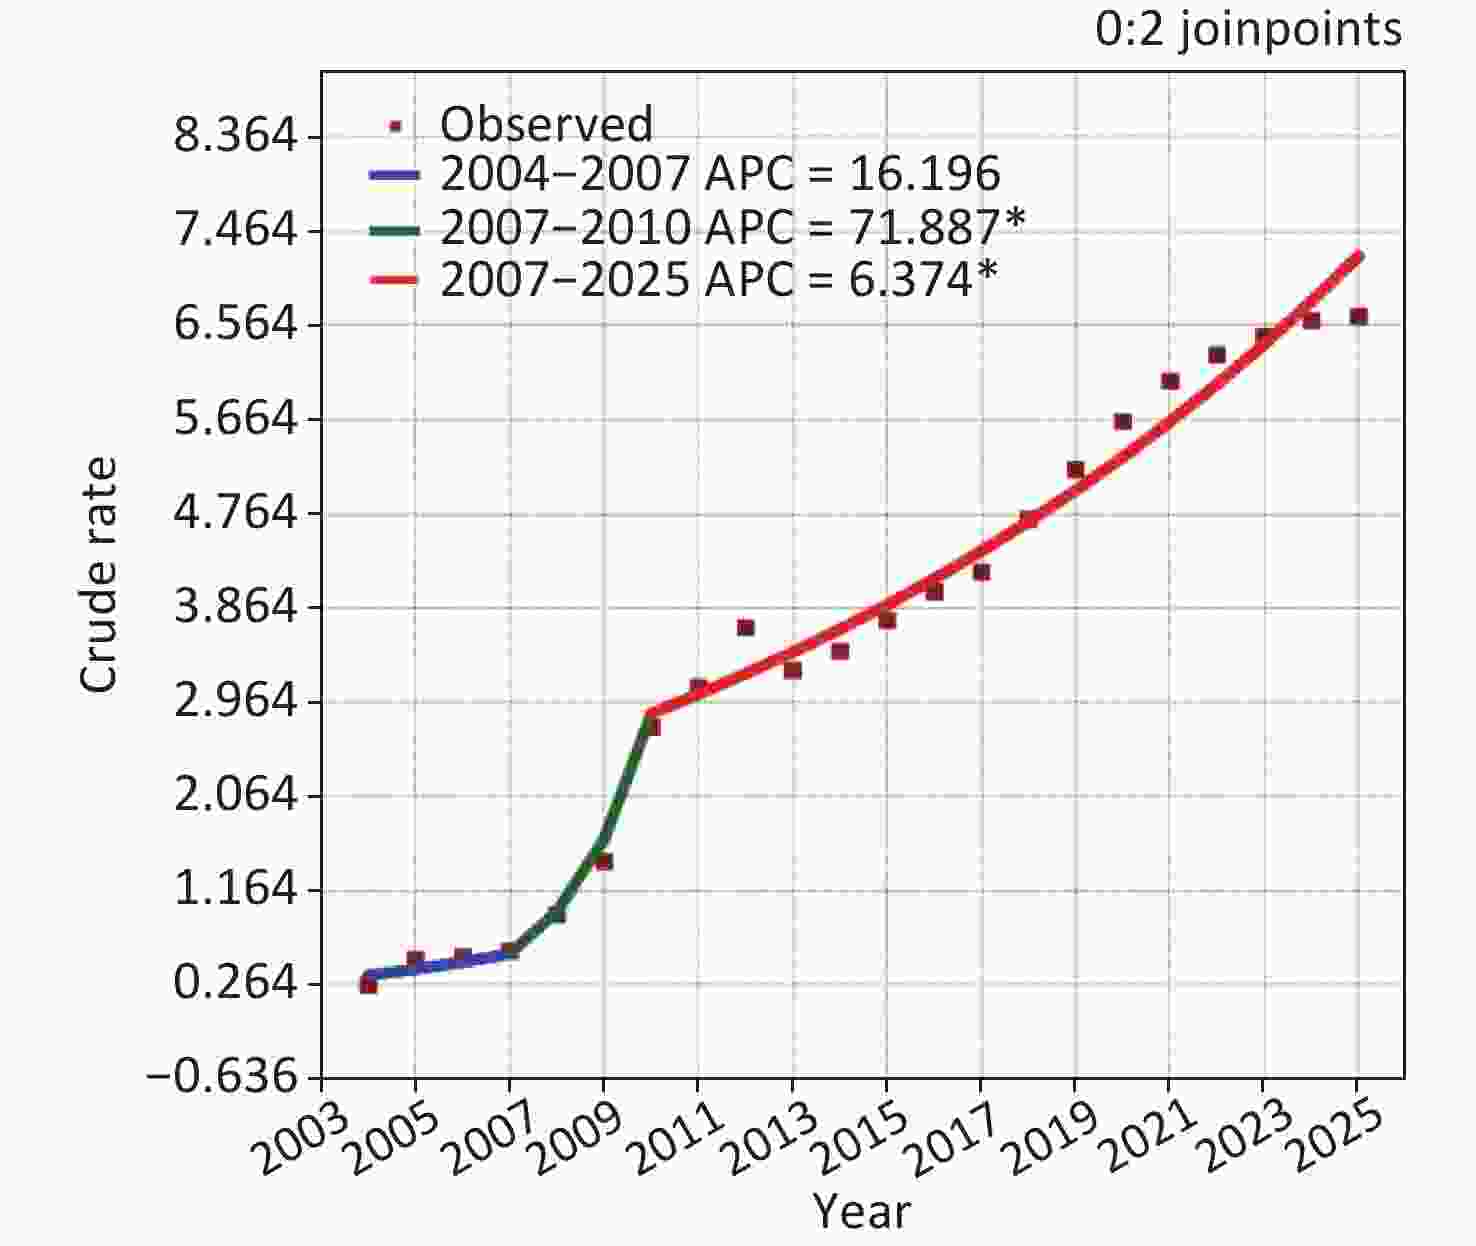
Figure S7. Joinpoint regression plot showing the AIDS epidemiological trends during 2004–2025. *Showed that the annual percent change (APC) is statistically significant.
This study had several limitations. First, the data spanned the period of policy intervention (2010). Though the results stemmed from the preferred model are as good as the expected, the real effects before and after the sudden escalation of AIDS morbidity on the model accuracy remain unknown. Second, an estimated 32.4% of people who have been infected with AIDS are unaware of their infection status in China[1]. Hence, the actual situation may be more serious than that estimated. Third, many complicated influencing factors, some of which may be unpredictable, can be contributors to the transmission of AIDS incidence. Fourth, it is necessary to make timely updates to models as short-term data becomes available to increase the predictive ability of the model. Lastly, the analytical epidemic data merely represent the country-level situation and overall trends in AIDS incidence, our method may be of great benefit to other regions or infectious diseases as well.
In summary, the current findings indicate that COVID-19 may have significant consequences for the AIDS epidemic, as determined by the BSTS model. This model can act as a useful technique to estimate the temporal behaviors of AIDS, and thus assist policymakers in rationally allocating health resources and appropriately formulating prevention and control strategies for this disease. Since new AIDS infections will continue to increase, there is an urgency to adopt appropriate and effective prevention and control policies in China.
Time Observed values Forecasts Lower 95% CI Upper 95% CI Jan-18 3,309 2,706 1,733 4,268 Feb-18 2,559 3,282 2,034 5,223 Mar-18 5,331 5,764 3,453 9,530 Apr-18 4,642 5,084 3,012 8,324 May-18 5,593 5,713 3,337 10,153 Jun-18 5,809 6,589 3,817 13156 Jul-18 5,289 5,947 3,413 10,132 Aug-18 5,750 6,046 2,982 11,945 Sep-18 6,155 6,299 3,339 13,452 Oct-18 5,823 5,156 2,819 10,586 Nov-18 7,622 6,724 3,594 13,686 Dec-18 7,897 7,782 3,960 15,353 Jan-19 3,688 3,270 1,460 8,265 Feb-19 3,587 3,948 1,691 9,199 Mar-19 6,086 6,775 3,091 16,810 Apr-19 6,277 5,947 2,570 15,191 May-19 6,291 7,084 3,006 17,463 Jun-19 6,642 7,916 3,595 22,345 Jul-19 6,912 7,161 2,983 20,196 Aug-19 6,404 7,167 2,806 21,118 Sep-19 6,435 7,223 2,768 22,372 Oct-19 6,207 5,907 2,186 19,169 Nov-19 7,366 8,081 3,164 23,776 Dec-19 6,735 8,696 3,095 29,832 Note. BSTS, bayesian structural time series; CI, confidence interval. Table S2. Projection into the next 24 months with the best BSTS model
Time Observed values Forecasts Lower 95% CI Upper 95% CI Jan-17 2,053 2,944 1,868 4,654 Feb-17 3,325 2,815 1,749 4,723 Mar-17 5,179 5,577 3,370 9,258 Apr-17 4,140 4,976 2,788 8,672 May-17 5,025 5,517 2,834 10,287 Jun-17 5,916 6,377 3,482 12,599 Jul-17 4,950 6,269 3,141 12,730 Aug-17 5,400 5,717 2,748 11,901 Sep-17 5,283 6,059 3,008 12,664 Oct-17 4,485 5,100 2,345 10,740 Nov-17 6,136 6,371 3,006 14,836 Dec-17 6,622 7,131 2,986 16,146 Jan-18 3,309 3,441 1,504 7,664 Feb-18 2,559 3,267 1,299 8,142 Mar-18 5,331 6,569 2,303 14,159 Apr-18 4,642 6,023 2,296 15,409 May-18 5,593 6,394 2,034 15,797 Jun-18 5,809 7,606 2,418 19,859 Jul-18 5,289 7,200 2,279 21,236 Aug-18 5,750 6,673 2,307 22,733 Sep-18 6,155 7,243 2,021 21,877 Oct-18 5,823 5,769 1,755 18,021 Nov-18 7,622 7,548 2,445 24,995 Dec-18 7,897 8,122 2,112 25,658 Jan-19 3,688 4,014 1,178 13,043 Feb-19 3,587 3,796 842 14,831 Mar-19 6,086 7,528 1,739 28,360 Apr-19 6,277 6,792 1,596 24,977 May-19 6,291 7,499 1,692 26,202 Jun-19 6,642 8,662 1,901 37,588 Jul-19 6,912 8,251 1,831 37,973 Aug-19 6,404 7,661 1,746 33,448 Sep-19 6,435 8,179 1,764 34,716 Oct-19 6,207 6,671 1,312 27,925 Nov-19 7,366 8,418 1,565 35,771 Dec-19 6,735 9,528 1,606 40,078 Note. BSTS, bayesian structural time series; CI, confidence interval. Table S3. Projection into the next 36 months with the best BSTS model
Time Observed values Forecasts Lower 95% CI Upper 95% CI Jan-16 2,862 2,766 1,781 4,174 Feb-16 2,582 2,751 1,717 4,439 Mar-16 5,255 5,259 3,168 8,292 Apr-16 4,574 4,938 2,831 8,590 May-16 5,041 5,151 2,922 8,973 Jun-16 5159 6106 3454 11682 Jul-16 4,459 6,173 3,197 11,654 Aug-16 4,469 5,745 2,797 11,691 Sep-16 4,877 6,061 3,029 13,069 Oct-16 4,244 4,885 2,295 9,766 Nov-16 5,743 6,146 3,018 12,823 Dec-16 6,335 6,898 3,033 14,758 Jan-17 2,053 3,339 1,592 7,973 Feb-17 3,325 3,362 1,433 8,756 Mar-17 5,179 6,321 2,557 15,687 Apr-17 4,140 5,876 2,221 13,813 May-17 5,025 6,263 2,290 15,660 Jun-17 5,916 7,497 2,779 18,637 Jul-17 4,950 7,643 2,277 22,919 Aug-17 5,400 6,807 2,341 22,403 Sep-17 5,283 7,443 2,333 22,594 Oct-17 4,485 5,853 1,745 16,034 Nov-17 6,136 7,388 2,245 23,326 Dec-17 6,622 8,332 2,706 29,883 Jan-18 3,309 4,021 1,123 13,424 Feb-18 2,559 3,994 1,037 14,080 Mar-18 5,331 7,724 2,011 27,797 Apr-18 4,642 7,050 1,963 31,483 May-18 5,593 7,573 1,900 27,575 Jun-18 5,809 9,408 2,449 37,644 Jul-18 5,289 9,804 2,312 40,557 Aug-18 5,750 8,510 2,014 41,629 Sep-18 6,155 9,478 2,198 36,469 Oct-18 5,823 7,441 1,447 32,547 Nov-18 7,622 9,239 1,979 37,493 Dec-18 7,897 10,527 1,783 44,662 Jan-19 3,688 5,195 1,086 24,229 Feb-19 3,587 5,156 1,042 25,715 Mar-19 6,086 9,818 1,860 50,315 Apr-19 6,277 9,066 1,679 46,861 May-19 6,291 9,884 1,700 50,171 Jun-19 6,642 11,797 2,223 65,983 Jul-19 6,912 12,051 2,034 61,158 Aug-19 6,404 10,416 1,676 81,220 Sep-19 6,435 11,049 1,731 58,159 Oct-19 6,207 8,958 1,486 51,077 Nov-19 7,366 11,484 1,667 74,941 Dec-19 6,735 12,685 1,831 88,125 Note. BSTS, bayesian structural time series; CI, confidence interval. Table S4. Projection into the next 48 months with the best BSTS model
Time Observed values Forecasts Lower 95% CI Upper 95% CI Jan-15 2,597 2,474 1,534 4,413 Feb-15 2,294 2,574 1,436 4,199 Mar-15 4,238 4,854 2,911 8,455 Apr-15 4,299 4,196 2,592 7,072 May-15 4,401 4,612 2,580 8,747 Jun-15 5,089 5,411 3,130 10,218 Jul-15 4,701 5,836 2,930 11,613 Aug-15 4,268 4,749 2,546 9,391 Sep-15 4,967 5,105 2,315 11,255 Oct-15 3,955 4,103 2,018 9,834 Nov-15 5,040 5,004 2,234 10,702 Dec-15 5,707 5,819 2,536 13,160 Jan-16 2,862 2,703 1,067 6,714 Feb-16 2,582 2,776 893 7,598 Mar-16 5,255 5,274 1,924 13,781 Apr-16 4,574 4,288 1,575 10,917 May-16 5,041 4,984 1,554 12,621 Jun-16 5,159 5,793 1,757 16,881 Jul-16 4,459 6,415 1,910 21,076 Aug-16 4,469 5,358 1,465 16,956 Sep-16 4,877 5,619 1,634 17,392 Oct-16 4,244 4,662 1,452 17,245 Nov-16 5,743 5,677 1,804 19,784 Dec-16 6,335 6,425 1,591 20,543 Jan-17 2,053 3,010 732 11,769 Feb-17 3,325 3,051 720 13,038 Mar-17 5,179 5,875 1,364 22,057 Apr-17 4,140 5,123 1,168 26,849 May-17 5,025 5,609 1,159 24,855 Jun-17 5,916 6,616 1,177 32,987 Jul-17 4,950 6,833 1,181 39,226 Aug-17 5,400 6,172 1,115 40,976 Sep-17 5,283 6,263 1,049 41,277 Oct-17 4,485 5,240 931 31,314 Nov-17 6,136 6,396 940 48,099 Dec-17 6,622 7,250 1,060 50,689 Jan-18 3,309 3,367 357 24,691 Feb-18 2,559 3608 418 30,930 Mar-18 5,331 6,746 643 53,437 Apr-18 4,642 5,930 465 50,670 May-18 5,593 6,379 648 53,217 Jun-18 5,809 7,881 737 57,138 Jul-18 5,289 8,078 677 78,031 Aug-18 5,750 7,179 487 111,173 Sep-18 6,155 7,219 540 80,104 Oct-18 5,823 6,078 584 60,510 Nov-18 7,622 7,437 503 82,208 Dec-18 7,897 8,265 533 71,013 Jan-19 3,688 3,820 211 52,724 Feb-19 3,587 4,016 236 68,210 Mar-19 6,086 7,672 460 83,660 Apr-19 6,277 6,665 318 101,159 May-19 6,291 7,481 322 129,623 Jun-19 6,642 8,742 415 128,950 Jul-19 6,912 8,871 453 182,465 Aug-19 6,404 7,825 323 181,758 Sep-19 6,435 8,215 304 222,292 Oct-19 6,207 6,633 216 130,049 Nov-19 7,366 8,190 337 199,002 Dec-19 6,735 9,085 230 188,134 Note.BSTS, bayesian structural time series; CI, confidence interval. Table S5. Projection into the next 60 months with the best BSTS model
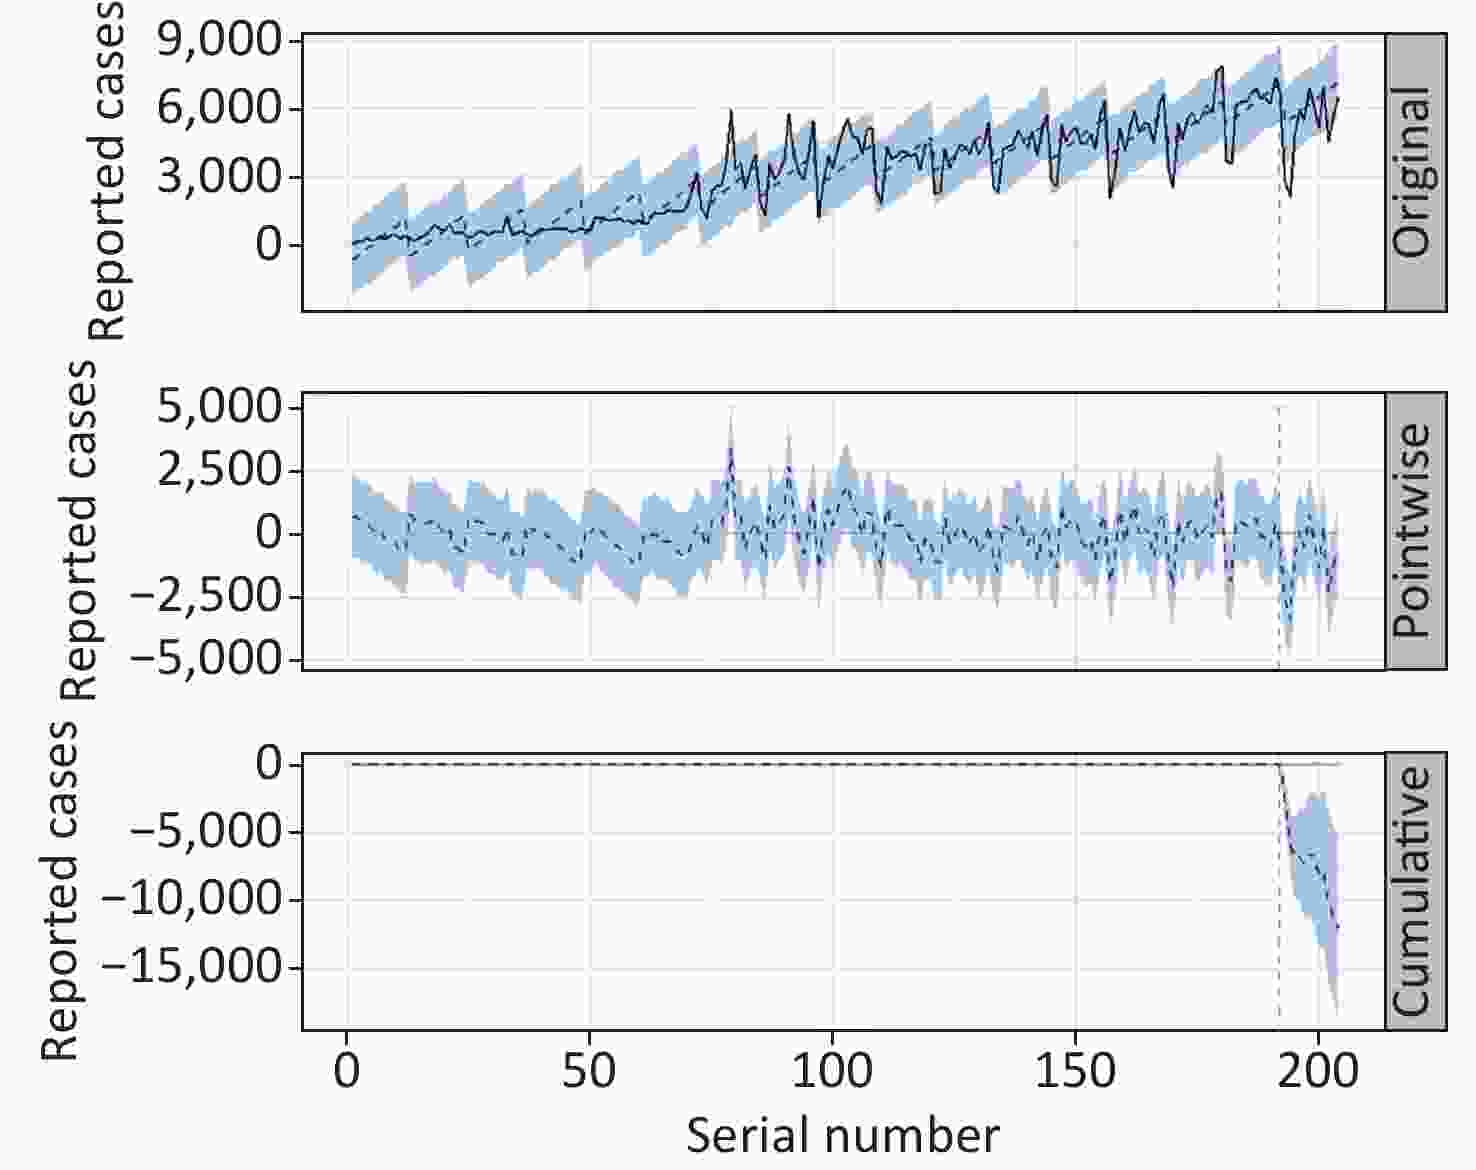
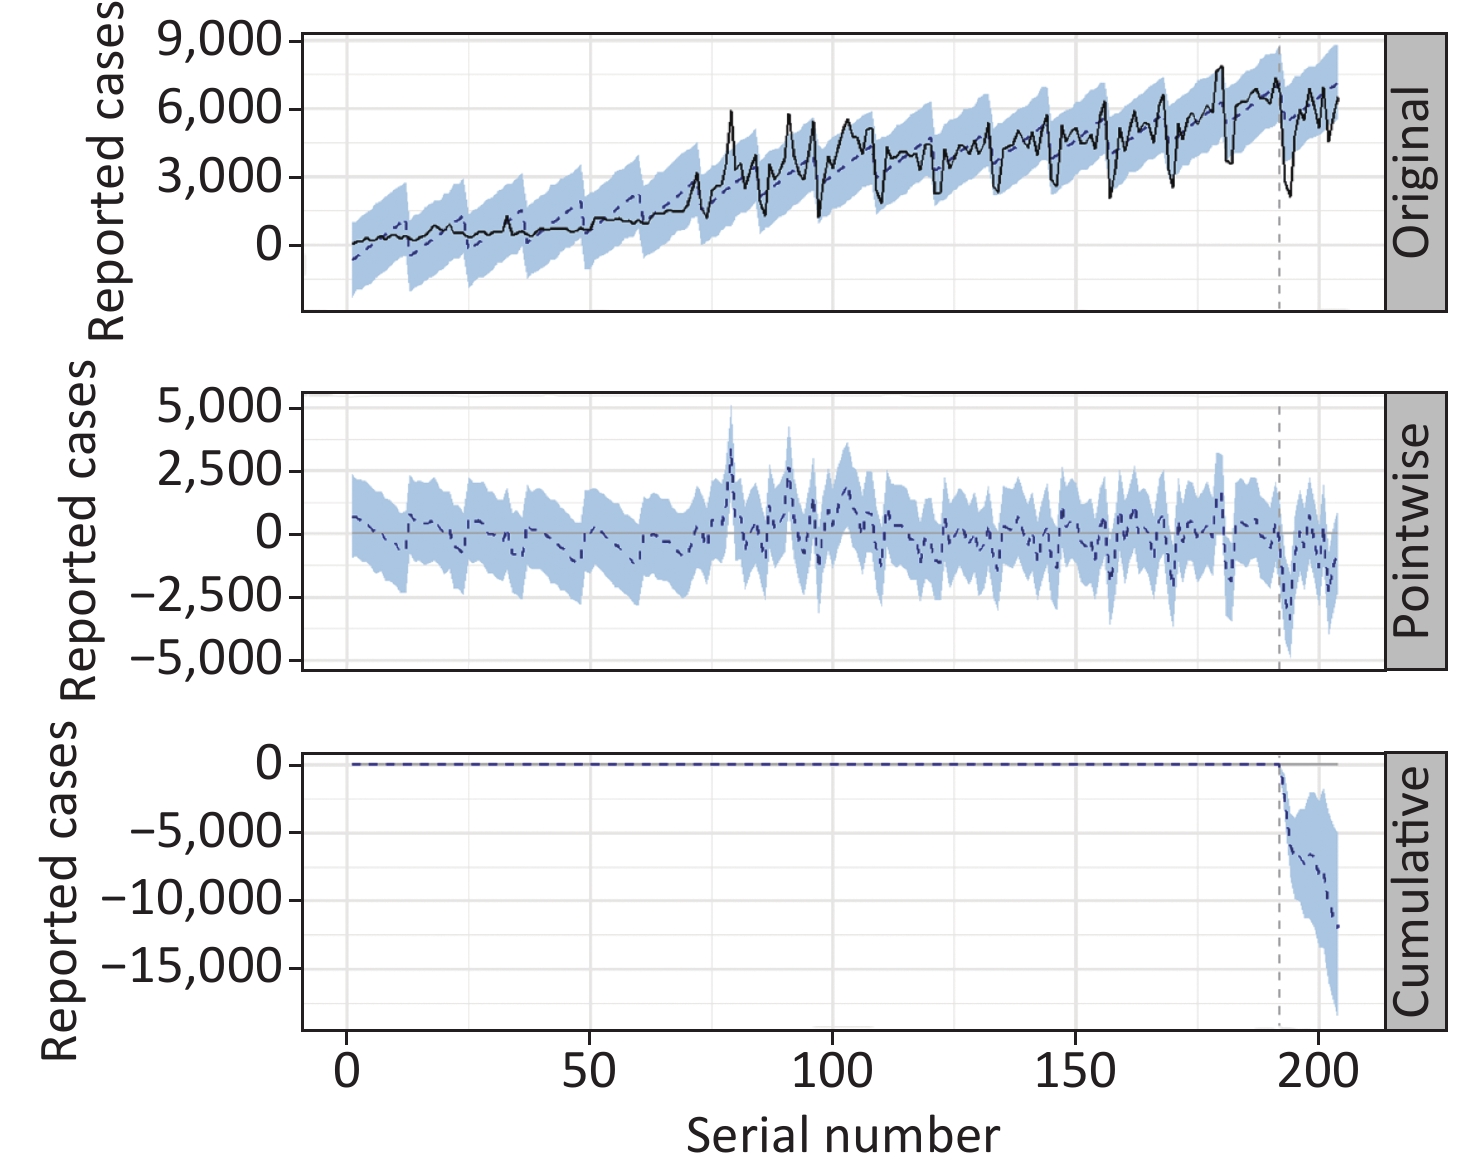
Figure S3. Time series plot displaying the causal impacts of the COVID-19 outbreak on the decreases in AIDS cases from January–December 2020. The first panel provides the reported AIDS cases and counterfactual expected figures for the post-outbreak period. The second panel describes the pointwise causal impact that indicates the difference between reported cases and expected figures. The third panel illustrates a cumulative effect of the COVID-19 pandemic on the decreases in AIDS cases via accumulating the pointwise effects from the second panel.
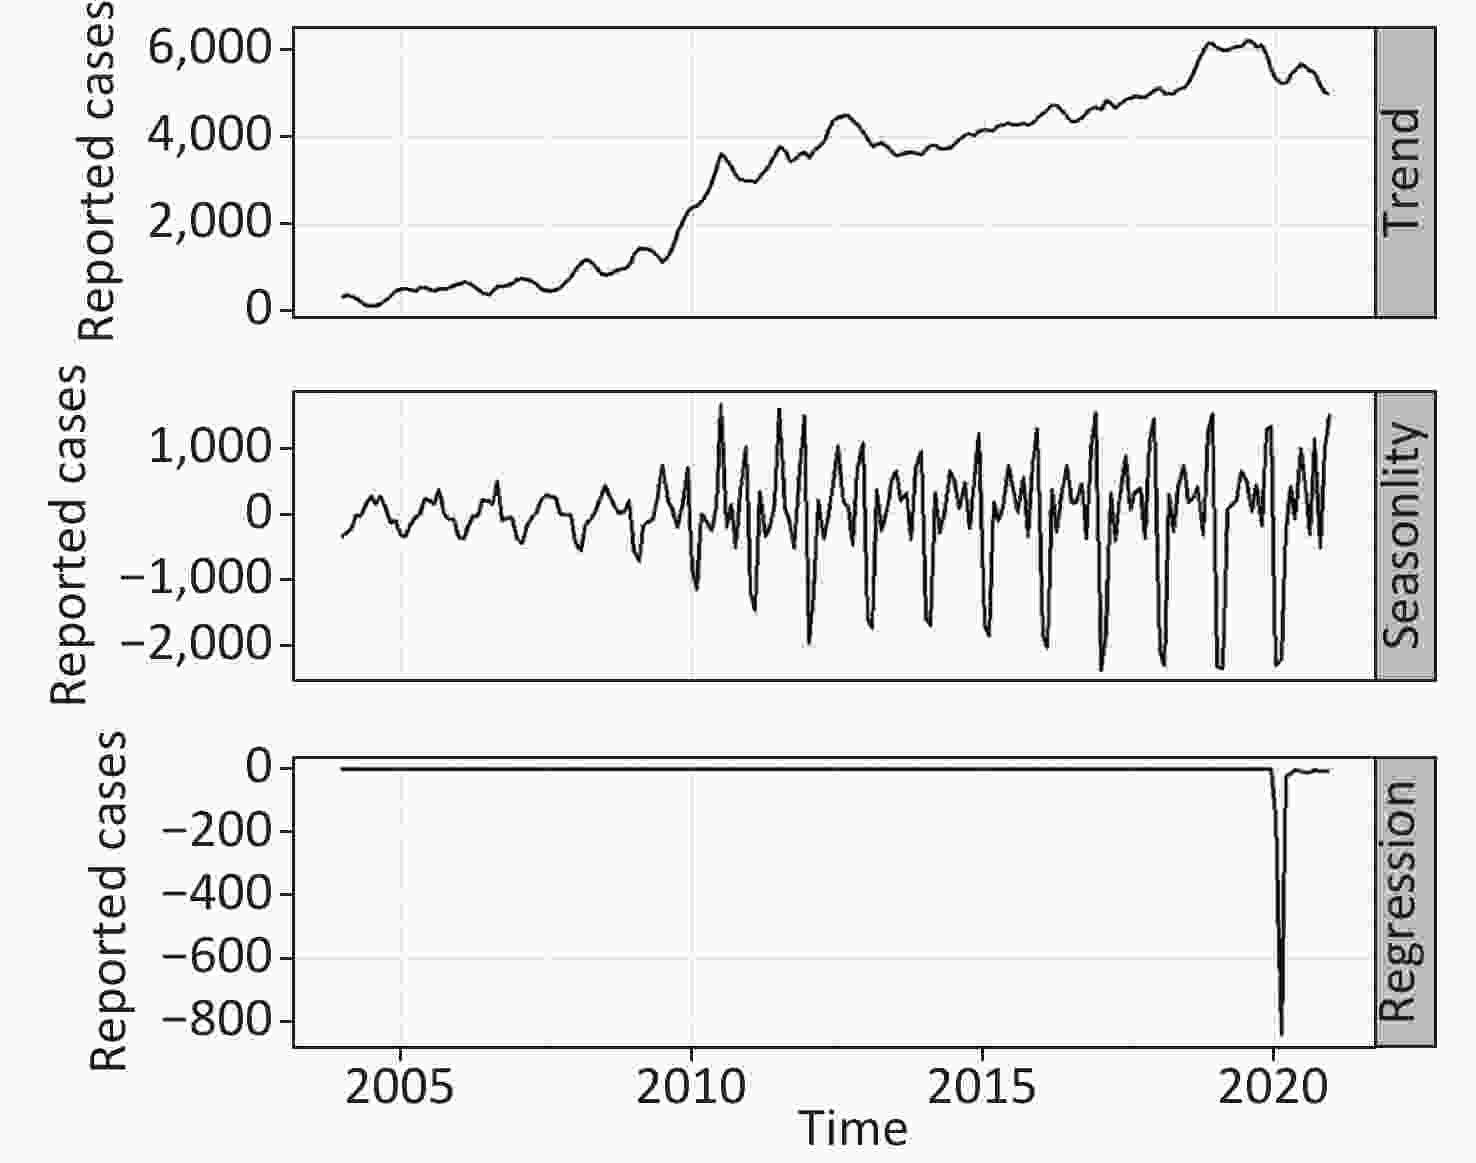
Figure S4. Contribution of trend, seasonality, and regression (COVID-19 outbreak) components to the AIDS incidence. As depicted, the AIDS incidence has a noticeable seasonal pattern and the COVID-19 outbreak causes a remarkable decrease in AIDS cases during this period.
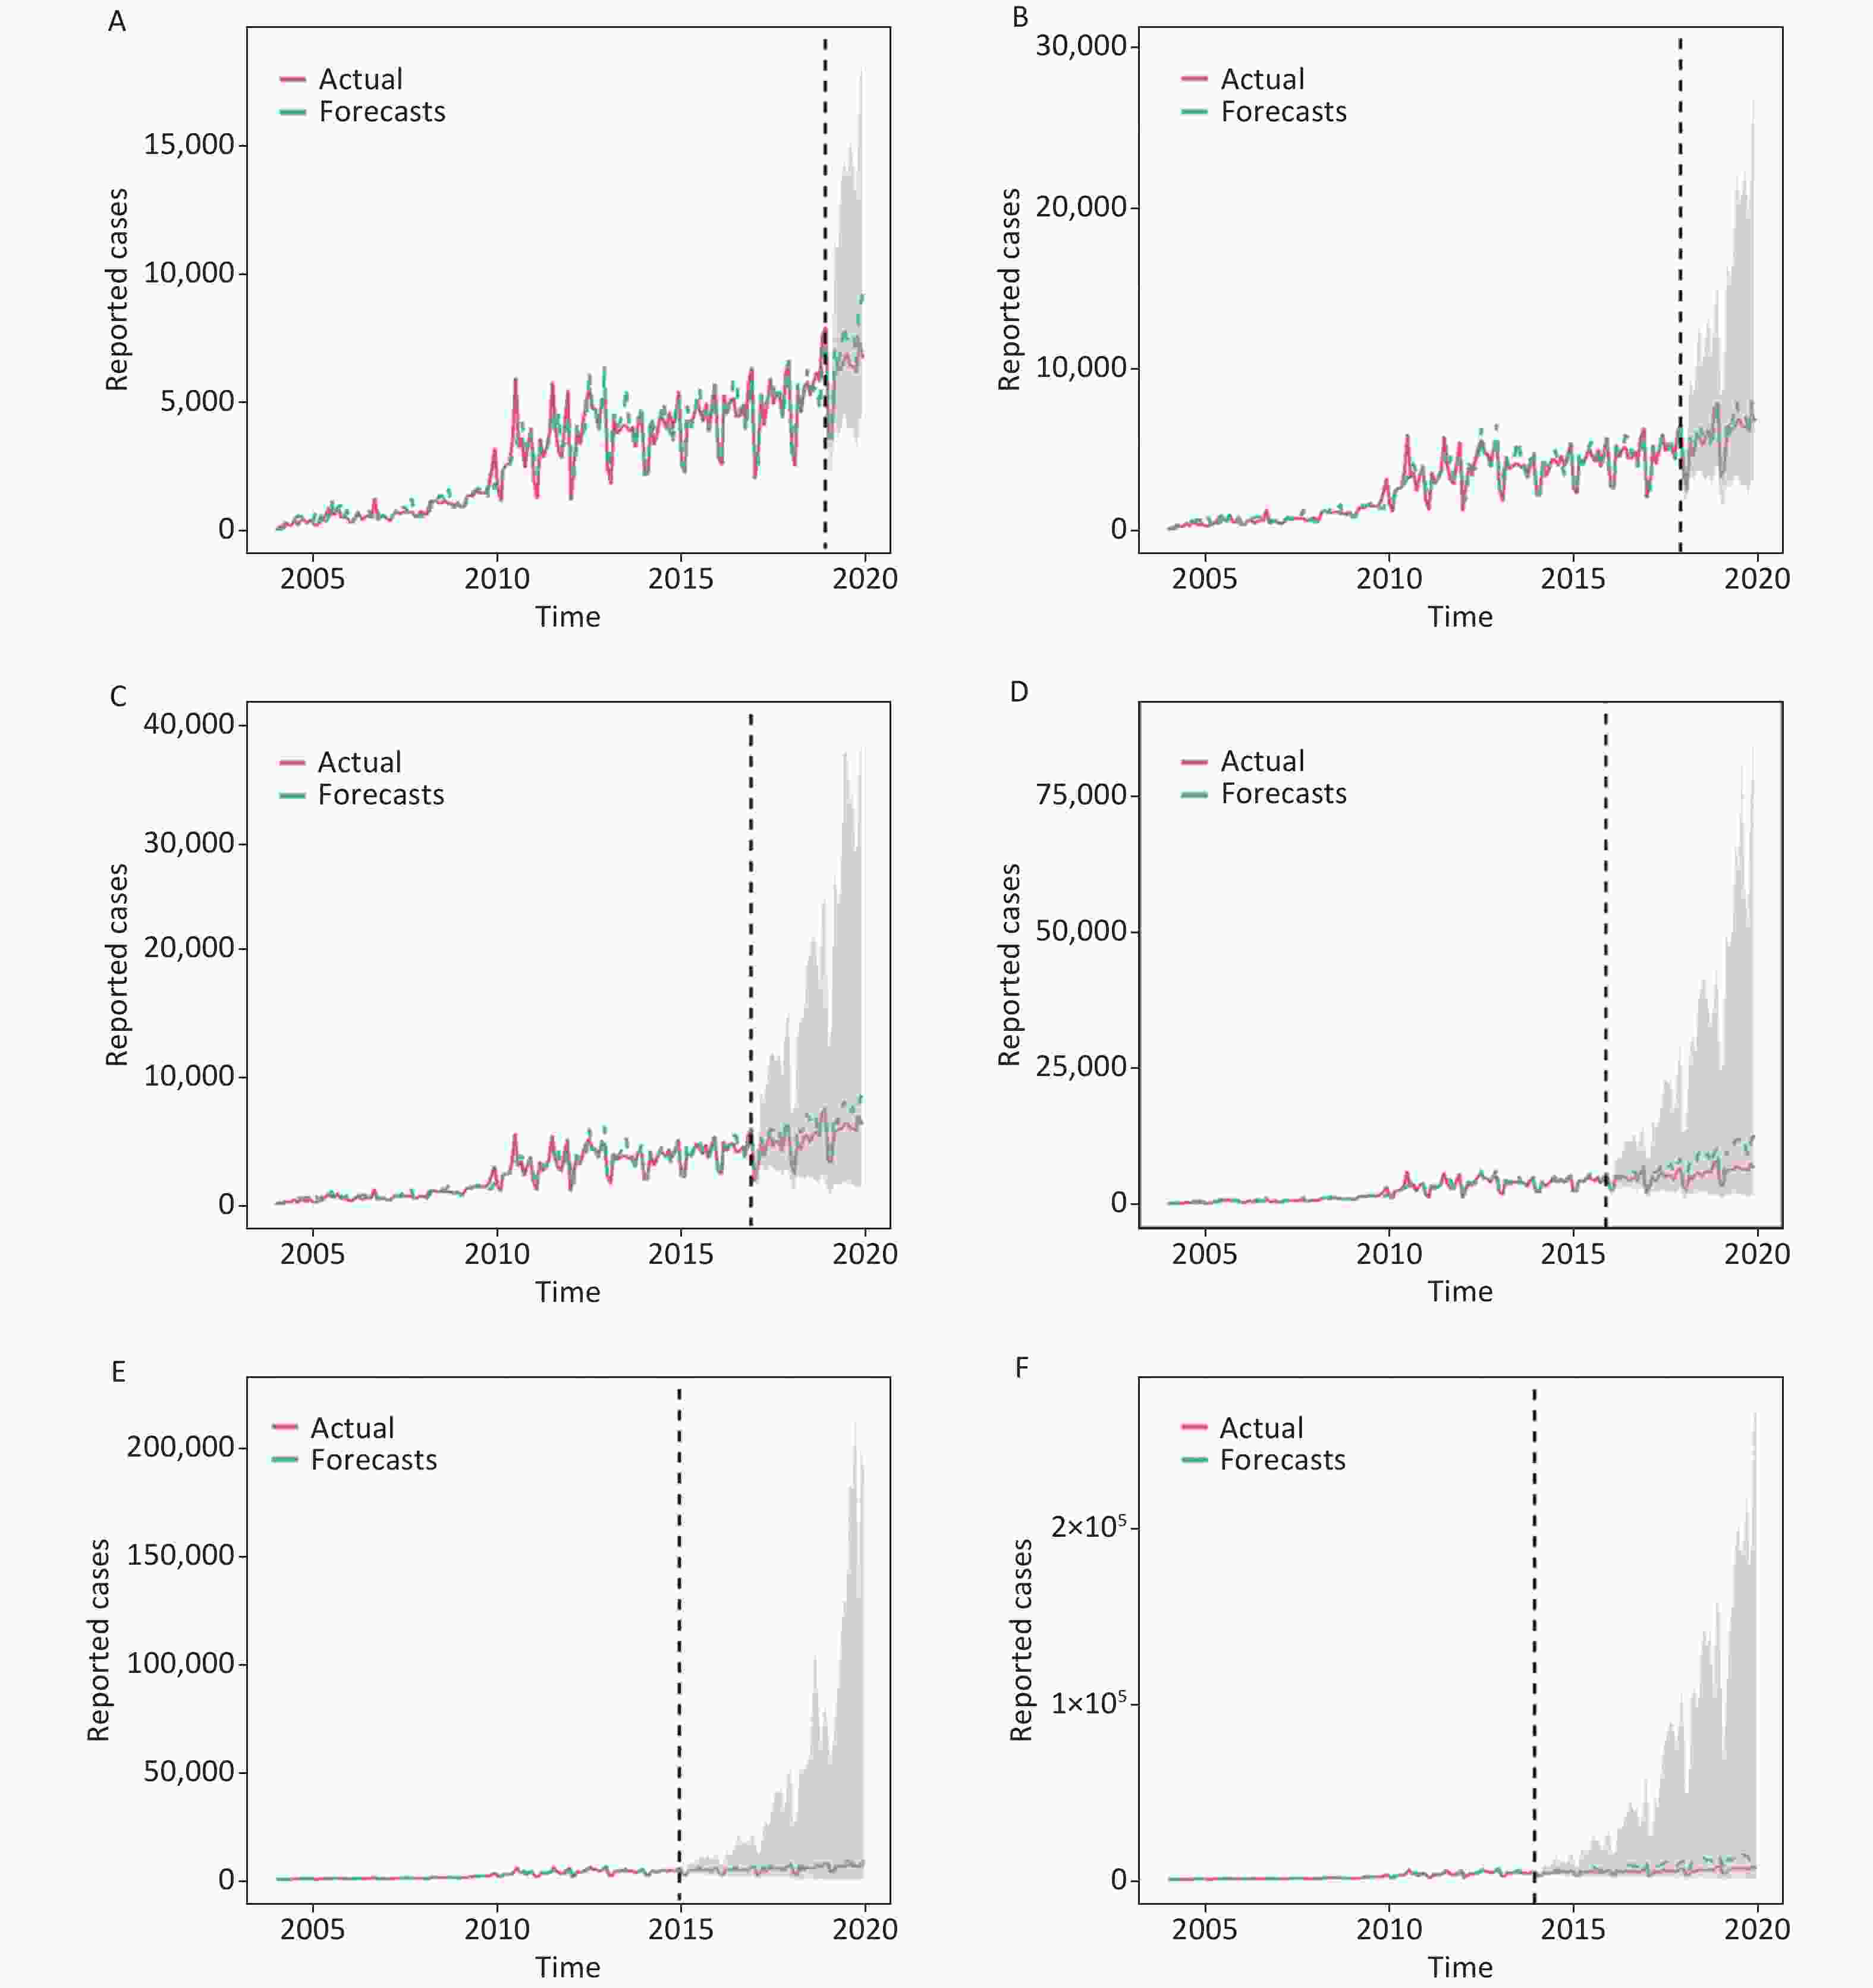
Figure S5. Time series plot showing the forecasted temporal trends of the AIDS incidence for (A) 12 holdout data, (B) 24 holdout data, (C) 36 holdout data, (D) 48 holdout data, (E) 60 holdout data, and (F) 72 holdout data under BSTS approaches. It can be seen that the BSTS approaches are able to better capture the long-term epidemiological trends of AIDS for the 60-step ahead forecast except for the 72 holdout data.
HTML
 21335Supplementary Materials.pdf
|

|

 Quick Links
 DownLoad: