


-
Hand, foot and mouth disease (HFMD) is a common infectious disorder caused by various enteroviruses[1], and children younger than 5 years are especially prone to infection[2]. Most cases are self-limiting; however, some patients rapidly develop neurological or cardiopulmonary complications, which can even lead to death[3].
In recent years, outbreaks of this disease have been reported frequently in most parts of the world, including the Asia-Pacific region[4], especially in eastern and southeast Asia[5,6]. During 2008, Singapore experienced its largest outbreak of HFMD, resulting in 29,686 cases[7]. Subsequently, 170 deaths were reported in Vietnam in 2011[8] and 98 deaths were reported in Cambodia in 2012[9]. In mainland of China, an epidemic of HFMD started in Fuyang city, Anhui Province, in 2008 resulting in 353 severe cases and 22 deaths[10]. More than 18 million HFMD-related cases were reported in mainland of China between 2008 and 2017, and the number of deaths ranked in the top three among all notifiable diseases since 2010[11]. HFMD morbidity and mortality cause a significant economic and psychological burden on patients and society.
Epidemiological surveillance and an improved understanding of the spatiotemporal characteristics of HFMD may provide useful insight into local epidemic control measures and resource allocation. Accordingly, the epidemiological characteristics, risk factors and spatiotemporal patterns of HFMD have been studied on a national scale[12-15], prompting researchers to design and optimize HFMD warning models for different situations. The classic model that has been applied is a dynamic model of transmission, namely the Susceptibles-Infectives-Recovered (SIR) model[16]. However, these traditional models require the construction of complex systems based on unrealistic assumptions and simplifications. With the increasing amount of data, data-driven prediction models of infectious diseases have been widely studied, such as the autoregressive integrated moving average (ARIMA) model[17,18]. However, these models use a purely mathematical method of differences to extract linear factors in a sequence and cannot explain the nonlinear factors that affect changes in a time series, thereby leading to low prediction accuracy. Therefore, data-driven deep learning models, such as long- and short-term temporal (LSTM) patterns with deep neural networks[19], not only have good fault tolerance and large-scale nonlinear parallel processing methods, but also have strong self-learning and adaptive capabilities.
However, such models only consider disease parameters in the time dimension, so a spatial-temporal prediction model that accurately describes the real situation was needed. In this study, we used the spatial-temporal graph convolutional network (STGCN), which can consider spatial effects to predict the future occurrence of HFMD. By stacking continuous convolution modules to process the number of patients, the hidden time series features are extracted. For the prediction of future incidence, STGCN will not only refer to the recent incidence in a city but will also take into account the incidence in neighboring cities through the graph convolution module.
Guangdong and Shandong Provinces, representing the most populous, major economic provinces in southern and northern China, have suffered greatly from the HFMD epidemic. Therefore, we designed this model to help local health administrative departments take timely and effective blocking measures to reduce the morbidity and mortality associated with HFMD in the future.
-
Considering the extensive area and diverse demographic, economic and climatic characteristics of China, the distribution of cases and the risk factors for HFMD likely vary among different regions. Therefore, we choose two representative provinces with a heavy burden of HFMD as the research area: Guangdong and Shandong, which represent southern and northern China, respectively.
Guangdong Province comprises 21 administrative districts and can be divided into four administrative regions according to its population and area size (Pearl River Delta region, eastern Guangdong, western Guangdong and northern Guangdong). Most regions have a subtropical monsoon climate, and the typical high temperature and rainy conditions are optimal for the epidemic spread of HFMD. Shandong Province comprises 140 counties (sub-districts) belonging to 17 administrative districts and can also be divided into four administrative regions (eastern Shandong, central Shandong, southern Shandong and northwest Shandong). With a warm temperate monsoon climate, Shandong is a distinct city with four seasons, which means that the occurrence of HFMD presents significant seasonality.
-
Data were acquired for all reported HFMD cases from January 1, 2011 to December 32, 2019 in Guangdong and Shandong from the National Notifiable Disease Surveillance System (NNDSS) of the Chinese Center for Disease Control and Prevention.
Spatial information for each city, mainly including longitude and latitude data, was downloaded from the National Catalogue Service for Geographic Information of the Ministry of Natural Resources of the People’s Republic of China to construct the graph structure. The 2011–2018 data served as the training and verification set, while data from 2019 served as the prediction set.
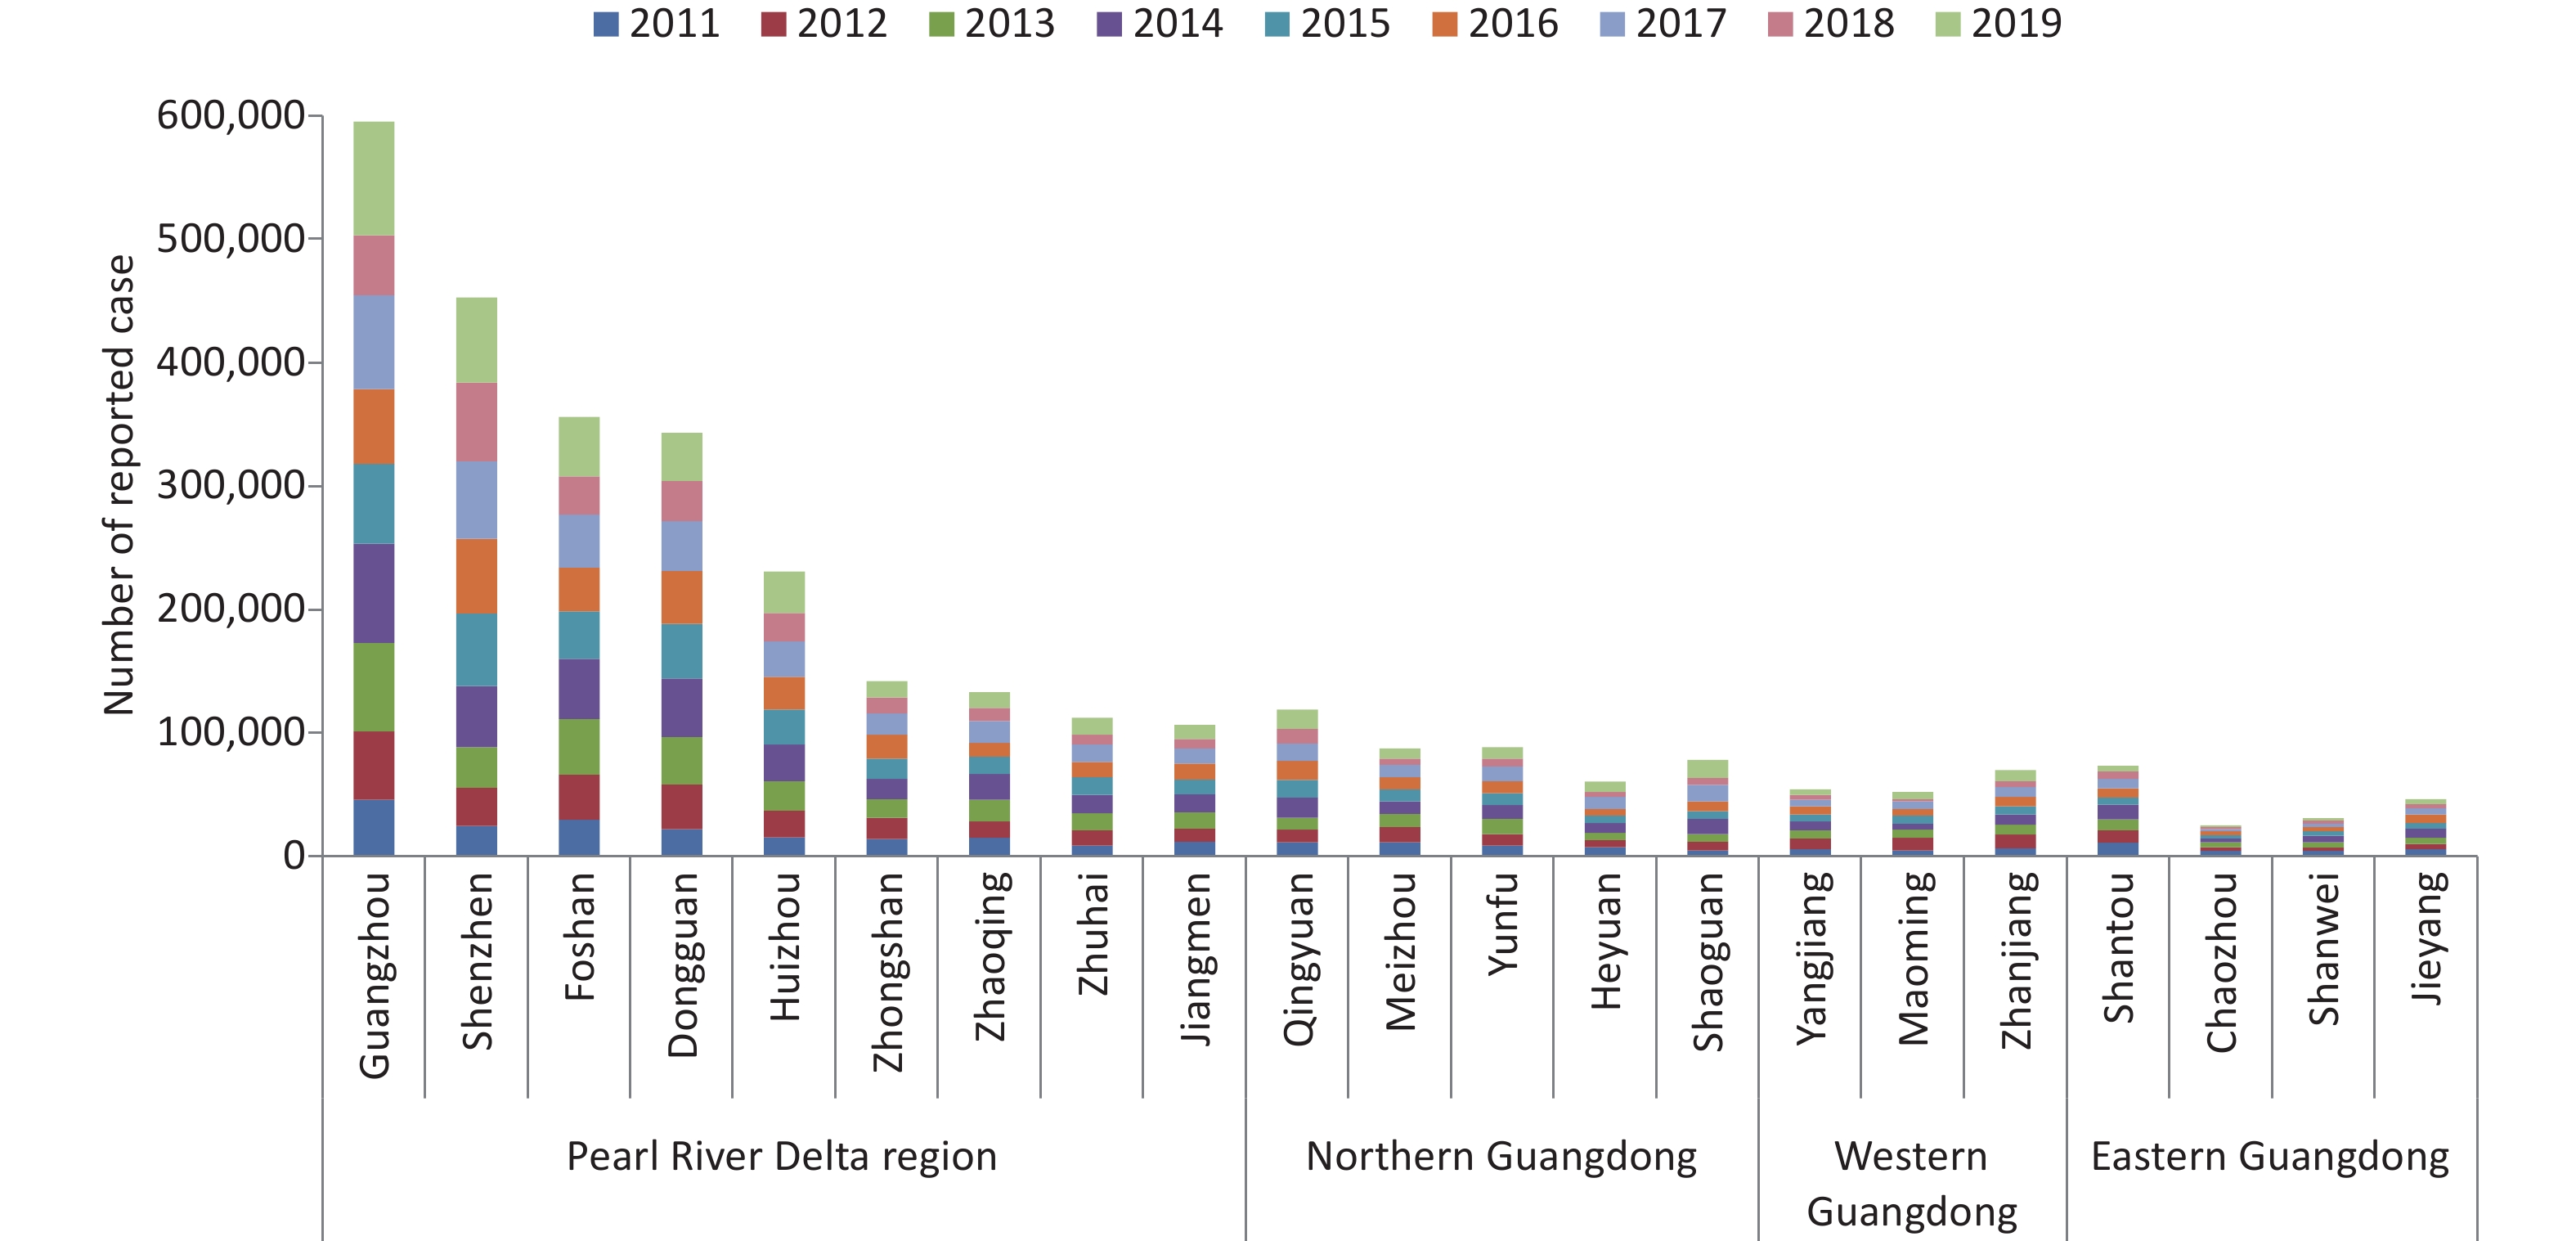
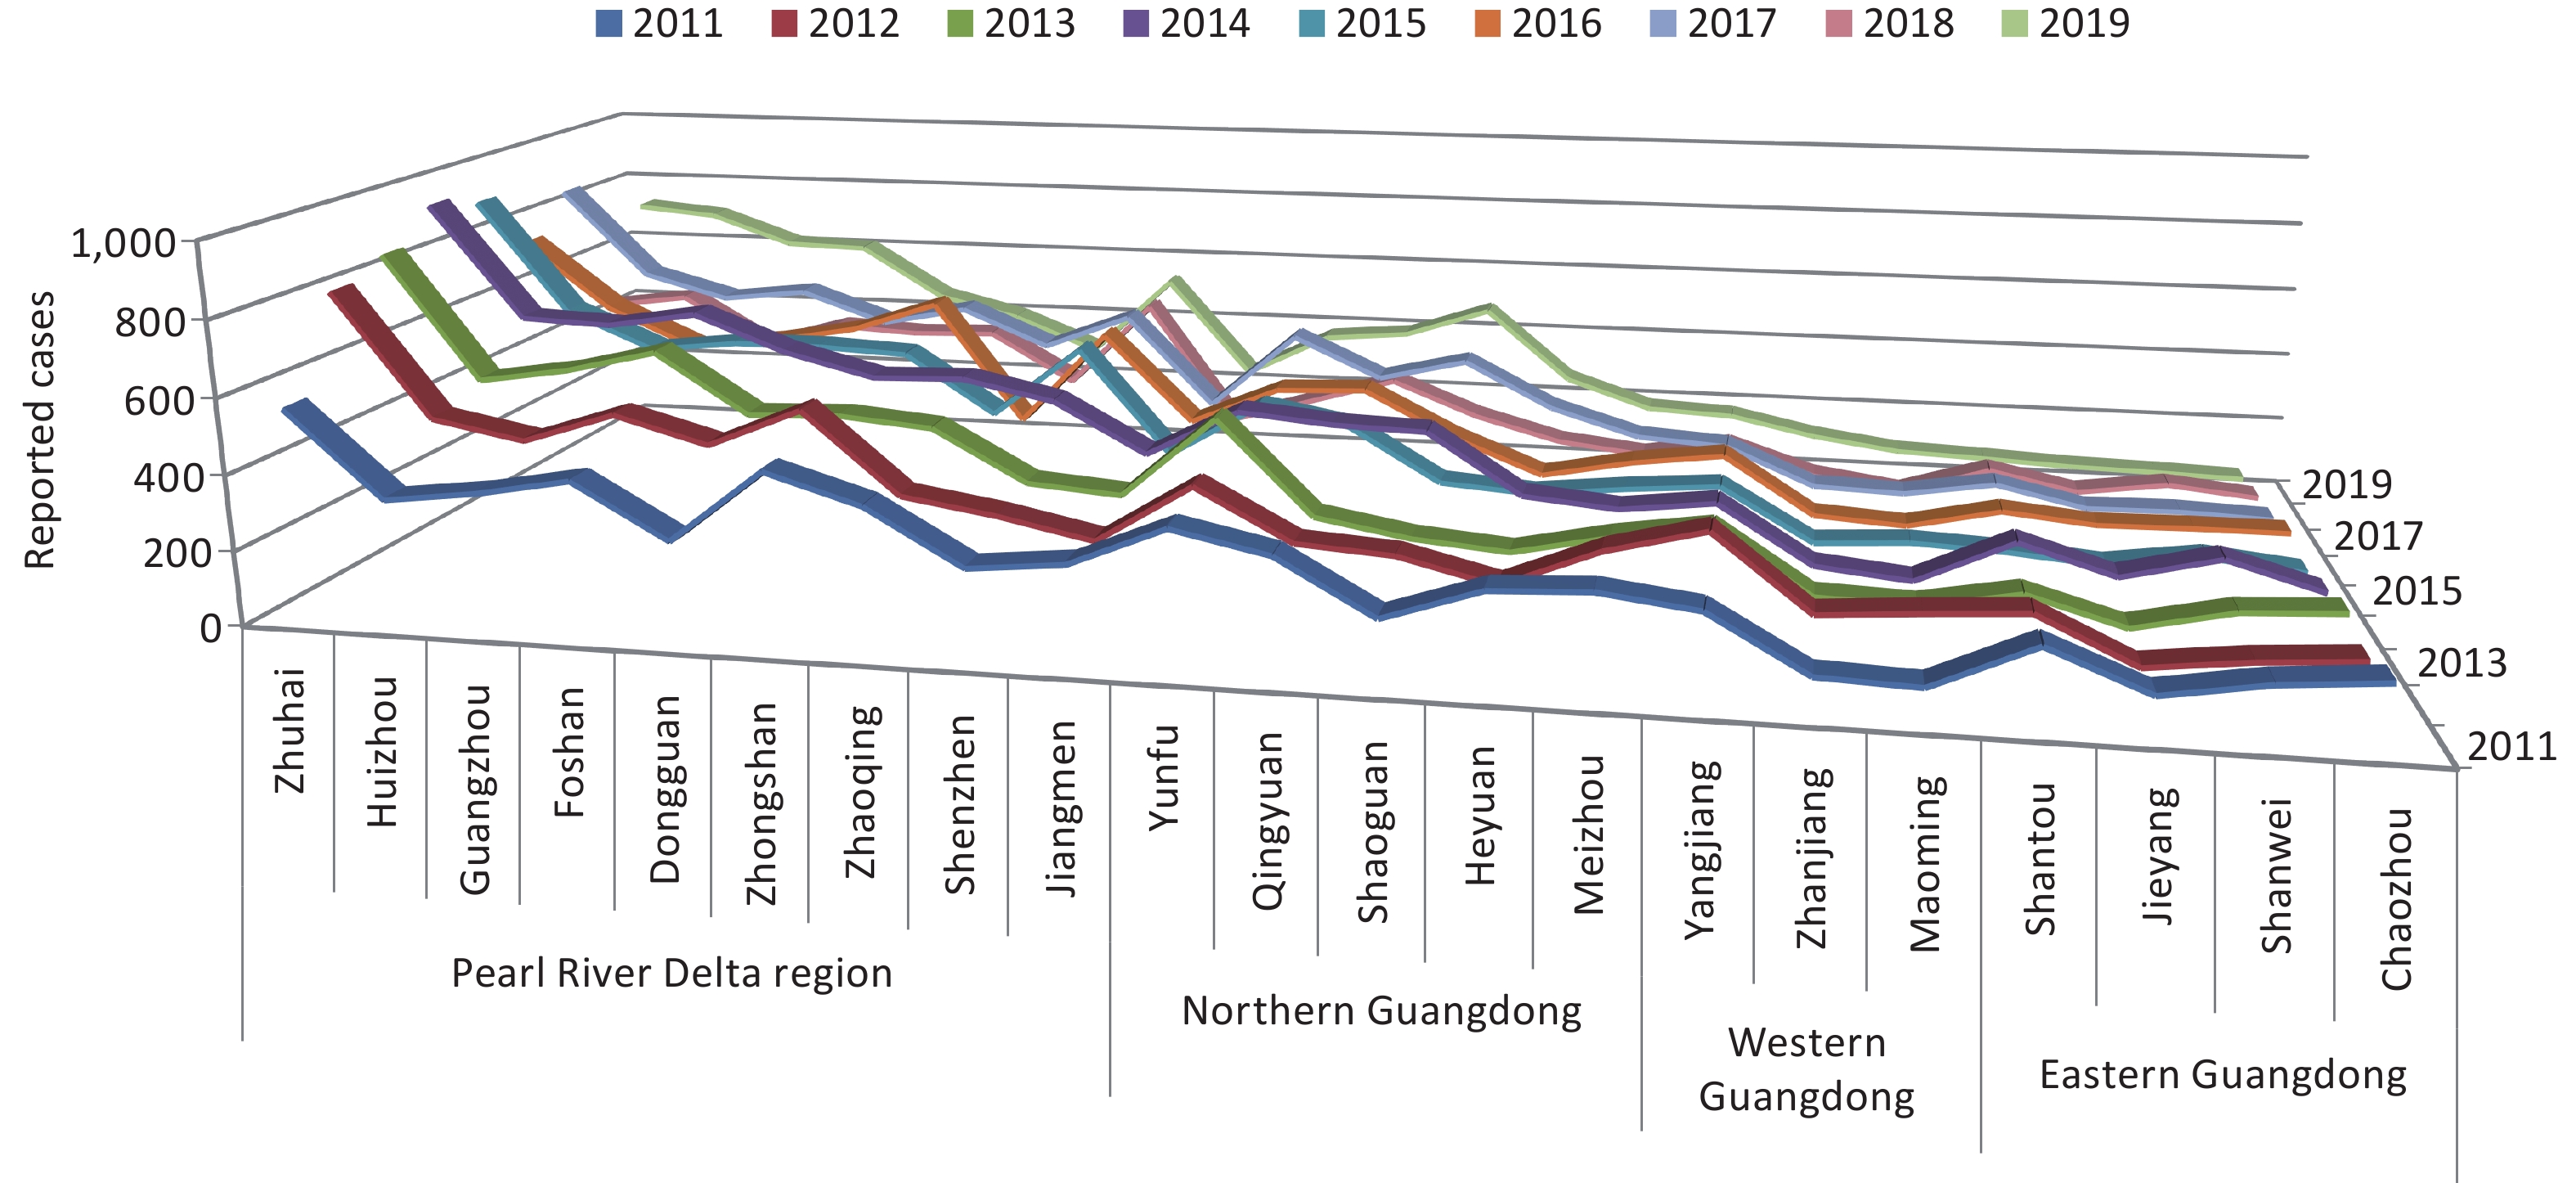
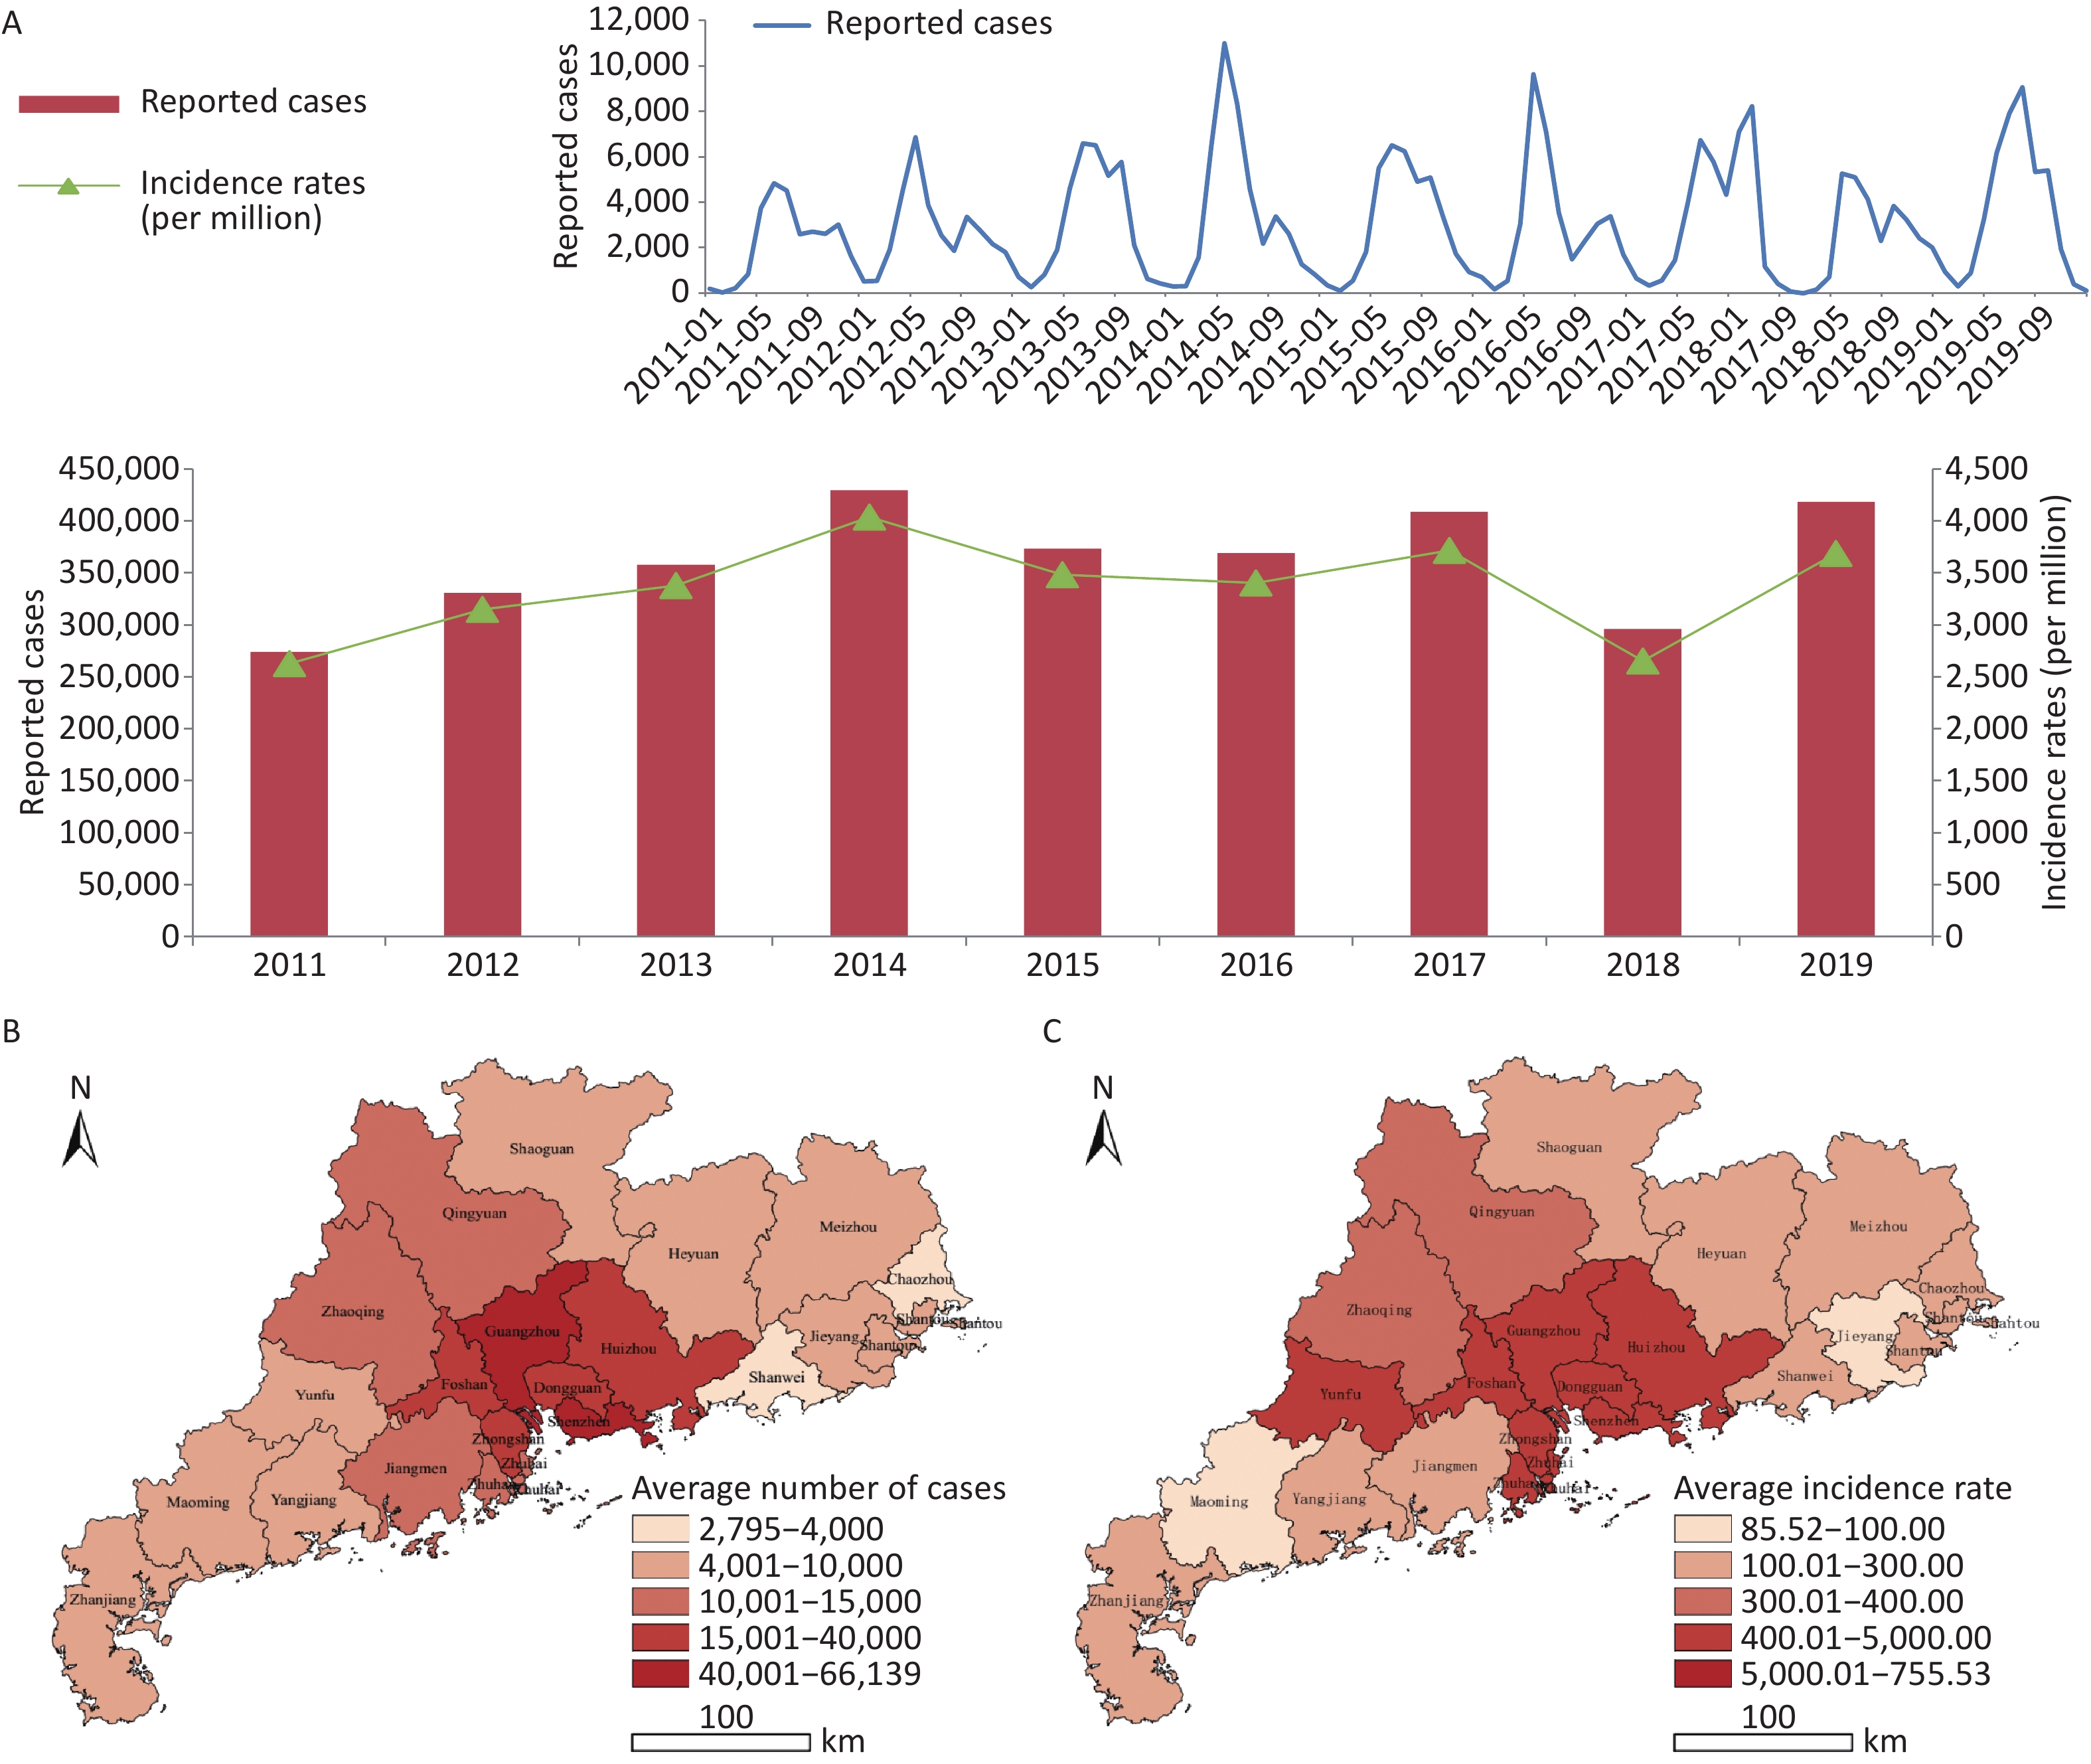
Symptomatic HFMD cases (n = 3,257,285) were reported in Guangdong, and the numbers of reported cases fluctuated, with a high incidence observed every 2 years. There were two peaks in epidemiology each year: a summer peak was observed in May and June (Supplementary Figure S1, available in www.besjournal.com), with a second smaller autumn peak in October and November, with the exception of 2017 when the autumn peak exceeded the summer peak. High risk areas of HFMD in Guangdong were located in the Pearl River Delta region, especially Zhuhai city and Guangzhou city, which had the highest incidence rates and number of reported cases over the 9-year period (Supplementary Figures S2–S3, available in www.besjournal.com).
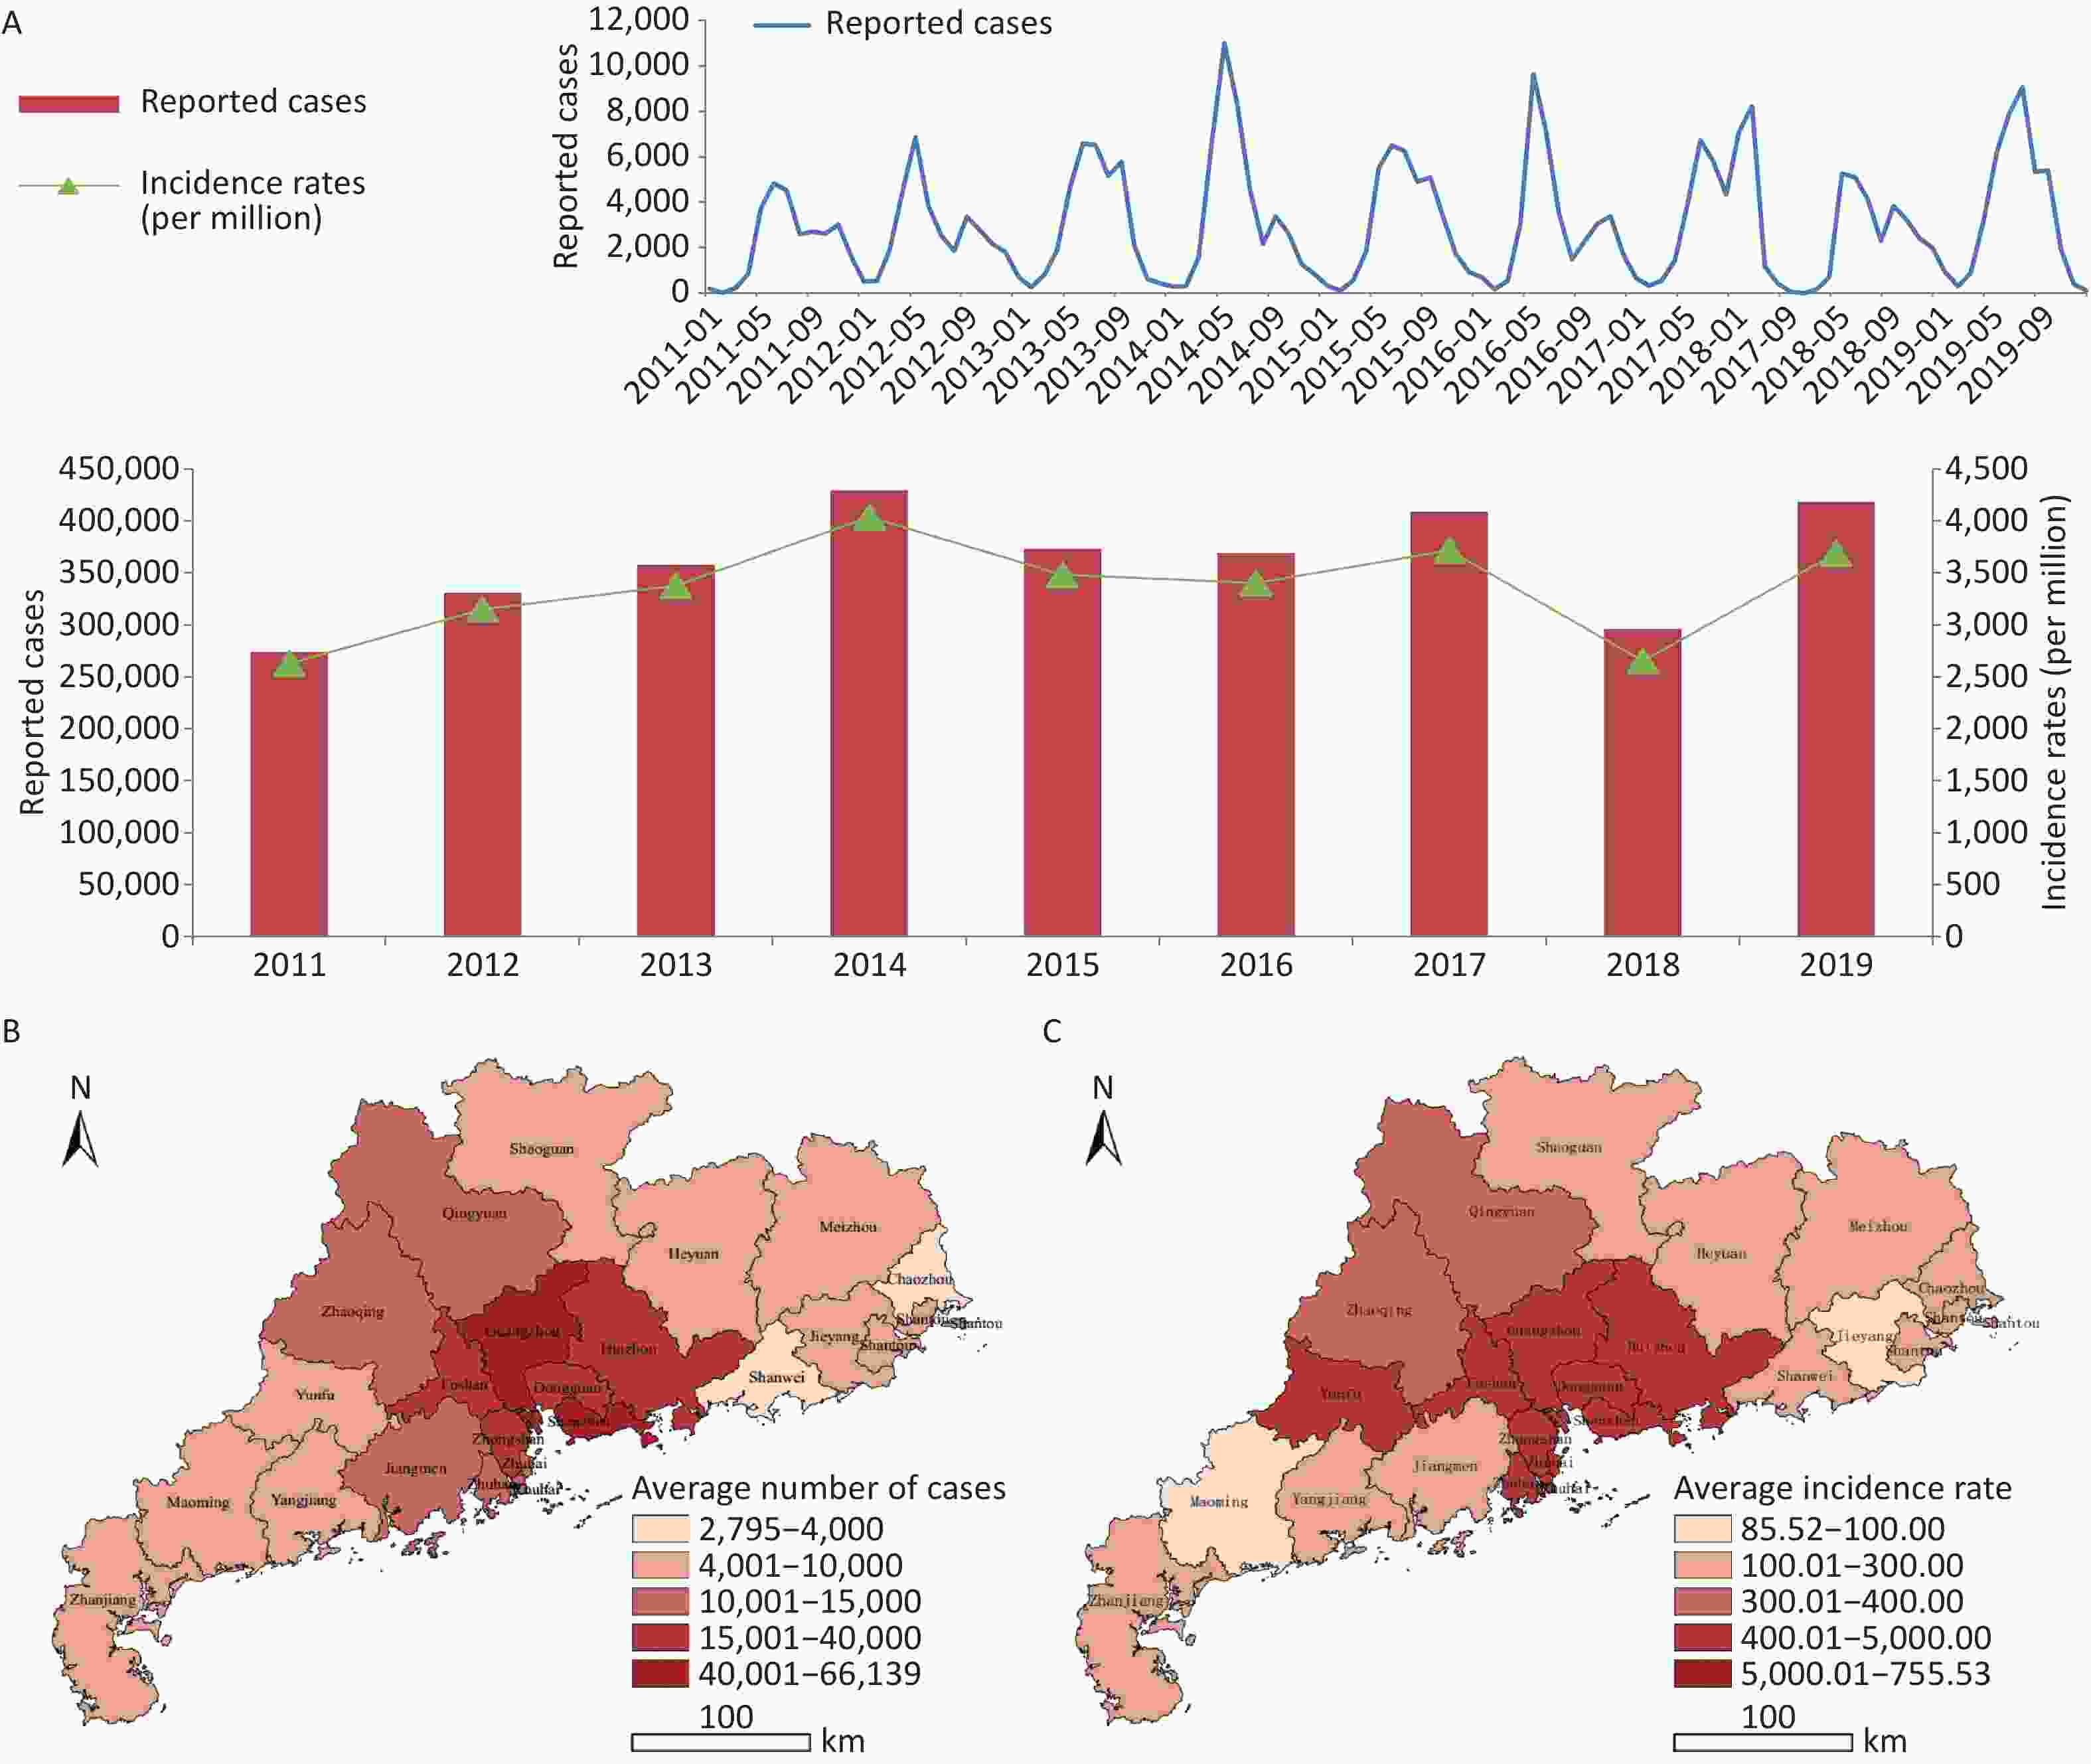
Figure S1. (A) Epidemical curve of reported cases with HFMD between 2011 and 2019 in Guangdong. (B) Geographic distribution of average number of probable and laboratory-confirmed cases. (C) Geographic distribution of average incidence rates of probable and laboratory-confirmed cases.
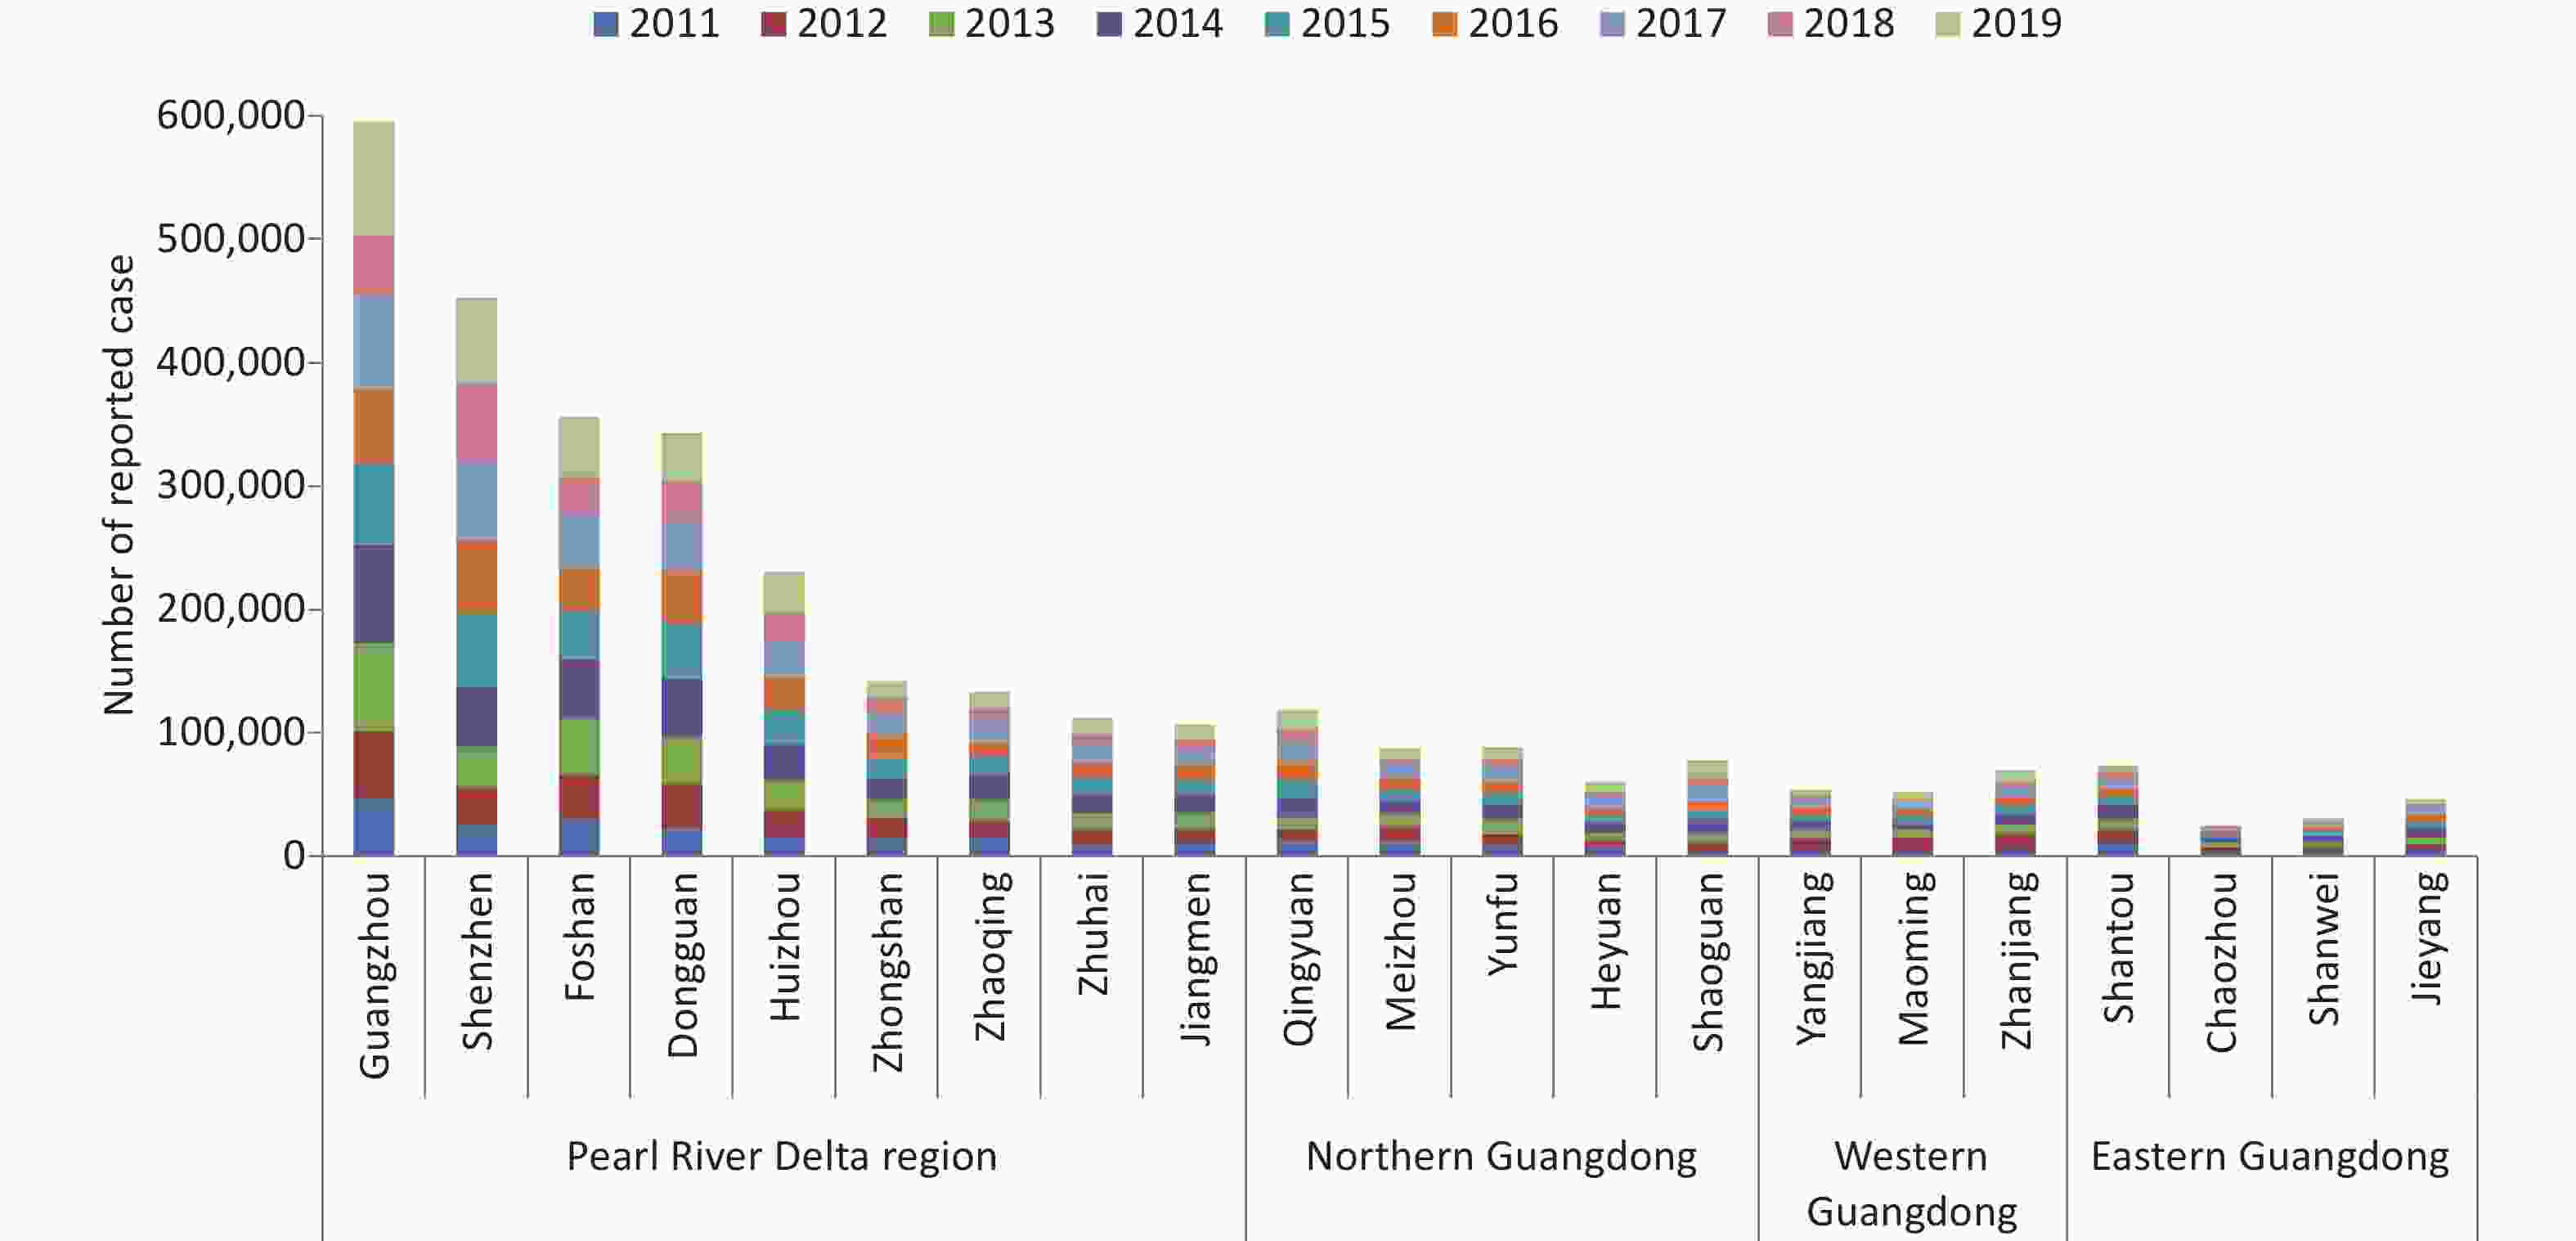
Figure S2. Number of reported case of HFMD in cities of Guangdong province between 2011 and 2019. Data was available from Chinese Disease Prevention and Control Information System (http://10.249.1.170:81).
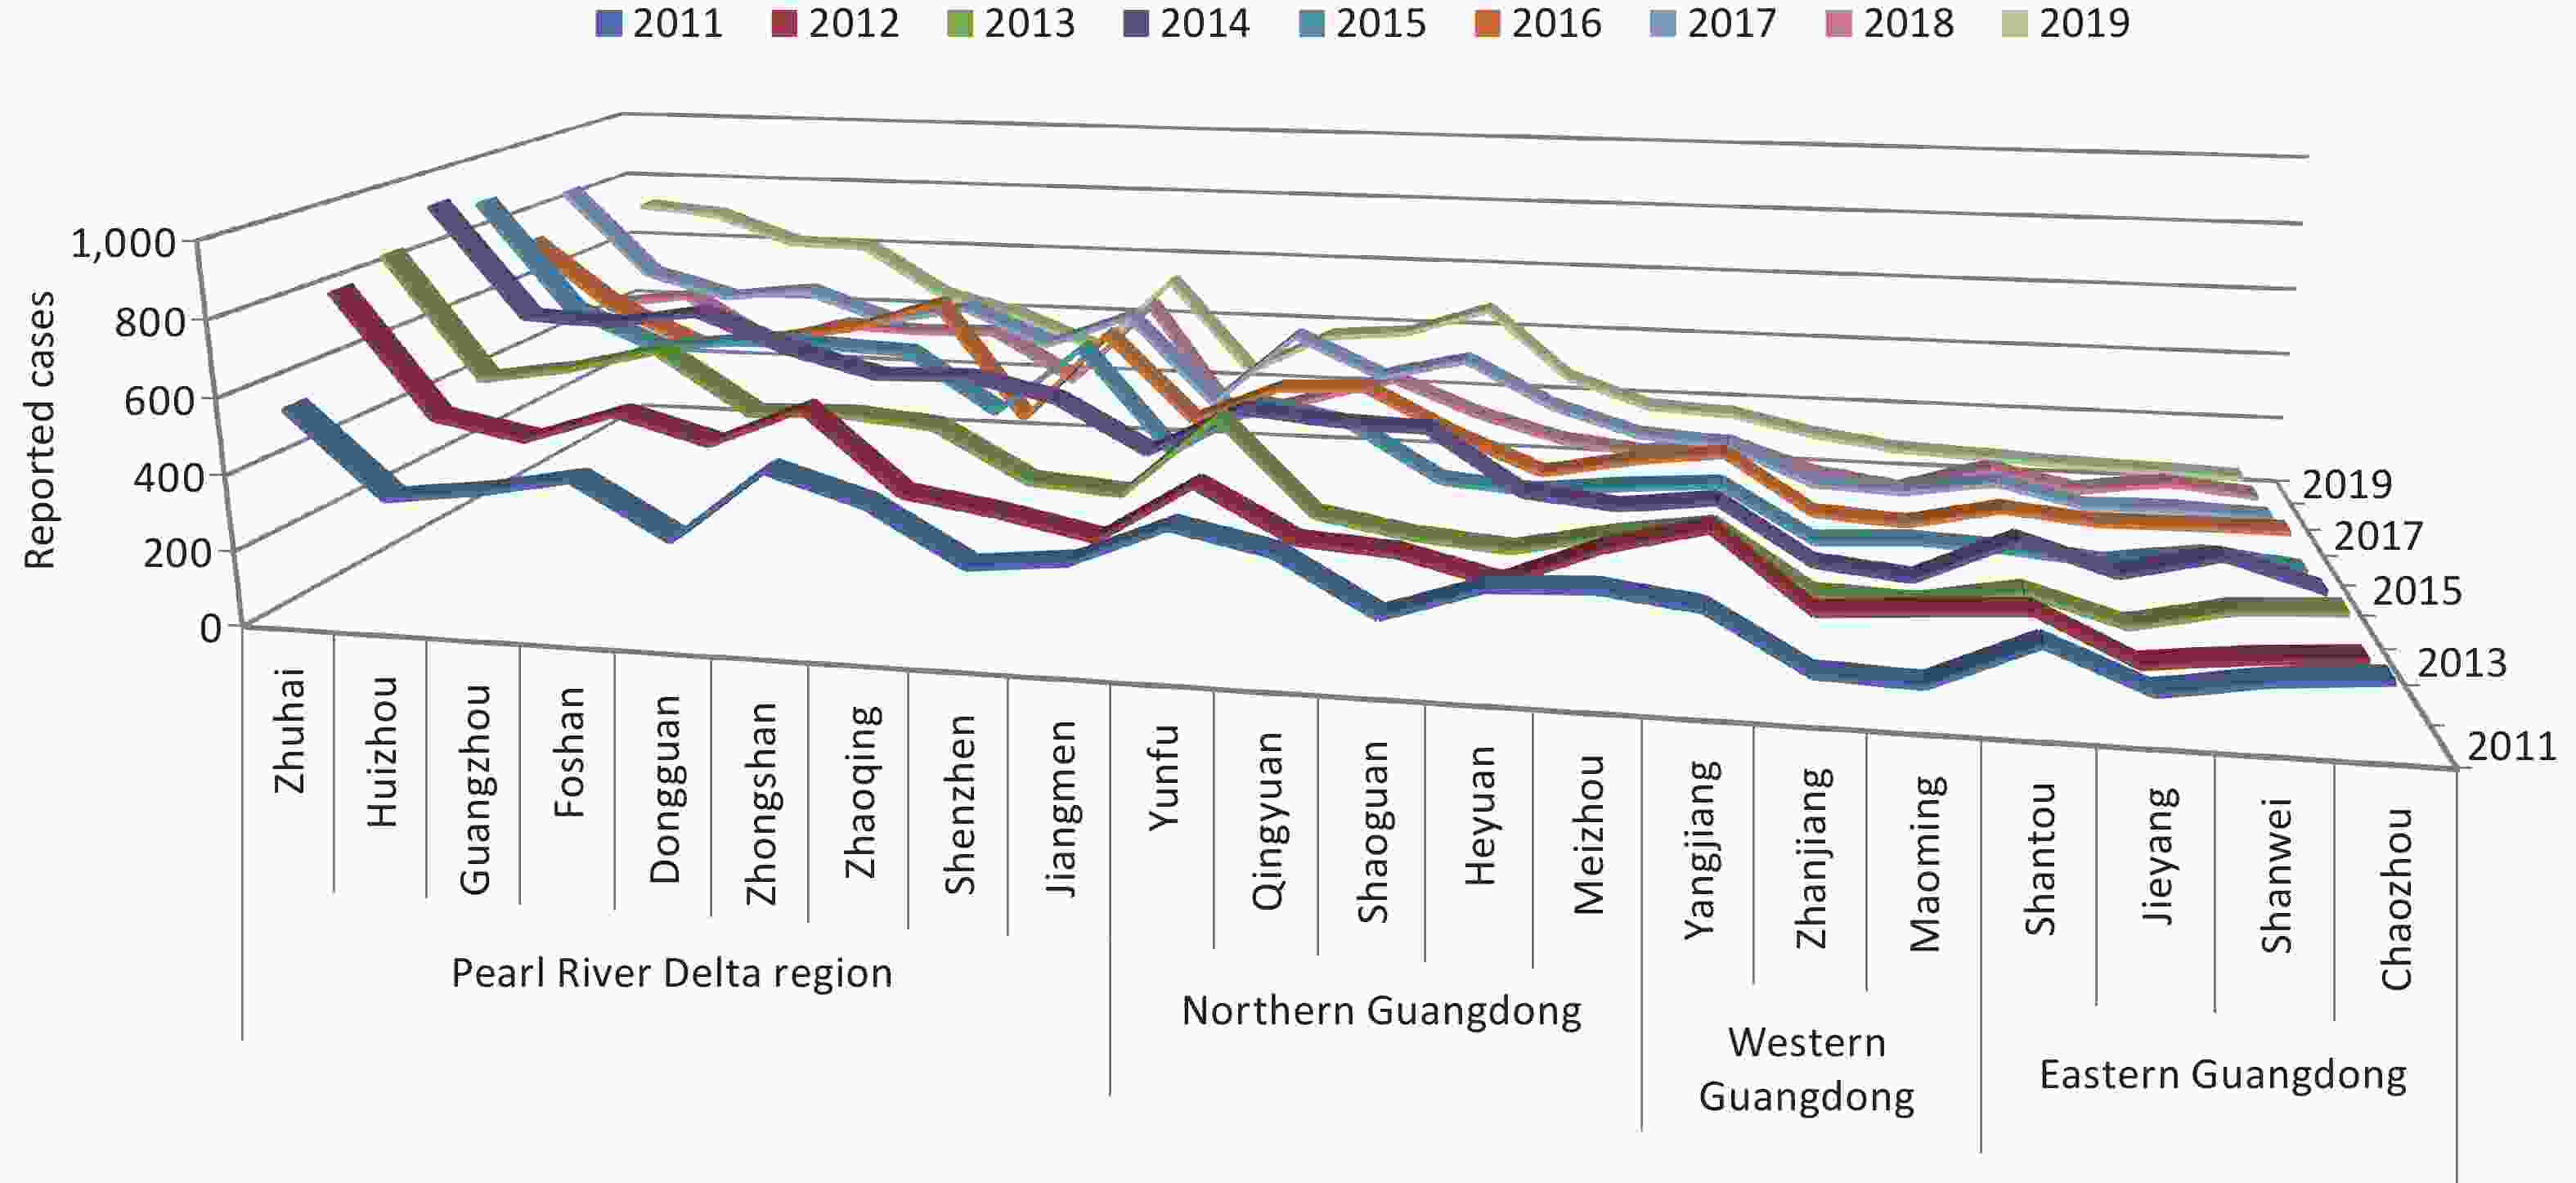
Figure S3. Incidence of HFMD in cities of Guangdong province between 2011 and 2019. Data was available from Chinese Disease Prevention and Control Information System (http://10.249.1.170:81).
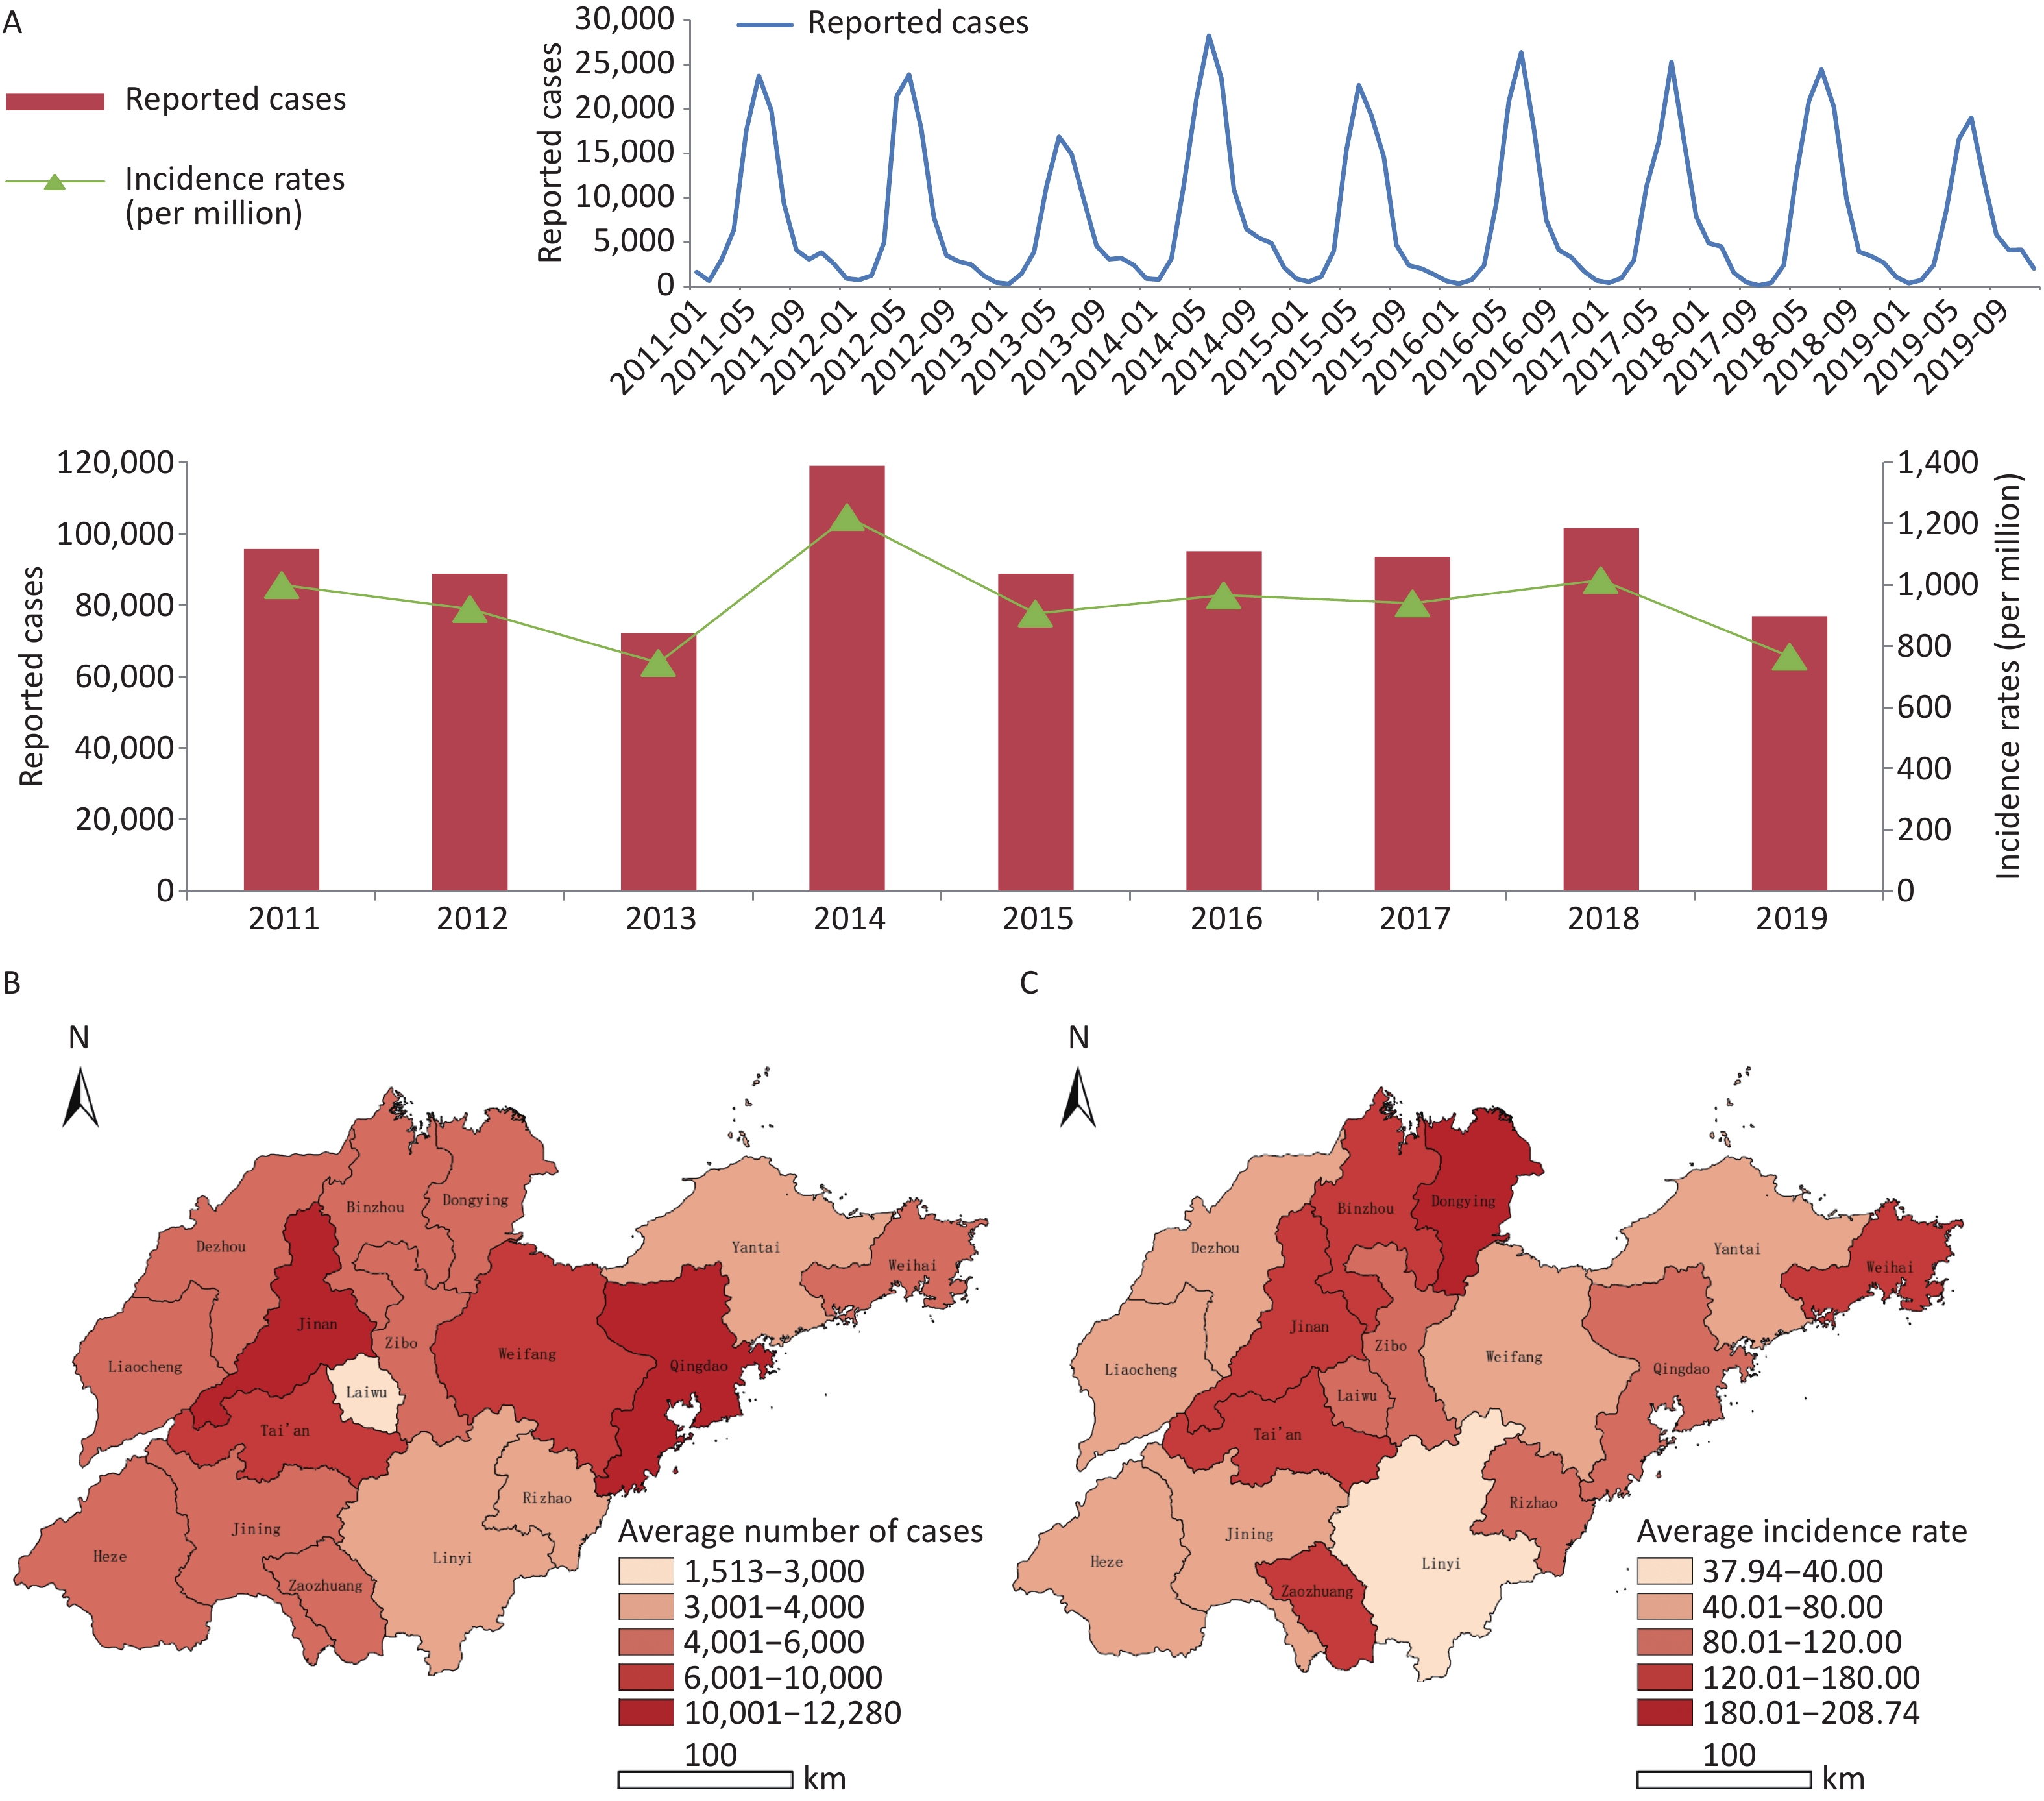
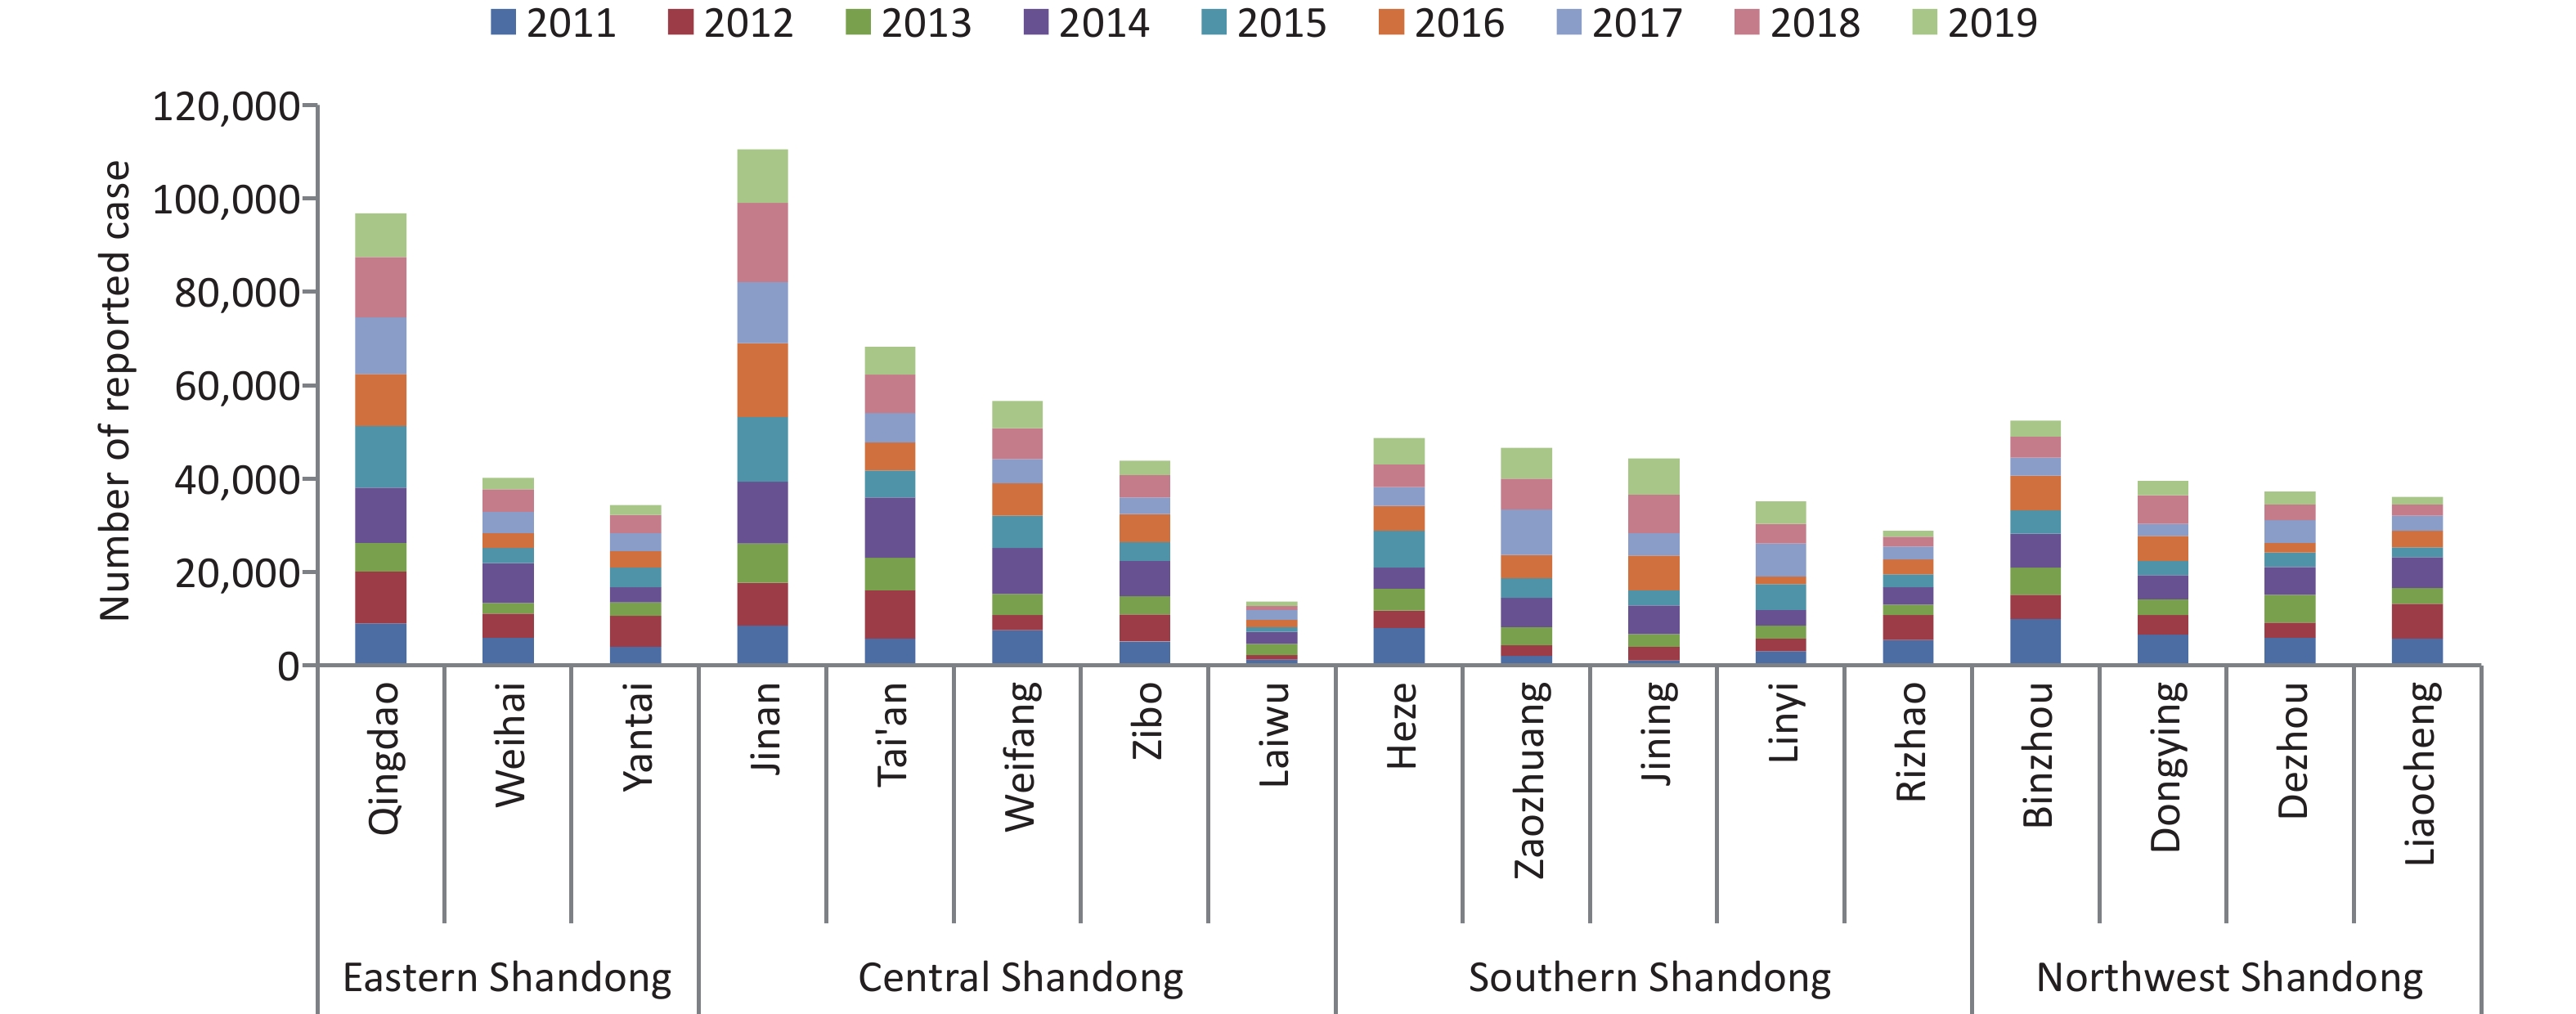
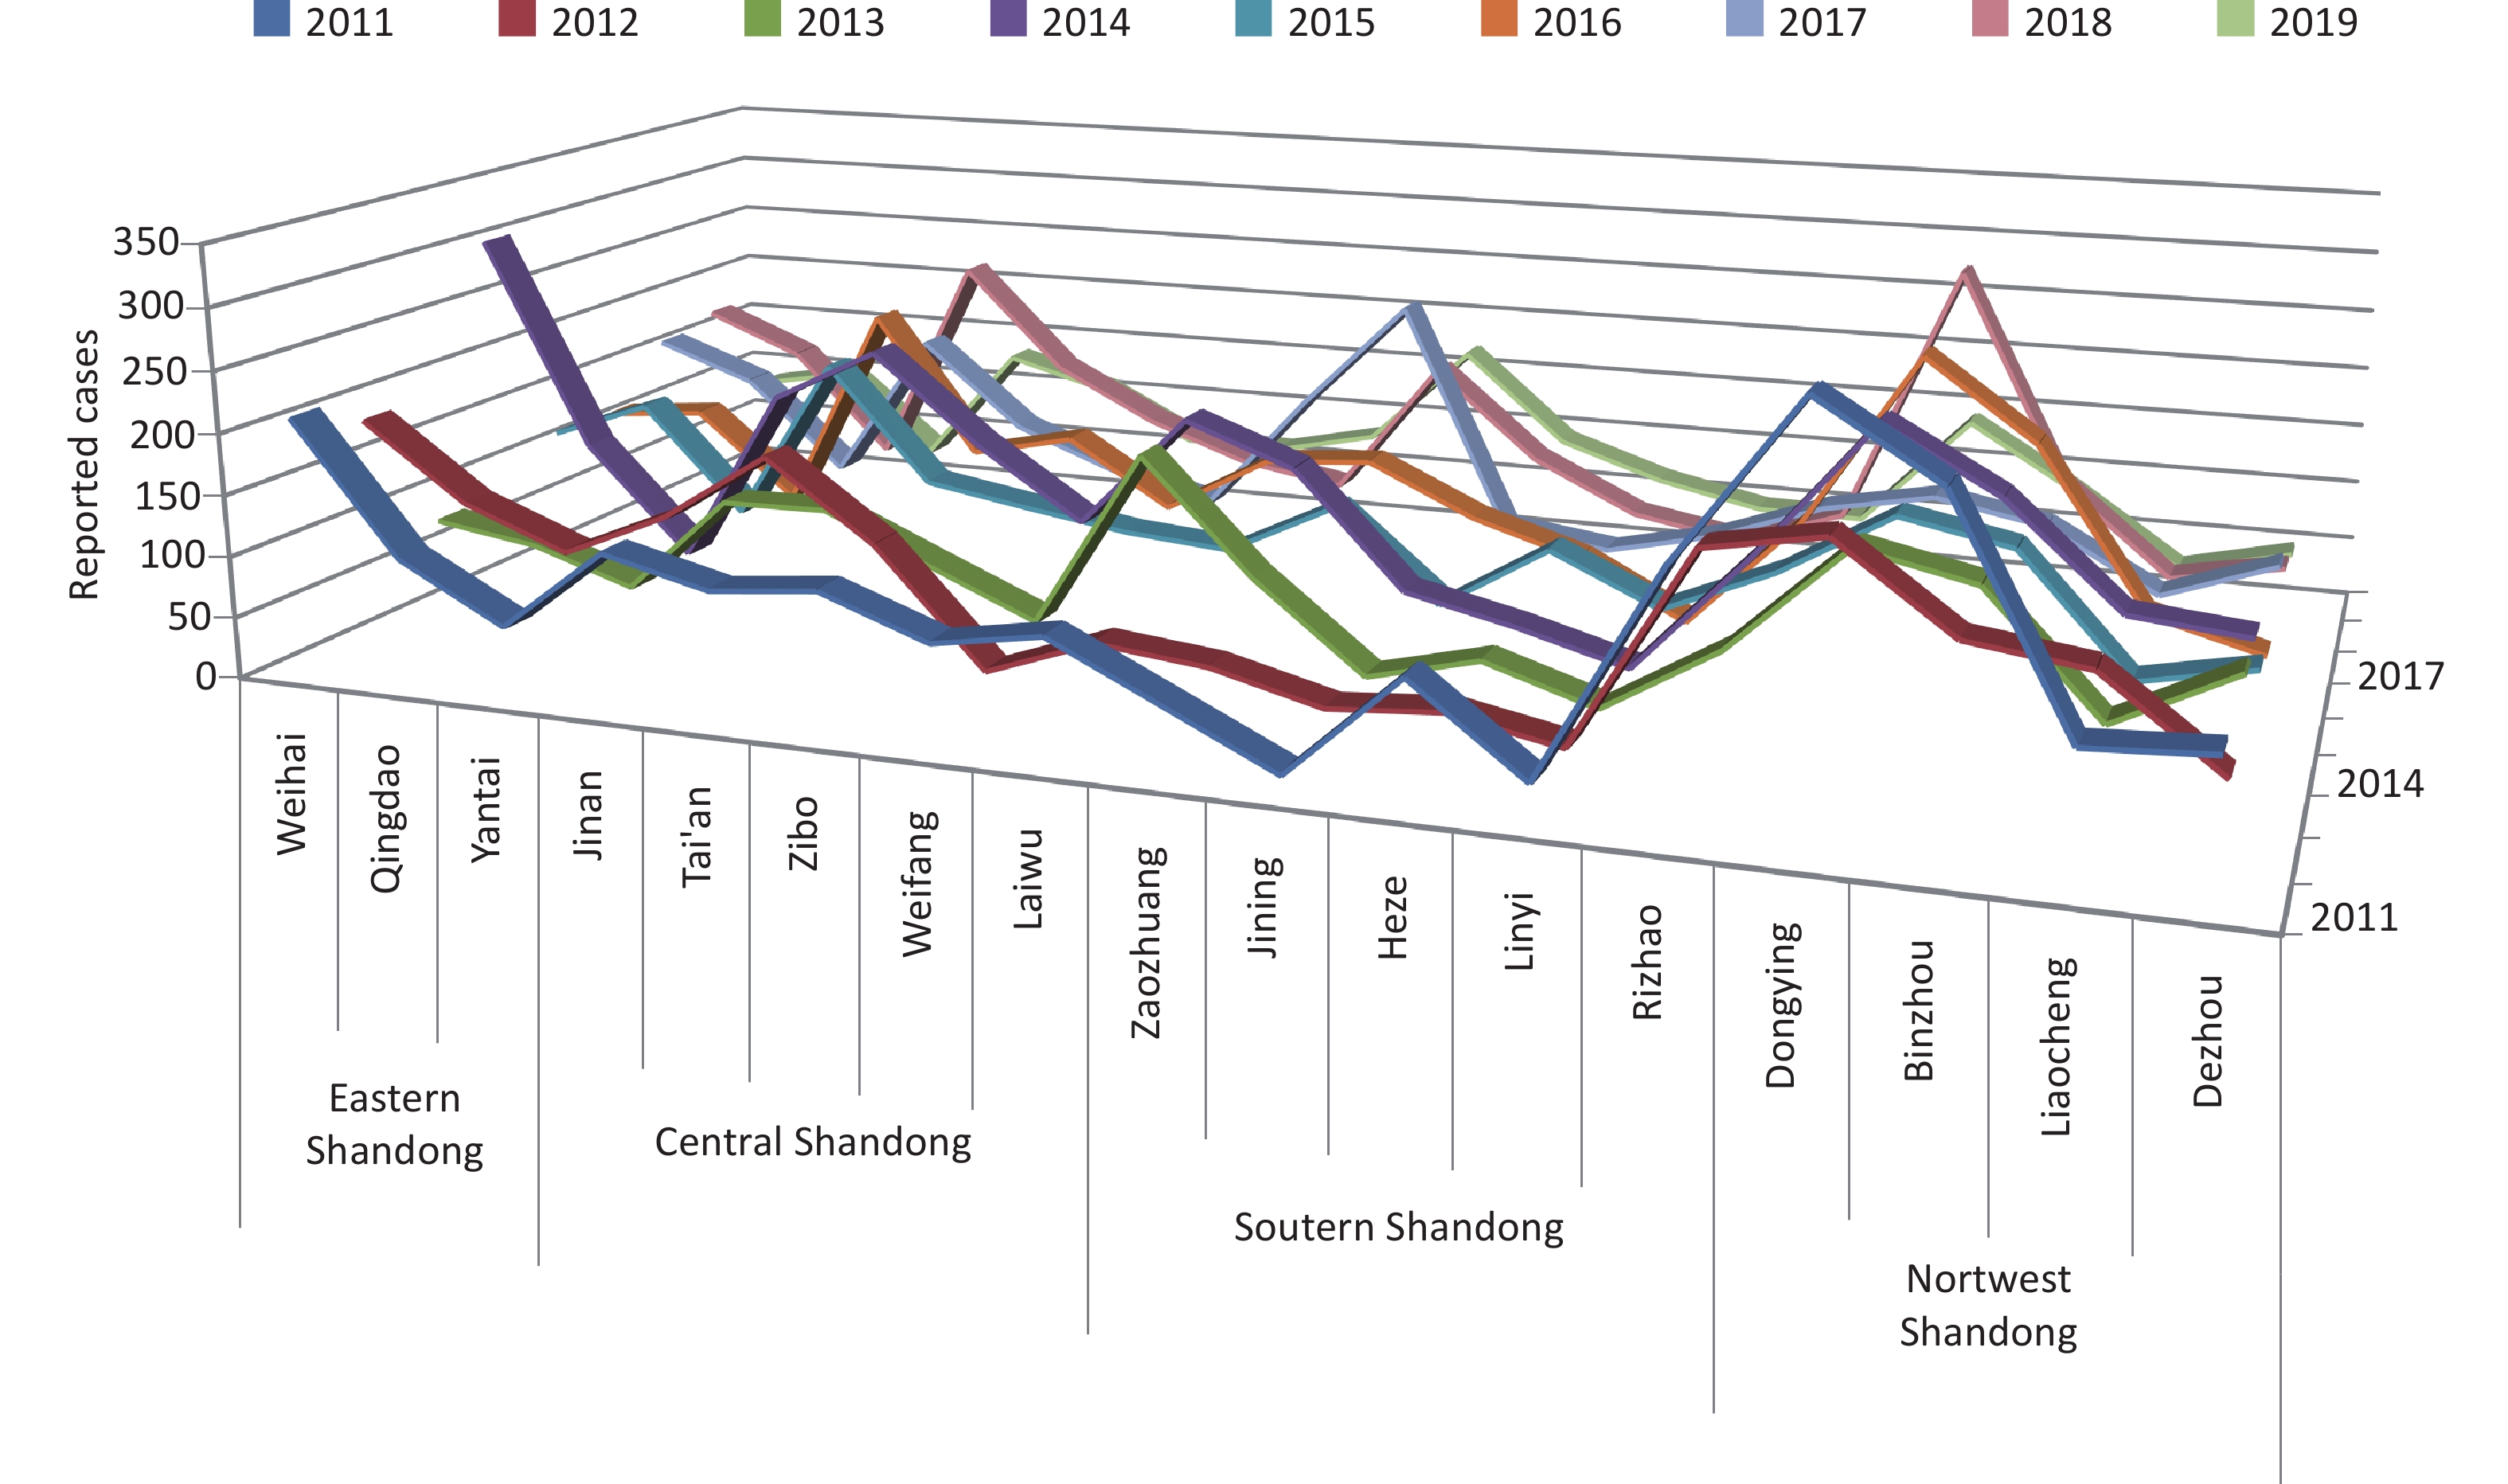
A total of 832,065 HFMD cases were reported by the surveillance system from 2011 to 2019 in Shandong. The incidence of HFMD showed a typical major peak each year, and the number of reported cases began to increase in March and reached a peak from May to July (Supplementary Figure S4, available in www.besjournal.com). The highest average number of reported cases occurred in the provincial capital and the northwest region of Shandong, while the highest average incidence rate was detected in Dongying city on the northern coast of Shandong, and the lowest incidence rate was in Linyi city, located inland in south Shandong (Supplementary Figures S5–S6, available in www.besjournal.com).
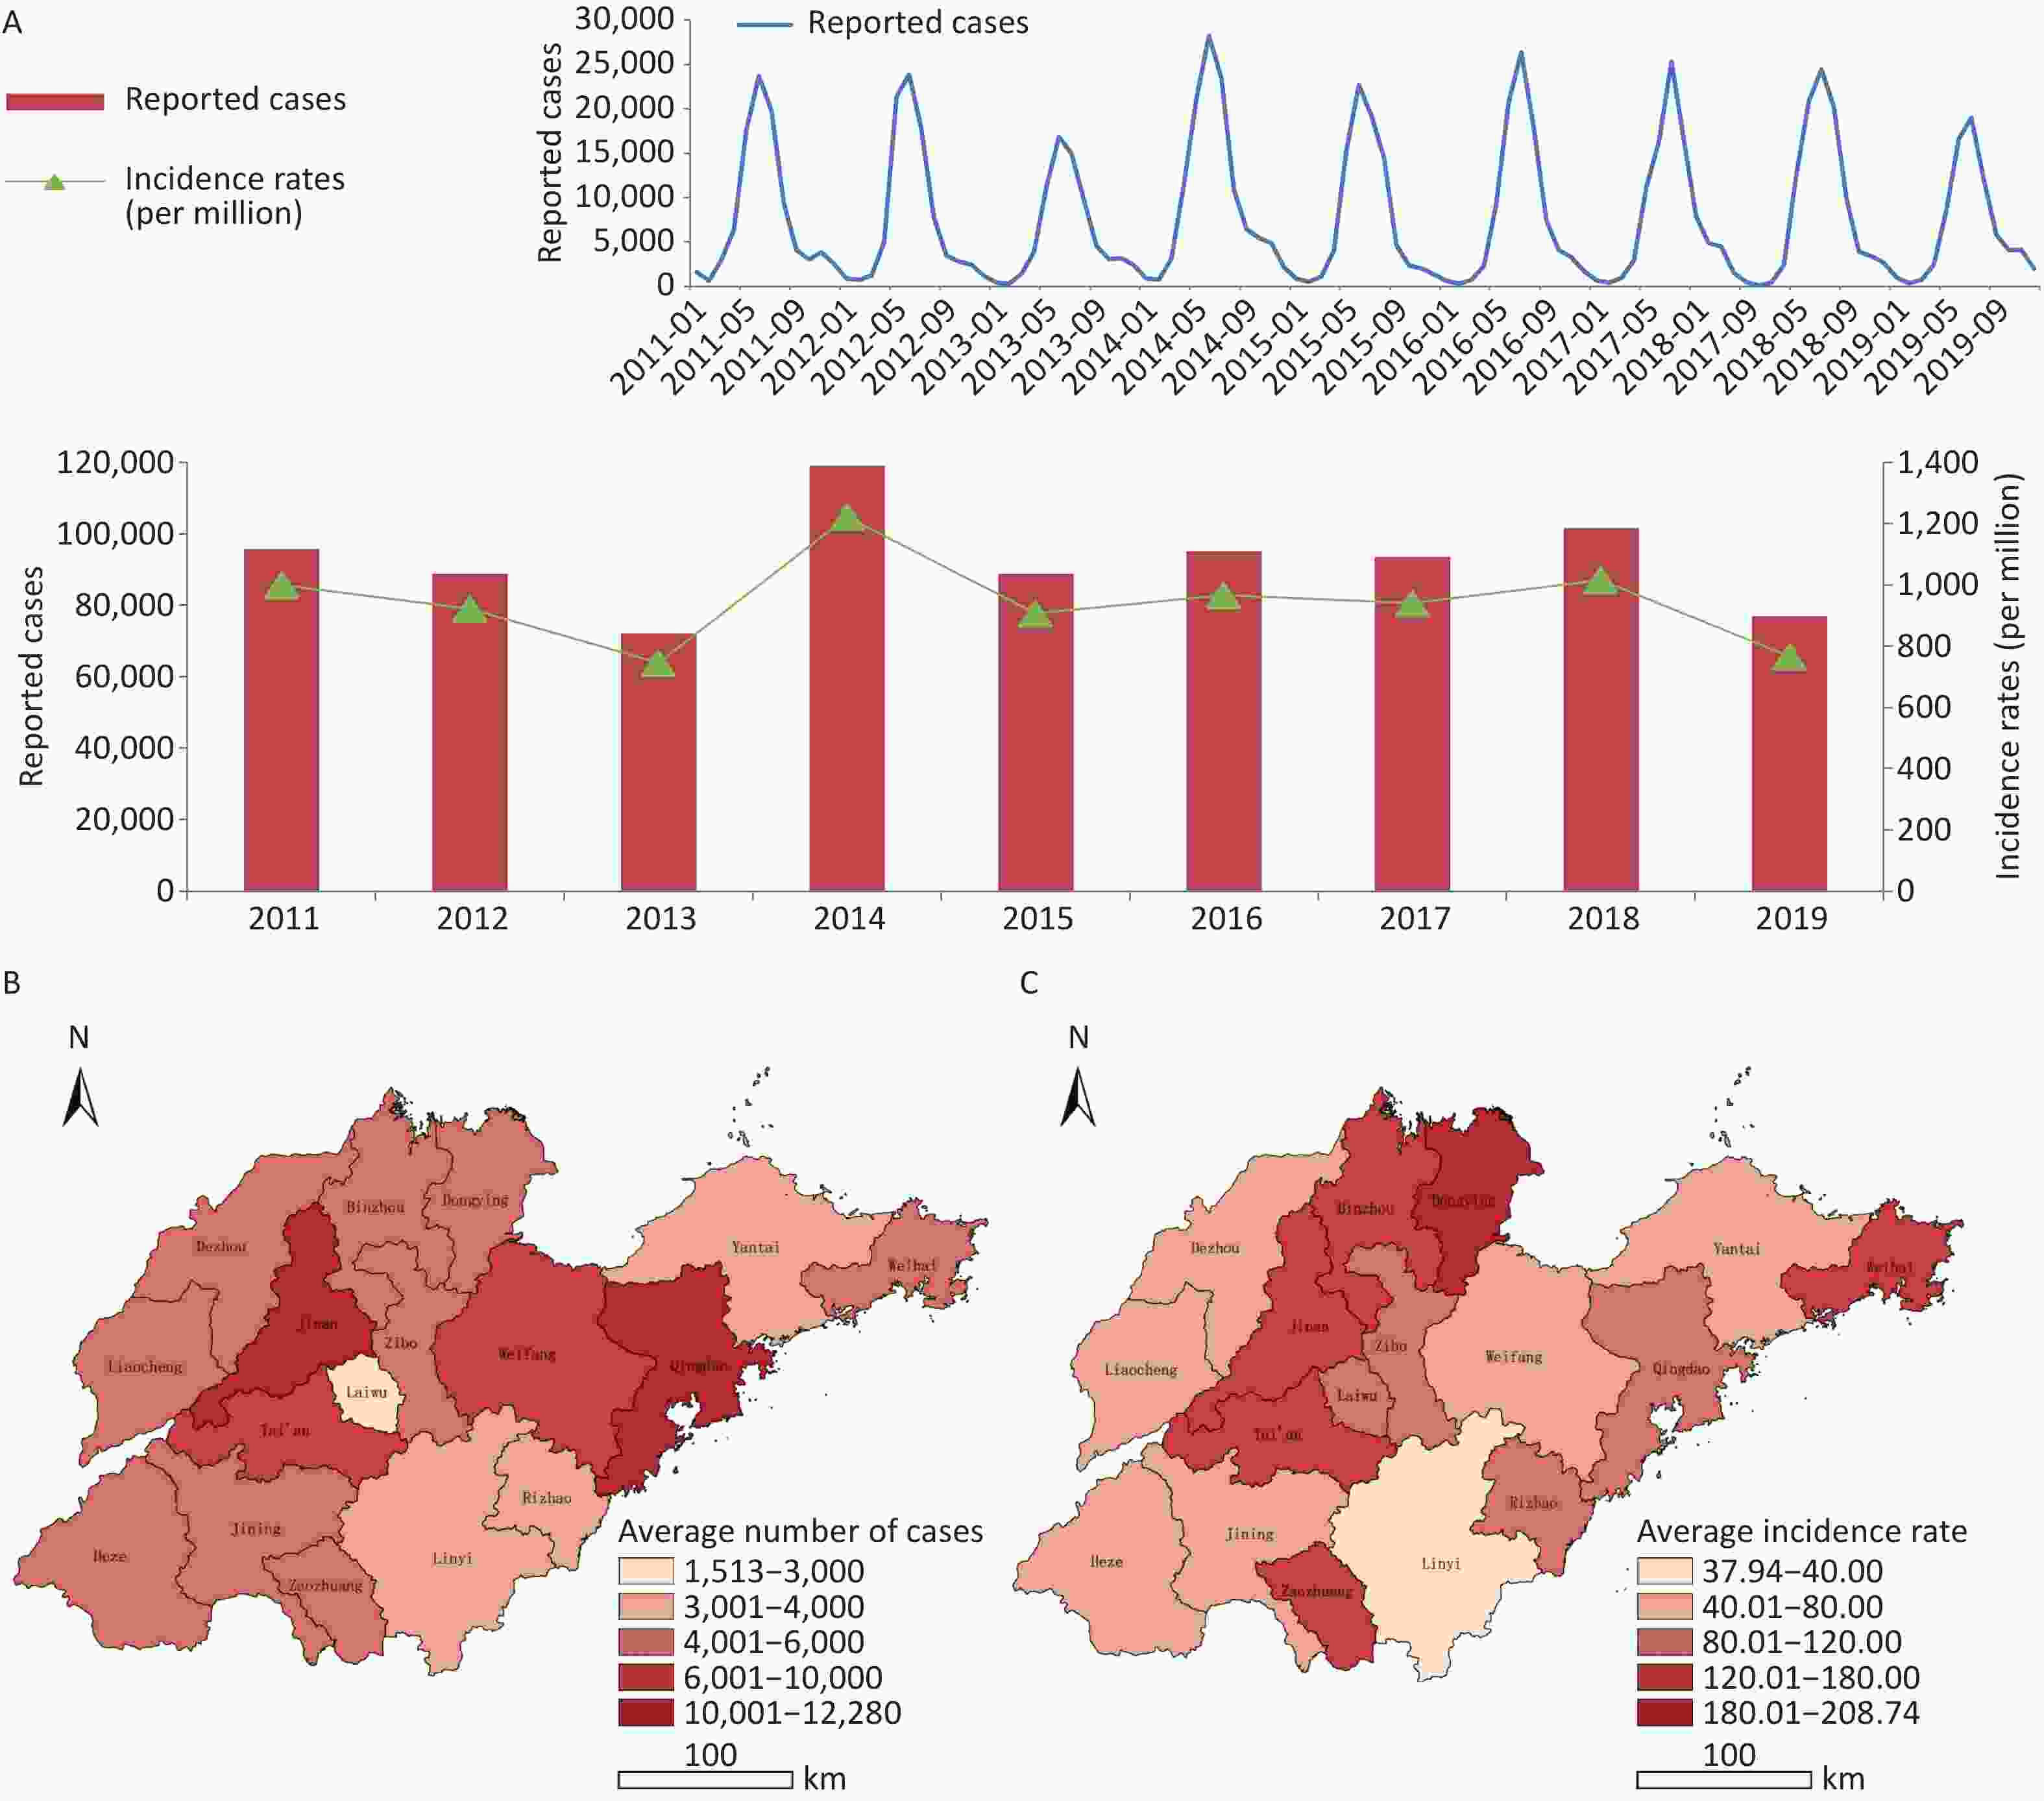
Figure S4. (A) Epidemical curve of reported cases with HFMD between 2011 and 2019 in Shandong. (B) Geographic distribution of average number of probable and laboratory-confirmed cases. (C) Geographic distribution of average incidence rates of probable and laboratory-confirmed cases.
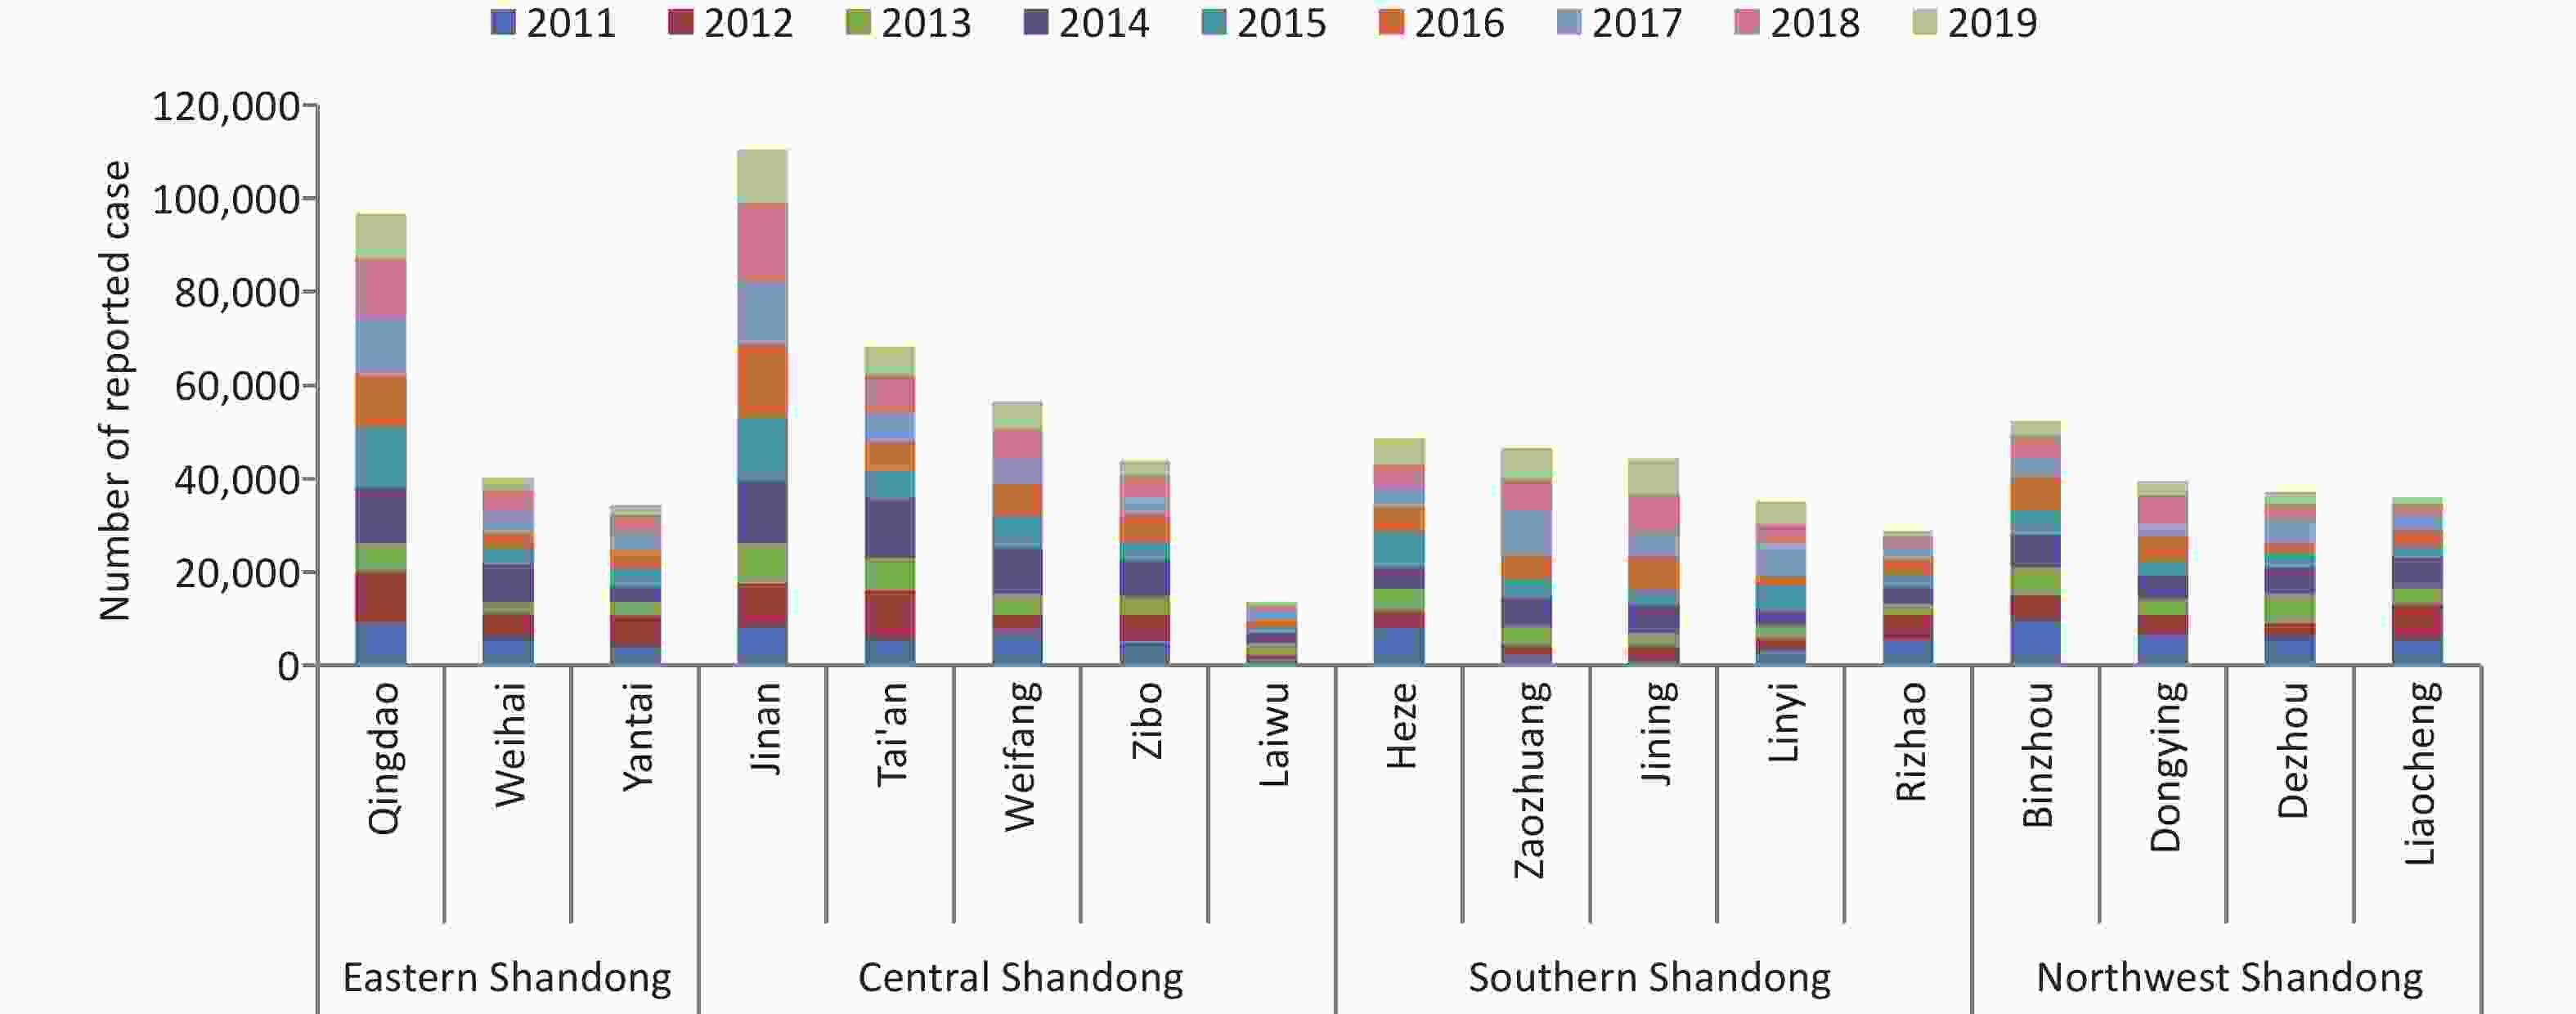
Figure S5. Number of reported case of HFMD in cities of Shandong province between 2011 and 2019. Data was available from Chinese Disease Prevention and Control Information System (http://10.249.1.170:81).
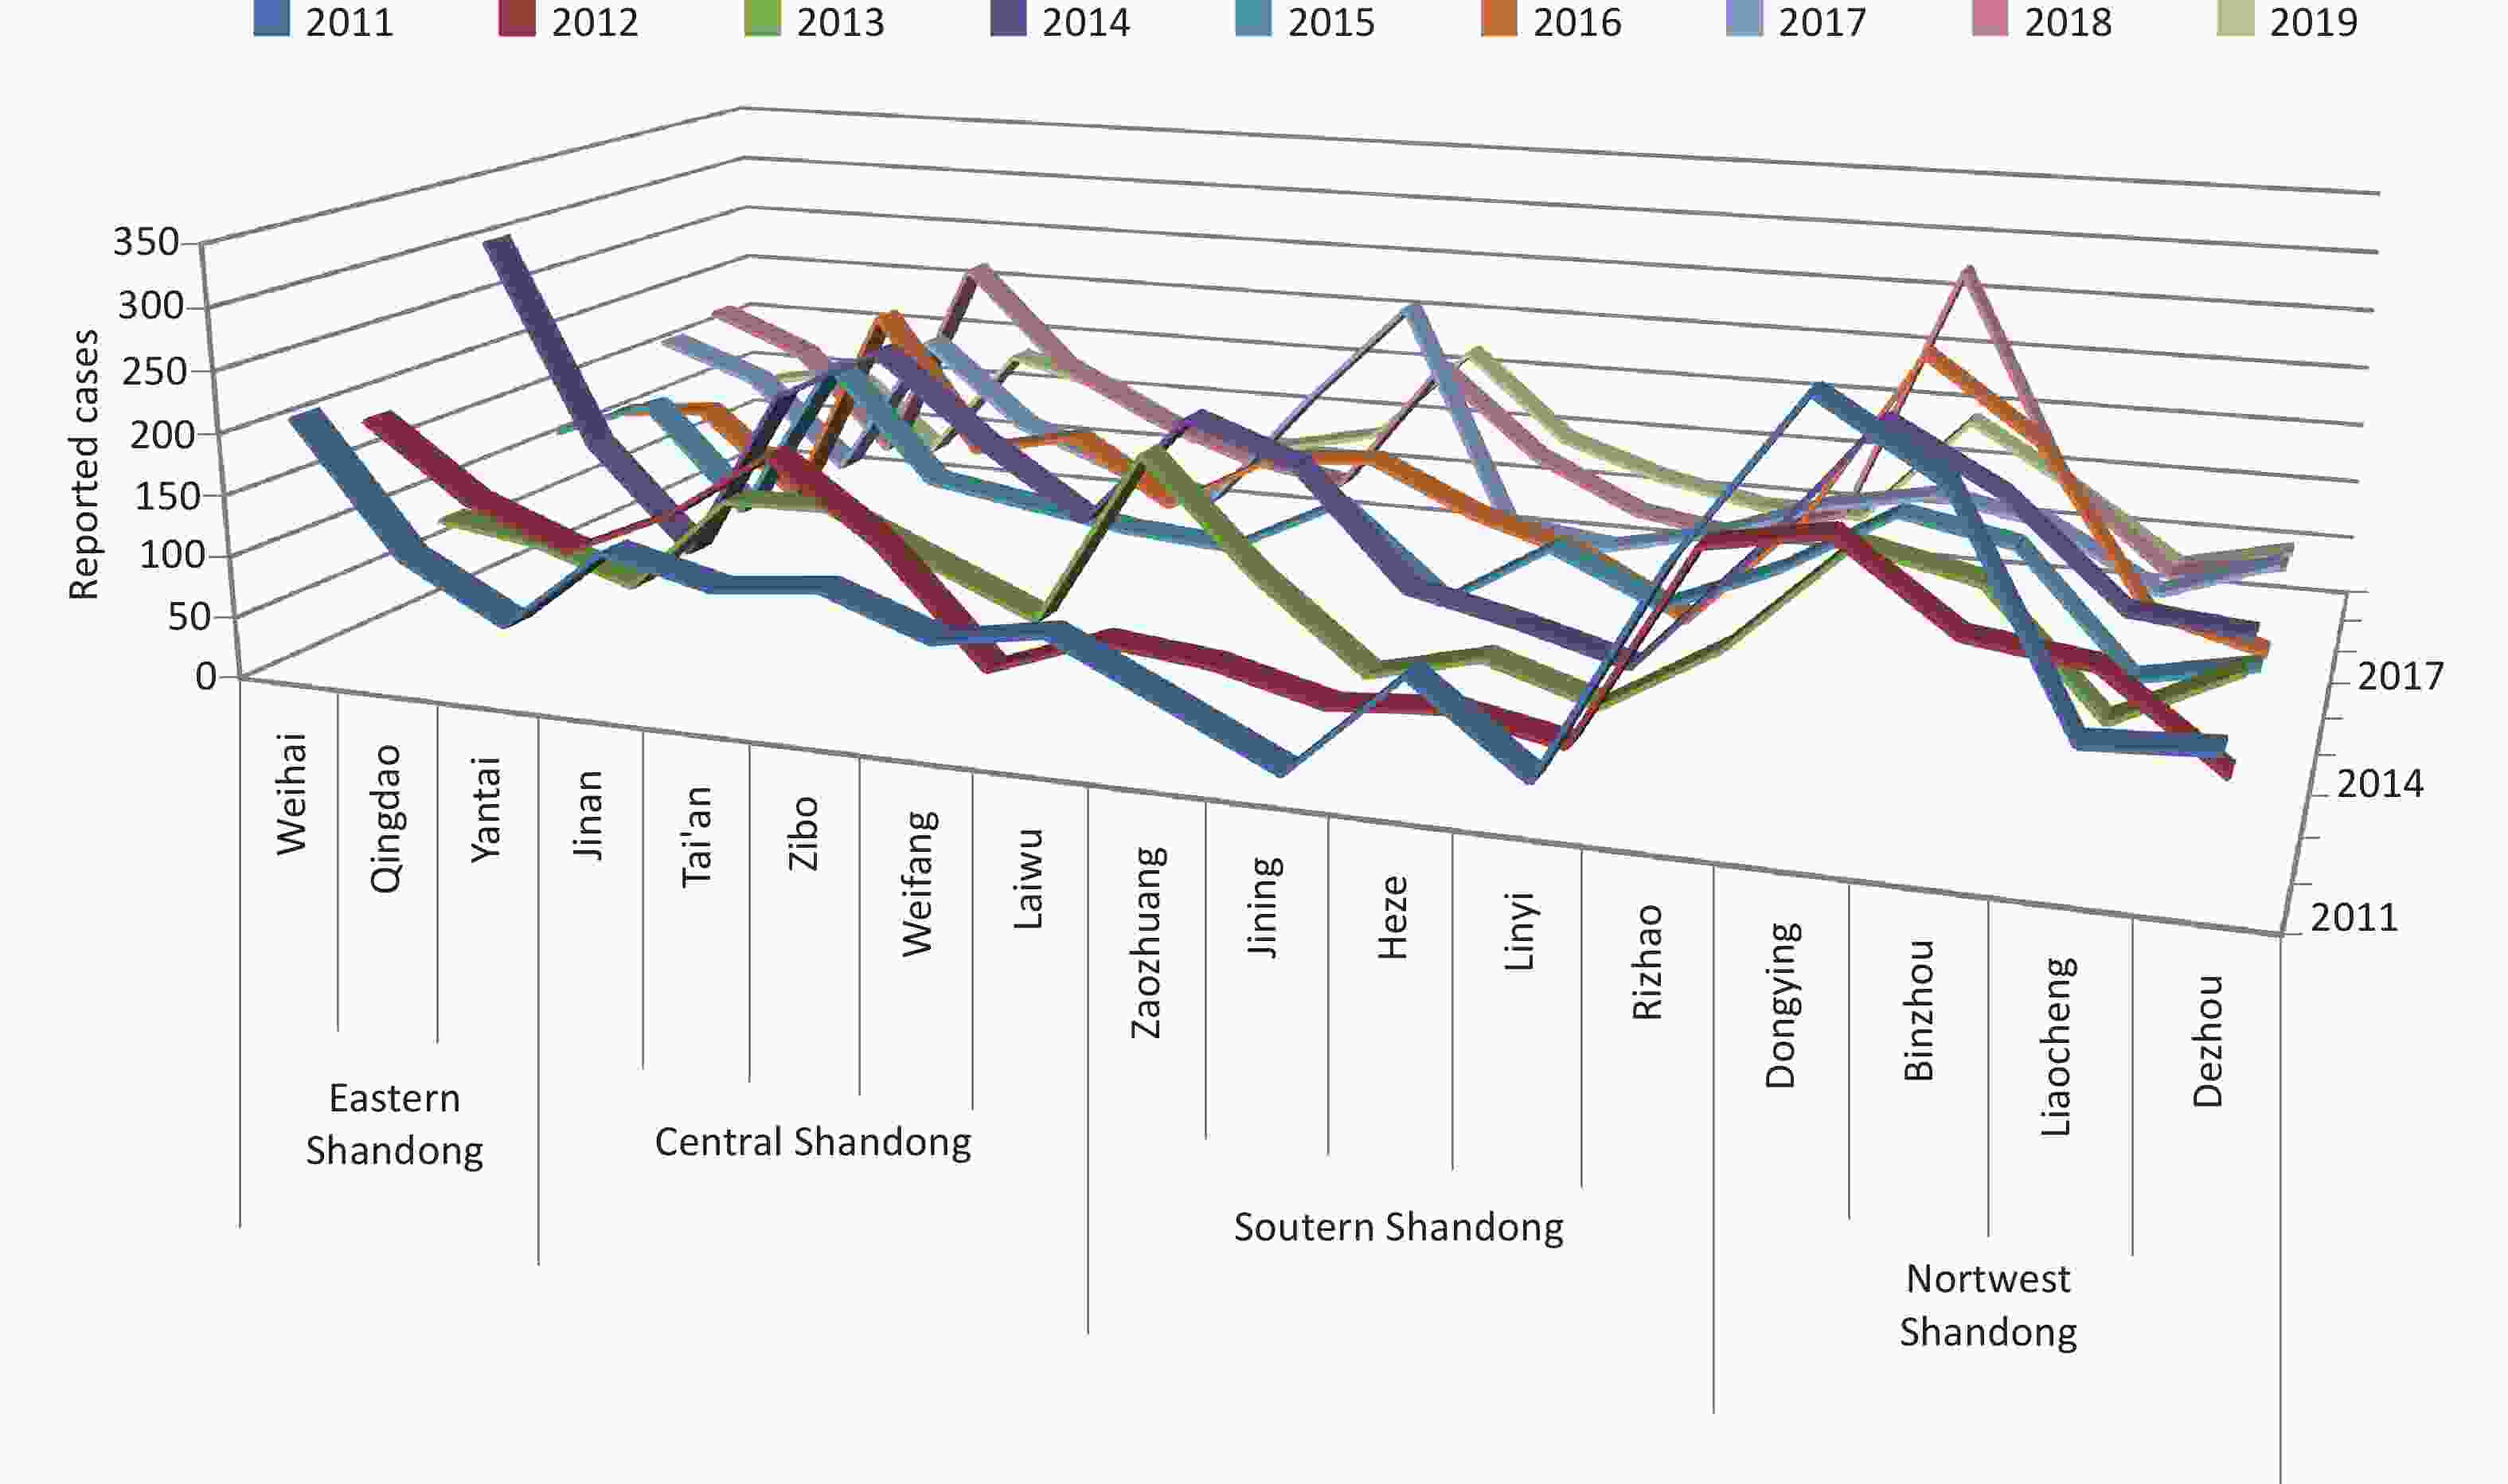
Figure S6. Incidence of HFMD in cities of Shandong province between 2011 and 2019. Data was available from Chinese Disease Prevention and Control Information System (http://10.249.1.170:81).
-
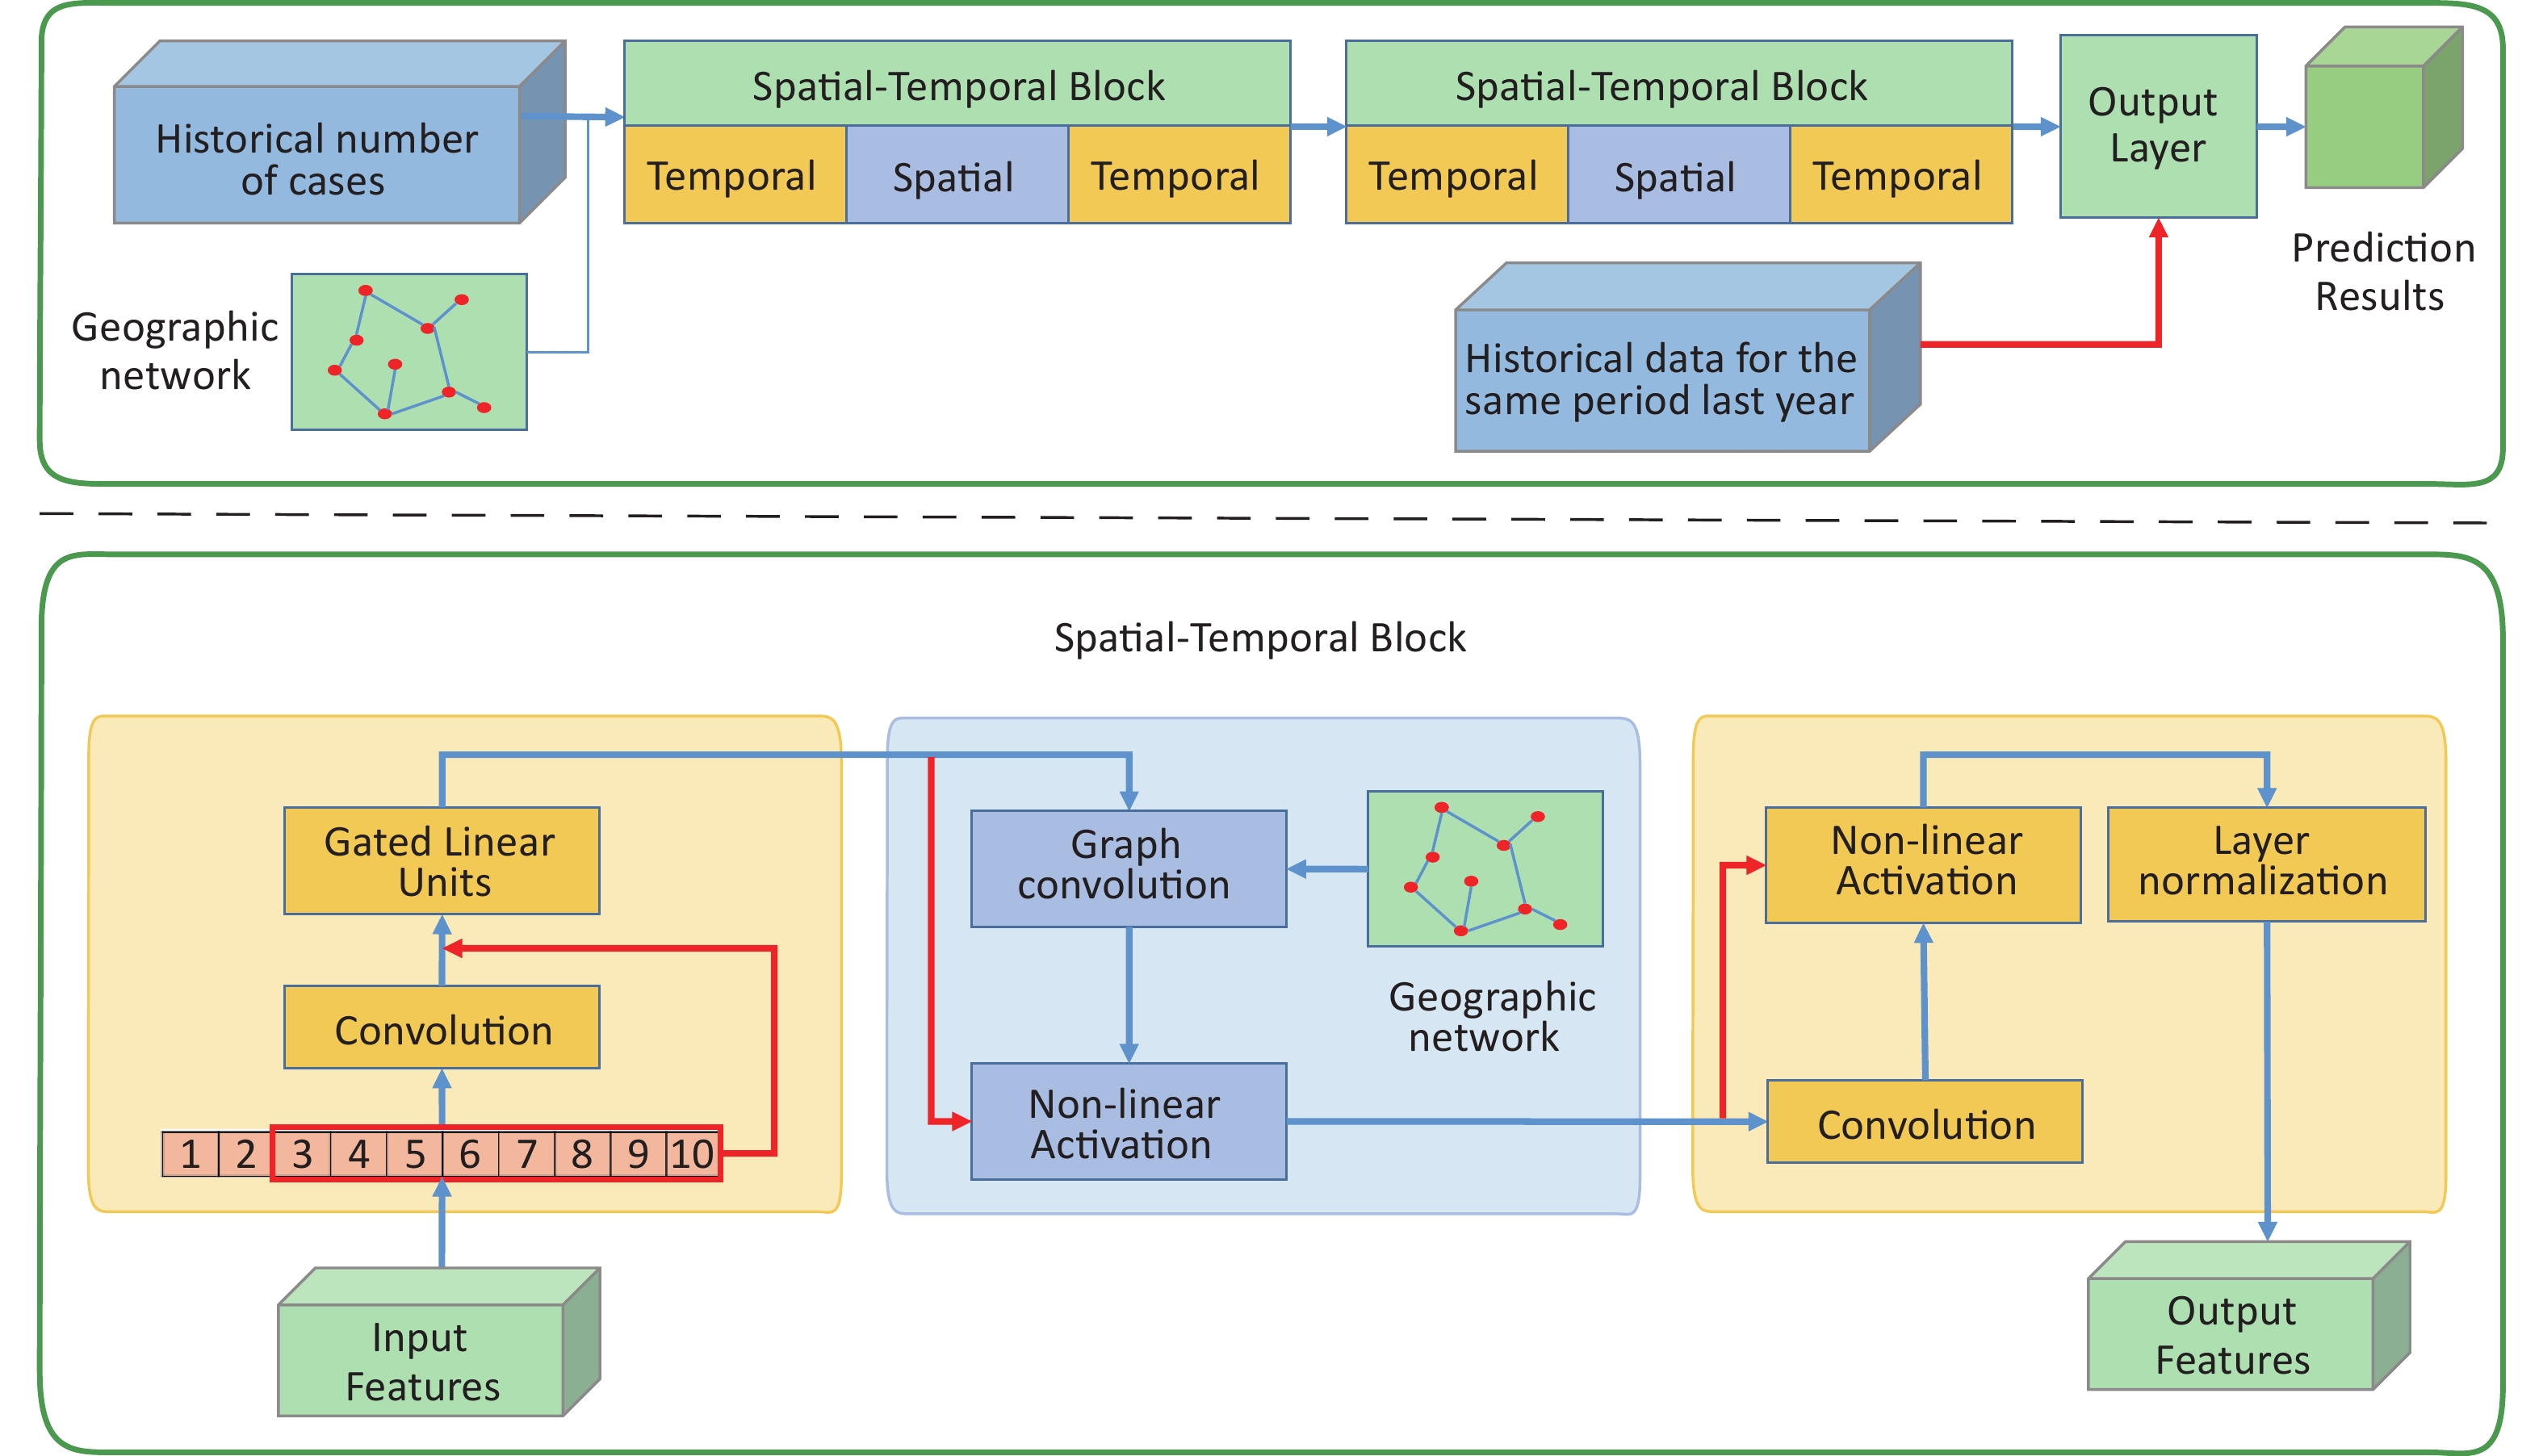
As shown in Figure 1, the STGCN model mainly consists of three components: two temporal convolution layers and one spatial convolution layer. The two spatiotemporal convolution block components have the same structure and a fully connected layer component was used as the output layer. The internal layout of each spatiotemporal convolution component was a sandwich structure. First, the feature information in the time dimension was obtained through the temporal convolution layer (annual incidence data), and then the feature information in the space was mixed through the spatial convolution layer (incidence in various cities extracted by graph convolution operation). After that, high-dimensional information was obtained by feature extraction in the time dimension. At the output layer, we took the incidence data of the same period last year as one of the reference factors for the prediction results. Details about the specific parameter settings and principles are provided in the Supplementary Materials (Supplementary Text S1.2), available in www.besjournal.com.
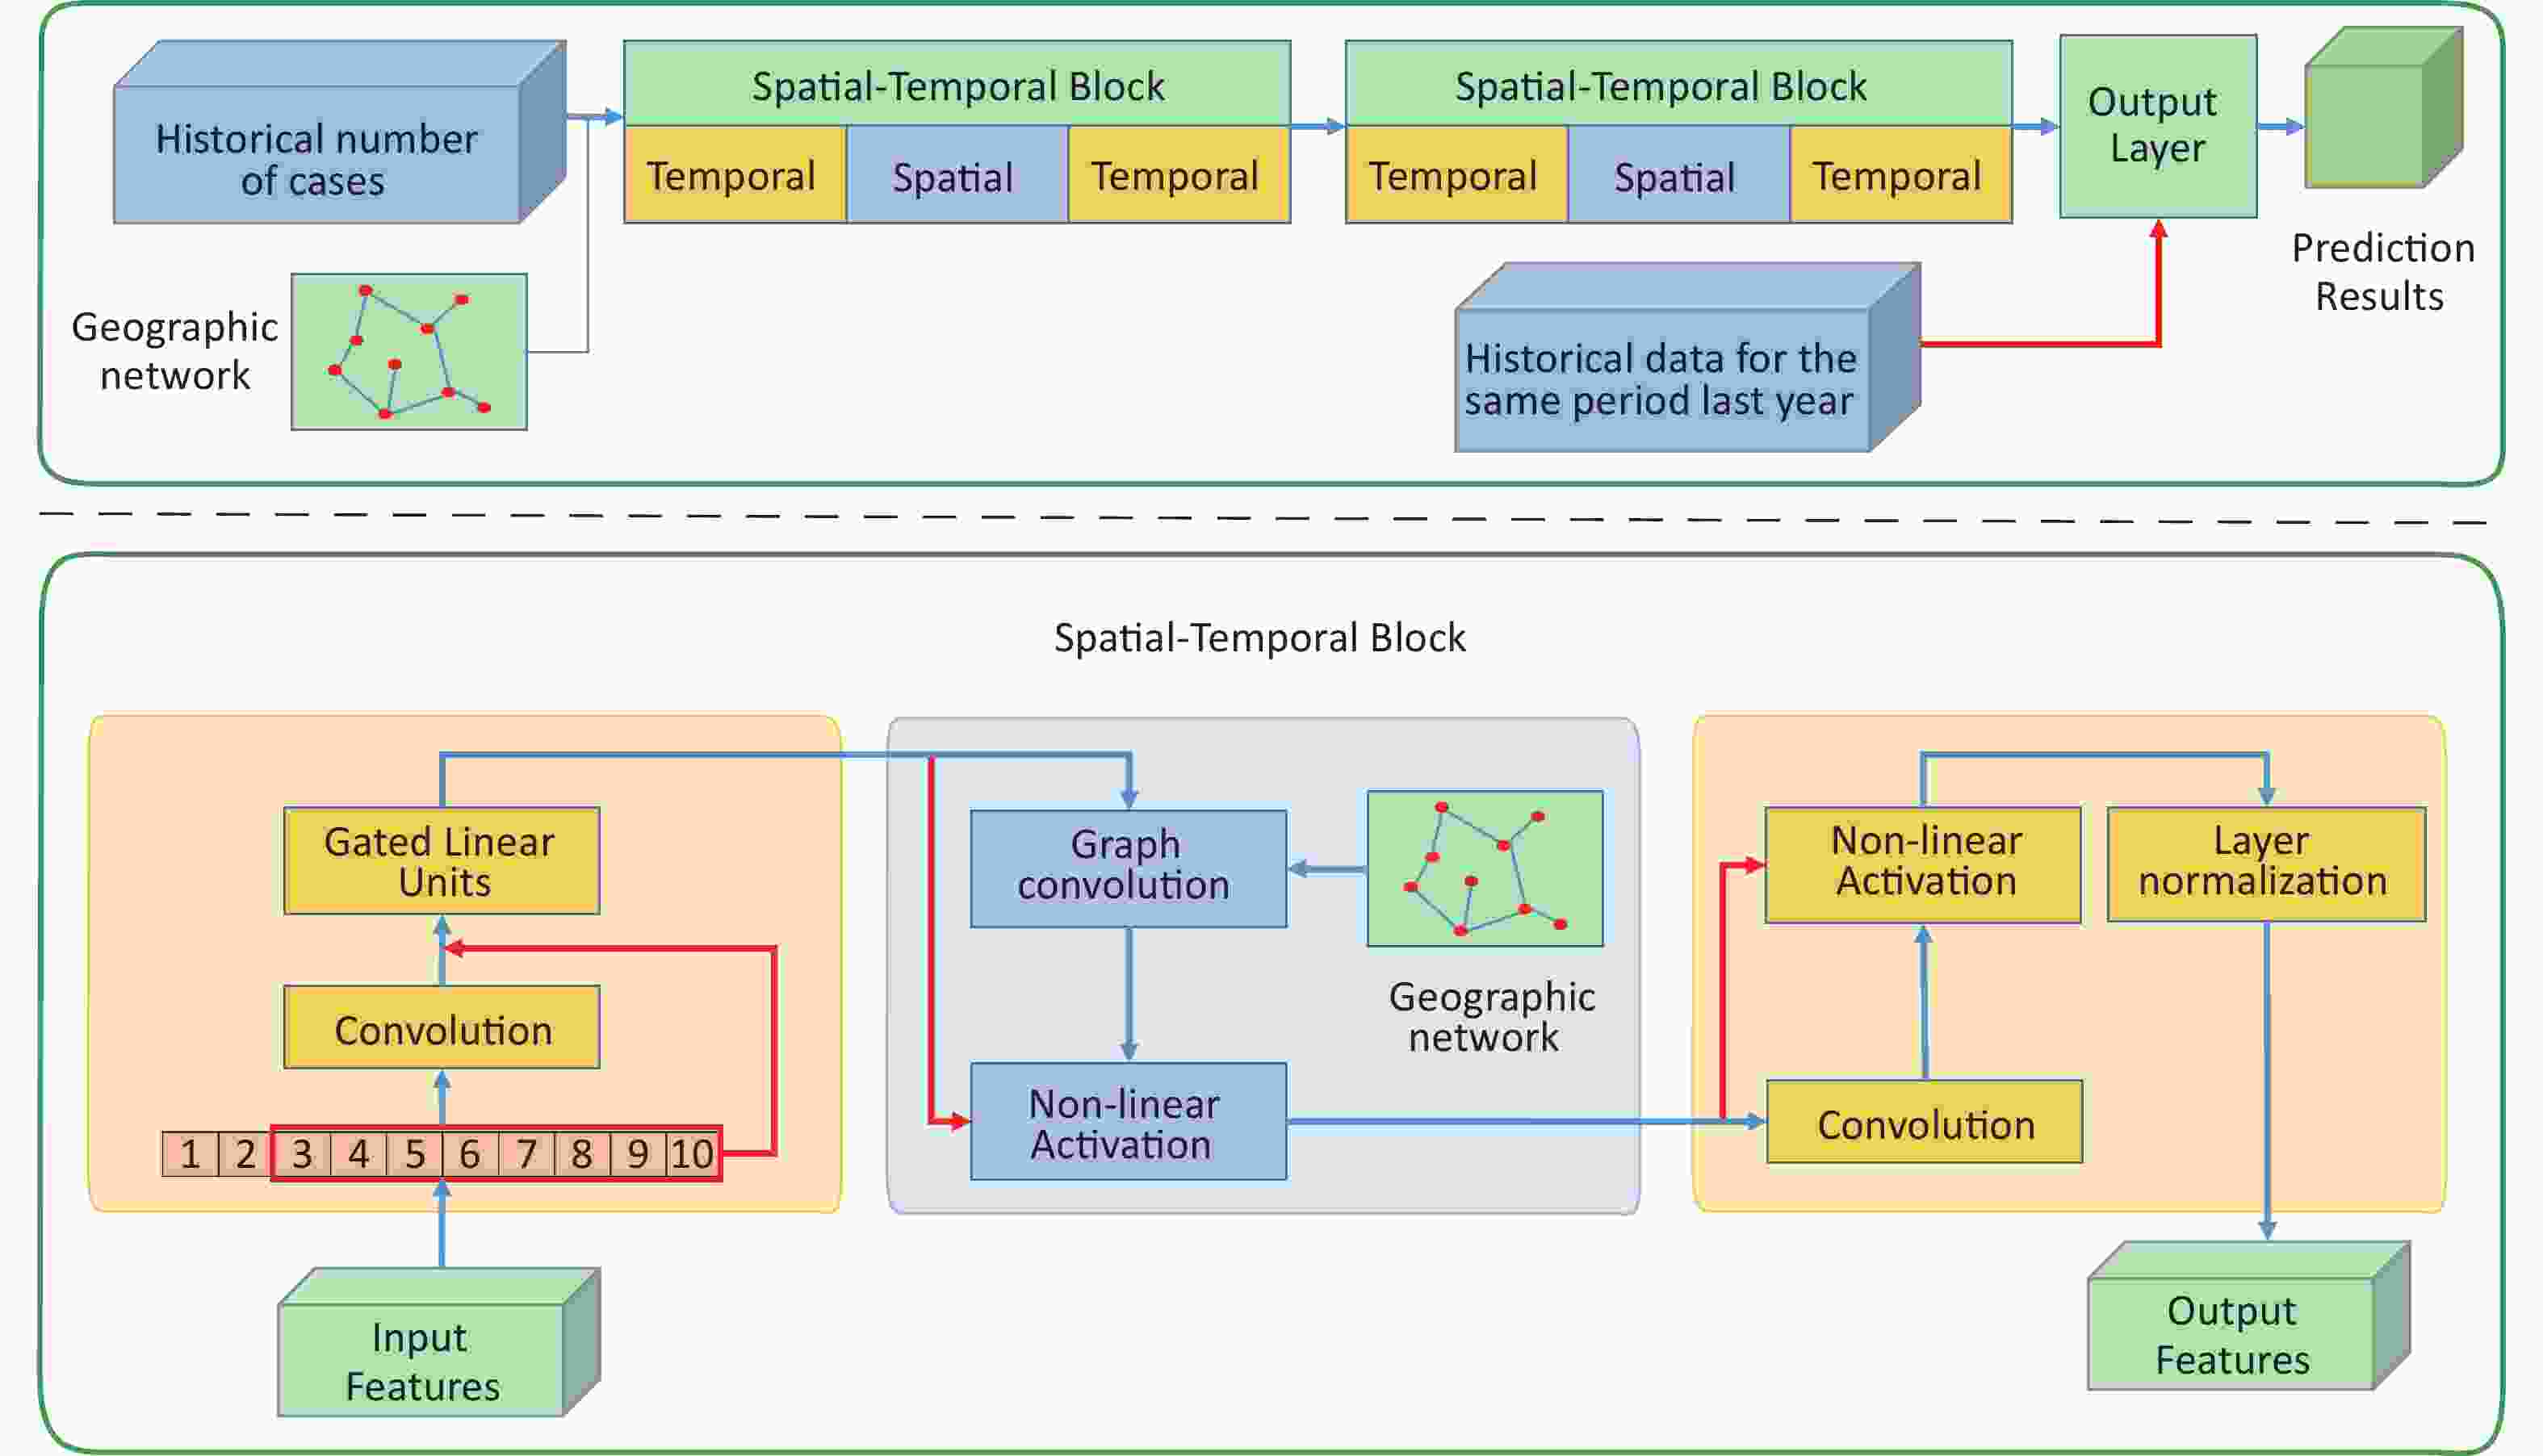
Figure 1. Overview of the proposed STGCN model.
Province H 4 weeks 8 weeks 12 weeks MAE RMSE MAE RMSE MAE RMSE SD 12 57.47 96.41 50.71 83.95 41.09 68.81 24 35.49 62.17 35.46 62.18 36.08 62.19 36 41.60 75.89 44.98 79.99 45.78 74.17 GD 12 249.81 460.71 254.86 496.17 240.10 471.97 24 215.51 449.10 210.66 413.80 200.35 387.81 36 210.21 408.58 248.48 482.16 233.58 438.41 Table S1. The evaluation parameter with influence of historical data length
To build a more stable and accurate model, six important parameters were selected and verified in this model, including the forecast time (predicting 4 weeks, 8 weeks or 12 weeks in advance), historical data length (historically reported cases in one city, H = 4 weeks, 8 weeks or 12 weeks), data channel size (used to determine the convolution kernels in each convolution layer), time convolution kernel size (used to determine the size of the receptive field in each extraction process in the temporal dimension, kt = 3 or 5), neighborhood number (the fusion range of spatial information around one city, ks) and the inclusion or exclusion of graph convolution. The deviation was displayed by the root mean square error (RMSE) and the mean absolute error (MAE). Moreover, the consistency between the true value and the predicted value was verified by R2.
-
The deviation between the observed value and the true value was displayed by the RMSE and MAE, and the detailed results of parameter comparisons are provided in the Supplementary Tables S1–S4 and Supplementary Figure S7, available in www.besjournal.com.
Convolution
kernel sizeForecast
weeksShandong Guangdong With
spatialWithout
spatialWith
spatialWithout
spatialkt = 3 4 MAE 35.49 44.95 211.31 214.43 RMSE 62.17 82.34 407.89 457.11 8 MAE 35.43 53.17 235.43 231.67 RMSE 62.19 101.31 459.17 462.32 12 MAE 41.48 43.96 226.98 232.07 RMSE 71.29 77.46 450.50 452.03 kt = 5 4 MAE 35.49 45.85 215.51 210.03 RMSE 62.17 66.61 449.10 436.94 8 MAE 35.46 43.69 210.66 246.84 RMSE 62.18 65.36 413.80 495.93 12 MAE 36.08 45.77 200.35 225.48 RMSE 62.19 66.56 387.81 427.83 Table S4. The influence of graph convolution module in Shandong and Guangdong
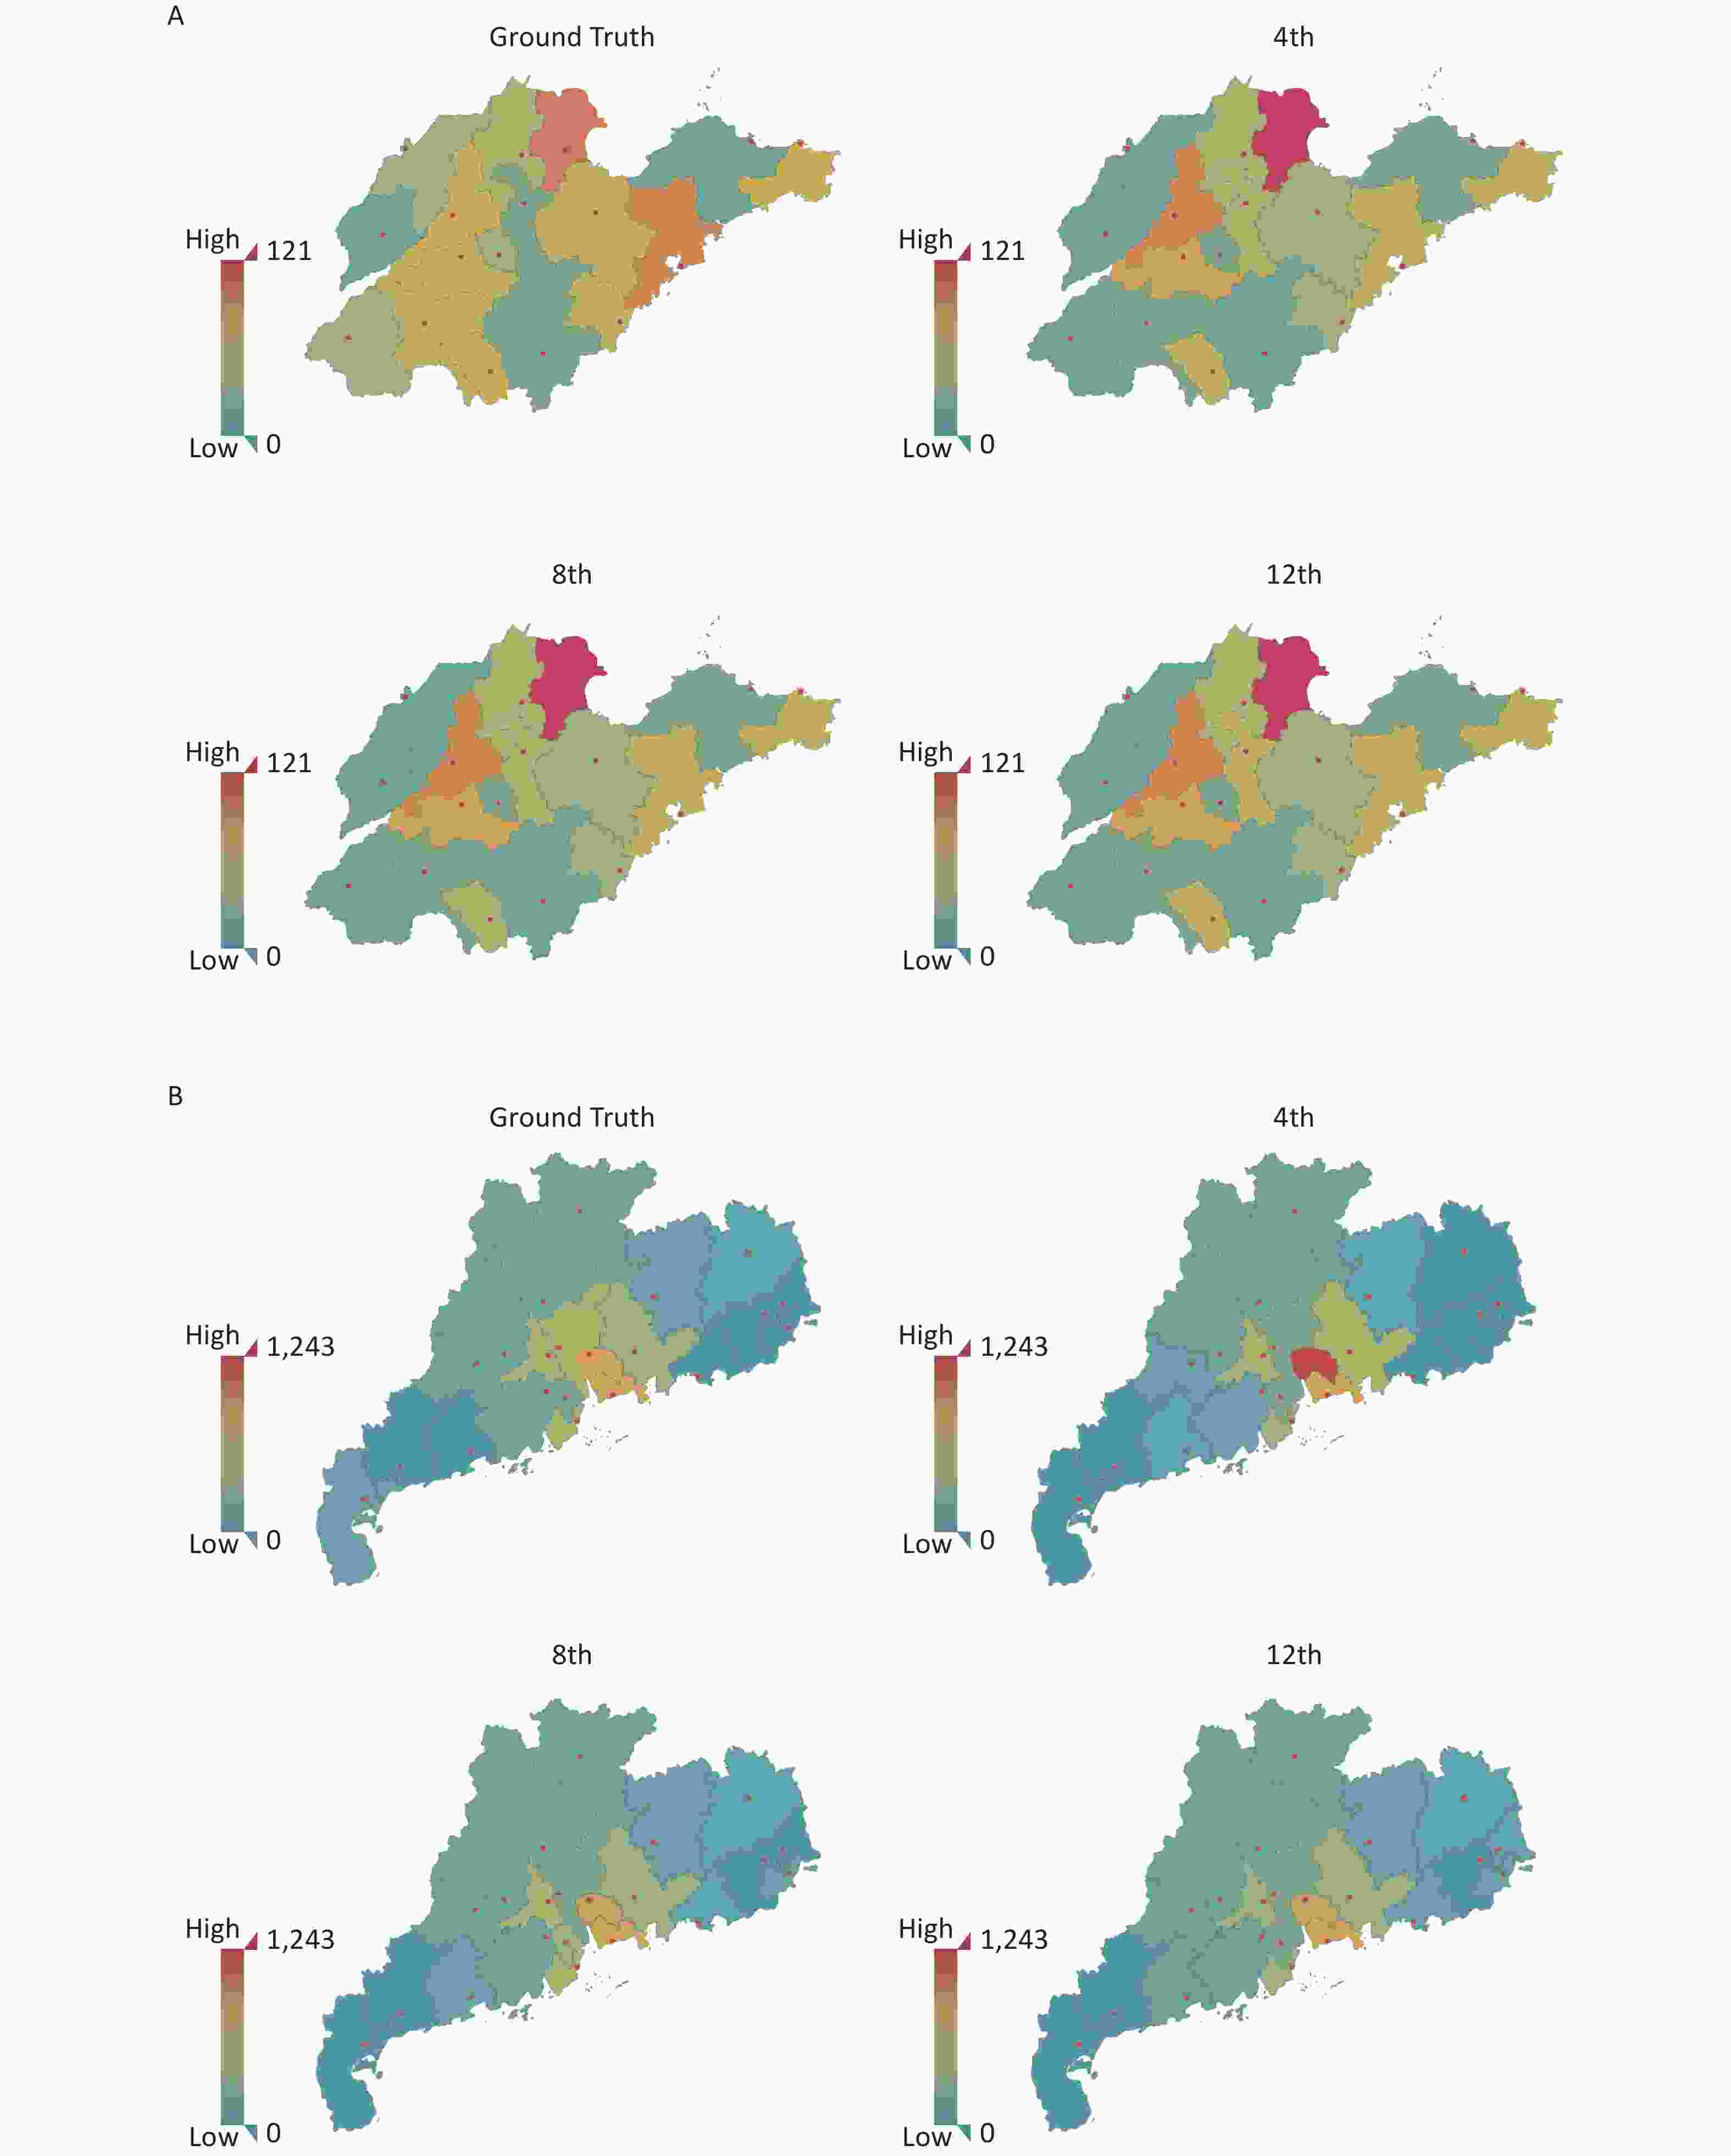
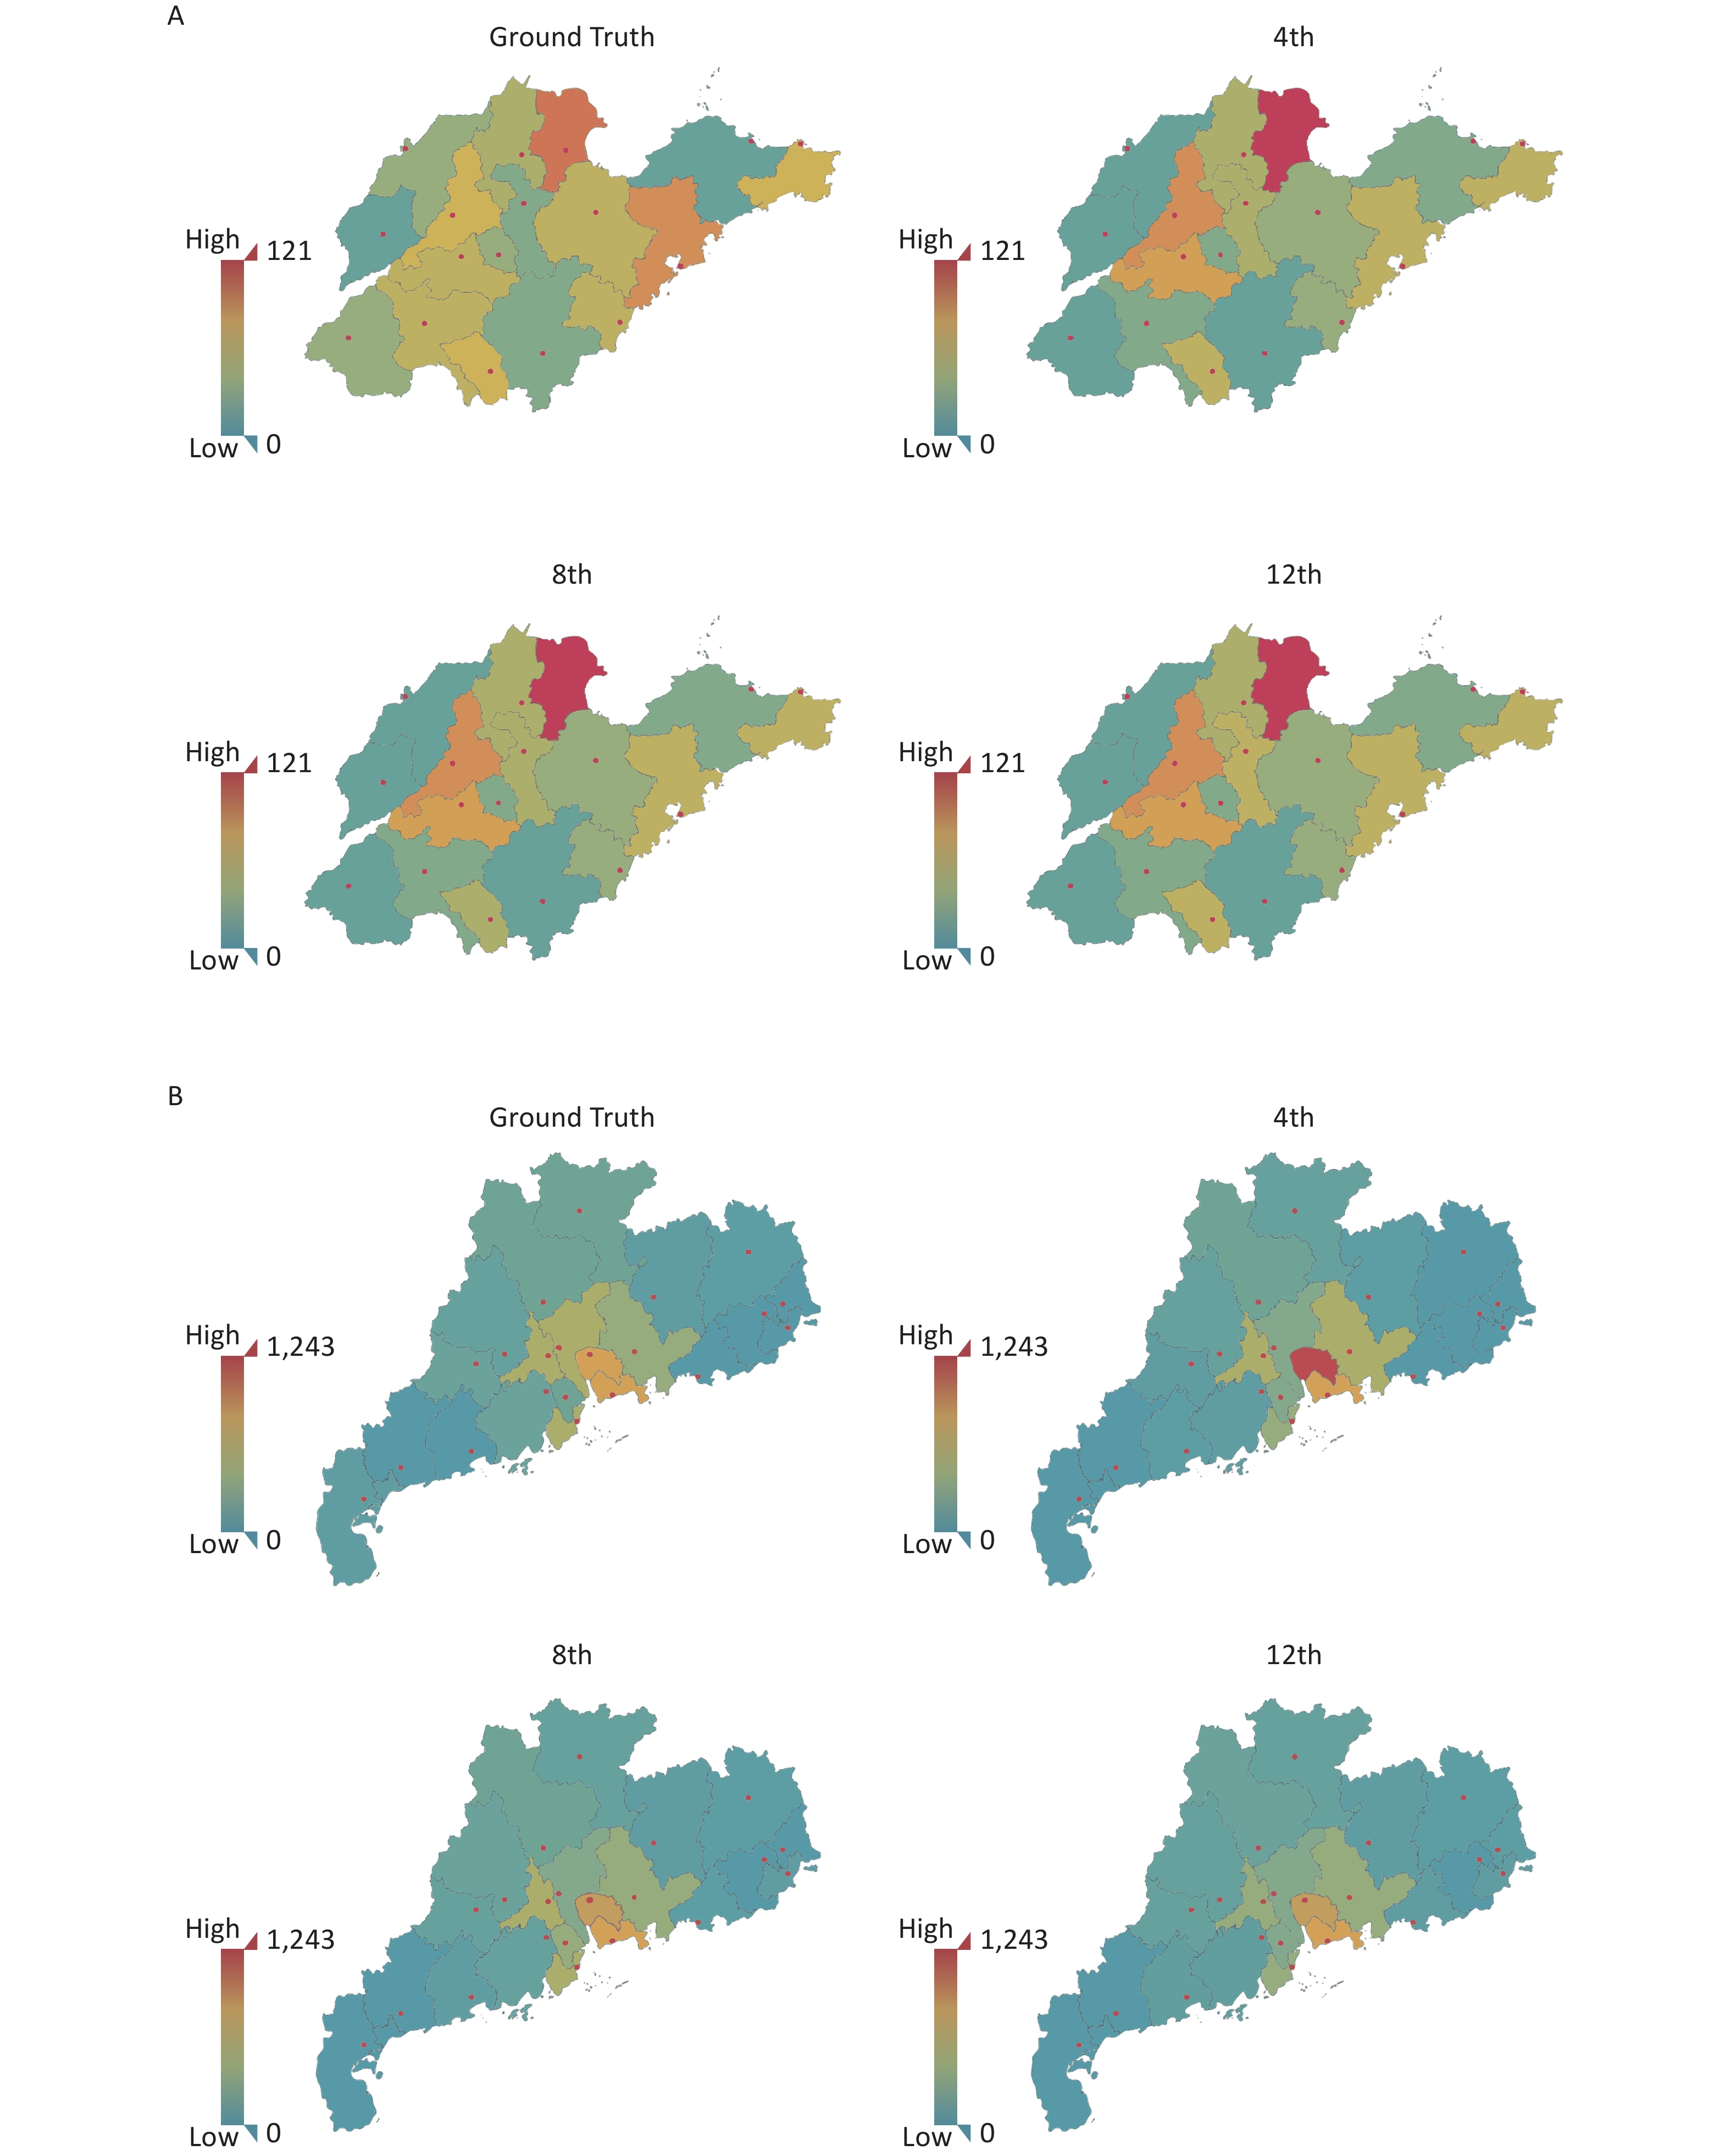
Figure S7. The Geospatial map under different forecast lengths. (A) Geospatial map of Shandong Province on 29th week with the predicted length on 4 weeks, 8 weeks, and 12 weeks. (B) Geospatial map of Guangdong Province on 25th week with the predicted length on 4 weeks, 8 weeks, and 12 weeks.
As the main epidemiological data for Shandong showed relative singleness, the optimum prediction model could achieve 12 weeks of early warning based on the following parameters: 24 weeks of historical data length (H = 24), channel size of (1, 4, 8), time convolution kernel size of 5 (kt = 5) and neighborhood number of 4 (ks = 4) with graph convolution.
However, Guangdong showed more complex epidemiological data, and the demographic data among cities showed great disparity. Therefore, the result of the prediction model was different from that of Shandong, and the optimum prediction model was based on the following parameters: 24 weeks of historical data length (H = 24), channel size of (1, 3, 1), time convolution kernel size of 5 (kt = 5) and neighborhood number of 5 (ks = 5).
-
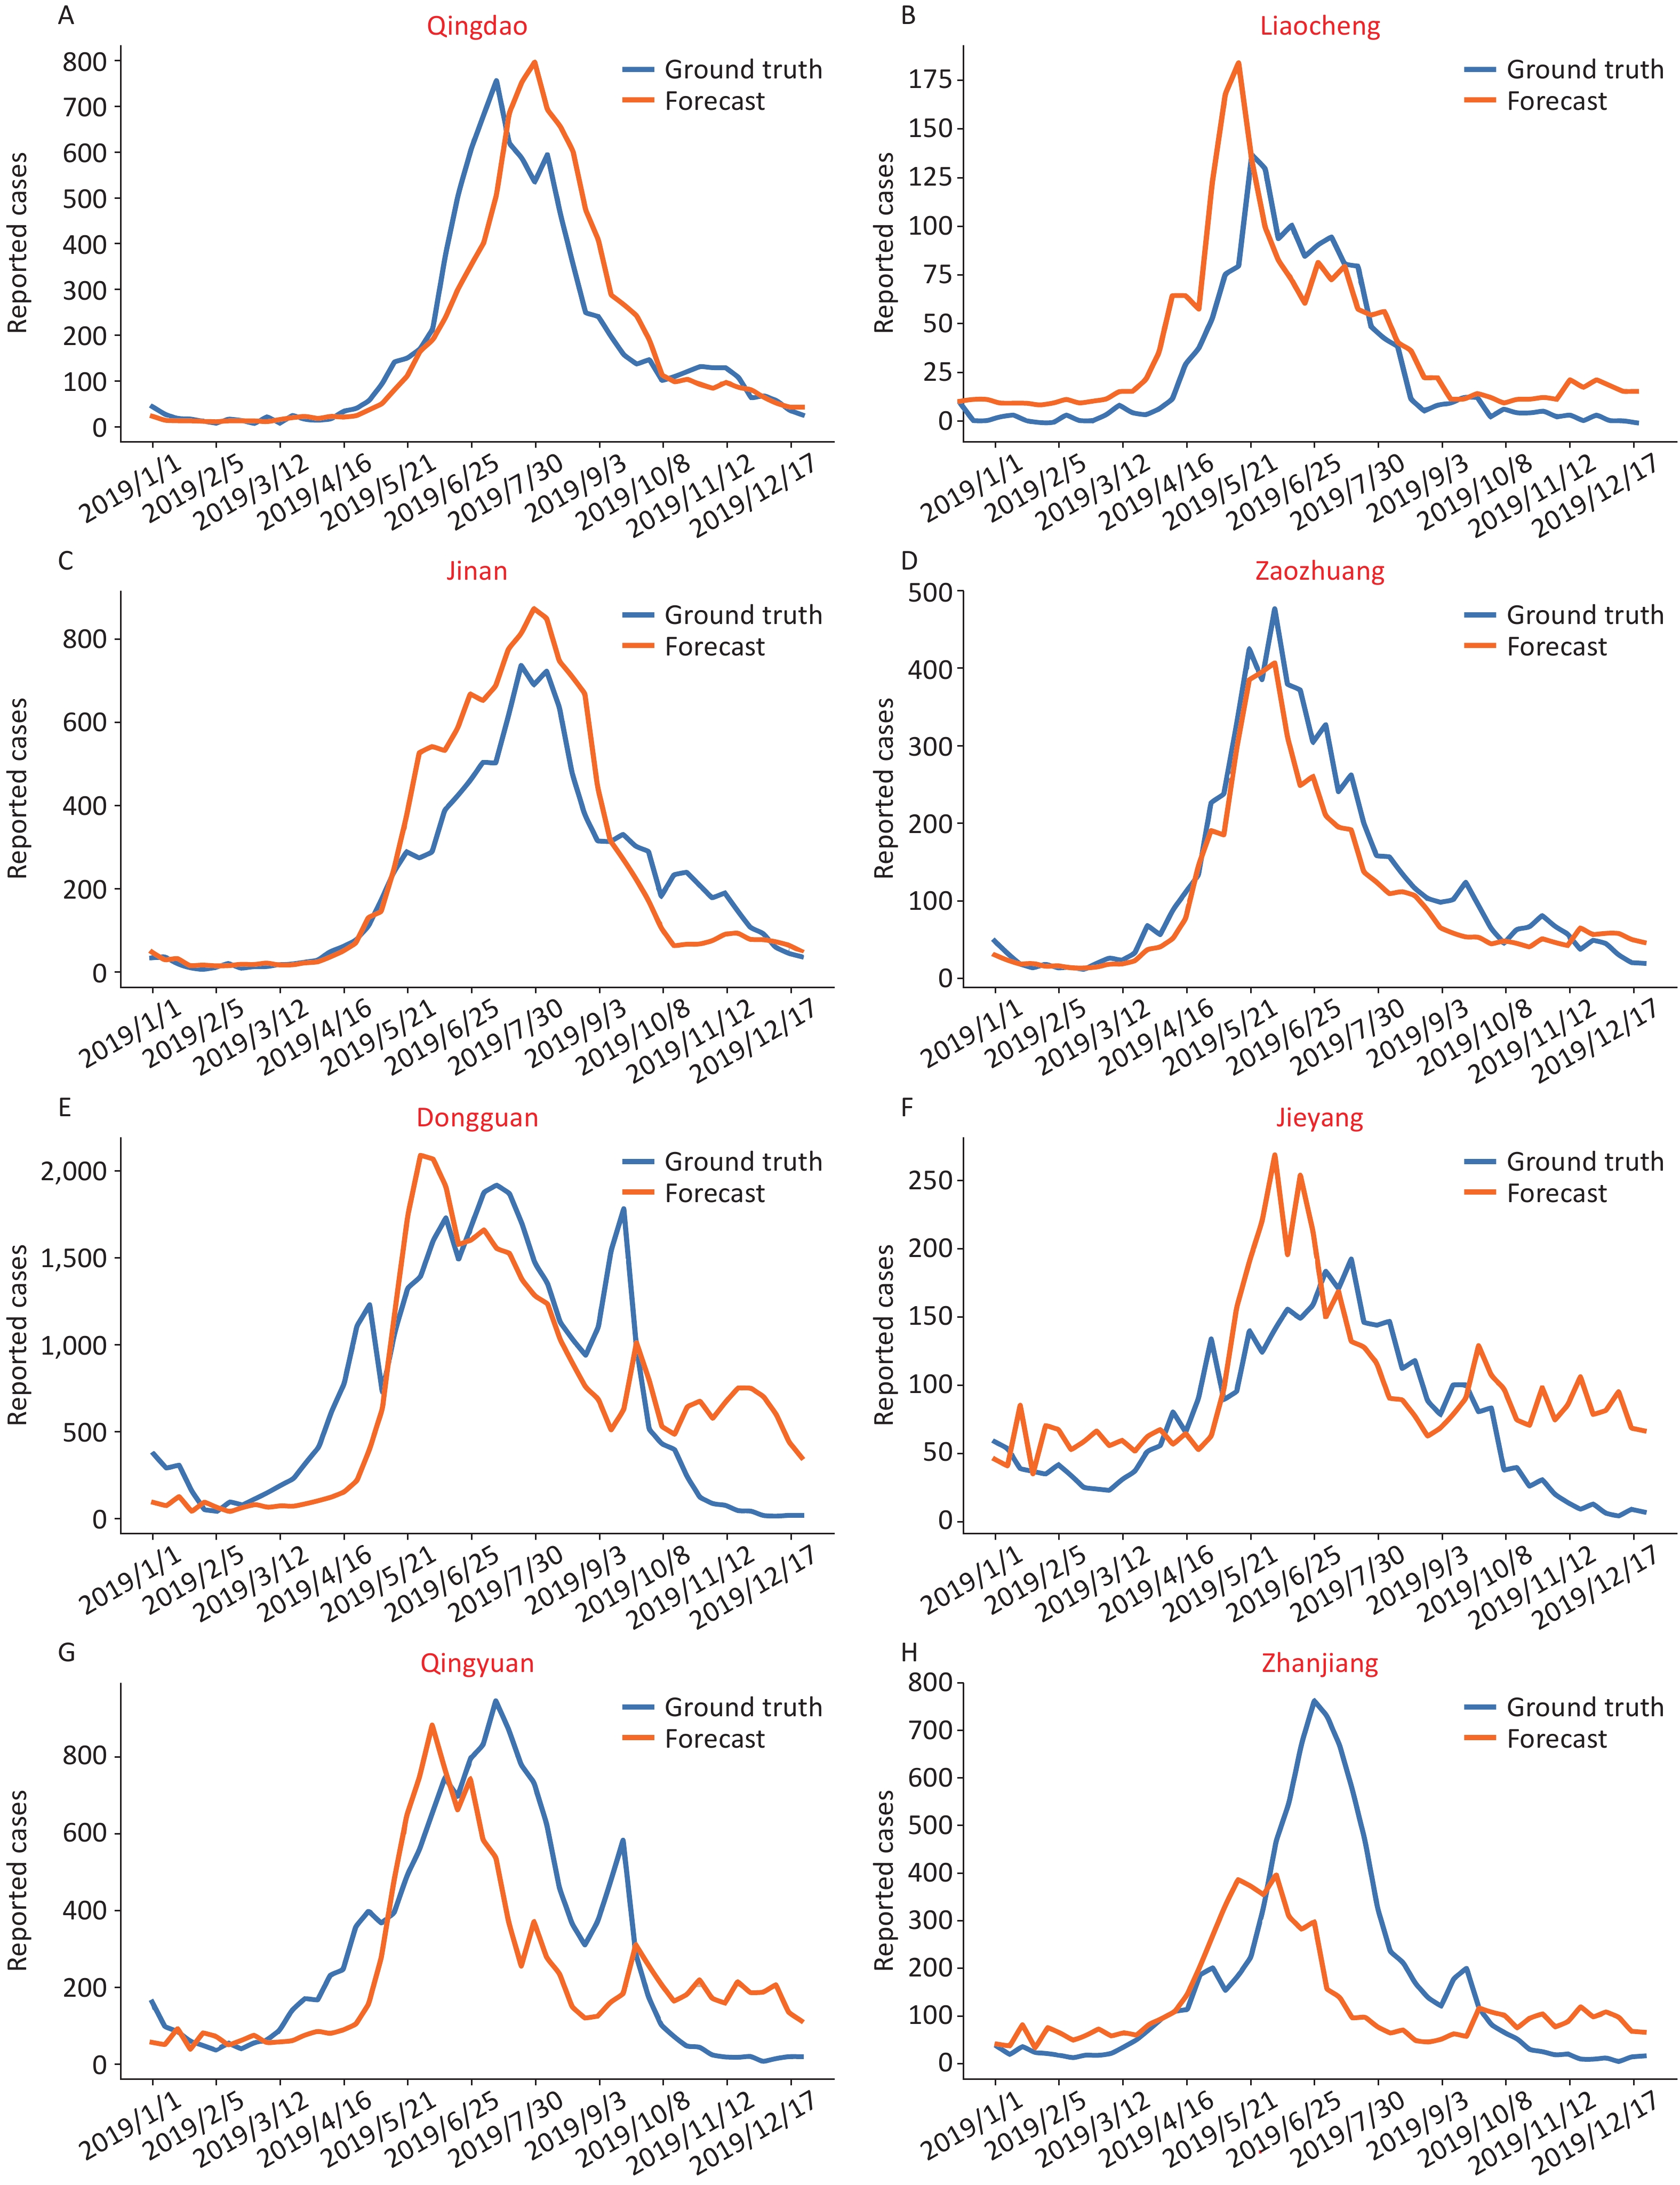
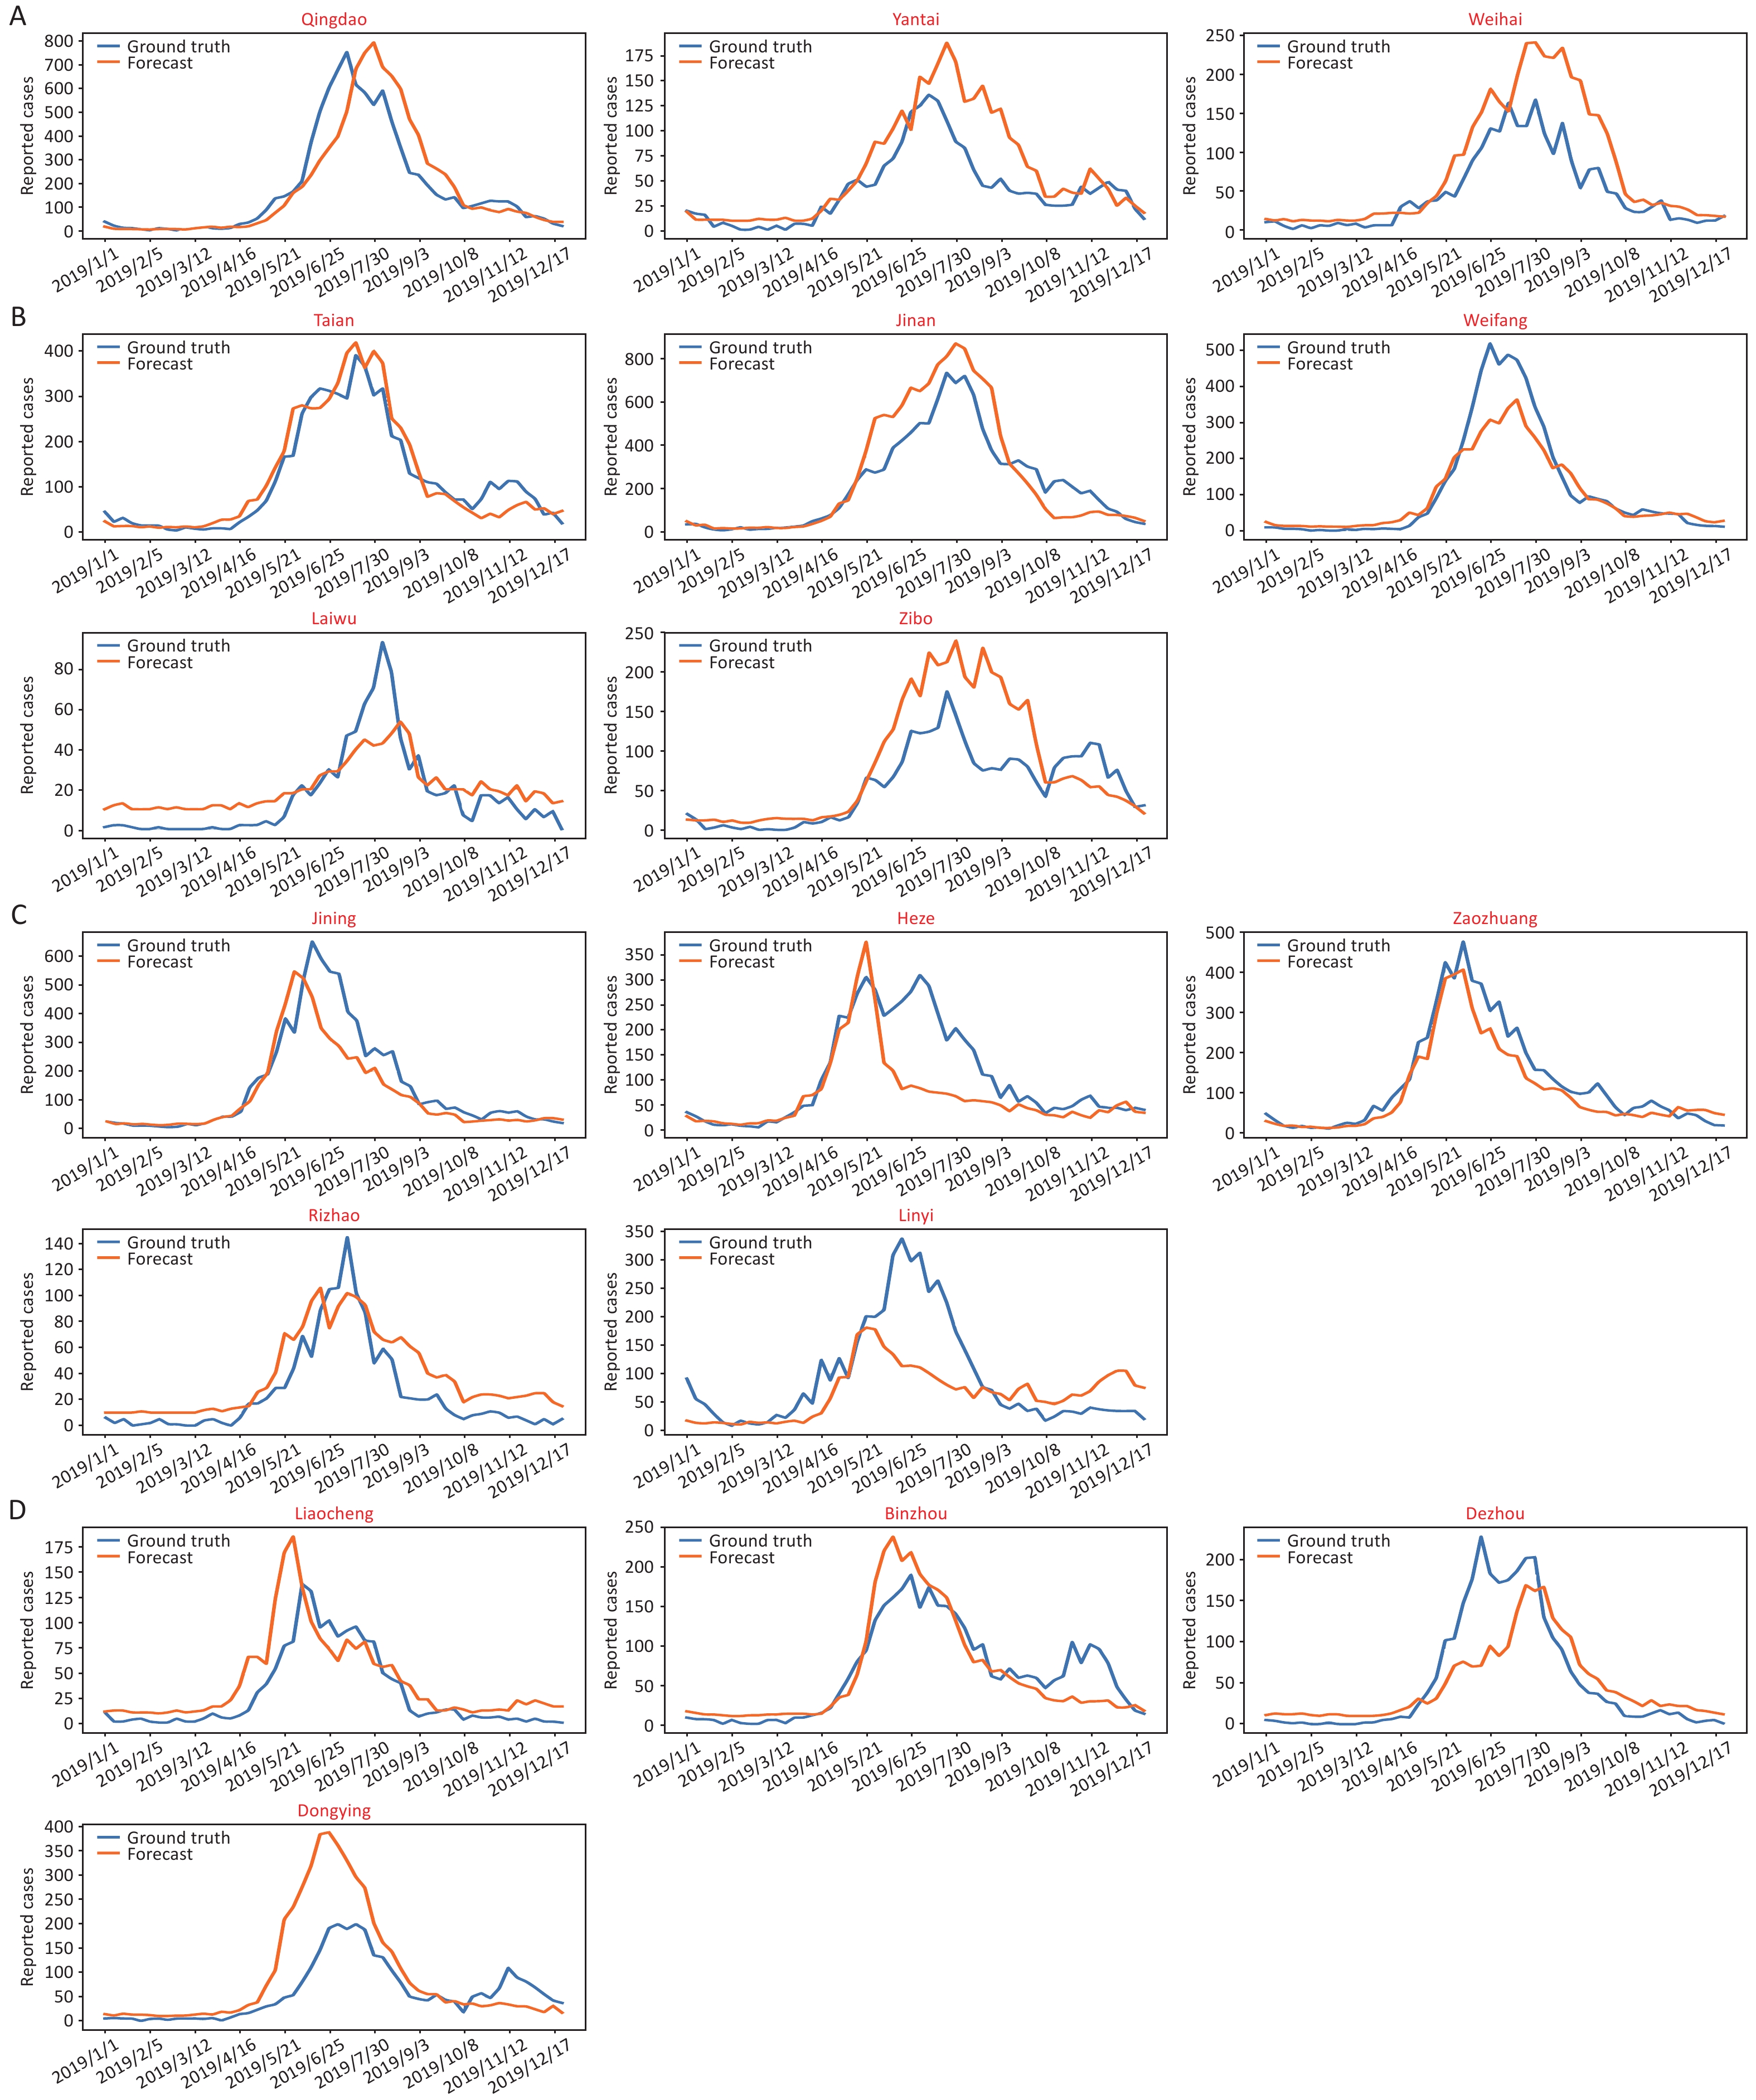
We selected the cities of Qingdao, Liaocheng, Jinan and Zaozhuang to represent east Shandong, west Shandong, south Shandong and north Shandong, respectively (Figure 2A–D and Supplementary Figure S8, available in www.besjournal.com). The blue line is the actual incidence, and the prediction data are shown in orange. The consistency between the true value and the predicted value was verified by R2, and the correlation between the average disease data from 2011–2018 and the predicted curve was also compared (Supplementary Table S5, available in www.besjournal.com).
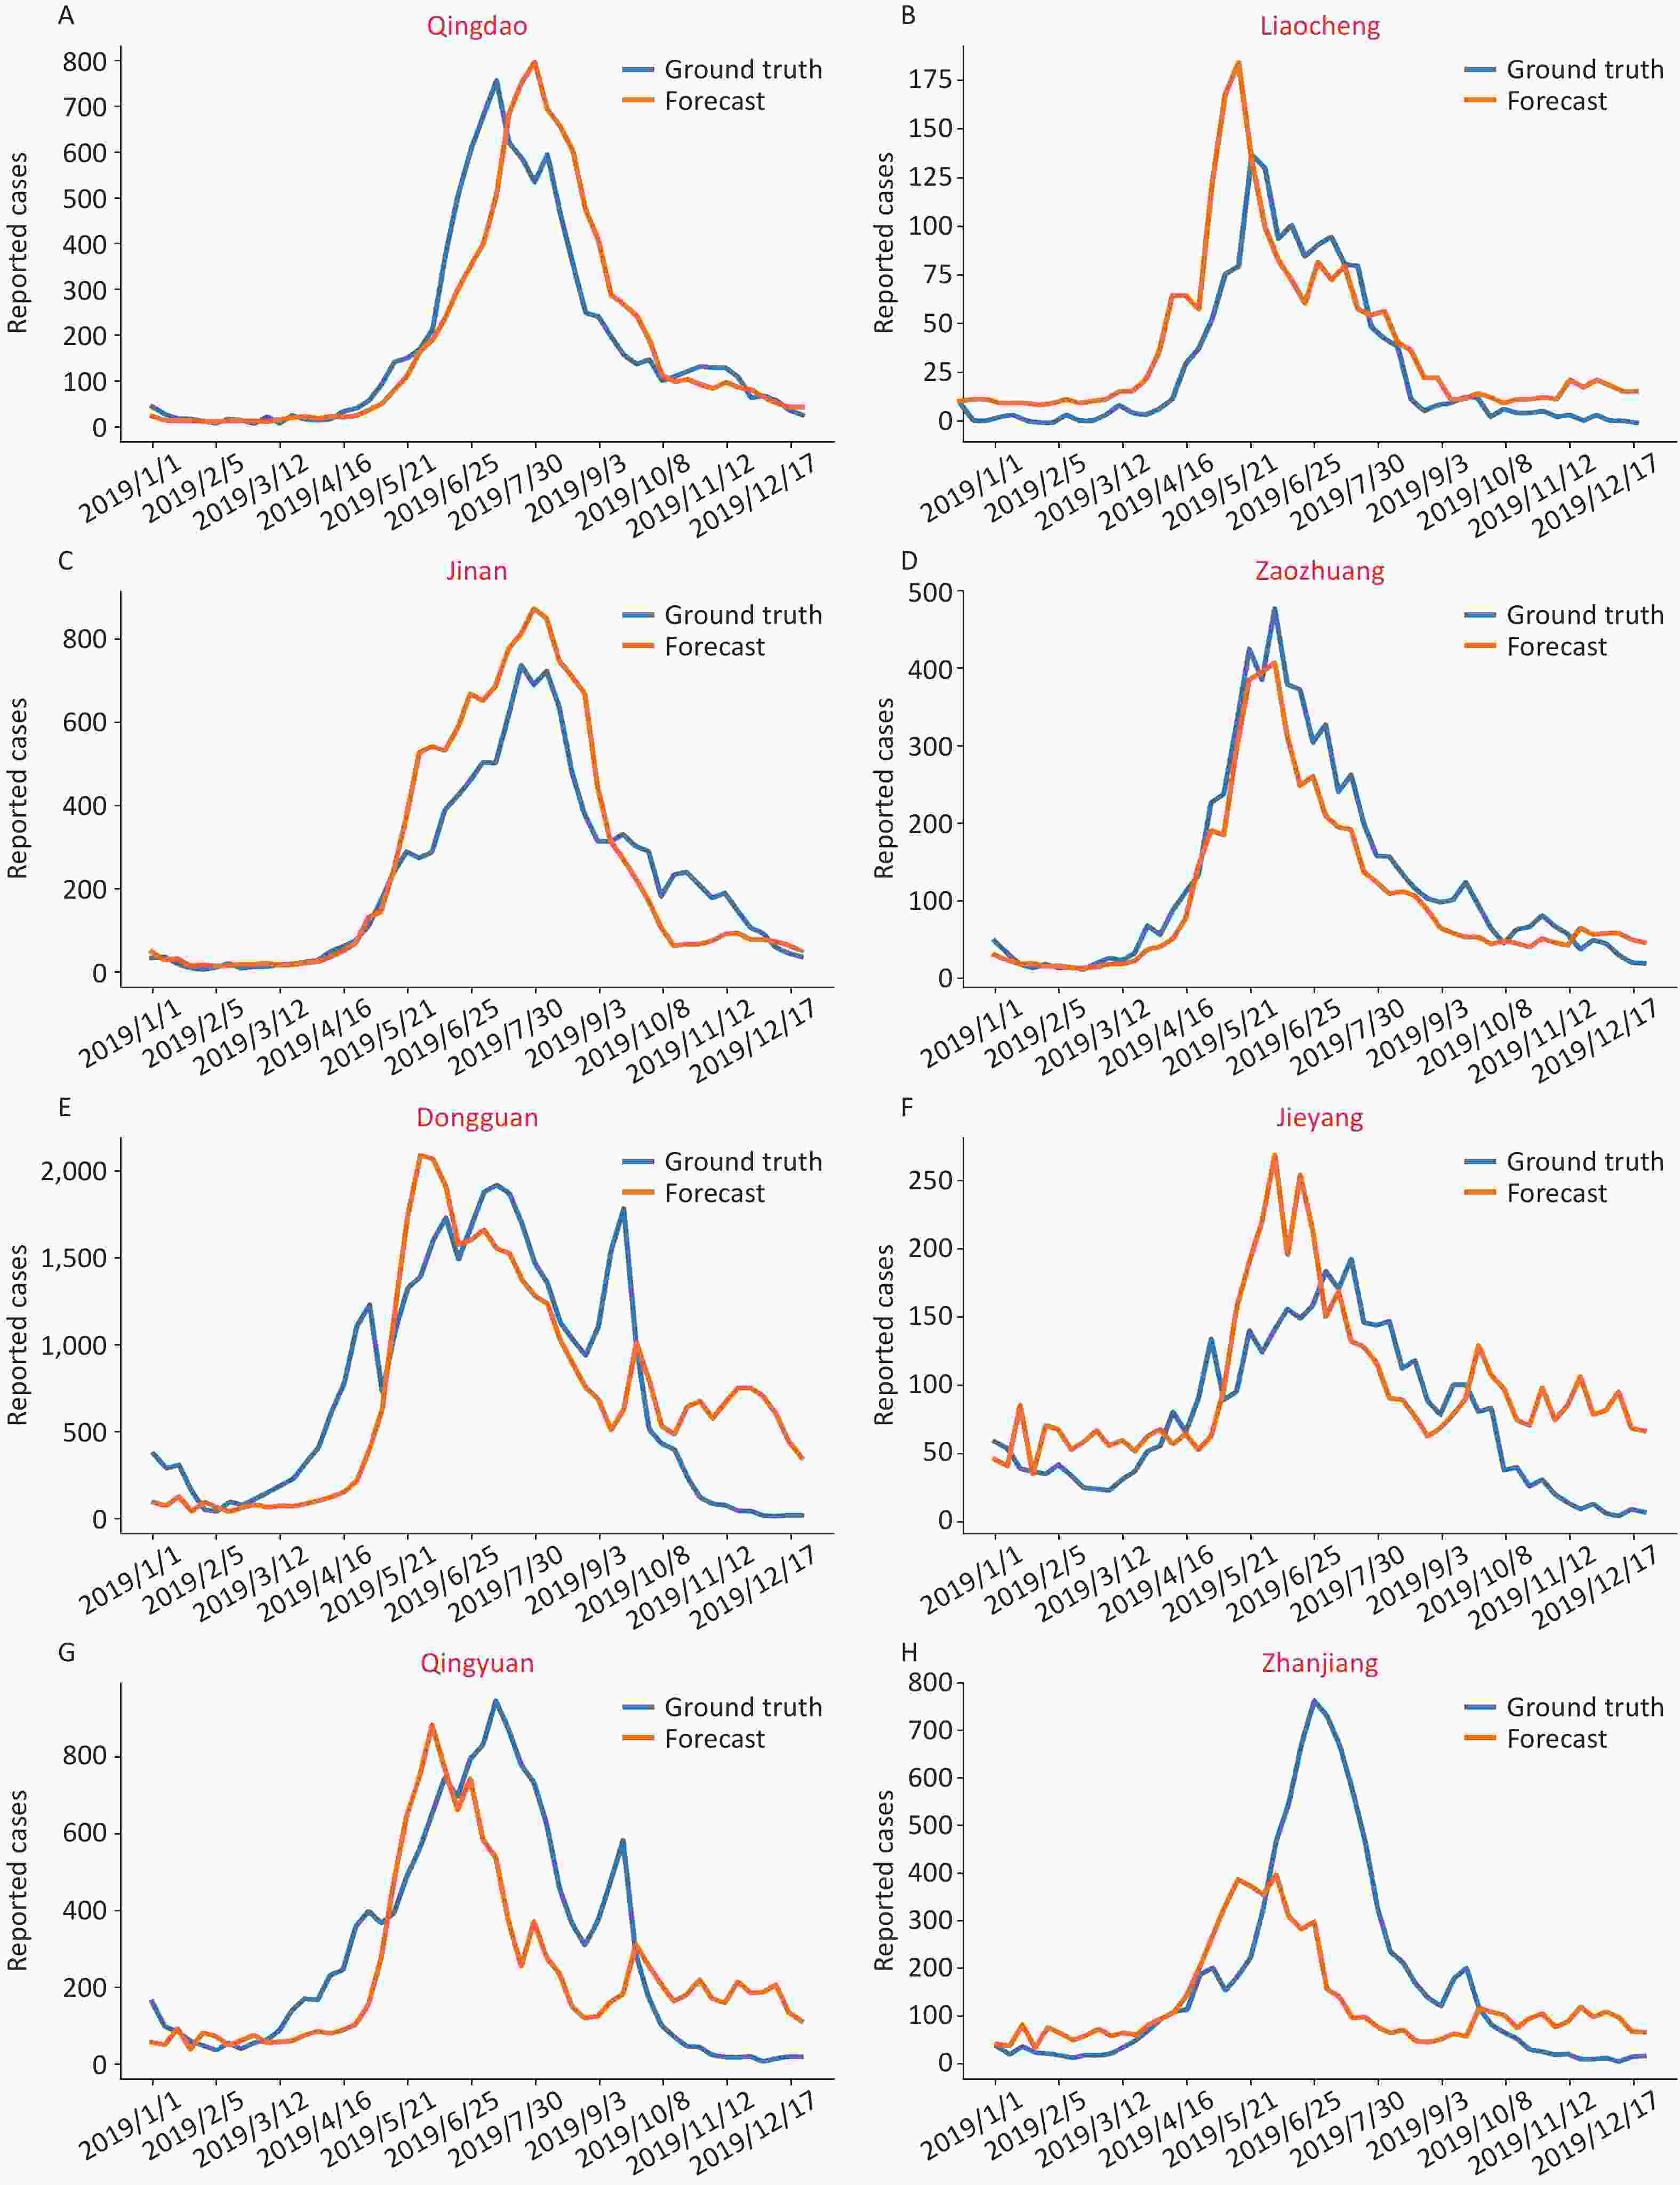
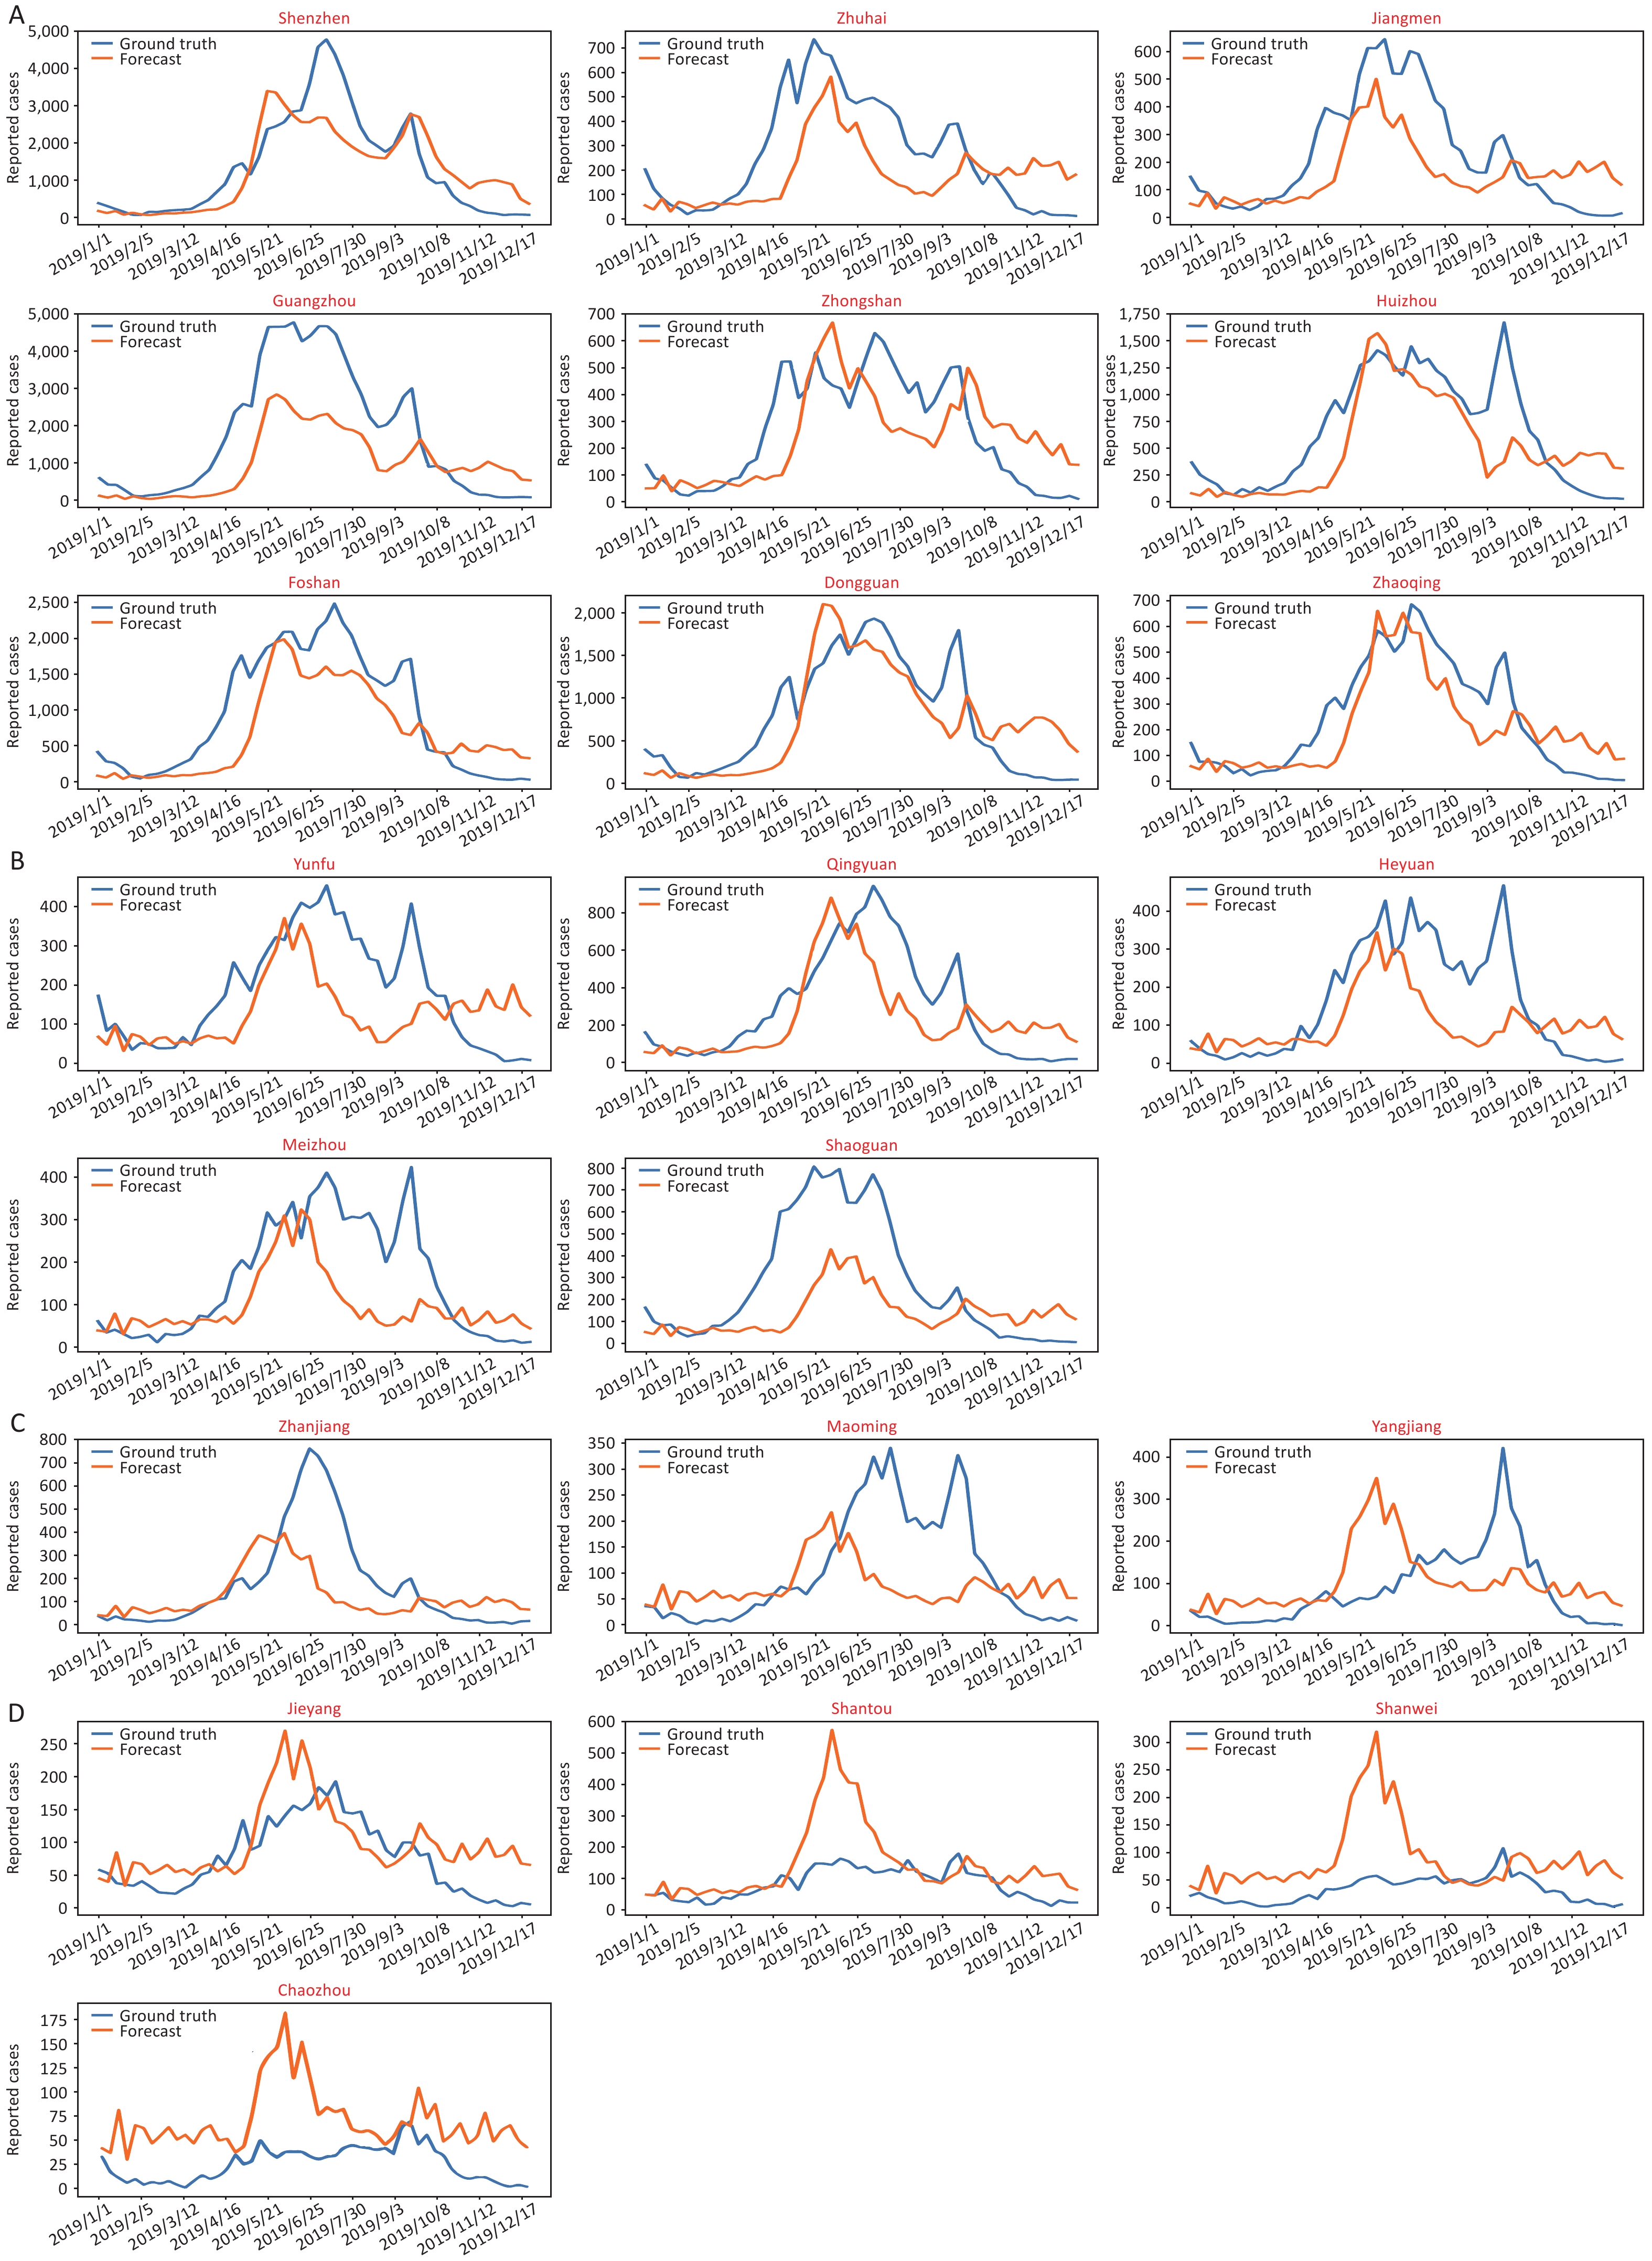
Figure 2. The predictive epidemical curves based on city level data of HFMD incidence in 2019. (A)–(D) show data from four representative cities in Shandong Province: Qingdao, Liaocheng, Jinan and Zaozhuang, respectively. (E)–(H) show data from four representative cities in Guangdong Province: Dongguan, Jieyang, Qingyuan, and Zhanjiang, respectively.
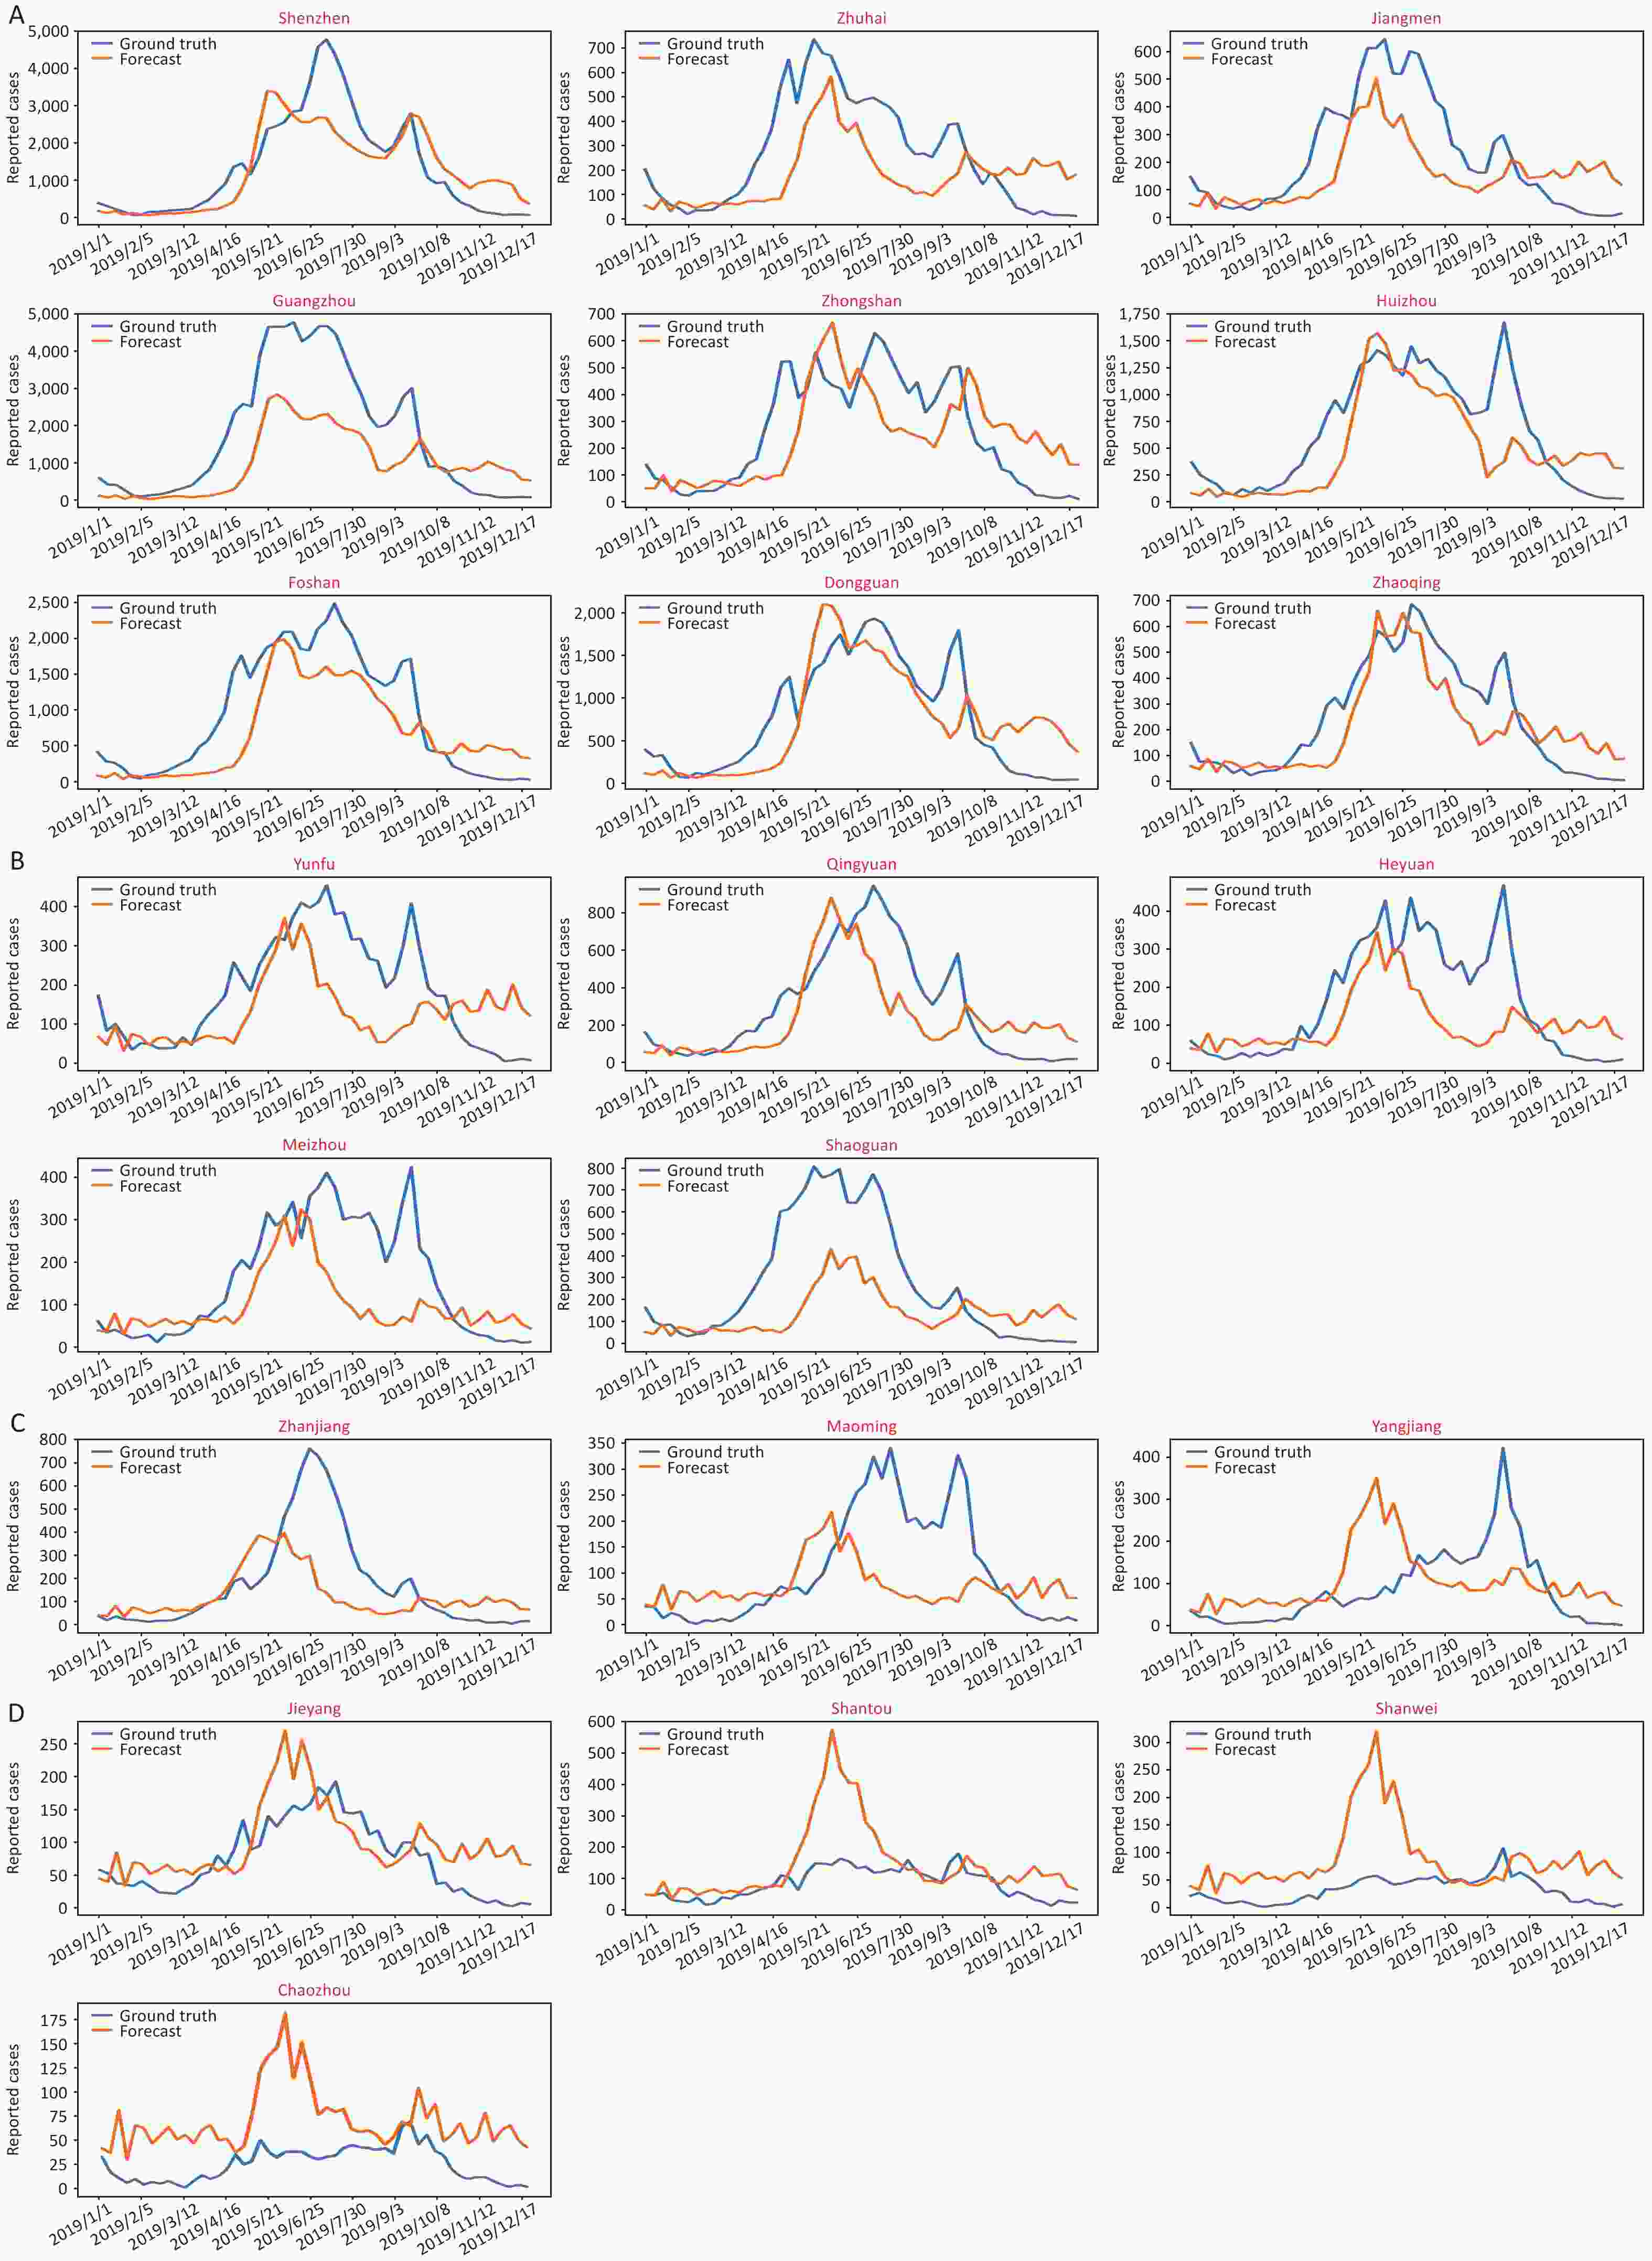
Figure S8. The predictive epidemical curves about HFMD in Guangdong province, 2019. (A) Pearl River Delta region. (B) Eastern Guangdong. (C) Western Guangdong. (D) Northern Guangdong.
City Predictive
epidemical
curveR2 Average
number of
reported
cases
(2011−2018)Average
Morbidity
(/million)
(2011−2018)City Predictive
epidemical
curveR2 Average
number of
reported cases
(2011−2018)Average
Morbidity
(/million)
(2011−2018)Laiwu 
0.03 1,266.50 9.51 Binzhou 
0.75 5,213.25 13.63 Linyi 
0.23 3,378.88 3.30 Qingdao 
0.75 9,439.25 10.50 Heze 
0.28 4,797.75 5.68 Weihai 
0.80 4465.22 13.03 Zibo 
0.52 4,158.38 9.01 Jining 
0.81 4920.22 5.97 Rizhao 
0.61 2,986.63 10.45 Jinan 
0.86 10,718.50 15.21 Dongying 
0.65 3,926.50 18.76 Tai.an 
0.91 6,152.38 11.04 Liaocheng 
0.67 3,482.50 5.86 Weifang 
0.91 5,114.75 6.79 Dezhou 
0.68 3,580.25 6.30 Zaozhuang 
0.95 4,209.75 11.02 Table S5. The goodness of fit between the predicted curve and the actual incidence curve in Shandong
For most of the cities in Shandong, the model can capture the time point of disease outbreak, and the peak height is consistent with the real situation (R2 > 0.5), which shows that the model has good prediction ability after data training. Furthermore, the best prediction was shown in cities with more than 4,000 reported cases or an incidence higher than 10/million people (R2 > 0.75, and detailed materials shown in Supplementary Table S5).
Correspondingly, we selected the cities of Dongguan, Jieyang, Qingyuan and Zhanjiang to represent the Pearl River Delta region, eastern Guangdong, northern Guangdong and western Guangdong, respectively (Figure 2E–H). In general, the prediction curve in the Pearl River Delta region matched the actual incidence curve (R2 > 0.5, Supplementary Figure S9, available in www.besjournal.com). However, the precision seemed lower in northern and western Guangdong, which showed low incidence rates and disease burden. Despite this, most prediction curves rose slightly earlier than the actual increase in incidence, which means that the model can play a role in early warning.

Figure S9. The predictive epidemical curves about HFMD in Shandong province, 2019. (A) Eastern Shandong. (B) Central Shandong. (C) Southern Shandong. (D) Northwest Shandong.
Given the more complicated incidence rate characteristics, the predictive model for Guangdong requires more disease data to train and verify the results, and the optimum prediction model was appropriate for more than 10,000 reported cases or an incidence higher than 30/million people (R2 > 0.6, and detailed materials shown in Supplementary Table S6, available in www.besjournal.com).
City Predictive
epidemical
curveR2 Average
number of
reported
cases
(2011−2018)Average
Morbidity
(/million)
(2011−2018)City Predictive
epidemical
curveR2 Average
number of
reported
cases
(2011−2018)Average
Morbidity
(/million)
(2011−2018)Yangjiang 
0.01 5402.88 17.69 Shaoguan 
0.46 6432.63 22.14 Shanwei 
0.01 2932.38 9.81 Shenzhen 
0.47 41759.13 37.67 Shantou 
0.02 7168.88 12.82 Zhuhai 
0.57 10453.00 64.52 Maoming 
0.04 5157.50 8.64 Huizhou 
0.58 20951.63 44.79 Zhanjiang 
0.04 6609.50 9.27 Qingyuan 
0.60 10853.75 34.64 Chaozhou 
0.05 2588.88 9.66 Jiangmen 
0.62 10017.25 28.21 Yunfu 
0.15 8478.38 34.90 Dongguan 
0.65 32108.13 38.71 Meizhou 
0.30 8592.13 19.88 Zhaoqing 
0.68 12463.63 30.97 Zhongshan 
0.33 6609.50 44.10 Guangzhou 
0.75 52876.38 39.84 Heyuan 
0.34 5519.38 22.11 Foshan 
0.77 32410.25 44.00 Jieyang 
0.41 4335.00 7.22 Table S6. The goodness of fit between the predicted curve and the actual incidence curve in Guangdong
-
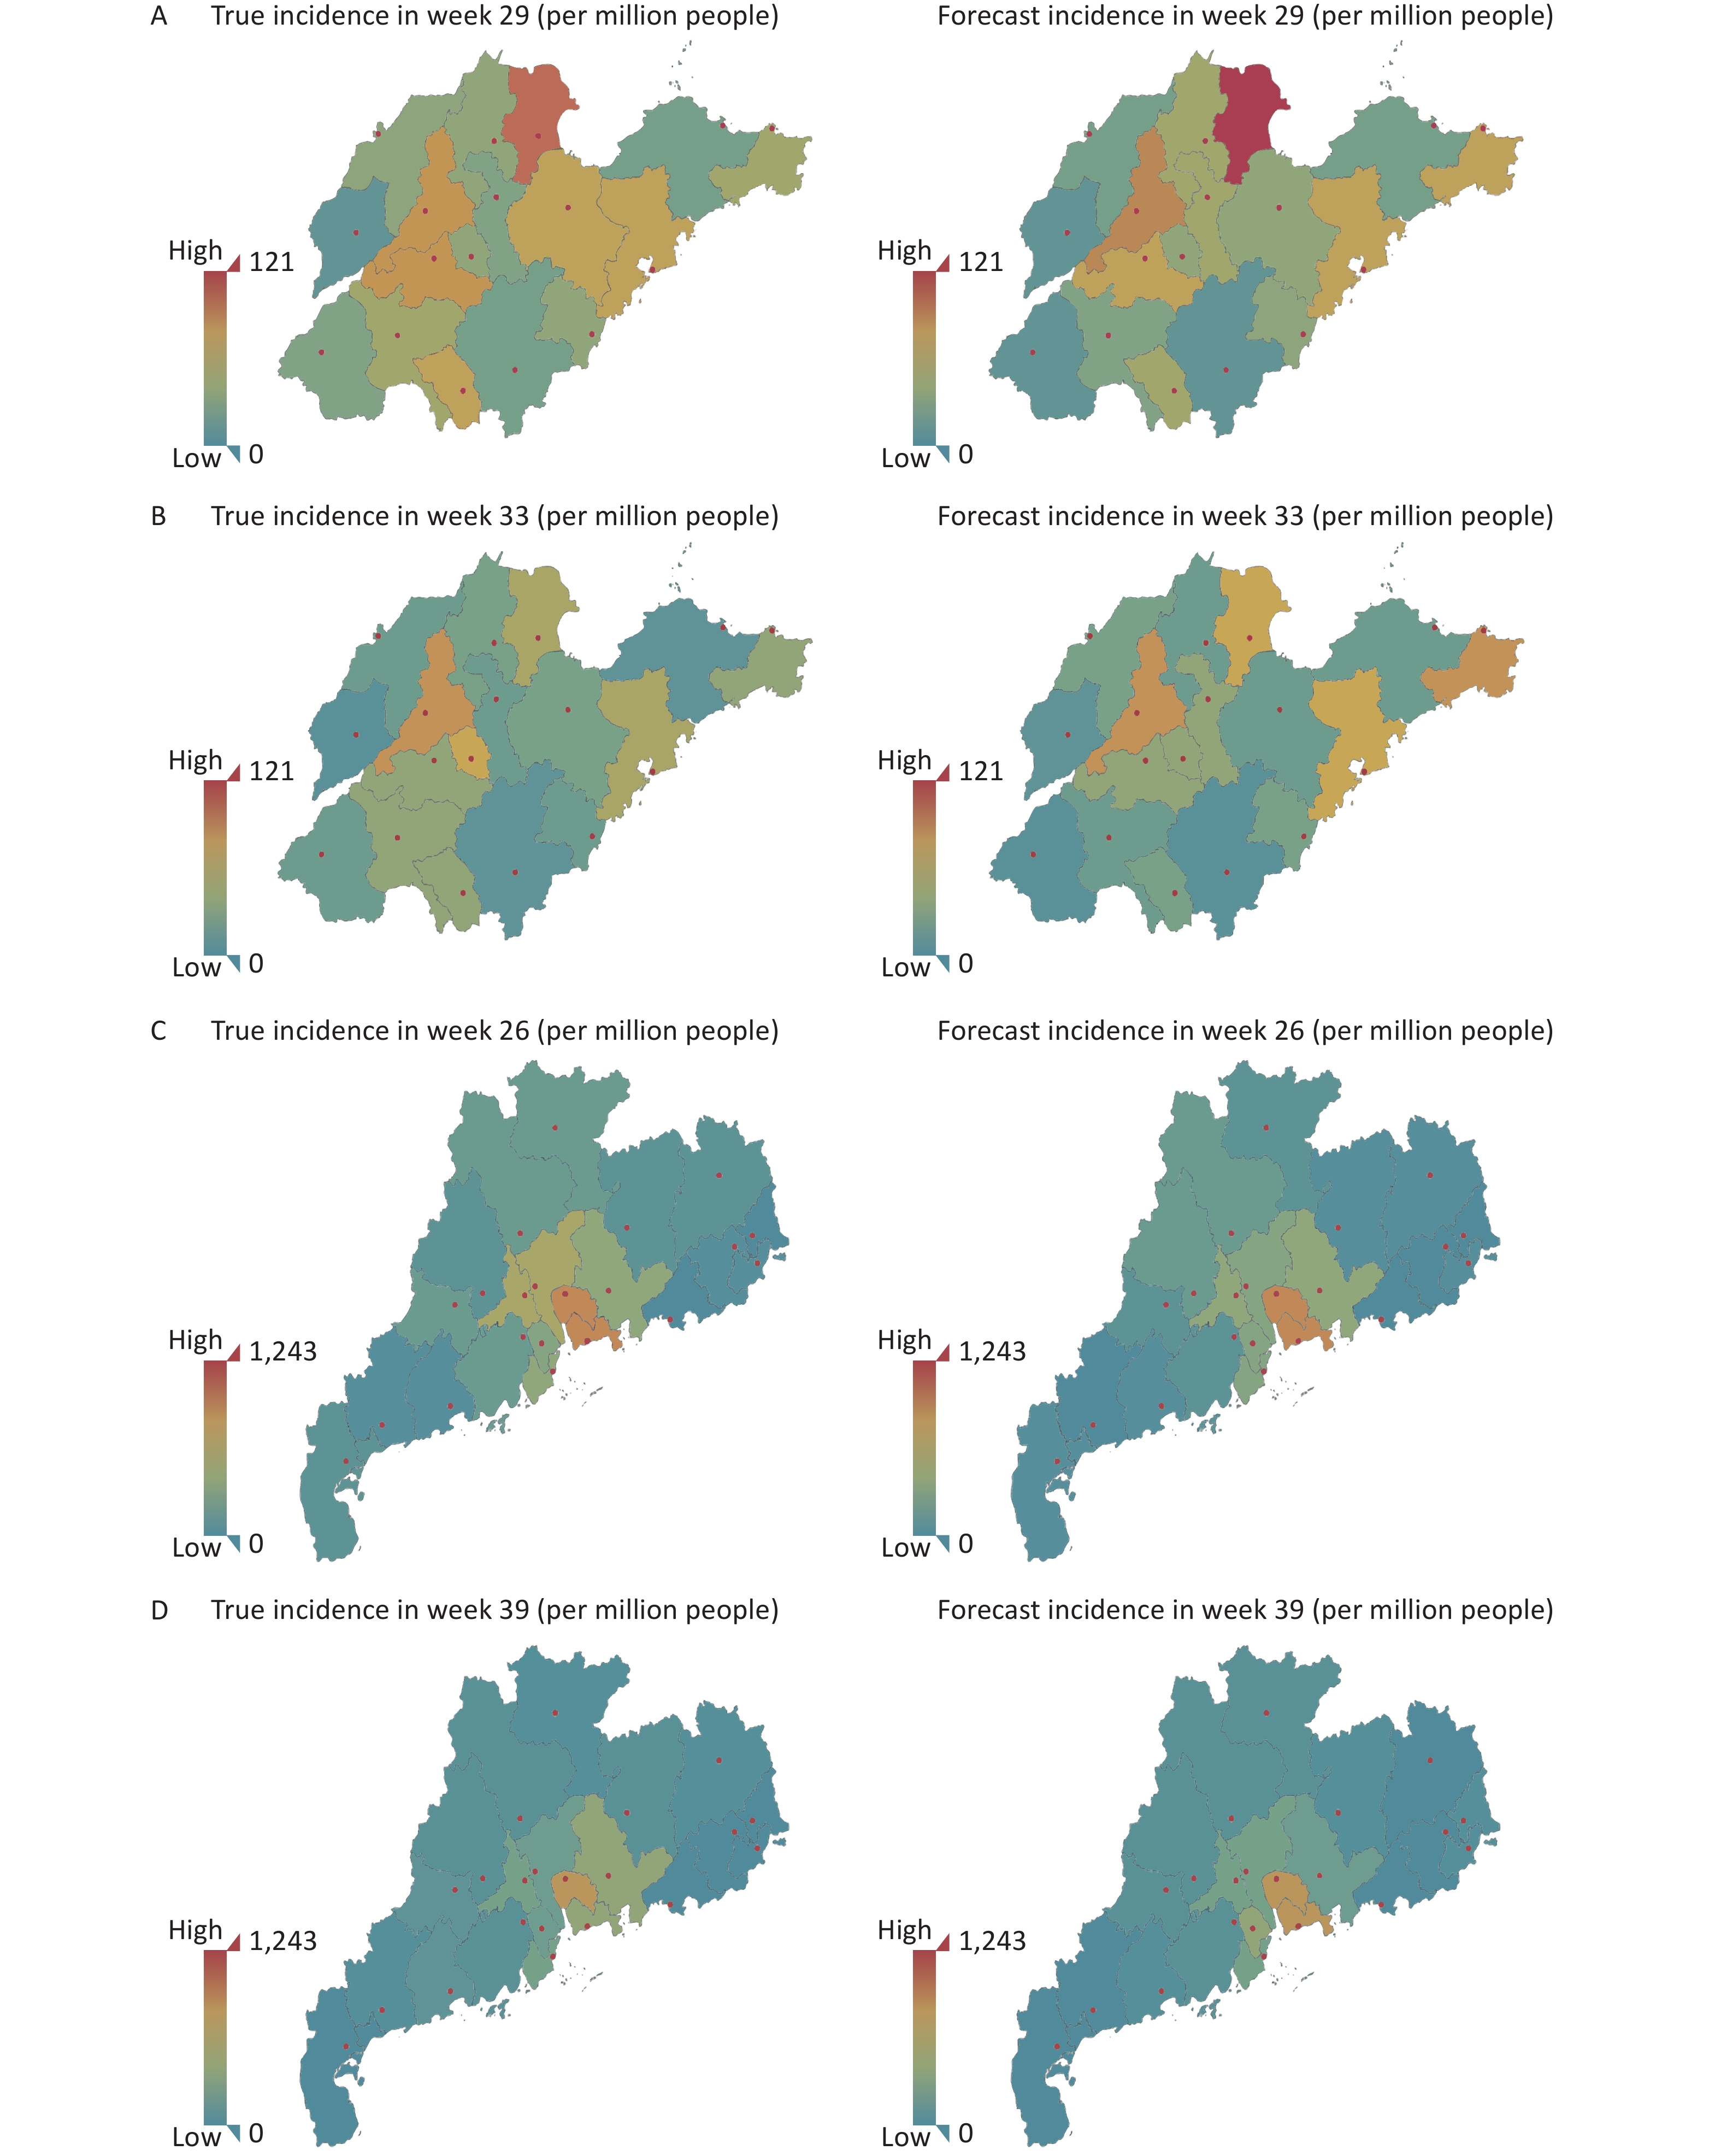
To balance the uneven distribution of the population in each prefecture-level city, we produced geological maps according to incidence (per million people), and the severity of the disease was graphed according to its brightness value (Figure 3).
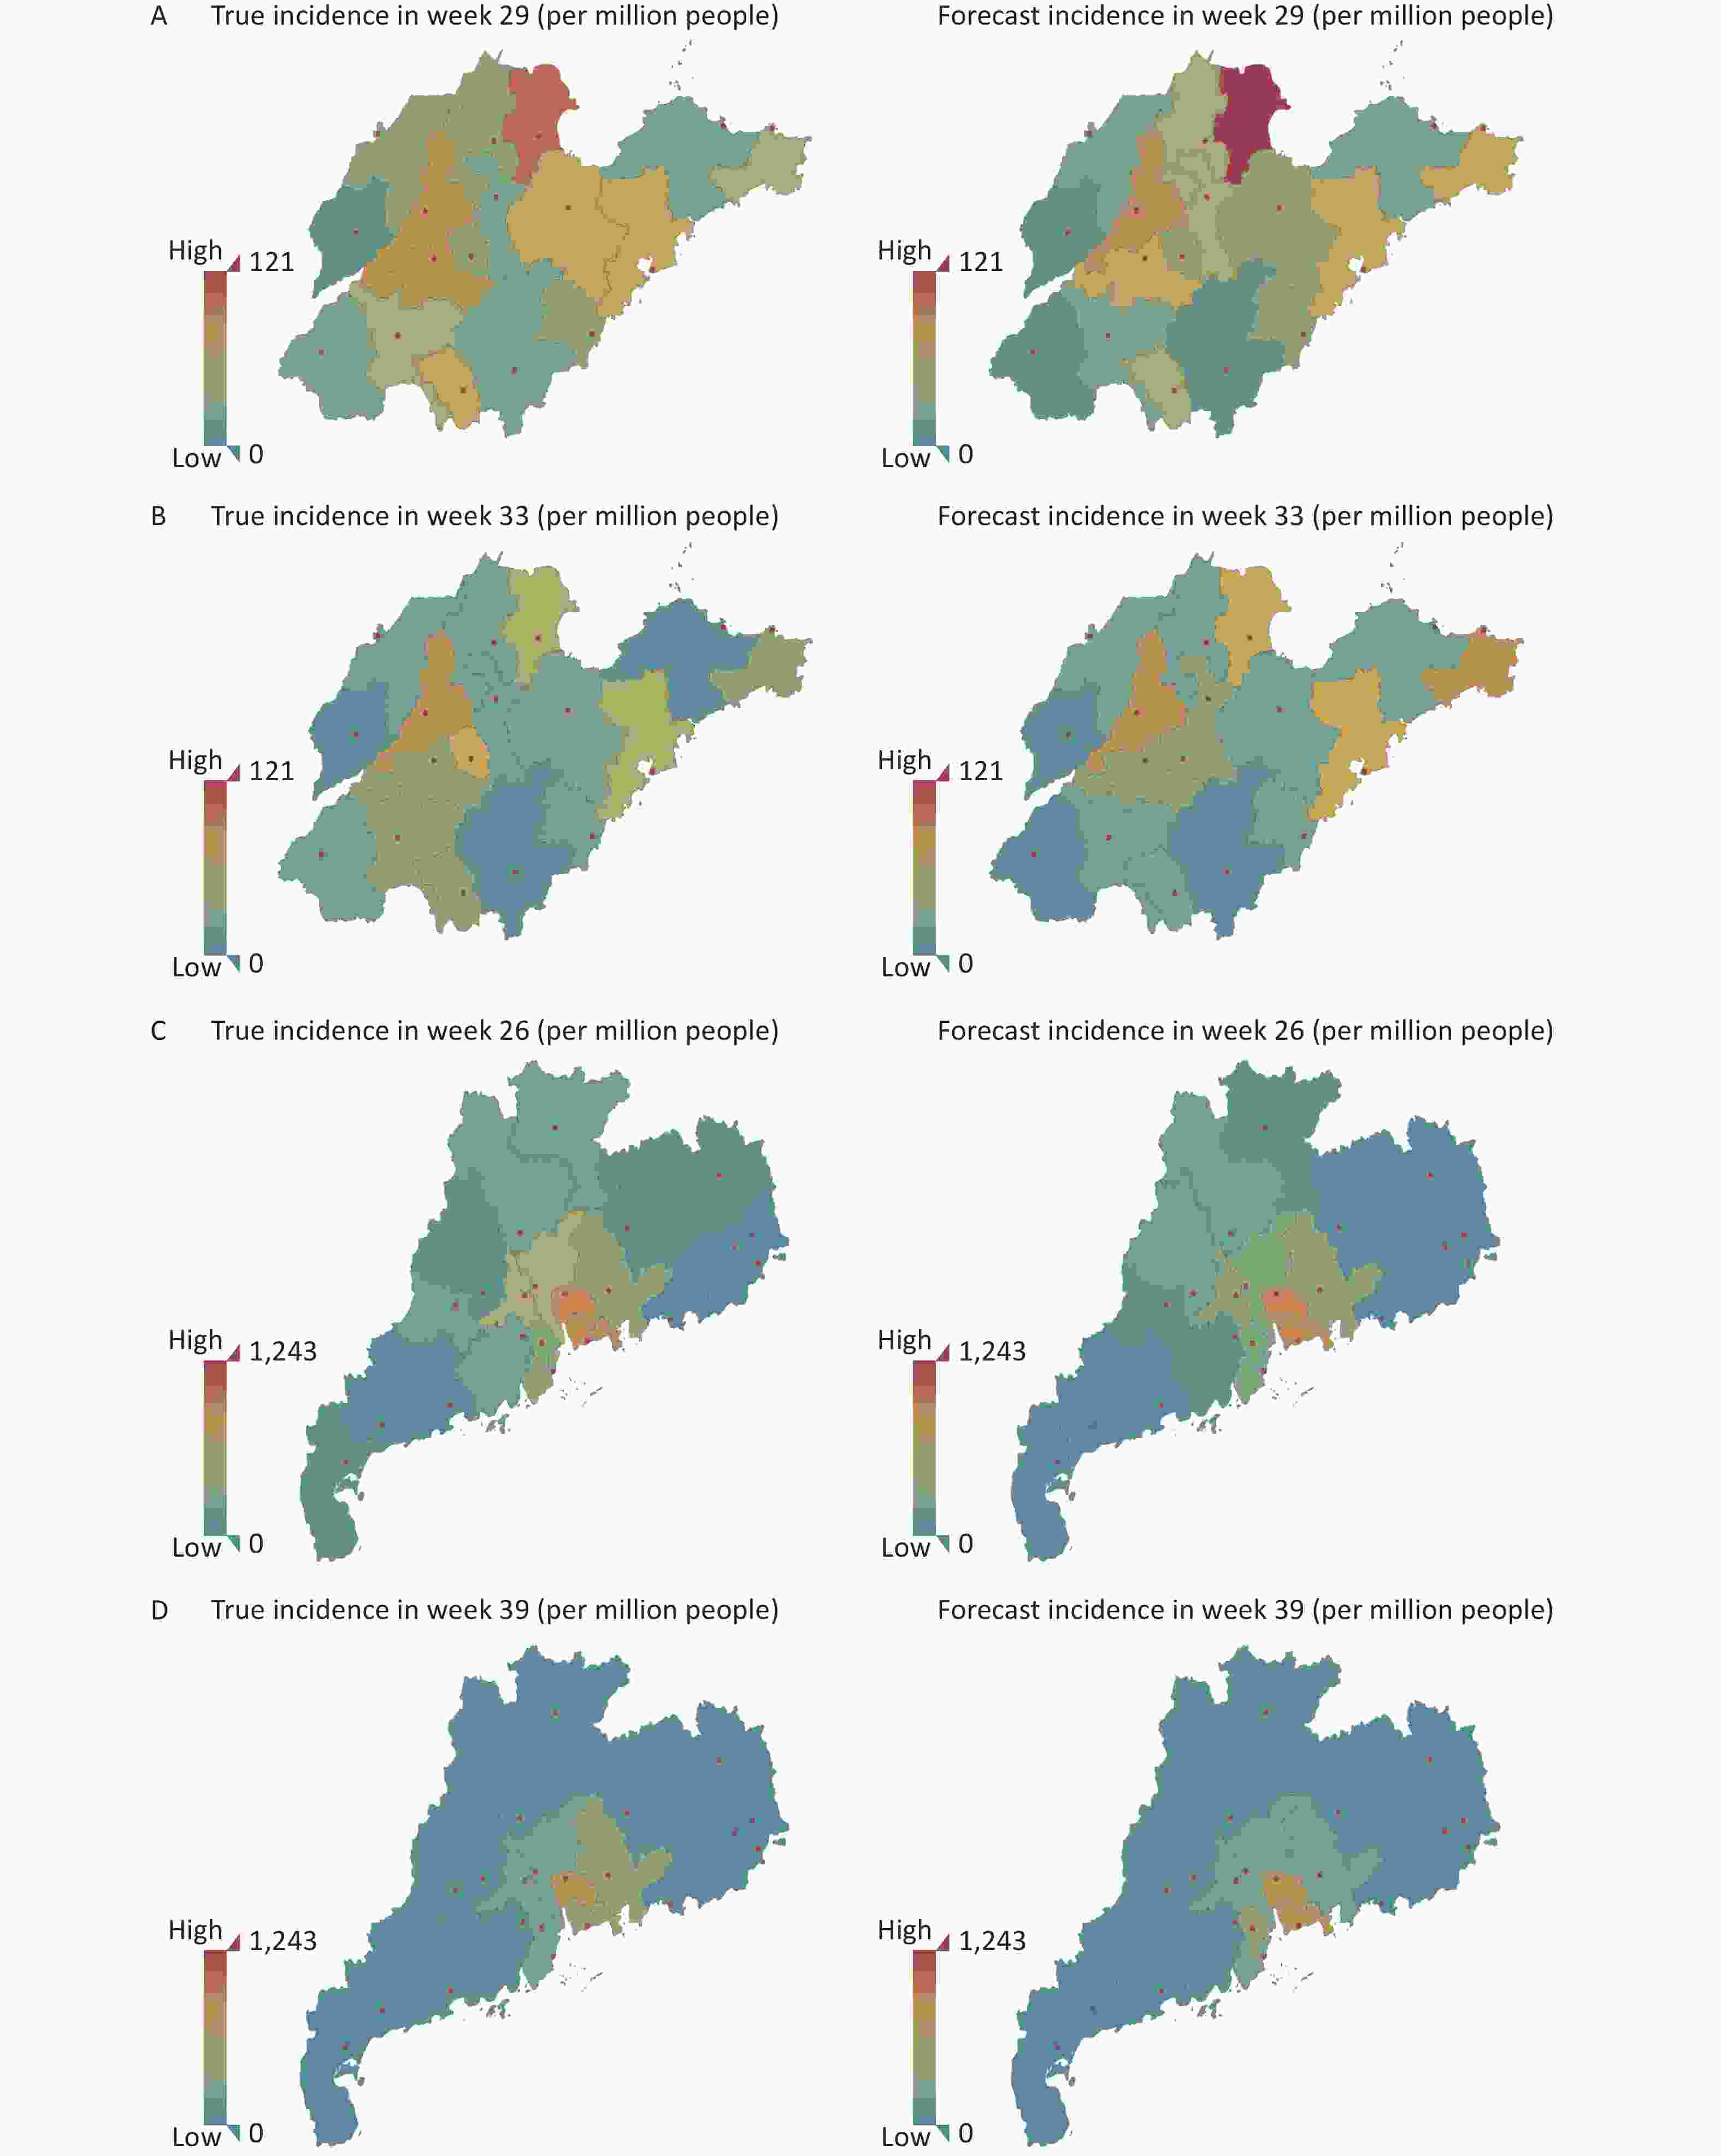
Figure 3. Geospatial maps showing HFMD incidence in Shandong Province and Guangdong Province. (A) Shandong on week 29. (B) Shandong on week 33. (C) Guangdong on week 26. (D) Guangdong on week 39.
The overall peak period for Shandong was at approximately 25–33 weeks, and the most seriously affected areas were around Dongying, Jinan and Qingdao, which demonstrated spread of the disease to surrounding areas. By week 29 of the comparison, the prediction results of the model were basically consistent with the actual high incidence areas, and the actual rates were also accurately predicted for marginal cities such as Weihai and Zaozhuang. By weeks 30–33, the early warning effect of the model was more obvious. The color indicated for Jinan, Weihai, Qingdao and Dongying was more obvious than for other cities around Jinan, as the pandemic increased after the summer season. This shows that the model can capture spatial information and use this in its prediction.
For Guangdong, the high risk areas were concentrated in the Pearl River Delta region, while the summer and autumn peaks occurred at approximately 24–28 weeks and 36–40 weeks, respectively. As the maps show, we found that week 26 in summer and week 39 in autumn gave representative predictions for the major cities that were close to the real incidence rates. However, the early warning effect was not observed for the other regions, as their incidence rates were significantly lower than that in the Pearl River Delta region, and changes in morbidity rates were not obvious in the geospatial map.
-
Four common disease prediction models were compared with our STGCN model in this study, and the prediction performances of these models for Shandong and Guangdong, with different prediction lengths (4 weeks, 8 weeks, and 12 weeks), are summarized in Table 1, showing the MAE and RMSE values.
Area Model 4 weeks 8 weeks 12 weeks MAE RMSE MAE RMSE MAE RMSE Shandong HA 124.98 196.05 141.65 219.14 153.74 233.09 SVR 107.12 130.73 110.23 150.69 122.80 160.88 LSTM 55.83 107.53 142.51 172.98 149.33 183.26 CONV-LSTM 58.08 97.67 58.95 106.39 61.38 111.59 STGCN 50.38 95.07 51.55 96.18 51.29 96.01 Guangdong HA 286.79 502.38 322.68 550.92 344.92 569.47 SVR 177.68 294.34 233.00 460.24 244.48 383.71 LSTM 158.46 28.43 170.99 339.68 184.52 390.29 CONV-LSTM 147.28 266.25 163.51 338.87 168.30 348.65 STGCN 144.79 262.15 158.48 306.87 159.92 320.76 Note. HA, historical average model. SVR, support vector regression. LSTM, long- and short-term temporal. STGCN, spatial-temporal graph convolutional network. RMSE, root mean square error. MAE, mean absolute error. Table 1. Comparison of the five prediction models
The historical average model (HA) takes the model establishing as a seasonal process, and uses the average of previous seasons as the prediction. In this study, we used the incidence data of HFMD for each city for 24 consecutive weeks as the input, and then we calculated the average value and used this as the predicted value of the subsequent incidence data. The support vector regression (SVR) model is a common time series prediction model that involves mapping low-dimensional data to higher-dimensional space, and then reducing the hyperplane in the higher-dimensional space. In this study, radial basis function was used as the kernel function, and the penalty parameter and the number of multinomial kernel functions were set as 1.0 and 3, respectively. The LSTM model can fully extract time information by stacking multiple LSTM cell structures. In this study, we divided the model into two LSTM units with activation functions, namely the full connection layer and the output layer. One hundred neurons were set in the full connection layer, and the number of neurons in the output layer was the number of cities, corresponding to the prediction results for each city. The CONV-LSTM model can not only established temporal relations as an LSTM model, but also had the capability of the CNN model to capture spatial features hidden within the data. It has a convolution structure between different states and a predictive structure by stacking CONV-LSTM layers. The model consists of one CONV-LSTM layer, one LSTM unit, one full connection layer and one output layer. The number of neurons in the output layer is the number of cities, corresponding to the prediction results for each city.
As shown in Table 1, the STGCN achieved excellent results for two province datasets. It greatly outperformed time models, including the HA, SVR and LSTM models. Compared with the spatiotemporal model, the STGCN also surpasses CONV-LSTM based on convolution and gated networks. Compared with CONV-LSTM that uses round-robin architecture, with the height and width of each layer remaining constant, the STGCN uses multiple convolution kernels of different sizes and a codec-like architecture, so that the model can learn the characteristics of incidence rates over different time spans. Moreover, this model can also learn correlations between different cities by changing the width of the convolution kernel, which can greatly increase the predictive power of the model.
-
Epidemiological studies of HFMD have indicated diverse seasonal patterns of HFMD incidence in southern and northern China. Different climatic conditions may lead to different seasonal characteristics between the northern and southern regions. Discriminant analysis confirmed that climate factors[20-21] were the main predictors of the epidemiological distribution of HFMD throughout mainland China. Therefore, the national incidence data cannot be used to establish an incidence model as they would cause deviations and fluctuations in the model. In this study, Guangdong Province was selected as a representative low latitude region to simulate a high incidence province in the subtropical region, and Shandong Province was selected as a representative high latitude region to simulate the temperate monsoon climate to establish the HFMD prediction model.
Over the past few years, graph convolutional networks have attracted widespread attention because of their powerful modeling capabilities that have been successfully applied to areas such as traffic prediction[22] and recommender systems[23]. The better use of topological structure has achieved a significant improvement over traditional machine learning methods in mid- and long-term traffic prediction. Based on this, we applied the deep neural network STGCN to an early warning system for infectious diseases. The time dimension information was extracted by a convolution neural network, while spatial information was captured by a graph convolution algorithm. Finally, by stacking the space-time convolution blocks, the deeper space-time features were extracted continuously. Thus, the reliability of trend prediction by this model was greatly increased.
According to the RMSE and MAE values, the optimum parameters for Shandong and Guangdong were obviously different, which indicated that the stability and consistency of the data may influence model construction and output. If the input data set is too small, the model cannot effectively capture the hidden features, which leads to large errors in prediction. However, if the input data is too large, there may be too much interference for the model, resulting in learning difficulties. Guangdong showed a more complicated incidence profile. Although most cities in Guangdong showed two peaks in the incidence data, the autumn peak varied in forms on different years. Moreover, the second (autumn) peak gradually converged with the first (summer) peak after 2017, with the second peak exceeding that of the first peak for some cities. Thus, the predictive model needs more disease data to train and verify the results.
After a series of calibrations for the parameters, the forecast data became more consistent with the actual incidence, especially in some cities with a high disease burden. For the northern cities with distinct seasons, this model works well, particularly when there are more than 4,000 reported cases or an incidence higher than 10/million people. For the southern cities with more versatile epidemic features, the predictive model requires more data, and the optimum curve was obtained with more than 10,000 reported cases or an incidence higher than 30/million people. In
general, for cities with a lower population density and incidence, the occurrence of infectious diseases tends to be occasional and sporadic. For example, for Yangjiang, Shantou and Shanwei in Guangdong Province, with a low morbidity and population density, the HFMD epidemic data are atypical and irregular, which leads to poor simulation results with the model. This model can be used to implement preventive measures up to 3 months in advance for cities with a high incidence of HFMD, thereby allowing health administrative departments to initiate control measures (akin to those from pandemic preparedness plans) including surveillance, mandatory reporting, isolation, school closures and social distancing. In conclusion, we present a pioneering early warning model with the potential to greatly reduce the incidence of HFMD by allowing effective prevention and control measures to be put in place in advance. This model could also be applied to the prevention and control of other infectious diseases. However, it will be important to consider seasonal differences in climatic conditions that may affect disease epidemics in different regions, such as the average temperature, rainfall, wind speed, relative humidity and daylight duration. Moreover, studies on a variety of disease epidemics indicate that the characteristics of region-varying and time-varying parameters, and spatially stratified heterogeneity, should also be fully considered. Therefore, we believe that the model can be optimized by the addition of more ancillary factors in the future.
-
LIU Hong Tu, YANG Guan Yu, and XU Wen Bo conceived and designed the study. JI Tian Jiao and CHENG Qiang analyzed and interpreted the data. ZENG Han Ri and WANG Jian Xing performed the experiments and entered previous cases into the database. JI Tian Jiao and ZHANG Yong prepared the manuscript. All authors approved the manuscript
-
The authors declare that there are no conflicts of interest.
-
The individual participant-level data that underlie the results reported in this article will be shared after de-identification (text, tables, figures and appendices).
-
Our heartfelt thanks to the Laboratory of Imaging, Southeast University, for the equipment and hardware they provided. We also appreciate the pediatricians who reported cases to the surveillance system for HFMD and all of the staff members responsible for specimen collection, virus isolation and shipment in Guangdong and Shandong Province Centers for Diseases Prevention and Control.
A Novel Early Warning Model for Hand, Foot and Mouth Disease Prediction Based on a Graph Convolutional Network
doi: 10.3967/bes2022.065
Funds:
The work was supported by grants from the Key Technologies Research and Development Program from the Ministry of Science and Technology [grant number: ZDZX-2018ZX102001002-003-003] and the Beijing Natural Science Foundation [project number: L192014]
- Received Date: 2022-01-05
- Accepted Date: 2022-04-12
-
Key words:
- HFMD /
- Early warning model /
- STGCN /
- Disease prediction
Abstract:
| Citation: | JI Tian Jiao, CHENG Qiang, ZHANG Yong, ZENG Han Ri, WANG Jian Xing, YANG Guan Yu, XU Wen Bo, LIU Hong Tu. A Novel Early Warning Model for Hand, Foot and Mouth Disease Prediction Based on a Graph Convolutional Network[J]. Biomedical and Environmental Sciences, 2022, 35(6): 494-503. doi: 10.3967/bes2022.065

|

 Quick Links
 DownLoad: