


-
Approximately two-thirds of patients with type 2 diabetes have hypertension. Moreover, blood pressure (BP) increases with hyperglycemia progression. The nexus between prehypertension or hypertension and diabetes entails pathophysiological mechanisms, such as the involvement of the nitric-oxide pathway in insulin resistance and the contribution of hyperinsulinemia to sympathetic activity, sodium-fluid retention, and renin-angiotensin-aldosterone system activation [1]. Thus, prehypertension or hypertension is related to diabetes.
Prehypertension is a novel BP category from the seventh report of the Joint National Committee on Prevention, Detection, Evaluation, and Treatment of High BP [2]. Prehypertension is reported in > 30% of Americans [3]. Population[2] with prehypertension has been increasing with development in China [4]. Prehypertension increases the risks of diabetes mellitus in adults aged 25–49 years but not in those aged 50–65 years [5]. Hypertension functions as a risk factor for diabetes mellitus [6]. Importantly, separating the incidence rate of diabetes mellitus in the prehypertensive population from that in the hypertensive population provides new perspectives on the relationship between prehypertension/hypertension and diabetes because the incidence rate reflects epidemic intensity. However, the difference between the incidence rate of diabetes mellitus in the prehypertensive population and that in the hypertensive population is unknown, and connections between antihypertensive medication and diabetes mellitus in the hypertensive population remain conflicting. Importantly, revealing the discrepancies in the risk factors of diabetes in prehypertensive and hypertensive populations holds great value for adopting more specific management modes. Thus, this study aimed to compare the difference between the incidence rates, investigate the risk factors of diabetes in hypertensive and prehypertensive populations, document the connections between antihypertensive medication and diabetes mellitus, and assess the effect of government intervention on these populations based on a prospective cohort in Northeast China.
We utilized data from Changchun city in the first (2019–2020) and second surveys (2021–2022) on the prevention and control of major chronic non-communicable diseases in Northeast China. Data were collected through a face-to-face survey by investigators in 10 community health centers that were randomly selected from 12 centers. The first survey included a multicenter cohort with 11,122 participants. We enrolled participants according to the following inclusion criteria: 1) over the age of 60 years; 2) officially registered residents; 3) living in Changchun for > 6 months; 4) with consciousness and no communication barriers; 5) with follow-up data; 6) without diabetes. Finally, 3,151 participants were eligible for further analysis (Supplementary Figure S1, available in www.besjournal.com).
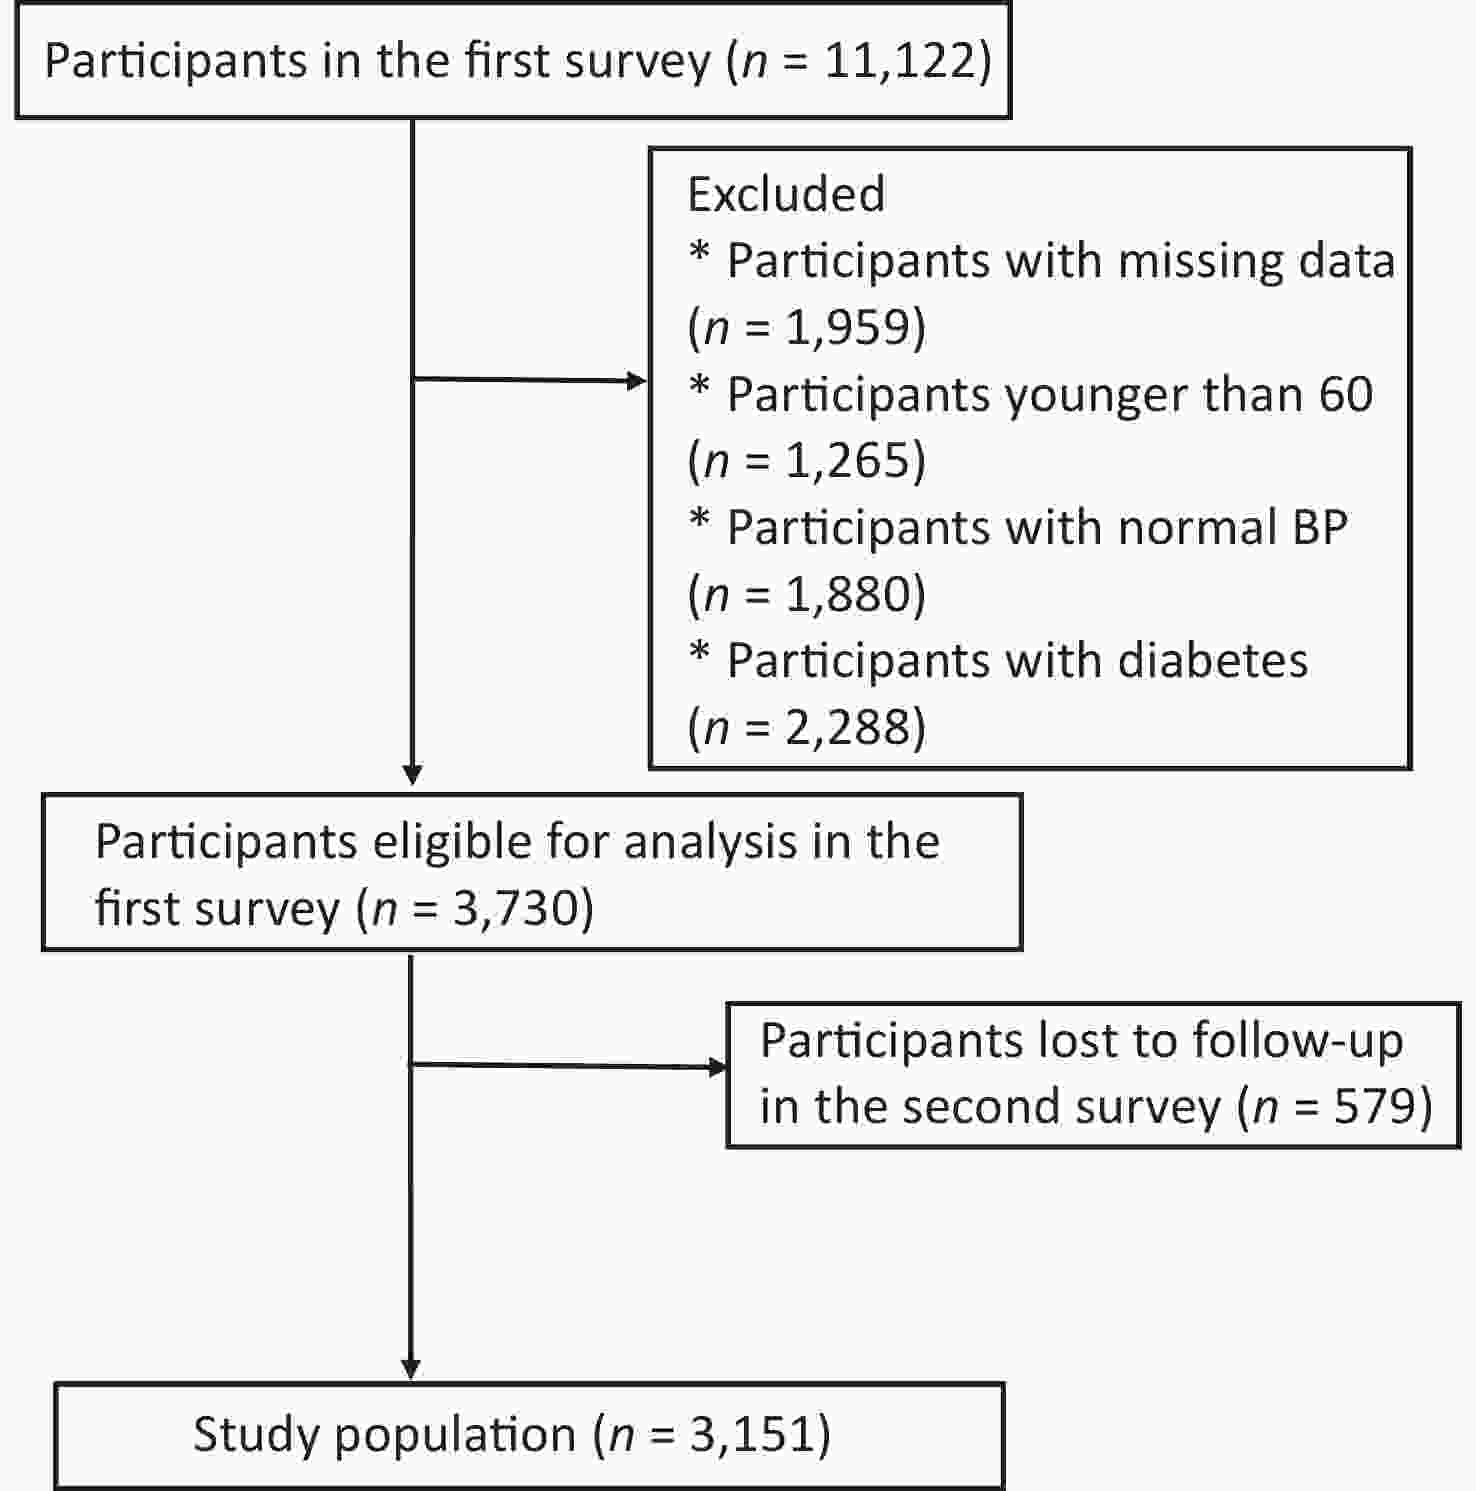
Figure S1. Study flowchart.
Prehypertension was defined as systolic blood pressure (SBP) (120–139 mmHg) or diastolic blood pressure (DBP) (80–89 mmHg), and hypertension was defined as SBP (≥ 140 mmHg) or DBP (≥ 90 mmHg) or with antihypertensive medication [2]. Participants with diabetes mellitus were defined as those with ≥ 7 mmol/L of fasting plasma glucose, current use of anti-diabetic medication, or a history of diabetes mellitus. Normoglycemia was defined as < 5.6 mmol/L of fasting blood glucose, and impaired fasting glucose (IFG) was defined as a fasting blood glucose concentration between 5.6 and 6.9 mmol/L [7]. Body mass index (BMI) was calculated as body weight (in kg) divided by the square of height (in meters) to identify whether participants were underweight (BMI < 18.5), normal (BMI = 18.5–24.0), overweight (BMI = 24.0–28.0), and obese (BMI ≥ 28.0). Dyslipidemia was defined as 2.26 mmol/L of total triglyceride (TG), ≥ 6.22 mmol/L of total cholesterol (TC), ≥ 4.14 mmol/L of low-density lipoprotein cholesterol (LDL-C), or < 1.04 mmol/L of high-density lipoprotein cholesterol (HDL-C) [8]. Current drinking was defined as drinking alcohol (beer, wine, or white spirit) at least three times a week for > 6 months. Current smoking was defined as smoking at least one cigarette per day for > 6 months. Physical exercise was defined as never, sometimes (1–2 days in a week or month), or often (almost every day or 3–4 days a week) with one of the flexible, aerobic, or anaerobic exercises. Antihypertensive medication was defined as currently taking antihypertensive medications in patients with hypertension.
Continuous variables were expressed as mean ± standard deviation. Categorical variables were expressed as numbers (%) and were compared using the chi-square test for trend or the chi-squared test. Risk ratios (RR) and 95% confidence intervals (CIs) were calculated using the Poisson regression model modified by a sandwich variance estimator. The multivariate logistic regression model was performed to analyze RR and 95% CIs based on stepwise selection for potential risk factors identified from the univariate analyses and visualized using nomograms. The receiver operating characteristic (ROC) curve and Harrell’s concordance index (C-index) were used to evaluate the performance of the multivariate logistic regression model. All data analyses were performed by SPSS version 26 (Inc., Chicago, IL, USA) and R version 4.1.0, and P-values of < 0.05 were considered statistically significant.
This study enrolled 3,151 elderly participants with elevated BP (1,177 males and 1,974 females) aged from 60 to 100 years, thereby finding 1,477 with prehypertension and 1,674 with hypertension. Elderly females were prone to hypertension. Hypertensive participants accounted for high proportions in the following items compared with prehypertensive participants: overweight or obese; divorced or separated or widowed; junior and middle school or below; an annual income of less than ¥30,000; with high levels of TG, HDL-C, and fasting plasma glucose (FPG); with history of coronary heart disease; and with a family history of hypertension or coronary heart disease (Supplementary Table S1, available in www.besjournal.com).
Characteristics Total
(n = 3,151), n (%)Prehypertension
(n = 1,477), n (%)Hypertension
(n = 1,674), n (%)P value Sex Male 1,177 (37.4) 598 (40.5) 579 (34.6) < 0.001 Female 1,974 (62.6) 879 (59.5) 1,095 (65.4) Age (years) 71.2 ± 6.1 71.1 ± 5.9 71.4 ± 6.2 0.086 Body mass index (BMI) < 0.001 Underweight 61 (1.9) 36 (2.4) 25 (1.5) Normal 1,345 (42.7) 705 (47.7) 640 (38.2) Overweight 1,284 (40.7) 565 (38.3) 719 (43.0) Obese 461 (14.6) 171 (11.6) 290 (17.3) Marital status 0.355 Unmarried 31 (1.0) 17 (1.2) 14 (0.8) Married/Cohabitation 2,792 (88.6) 1,324 (89.6) 1,468 (87.7) Divorced/Separated/Widowed 328 (10.4) 136 (9.2) 45 (11.5) Educational level < 0.001 Primary school or below 609 (19.3) 259 (17.5) 350 (20.9) Junior middle school 1,057 (33.5) 459 (31.1) 598 (35.7) Senior middle school 795 (25.2) 413 (28.0) 382 (22.8) Undergraduate or above 690 (21.9) 346 (23.4) 344 (20.5) Annual income (¥) 0.004 < 30,000 1,537 (48.8) 664 (43.2) 873 (52.2) 30,000–50,000 1,376 (43.7) 700 (50.9) 676 (40.4) > 50,000 238 (7.6) 113 (7.7) 125 (7.5) Ethnicity 0.095 Han 3,062 (97.3) 1,429 (96.8) 1,633 (97.6) Others 89 (2.7) 48 (3.2) 41 (2.4) Triglyceride (mmol/L) 0.002 < 2.3 2,642 (83.8) 1,267 (85.8) 1,073 (82.1) ≥ 2.3 509 (16.2) 210 (14.2) 601 (17.9) Total cholesterol (mmol/L) 0.001 < 6.2 2,724 (86.4) 1,252 (84.8) 1,472 (87.9) ≥ 6.2 427 (13.6) 225 (15.2) 202 (12.1) HDL-C (mmol/L) 0.000 < 4.9 507 (16.1) 170 (11.5) 337 (20.1) ≥ 4.9 2,644 (83.9) 1,307 (88.5) 1,337 (79.9) LDL-C (mmol/L) < 0.001 < 4.1 2,623 (83.2) 1216 (82.3) 1,407 (84.1) ≥ 4.1 528 (16.8) 261 (17.7) 267 (15.9) Fasting plasma glucose (mmol/L) < 0.001 < 5.6 (normal) 2,002 (85.8) 1,043 (89.6) 959 (82.4) 5.6–6.9 (IFG) 1,149 (14.2) 434 (10.4) 715 (17.6) Waist (cm) 85.1 ± 9.1 84.0 ± 9.0 86.3 ± 9.0 < 0.001 Physical exercise < 0.001 Never 682 (21.6) 324 (21.9) 358 (21.4) Sometimes 164 (5.2) 60 (4.1) 104 (6.2) Often 2,305 (73.2) 1,093 (74.0) 1,212 (72.4) Current drinking 268 (8.5) 127 (8.6) 141 (8.4) 0.244 Current smoking 284 (9.0) 134 (9.1) 150 (9.0) 0.965 History of stroke 80 (2.5) 30 (2.0) 50 (3.0) 0.232 History of coronary heart disease 438 (13.9) 162 (11.0) 276 (16.5) < 0.001 Family history of hypertension 299 (9.5) 56 (3.8) 243 (14.5) < 0.001 Family history of stroke 80 (2.5) 9 (0.6) 19 (1.1) 0.175 Family history of diabetes 33 (1.0) 21 (1.4) 12 (0.7) 0.052 Family history of coronary heart disease 77 (2.4) 26 (1.8) 51 (3.0) 0.026 Table S1. Characteristics of the participants
This study revealed that 7.1% (224) of the nondiabetic participants with prehypertension or hypertension in the initial survey were the ones with diabetes after 2 years. The incidence rate of diabetes in the participants with hypertension was significantly higher than that in the participants with prehypertension (RR = 1.308, 95% CI: 1.006–1.707, P = 0.045) (Table 1).
Group Total (n = 3,151) Diabetes (n = 224), n (%) 1,000 person-years Adjusted RR (n = 168), n (%) P value Prehypertension 1,477 84 (5.7) 28.44 1 Hypertension 1,674 140 (8.4) 41.82 1.308 (1.006, 1.707) 0.045 Note. 1: the reference cell. Final model adjusted for age, sex, education level, marital status, annual income, ethnicity, smoking, drinking, physical activity, BMI, stroke, coronary heart disease, family history of hypertension, stroke, diabetes, coronary heart disease, TG, TC, HDL-C, LDL-C, and FPG. Table 1. Association between prehypertension and hypertension at baseline and diabetes, estimated by poisson regression
Significant differences were found between the diabetic and nondiabetic participants in BMI, coronary heart disease history, family history of diabetes and coronary heart disease, TG, and FPG (all P < 0.05) (Supplementary Table S2, available in www.besjournal.com). Then, we identified that BMI, family history of diabetes, and FPG were all significantly associated with the occurrence of diabetes using multivariate logistic regression (Supplementary Table S3, available in www.besjournal.com). Compared with patient with obesity, normal and overweight patients had low risks of diabetes (normal: RR = 0.542, 95% CI: 0.348–0.742; overweight: RR = 0.677, 95% CI: 0.462–0.946). Compared with normal FPG, IFG was a strong predictor of diabetes (RR = 2.130, 95% CI: 1.613–2.812). Additionally, a family history of diabetes was a high-risk factor for diabetes (RR = 2.788, 95% CI: 1.143–6.798).
Characteristics No diabetes
(n = 2,927), n (%)Diabetes
(n = 224), n (%)P value Sex 0.503 Male 1,098 (93.9) 79 (6.7) Female 1,829 (92.7) 145 (7.3) Age (years) 0.491 60– 1,396 (93.6) 2,026 (6.4) 70– 1,198 (92.3) 2,160 (7.7) 80– 319 (91.9) 2,059 (8.1) 90– 14 (93.3) 2,039 (6.7) BMI < 0.001 Underweight 57 (93.4) 4 (6.6) Normal 1,273 (94.6) 72 (5.4) Overweight 1,189 (92.6) 95 (7.4) Obese 408 (88.5) 53 (11.5) Marital status 0.300 Unmarried 31 (100.0) 0 (0.0) Married/Cohabitation 2,592 (92.8) 200 (7.2) Divorced/Separated 304 (92.7) 24 (7.3) /Widowed 0.801 Educational level 0.971 Primary school or below 565 (92.8) 44 (7.2) Junior middle school 983 (93.0) 74 (7.0) Senior middle school 736 (92.6) 59 (7.4) Undergraduate or above 643 (93.2) 47 (6.8) Annual income (¥) 0.265 < 30,000 1,416 (92.1) 121 (7.9) 30,000–50,000 1,288 (93.6) 88 (6.4) > 50,000 223 (93.7) 15 (6.3) Ethnicity 0.579 Han 2,843 (92.8) 219 (7.2) Others 84 (94.4) 5 (5.6) Physical exercise 0.293 Never 629 (92.2) 53 (7.8) Sometimes 157 (95.7) 7 (4.3) Often 2,141 (92.9) 164 (7.1) Current drinking 0.794 Yes 250 (93.3) 18 (6.7) No 2,677 (92.9) 206 (7.1) Current smoking 0.963 Yes 264 (93.0) 20 (7.0) No 2,663 (92.9) 204 (7.1) History of stroke 0.890 Yes 74 (92.5) 6 (7.5) No 2,853 (92.9) 218 (7.1) History of coronary heart disease 0.029 Yes 396 (90.4) 42 (9.6) No 2,531 (93.3) 182 (6.7) Family history of hypertension 0.594 Yes 280 (93.6) 19 (6.4) No 2,647 (92.8) 205 (7.2) Family history of stroke 0.265* Yes 24 (85.7) 4 (14.3) No 2,903 (93.0) 220 (7.0) Family history of diabetes 0.002 Yes 26 (78.8) 7 (21.2) No 2,901 (93.0) 217 (7.0) Family history of coronary heart disease 0.003 Yes 65 (84.4) 12 (15.6) No 2,862 (93.1) 212 (6.9) Triglyceride (mmol/L) 0.026 < 2.3 2,466 (93.3) 176 (6.7) ≥ 2.3 461 (90.6) 48 (9.4) Total cholesterol (mmol/L) 0.460 < 6.2 393 (92.0) 34 (8.0) ≥ 6.2 2,534 (93.0) 190 (7.0) HDL-C (mmol/L) 0.446 < 4.9 475 (93.7) 32 (6.3) ≥ 4.9 2,452 (92.7) 192 (7.3) LDL-C (mmol/L) 0.638 < 4.1 493 (93.4) 35 (6.6) ≥ 4.1 2,434 (92.8) 189 (7.2) Fasting plasma glucose (mmol/L) < 0.001 < 5.6 (normal) 1,902 (95.0) 100 (5.0) 5.6−6.9 (IFG) 1,025 (89.2) 124 (10.8) Note. *Chi-squared test with Yates' continuity correction. IFG: impaired fasting glucose. Table S2. Univariate analysis for the risk factors associated with progression to diabetes
Characteristics P value RR 95% CI BMI Underweight 0.424 0.649 0.225–1.874 Normal 0.001 0.542 0.348–0.742 Overweight 0.024 0.677 0.462–0.946 Obese 0.006 1 History of coronary heart disease Yes 0.113 1.344 0.933–1.937 No 1 Family history of coronary heart disease Yes 0.052 1.923 0.994–3.720 No 1 Family history of diabetes Yes 0.024 2.788 1.143–6.798 No 1 Triglyceride (mmol/L) < 2.3 1 ≥ 2.3 0.140 1.292 0.919–1.816 Fasting plasma glucose (mmol/L) < 5.6 (normal) 1 5.6−6.9 (IFG) < 0.001 2.130 1.613–2.812 Note. 1: the reference cell. IFG: impaired fasting glucose; BMI: body mass index. Table S3. Multivariate analysis for the risk factors associated with progression to diabetes
Univariate analysis revealed a significant association between the occurrence of diabetes in the prehypertensive participants and the elevated FPG and TC and between the hypertensive participants and FPG, TG, BMI, family history of diabetes, family history of coronary heart disease, self-management, and community management (all P < 0.05) (Supplementary Table S4, available in www.besjournal.com).
Characteristics Prehypertension (n = 1,477) Hypertension (n = 1,674) No diabetes
(n = 1,393)Diabetes
(n = 84)P value No diabetes
(n = 1,534)Diabetes
(n = 140)P value Sex 0.646 0.792 Male 566 (94.6) 32 (5.4) 532 (91.9) 47 (8.1) Female 827 (94.1) 52 (5.9) 1,002 (91.5) 93 (8.5) Age (years) 0.344 0.936 60– 689 (95.3) 34 (4.7) 703 (92.1) 61 (7.9) 70– 564 (93.5) 39 (6.5) 634 (91.2) 61 (8.8) 80– 134 (92.4) 11 (7,6) 185 (91.6) 17 (8.4) 90– 6 (100.0) 0 (0.0) 8 (88.9) 1 (11.1) BMI 0.118 0.005 Underweight 35 (97.2) 1 (2.8) 22 (88.0) 3 (12.0) Normal 671 (95.2) 41 (4.8) 602 (94.1) 38 (5.9) Overweight 532 (94.2) 37 (5.8) 657 (91.4) 62 (8.6) Obese 155 (90.6) 17 (9.4) 253 (87.2) 37 (12.8) Marital status 0.566 0.512* Unmarried 17 (100.0) 0 (0.0) 14 (100.0) 0 (0.0) Married/Cohabitation 1,247 (94.2) 77 (5.8) 1,345 (91.6) 123 (8.4) Divorced/Separated/Widowed 129 (94.9) 7 (5.1) 175 (91.1) 17 (8.9) Educational level 0.730 0.877 Primary school or below 245 (94.6) 14 (5.4) 320 (91.4) 30 (8.6) Junior middle school 437 (95.2) 22 (4.8) 546 (91.3) 52 (8.7) Senior middle school 387 (93.7) 26 (6.3) 349 (91.4) 33 (8.6) Undergraduate or above 324 (93.6) 22 (6.4) 319 (92.7) 25 (7.3) Annual income (¥) 0.364 0.747 < 30,000 620 (93.4) 44 (6.6) 796 (91.2) 77 (8.8) 30,000–50,000 666 (95.1) 34 (4.8) 622 (92.0) 54 (8.0) > 50,000 107 (94.7) 6 (5.3) 116 (92.8) 9 (7.2) Ethnicity 0.436* 0.968* Han 1,346 (94.2) 83 (5.8) 1,497 (91.7) 136 (8.3) Others 47 (97.9) 1 (2.1) 37 (90.2) 4 (9.8) Physical exercise 0.007 0.007 Never 296 (91.4) 28 (8.6) 333 (93.0) 25 (7.0) Sometimes 54 (90.0) 6 (10.0) 103 (99.0) 1 (1.0) Often 1,043 (95.4) 50 (4.6) 1,098 (90.6) 114 (9.4) Current drinking 0.624 0.947 Yes 121 (95.3) 6 (4.7) 129 (91.5) 12 (8.5) No 1,272 (94.2) 78 (5.6) 1,405 (91.7) 128 (8.3) Current smoking 0.305 0.448 Yes 129 (96.3) 5 (3.7) 135 (90.0) 15 (10.0) No 1,264 (94.1) 79 (5.9) 1,399 (91.8) 125 (8.2) History of stroke 0.815* 0.925* Yes 28 (93.3) 2 (6.7) 46 (92.0) 4 (8.0) No 1,365 (94.3) 82 (5.7) 1,488 (91.6) 136 (8.4) History of coronary heart disease 0.083 0.242 Yes 148 (91.4) 14 (8.6) 248 (89.9) 28 (10.1) No 1,245 (94.7) 70 (5.3) 1,286 (92.0) 112 (8.0) Family history of hypertension 0.913* 0.279 Yes 53 (94.6) 3 (5.4) 227 (93.4) 16 (6.6) No 1,340 (94.3) 81 (5.7) 1,307 (91.3) 124 (8.7) Family history of stroke 0.481 0.448* Yes 8 (88.9) 1 (11.1) 16 (84.2) 3 (15.8) No 1,385 (94.3) 83 (5.7) 1,518 (91.7) 137 (8.3) Family history of diabetes 0.772* < 0.001 Yes 19 (90.5) 2 (9.5) 7 (58.3) 5 (41.7) No 1,374 (94.4) 82 (5.6) 1,527 (91.8) 135 (9.2) Family history of coronary heart disease 0.383 0.015 Yes 23 (88.5) 3 (11.5) 42 (82.4) 9 (17.6) No 1,370 (94.4) 81 (5.6) 1,492 (91.9) 131 (8.1) Triglyceride (mmol/L) 0.985 < 0.011 < 2.3 1,195 (94.3) 54 (5.7) 1,271 (92.4) 104 (7.6) ≥ 2.3 198 (94.3) 30 (5.7) 263 (88.0) 36 (12.0) Total cholesterol (mmol/L) 0.024 0.433 < 6.2 1,188 (94.9) 64 (5.1) 1,346 (91.4) 108 (8.6) ≥ 6.2 205 (91.1) 20 (8.9) 188 (93.1) 32 (6.9) HDL-C (mmol/L) 0.197 0.631 < 1.04 164 (96.5) 6 (3.5) 311 (92.3) 26 (7.7) ≥ 1.04 1,229 (94.0) 78 (6.0) 1,223 (91.5) 114 (8.5) LDL-C (mmol/L) 0.804 0.748 < 4.1 1,146 (94.2) 56 (5.8) 1,288 (91.5) 119 (8.5) ≥ 4.1 247 (94.6) 28 (5.4) 246 (92.1) 21 (7.9) Fasting plasma glucose (mmol/L) 0.002 < 0.001 < 5.6 (normal) 996 (95.0) 47 (5.0) 906 (93.3) 53 (6.7) 5.6−6.9 (IFG) 397 (88.3) 37 (11.7) 628 (83.7) 87 (16.3) Antihypertensive medication 0.075 No 500 (89.9) 56 (10.1) Sigle management 1,034 (92.5) 84 (7.5) Self-management Regular medication 1,156 (92.5) 94 (7.5) 0.032 Improving diet 1,162 (92.8 90 (7.2) 0.003 Controlling salt intake 943 (93.4) 67 (6.6) 0.002 Increasing exercise 891 (92.8) 69 (7.2) 0.044 BP monitoring 909 (92.7) 72 (7.3) 0.072 Combination of self- management 0.019 No 321 (88.4) 42 (11.6) Sigle management 166 (90.2) 18 (9.8) 2 combinations 68 (88.3) 9 (11.7) ≥ 3 combinations 979 (93.2) 71 (6.8) Community management BP measurement 1,218 (93.1) 90 (69.0) < 0.001 Medication guidance 1,149 (92.8) 89 (7.2) 0.003 Dietary guidance 1,162 (9.8) 90 (7.2) 0.003 Physical exercise guidance 1,137 (92.7) 89 (7.3) 0.007 Combination of community-management 0.002 No 337 (87.1) 50 (12.9) Sigle management 9 (100.0) 0(0.0) 2 combinations 32 (100.0) 0 (0.0) ≥ 3 combinations 1,156 (92.8) 90 (7.2) Note. *Chi-squared test with Yates’ continuity correction; Fisher's exact test. IFG: impaired fasting glucose; BMI, body mass index; LDL-C, low-density lipoprotein cholesterol; HDL-C, high-density lipoprotein cholesterol; BP, blood pressure. Table S4. Univariate analysis for the risk factors associated with progression to diabetes in participants with prehypertension/hypertension
Multivariate logistic regression identified that the occurrence of diabetes in the participants with prehypertension was associated with BMI, physical exercise, TC, and FPG; and the occurrence of diabetes in the participants with hypertension was associated with BMI, physical exercise, TG, FPG, family history of diabetes, and community management (Tables 2–3).
Characteristics P value RR 95% CI Body mass index (BMI) Underweight 0.196 0.255 0.032–2.024 Normal 0.037 0.511 0.272–0.959 Overweight 0.114 0.601 0.320–1.130 Obese 0.163 1 Physical exercise Never 0.008 1 Sometimes 0.718 1.189 0.464–3.046 Often 0.005 0.498 0.306–0.811 Total cholesterol (mmol/L) < 6.2 1 ≥ 6.2 0.020 1.876 1.103–3.191 Fasting plasma glucose (mmol/L) < 5.6 (normal) 1 5.6–6.9 (IFG) 0.014 1.772 1.125–2.790 Note. IFG: impaired fasting glucose. Table 2. Multivariate analysis for the risk factors associated with progression to diabetes in participants with prehypertension
Characteristics P value RR 95% CI Body mass index (BMI) Underweight 0.955 0.963 0.262–3.543 Normal 0.003 0.470 0.287–0.769 Overweight 0.052 0.642 0.410–1.004 Obese 0.024 1 Physical exercise Never 0.018 1 Sometimes 0.030 0.107 0.014–0.807 Often 0.163 1.388 0.875–2.200 Family history of diabetes Yes 0.048 3.544 1.010–12.435 No 1 Family history of coronary heart disease Yes 0.227 1.683 0.723–3.919 No 1 Triglyceride (mmol/L) < 2.3 1 ≥ 2.3 0.032 1.576 1.039–2.391 Fasting plasma glucose (mmol/L) < 5.6 (normal) 1 5.6–6.9 (IFG) < 0.001 2.183 1.515–3.147 Self-management Regular medication 0.655 1.172 0.584–2.354 Improving diet 0.991 0.996 0.495–2.004 Controlling salt intake 0.334 0.668 0.295–1.514 Increasing exercise 0.106 1.888 0.873–4.083 Combination of self-management No 0.121 1 Sigle self-management 0.274 1.586 0.694–3.621 2 combinations 0.111 2.197 0.834–5.786 ≥ 3 combinations 0.963 1.017 0.497–2.082 Community-management BP measurement < 0.001 0.462 0.313–0.682 Medication guidance 0.205 3.822 0.480–30.419 Dietary guidance 0.674 1.786 0.120–26.609 Physical exercise guidance 0.616 1.691 0.217–13.185 Combination of community-management No 0.017 1 Sigle management 0.999 0.000 2 combinations 0.998 0.000 ≥ 3 combinations 0.001 0.509 0.345–0.750 Note. BP: blood pressure; IFG: impaired fasting glucose; 1: the reference cell. Table 3. Multivariate analysis for the risk factors associated with progression to diabetes in participants with hypertension
Interestingly, we discerned the effect of physical exercise on diabetes, finding a paradox that frequent physical exercise was a protective factor for diabetes in participants with prehypertension, while seldom physical exercise was a protective factor for diabetes in participants with hypertension. Physical exercise influences diabetes and hypertension via regulating metabolism; however, the effects of physical exercise on prehypertension have not been discerned from those on hypertension. Indeed, we revealed different effects of physical exercise between the participants with prehypertension and hypertension: “frequent” was a protective factor for prehypertensive participants, and “seldom” was a protective factor for hypertensive participants. Hypertension and endothelial dysfunctions are linked to an insulin-resistant state, thereby promoting the occurrence of type 2 diabetes mellitus. Physical exercise induces the intracellular production of NO* by enhancing the flux of muscle- and kidney-derived amino acids to pancreatic and vascular endothelial cells, resulting in the normalization of insulin secretion, vascular tone, and insulin sensitivity. Additionally, physical exercise impacts angiotensin II and asymmetric dimethylarginine signaling, thereby triggering the production of anti-inflammatory cytokines in muscle and reducing the progression and development of vascular disease and diabetes [9].
Reduced vascular impairments were observed more in participants with prehypertension than in participants with hypertension. This difference in the beneficial effects is derived from physical exercise in the improvement of metabolic and cardiovascular health. However, physical exercise is unable to balance increased vascular impairments in participants with hypertension. We attribute “seldom physical exercise” as a protective factor for diabetes in participants with hypertension to the smaller sample size.
Metabolic syndrome is one of the states of prediabetes, and individuals with metabolic syndrome without diabetes are at significant risk of developing diabetes. This study revealed that those simultaneously with hypertension and metabolic syndrome accounted for a significantly high proportion and had an increased tendency from non-diabetes to diabetes compared with the participants with simultaneous prehypertension and metabolic syndrome (Supplementary Table S5, available in www.besjournal.com). At present, waist circumference, dyslipidemia (TG high and HDL-C low), BP values, and FPG are defined as metabolic syndrome criteria globally. However, we only confirmed that the high FPG criterion was significantly associated with the occurrence of diabetes both in participants with prehypertension and hypertension, thereby providing a new dimension to further crystallize the definition of metabolic syndrome by adding BMI as a new essential criterion.
Characteristics Prehypertension (n = 1,477) Hypertension (n = 1,674) No diabetes
(n = 1,393)Diabetes
(n = 84)P value No diabetes
(n = 1,534)Diabetes
(n = 140)P value Waist (cm)
≥ 90 for male
or ≥ 85 for female
507 (36.4)
36 (42.9)0.237
686 (44.7)
76 (54.3)0.030 FPG (mmol/L) 0.000 0.000 ≥ 6.1 145 (10.4) 20 (23.8) 246 (16.0) 48 (34.3) BP (mmHg) 0.768 ≥ 135/85 410 (29.4) 26 (31.0) 1,534 (100.0) 140 (100.0) TG (mmol/L) 0.111 0.001 ≥ 1.7 445 (31.9) 34 (40.5) 554 (36.1) 71 (50.7) HDL-C (mmol/L) 0.318 0.263 < 1.04 164 (11.8) 7 (8.3) 229 (14.9) 26 (18.6) Metabolic syndrome 0.531 0.000 Yes 151 (10.8) 11 (13.1) 468 (30.5) 72 (51.4) Note. FPG: fasting plasma glucose, BP: blood pressure; BP: blood pressure; TG: triglycerise; HDL-C, high-density lipoprotein cholesterol. Table S5. Presence of metabolic syndrome in prehypertensive participants and hypertensive participants
Further, we investigated the potential effect of two modes of management on diabetes (community and self management) because participants with hypertension received self and community management. We identified that three or more combinations of measures from community management conferred protective effects on diabetes (RR = 0.509, 95% CI: 0.345–0.750). BP measurement was the strongest protective factor for diabetes among measures from community management compared with other measures (Table 3). Regular BP measurement dynamically monitors the BP level of participants, thereby helping participants to recognize their own BP status and train healthy behaviors, such as controlling diet and taking antihypertensive drugs to control BP, thereby reducing the risk of diabetes.
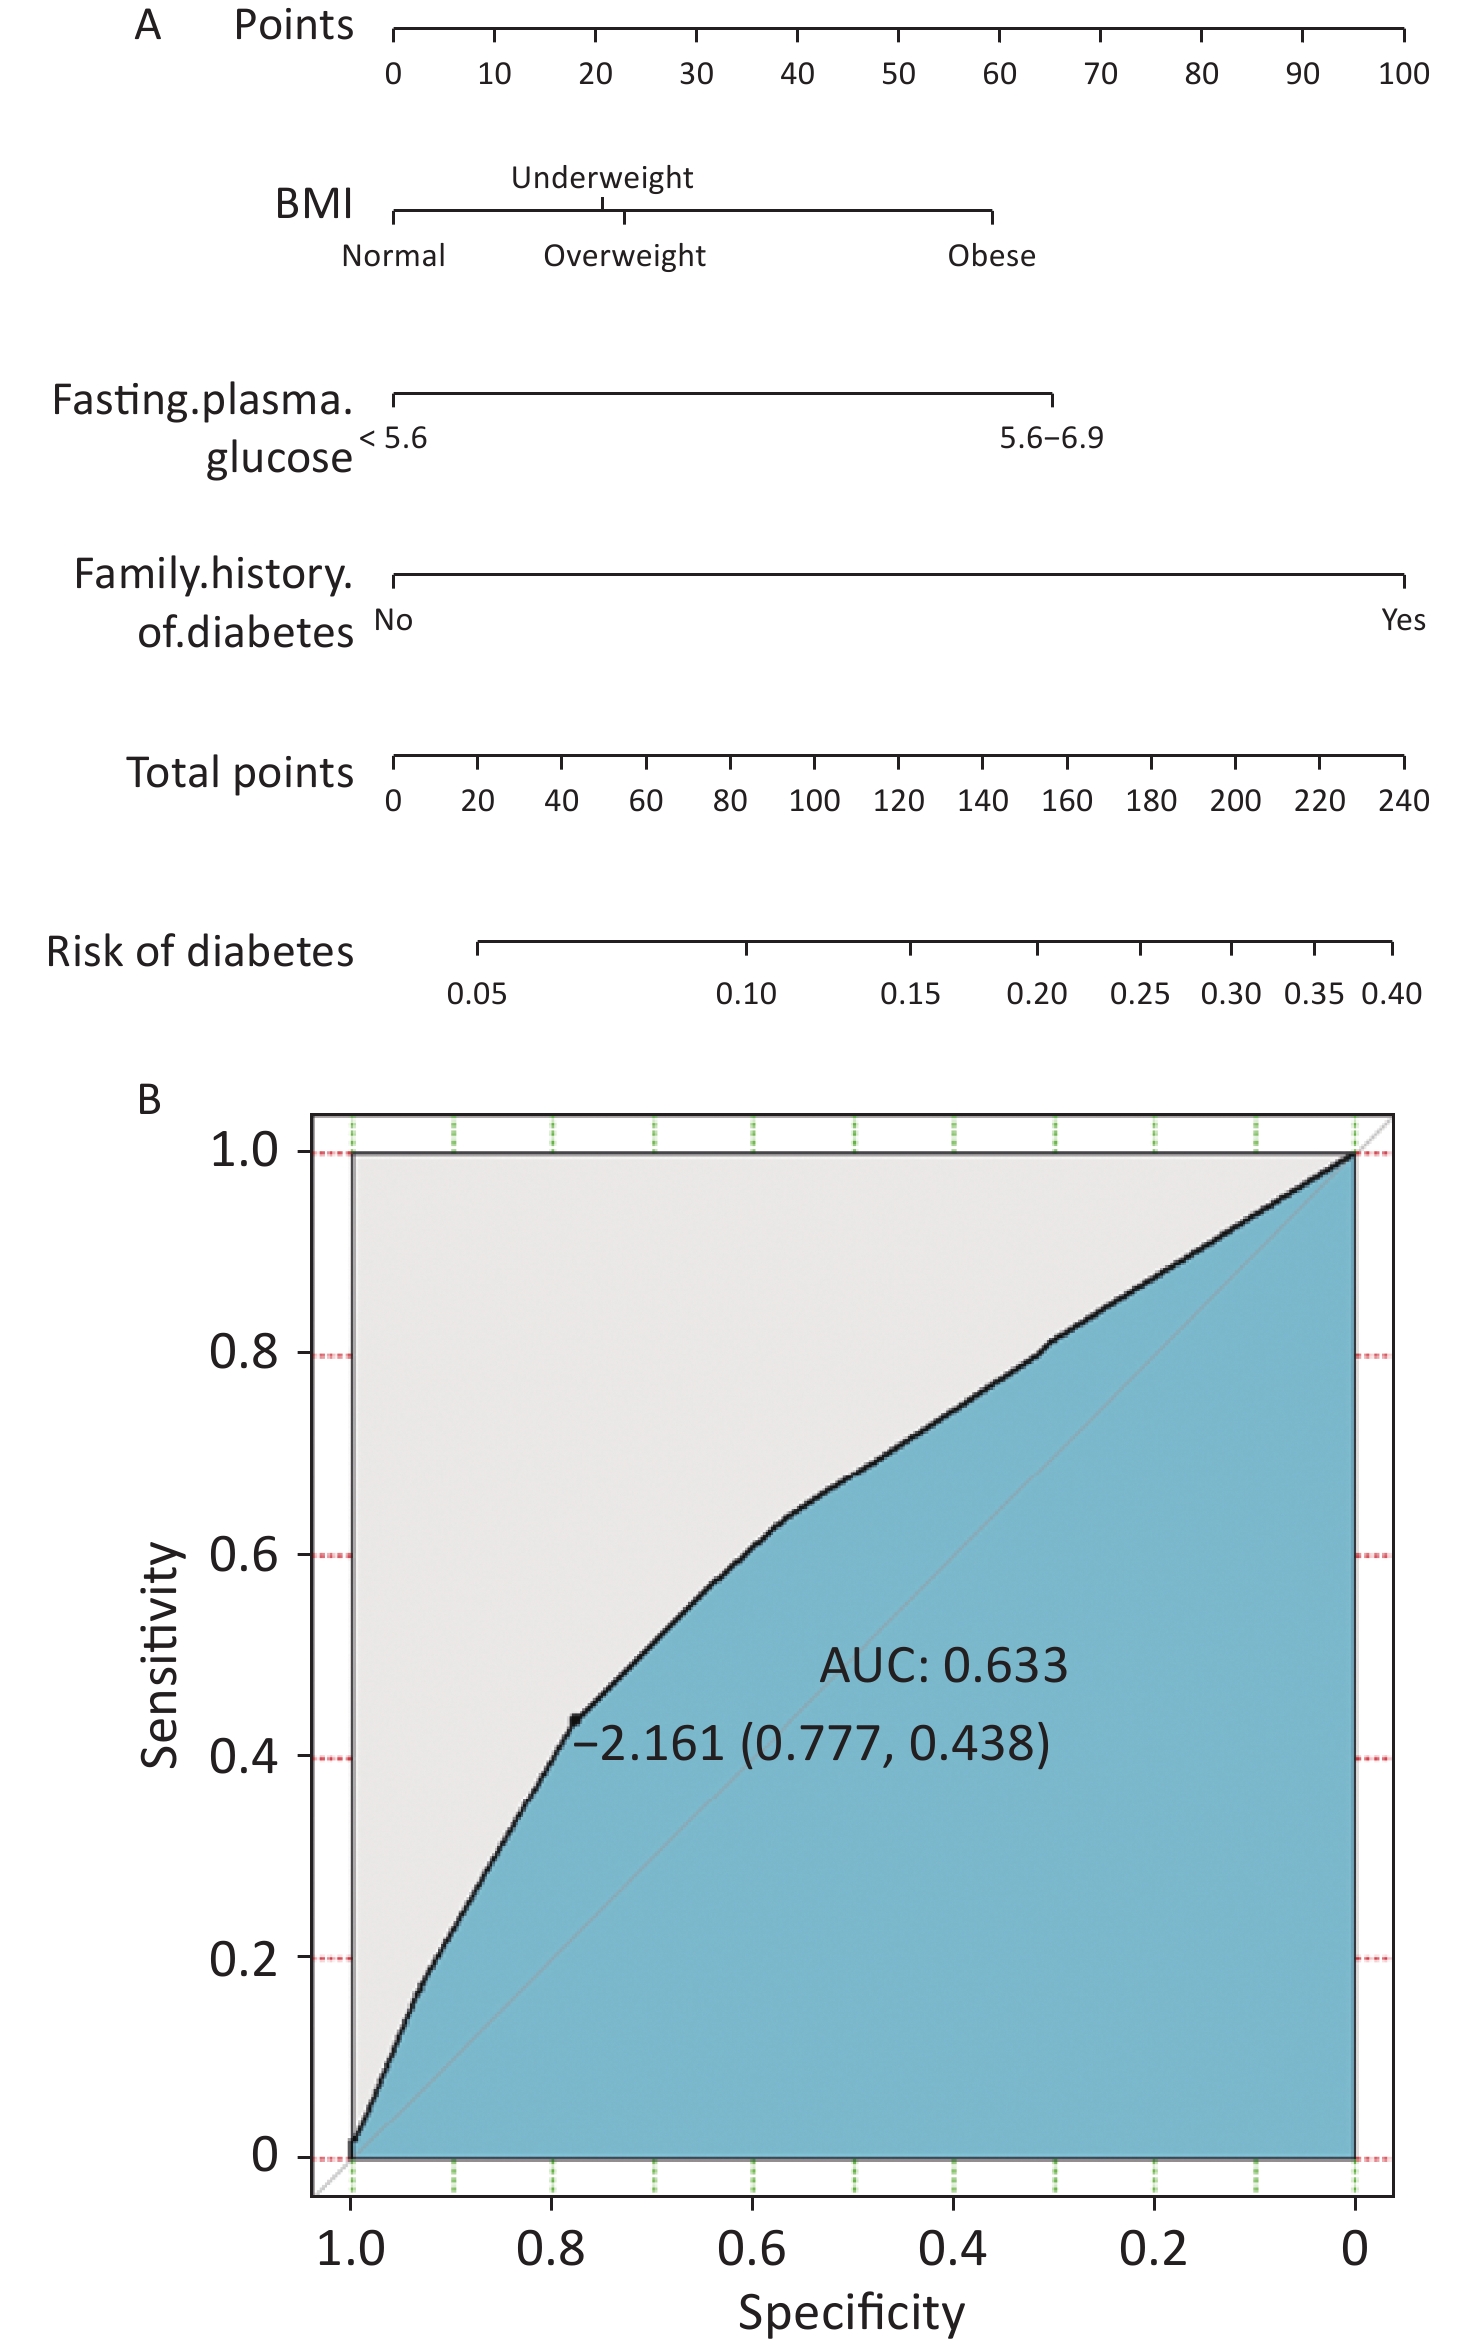
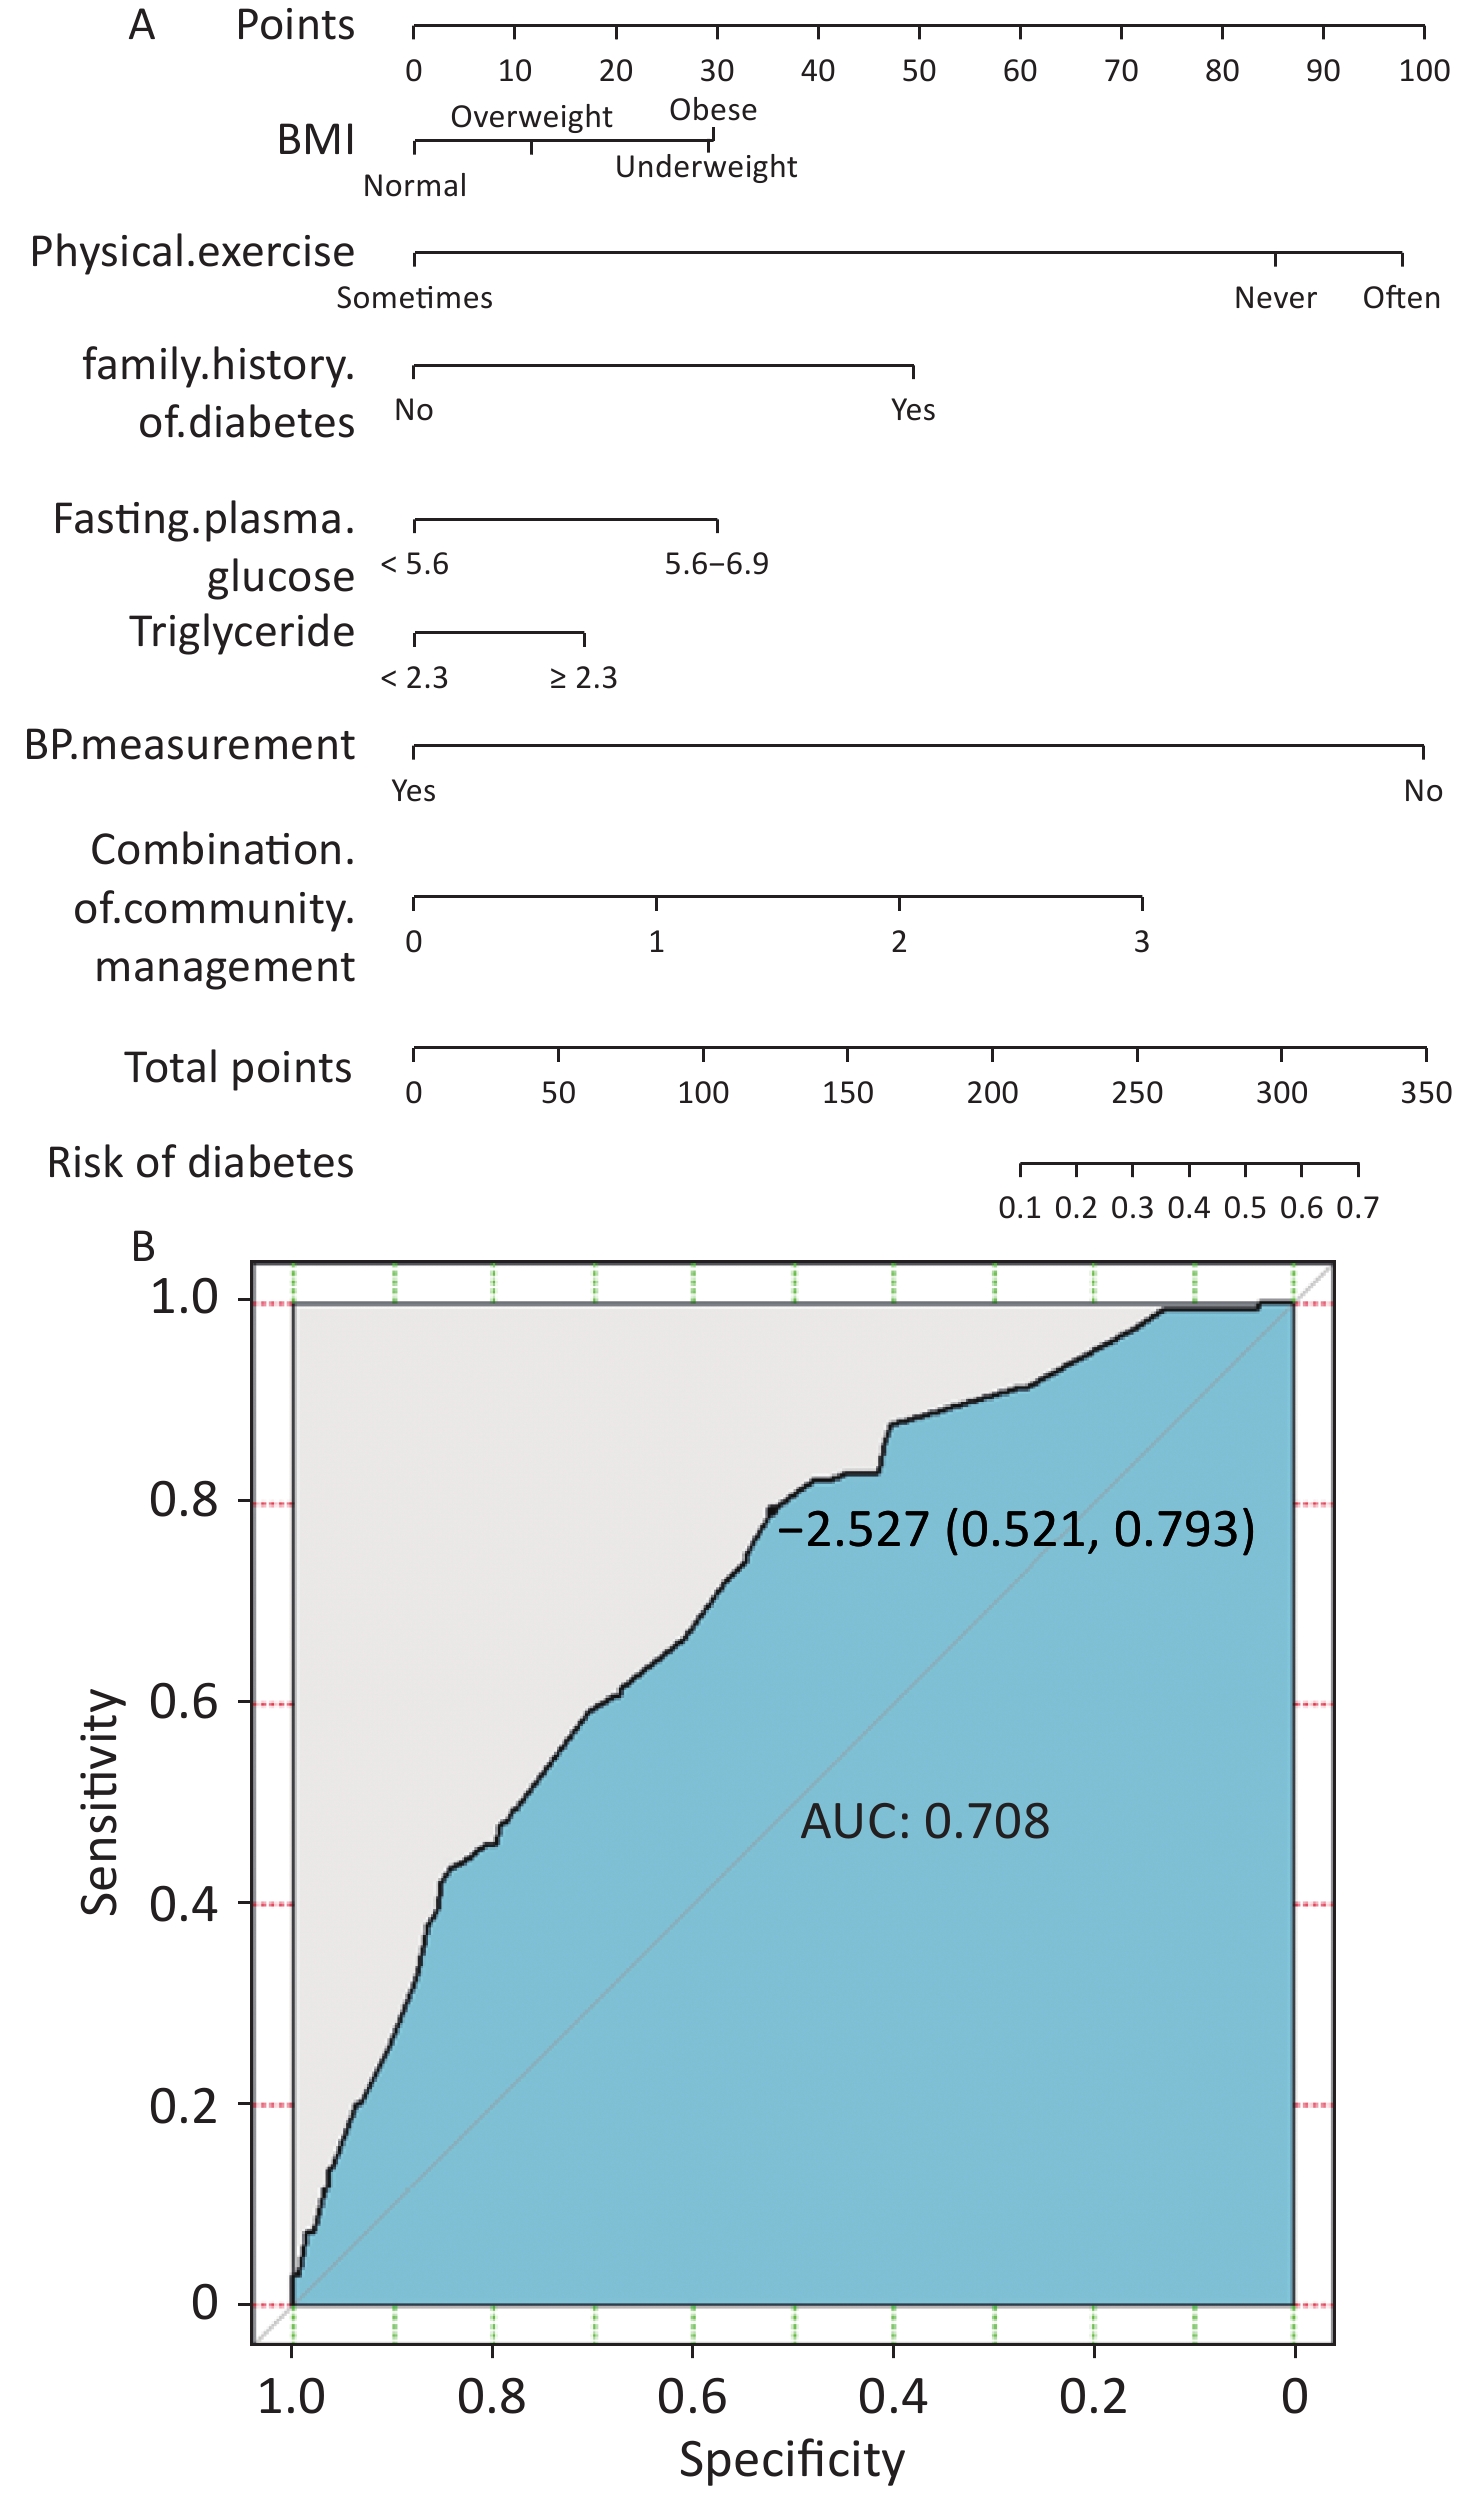
We constructed nomograms and ROC curves that document the optimal cutoff values (OCV) of ROC curves and C-indices to provide effective and reliable guides for diabetes prevention [for participants with prehypertension and hypertension, OCV = −2.161, C-indices = 0.633 (Supplementary Figure S2, available in www.besjournal.com); for participants with prehypertension, OCV = −2.838, C-indices = 0.638 (Supplementary Figure S3, available in www.besjournal.com); for participants with hypertension, OCV = −2.527, C-indices = 0.708 (Supplementary Figure S4, available in www.besjournal.com)].
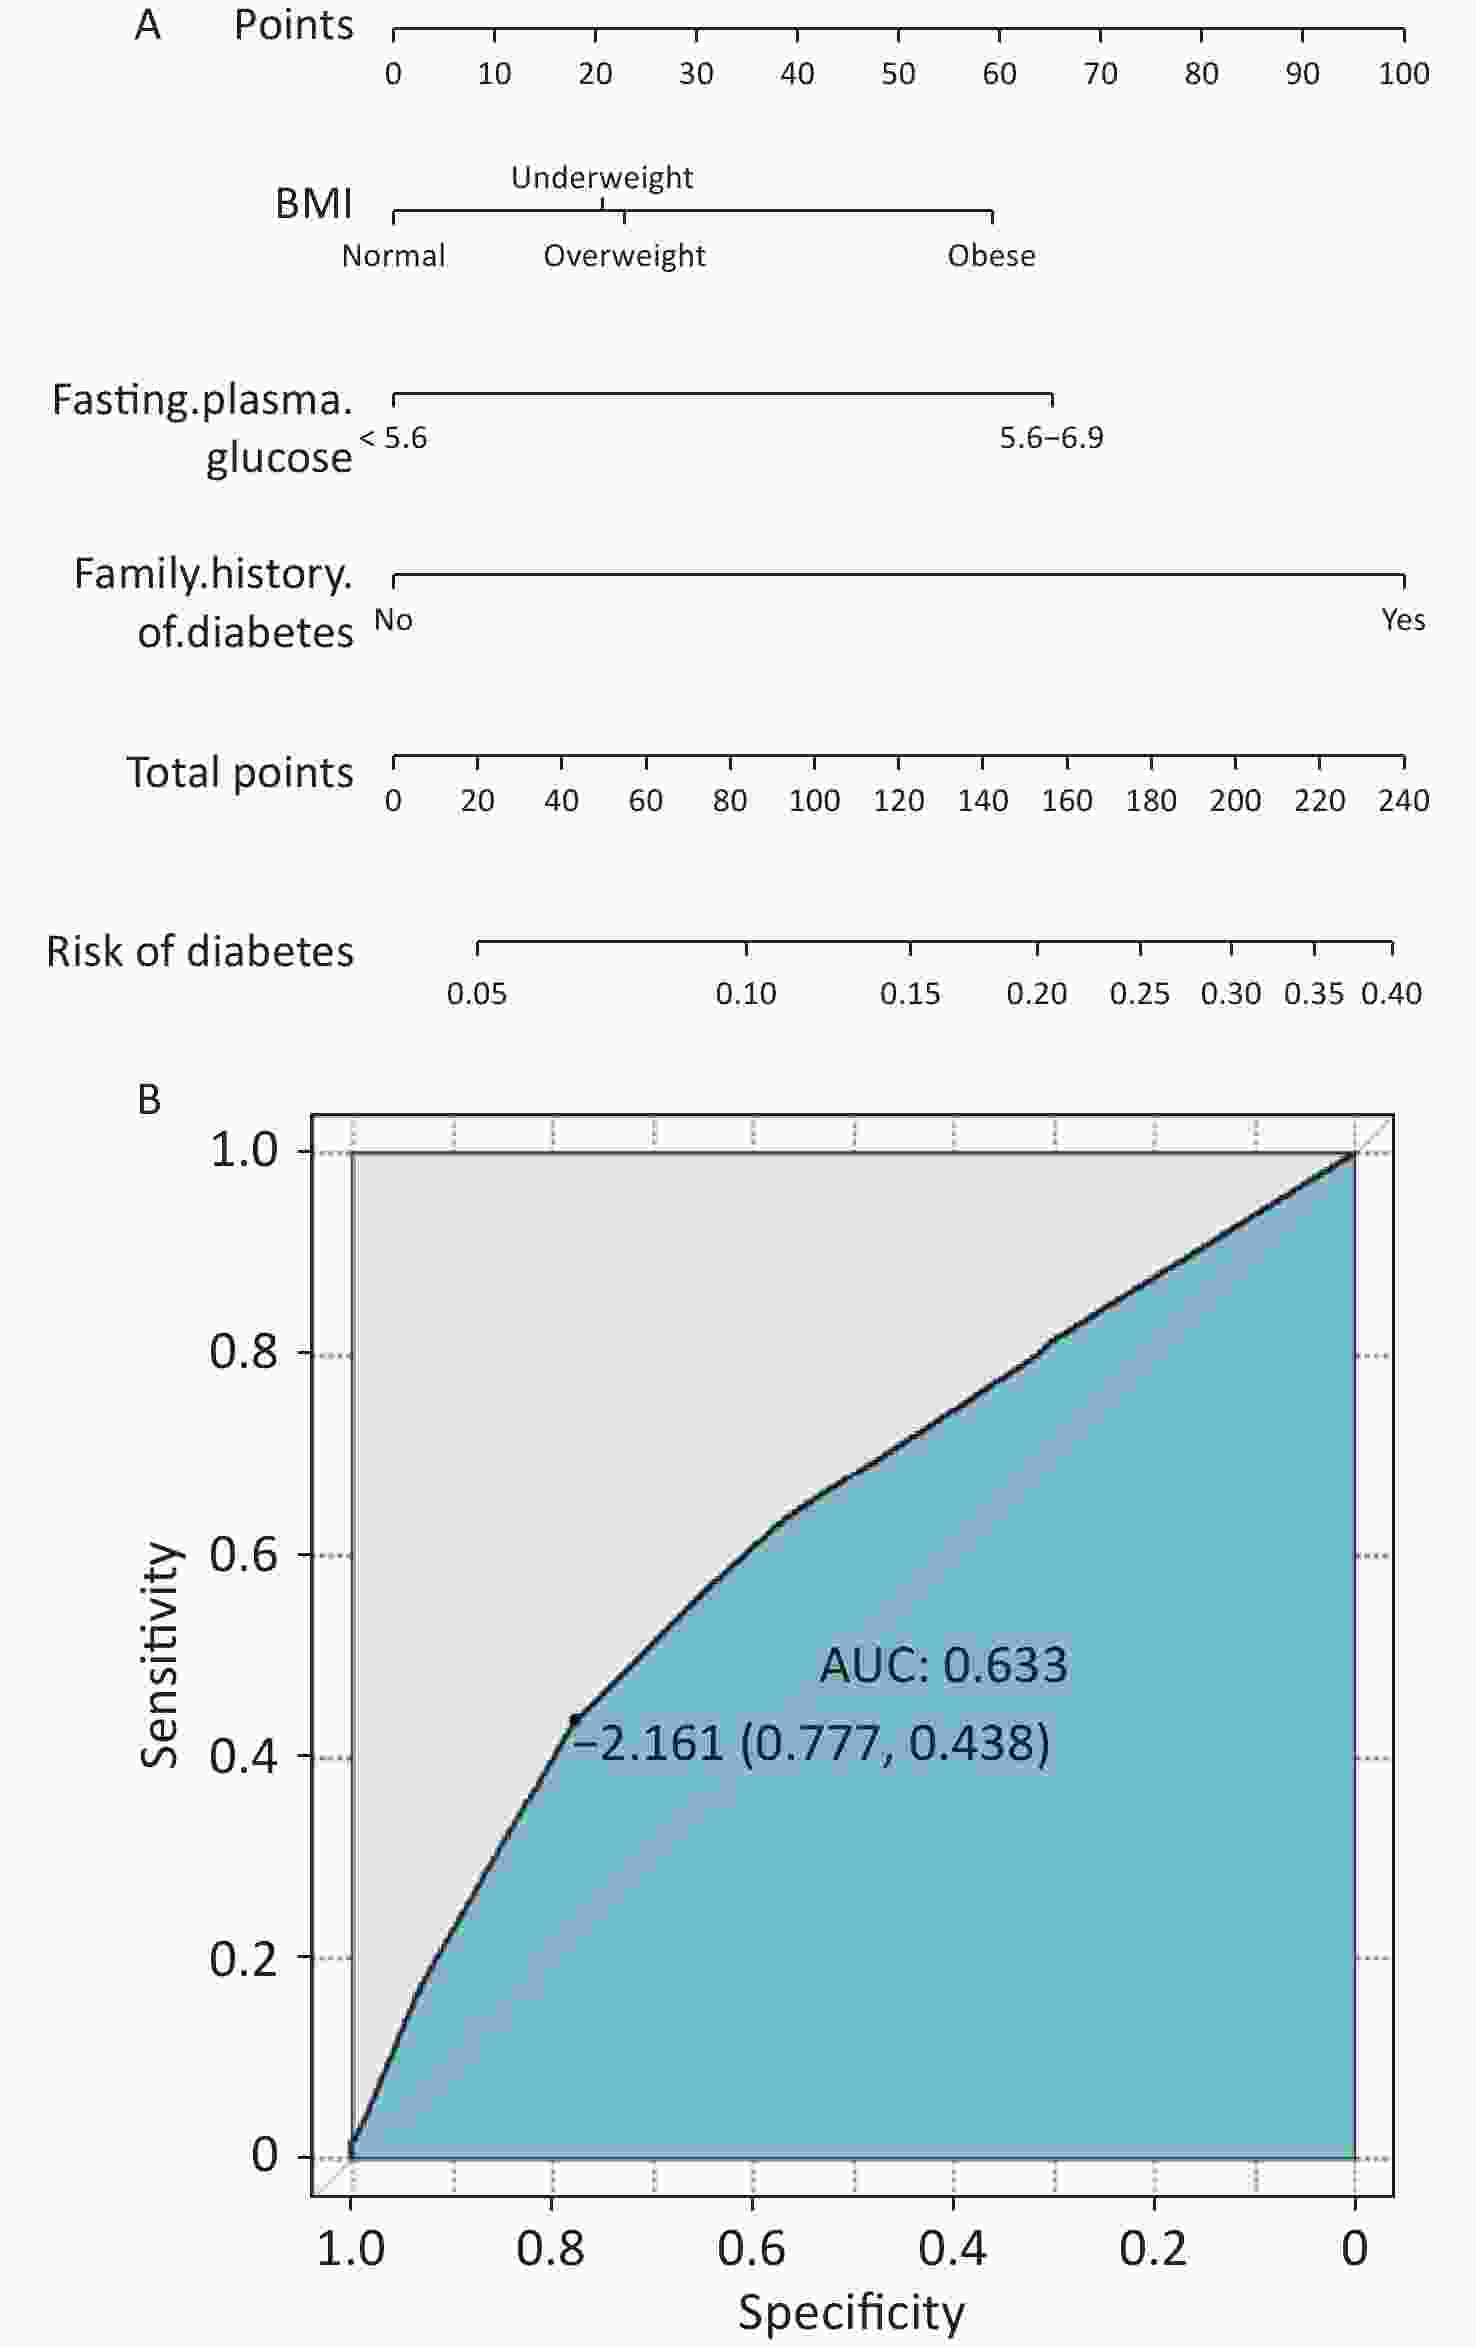
Figure S2. Nomograms (A) and ROC (B) curves for prehypertensive and hypertensive participants.
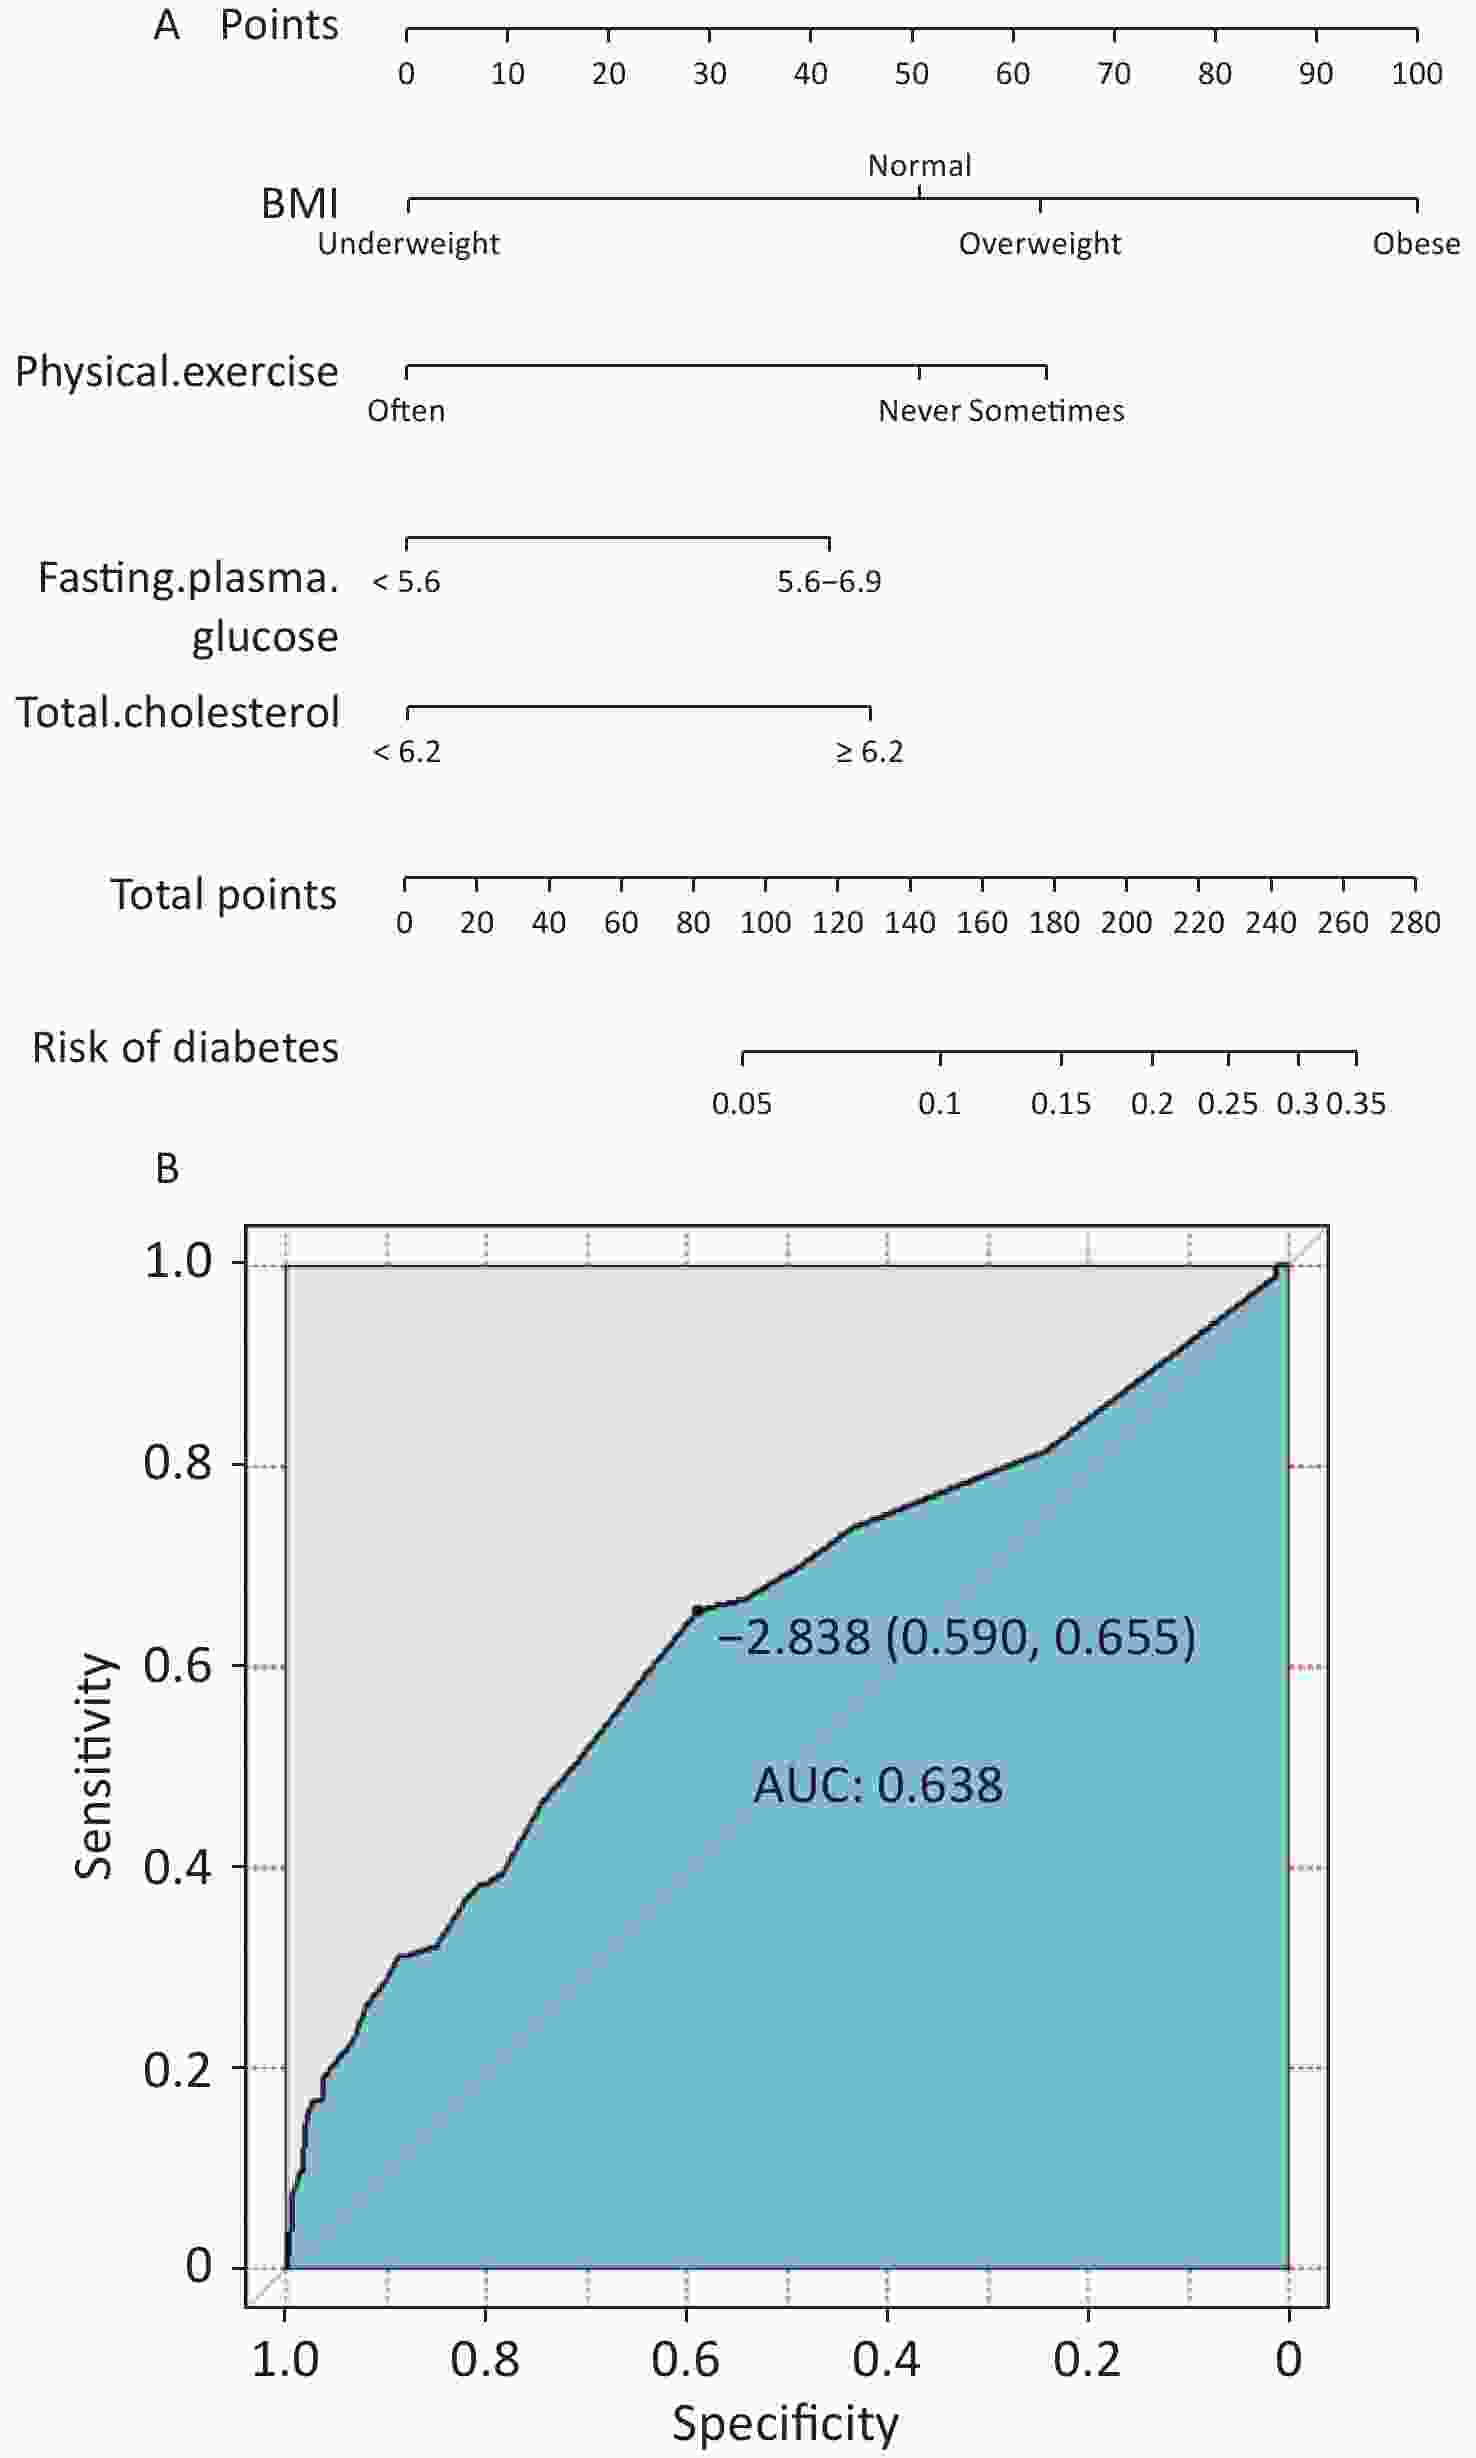
Figure S3. Nomograms (A) and ROC (B) curves for prehypertensive participants.
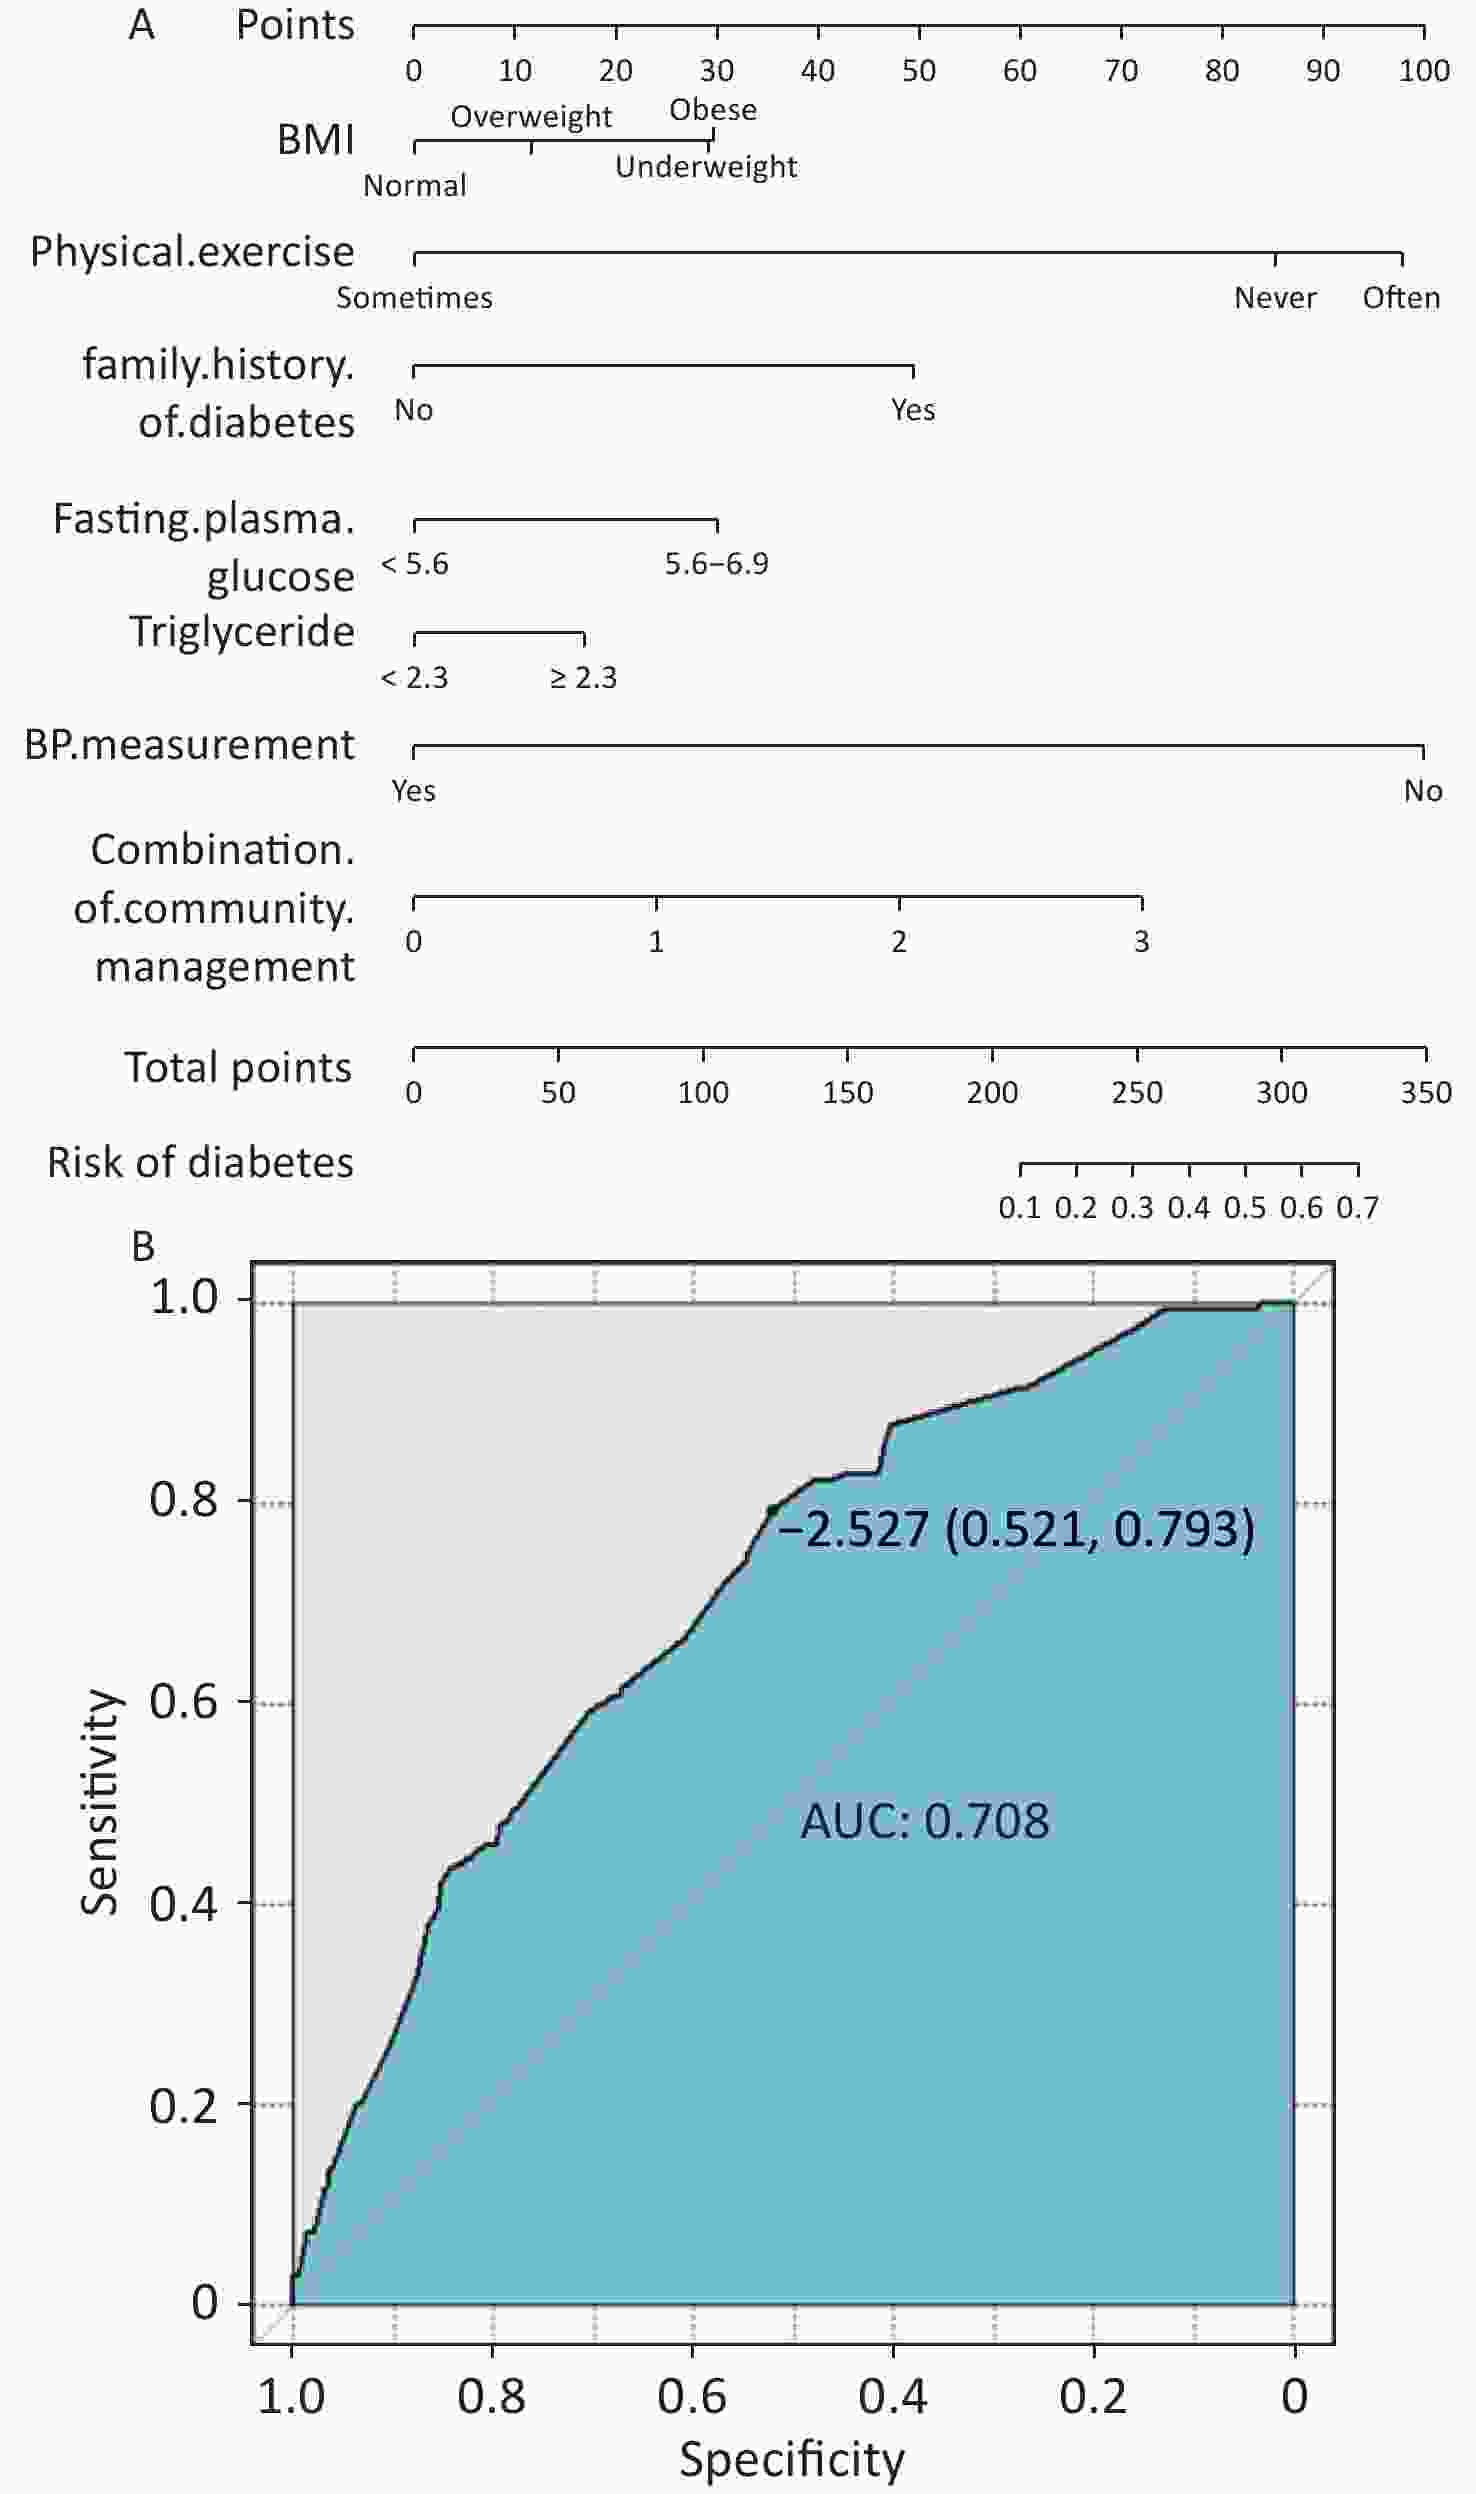
Figure S4. Nomograms (A) and ROC (B) curves for hypertensive participants.
Of the 1,674 participants with hypertension, 140 had developed diabetes after 2 years, of whom 84 did not take antihypertensive medication. Antihypertensive medication decreased the tendency from non-diabetes to diabetes (RR = 0.704, 95% CI: 0.504–0.983, P = 0.039) (Supplementary Table S6, available in www.besjournal.com).
Group Total (n = 1,674) Diabetes (n = 140), n (%) Adjusted RR (n = 168), n (%) P value Without antihypertensive medication 556 56 (10.1) 1 With antihypertensive medication 1,118 84 (7.5) 0.704 (0.504, 0.983) 0.039 Note. 1: the reference cell. Final model adjusted for age, sex, education level, marital status, annual income, ethnicity, smoking, drinking, physical activity, BMI, stroke, coronary heart disease, family history of hypertension, family history of stroke, family history of diabetes, family history of coronary heart disease, TG, TC, HDL-C, LDL-C, and FPG. Table S6. Association between the use of antihypertensive medication in hypertensive individuals at baseline and diabetes, estimated by Poisson regression
This study documented that the risks of diabetes in the participants with hypertension are significantly higher than those in the prehypertensive ones, indicating the connection between antihypertensive medication and decreased tendency from non-diabetes to diabetes in participants with hypertension. This study had limitations. Firstly, the participants were only classified according to baseline data of initial enrollment. Secondly, we failed to explore the potential impact of different types of antihypertensive medications on diabetes.
Availability of Data and Materials The datasets used and analyzed during the current study are available from the corresponding author upon reasonable request.
Ethics Approval and Consent to Participate This project was approved by the Ethics Committee of China Medical University. Each participant provided informed consent.
Consent for Publication Not applicable.
Competing Interests All authors: no conflicts of interest to disclose.
Authors’ Contributions Conception and design: LIANG Zhuo Shuai, SHI Ji Kang, CHENG Yi, and LIU Ya Wen. Collection and assembly of data: LIANG Zhuo Shuai, SHI Ji Kang, REN Ya Xuan. Data analysis and interpretation: TIAN Yu Yang, HU Xin Meng, LIU Sai Nan, WANG Yu Jian. Manuscript writing: LIANG Zhuo Shuai. Revised the language/article: All authors. Final approval of manuscript: All authors.
Acknowledgments The authors acknowledge all the patients who participated in the study. The authors are also grateful to FENG Mengmeng for her contributions to table modification. Authors’ Information Not applicable.
HTML
 22209Supplementary Materials.pdf
|

|

 Quick Links
 DownLoad: