


-
Ambient pollutants are a major environmental risk factor for human health[1]. Ozone (O3) is a highly reactive, oxidative gas that is formed through the interaction of volatile organic compound precursors and nitrogen oxides (NOx). Several studies have demonstrated that exposure to ambient O3 in the troposphere is associated with increased mortality. A study in the United States found that an increase in nonaccidental mortality among all age groups was associated with increased O3 concentrations[2]. Research in some European countries has also shown that short-term O3 exposure contributes to nonaccidental death[3]. Related studies have been conducted in Asian countries. A multicenter time series study conducted in 21 major cities in East Asia provided strong evidence of a significant association between short-term O3 exposure and mortality[4]. In China, due to the increase in motor vehicle ownership, O3 pollution has become a major public health concern. However, few epidemiological studies on the health effects of O3 in Chinese cities have been conducted due to a lack of long-term observational data. Given that the aforementioned studies were only conducted in large cities, the generalizability of the results is unclear. Therefore, in this study, a time series analysis was carried out in Harbin, a city in northeast China, to assess the effect of O3 on mortality using data from 2014 to 2016. The findings of this study may be useful as reference for policies that mitigate the negative health effects of O3 in northeast China.
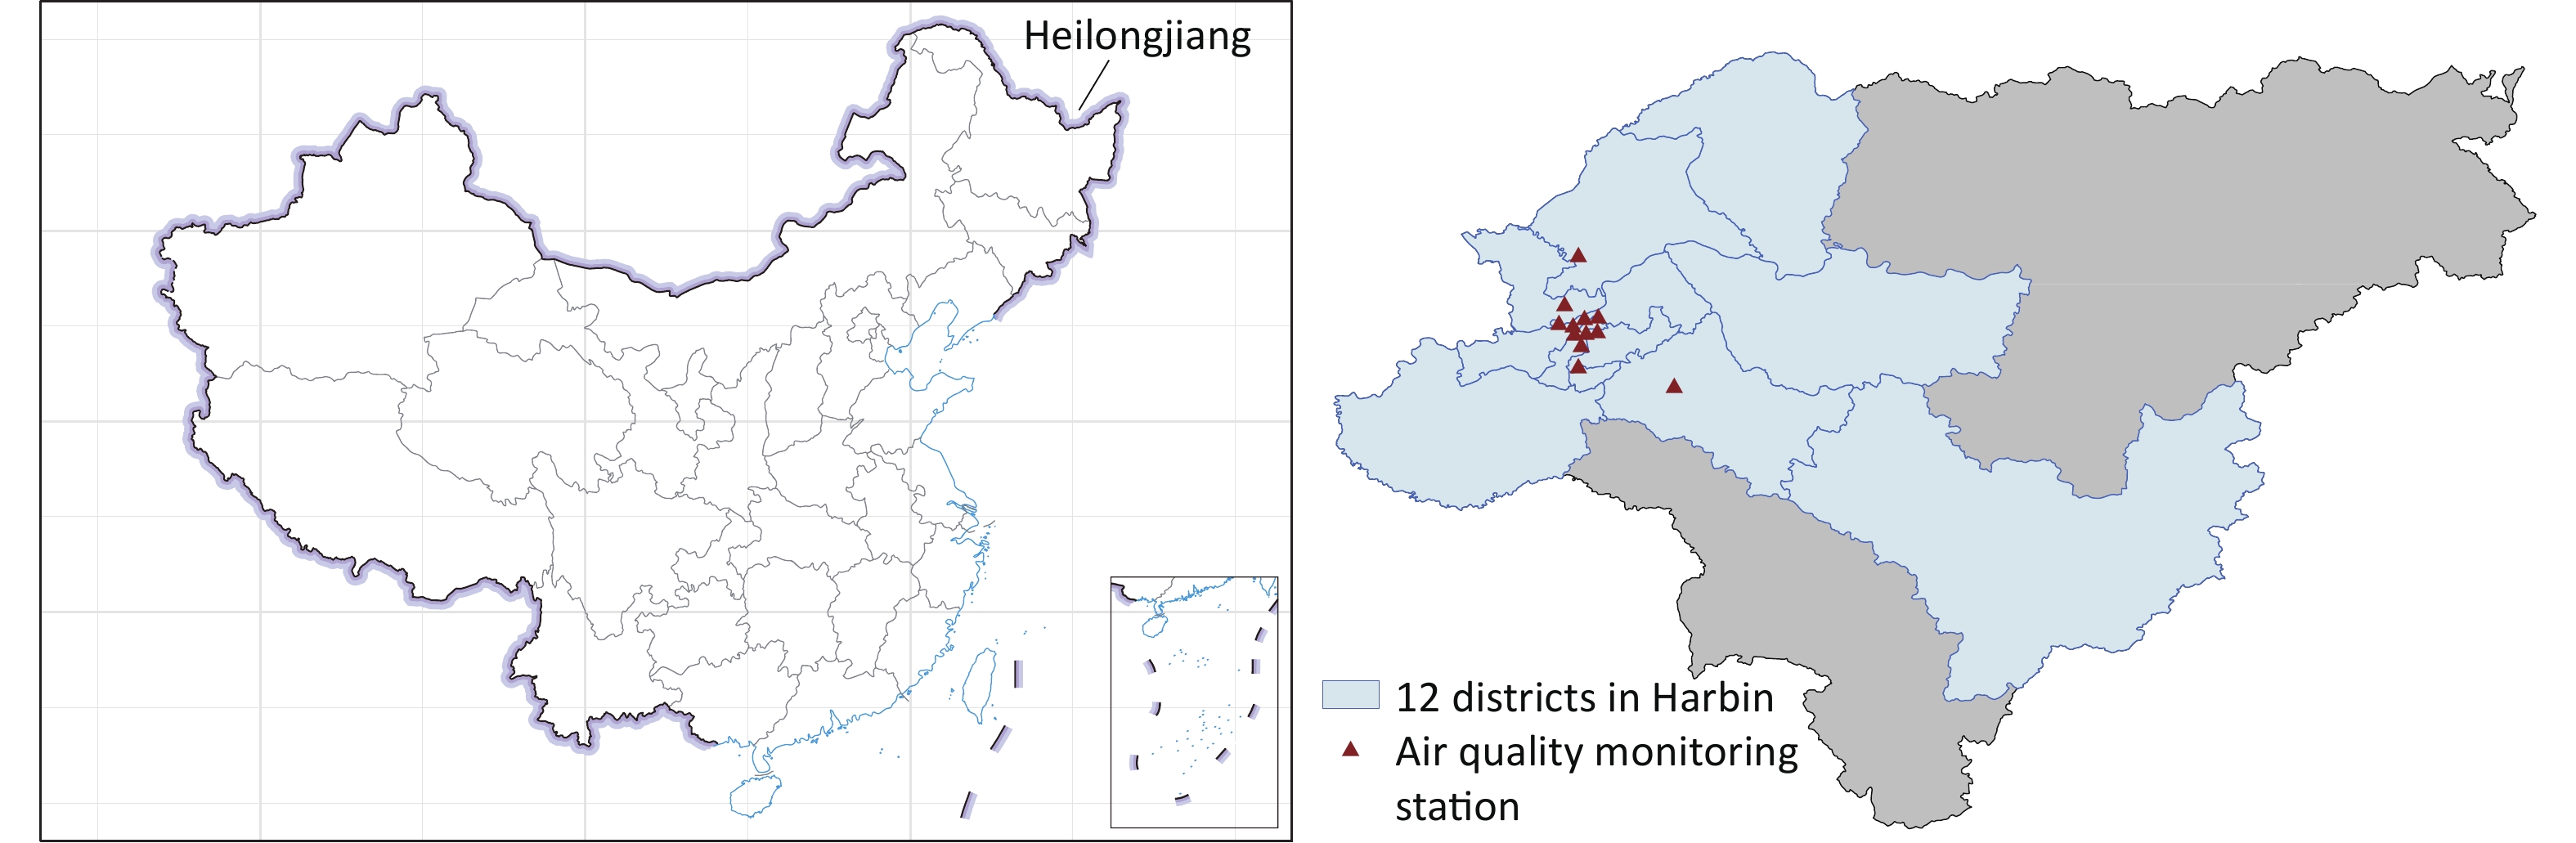
This study included 12 districts in Harbin (Supplementary Figure S1 available in www.besjournal.com). Daily nonaccidental mortality data were acquired from Heilongjiang Provincial Center for Disease Control and Prevention. The causes of death were classified on the basis of the International Classification of Diseases, 10th edition (ICD-10). Only nonaccidental diseases (ICD-10: A00-R99) were included in this study. Air pollutant data were obtained from the Harbin Environmental Monitoring Center. The data collected by the Harbin Environmental Monitoring Center were retrieved from air quality monitoring stations located in Harbin. Less than 3.5% of the data from the monitoring stations were missing. Daily pollutant data were the average of the observations from all stations in Harbin. Missing data were replaced with the average of the observations from the remaining monitoring stations on the same day. The O3 concentration used in this study was the daily maximum of the 8-hour running average concentration, and for other pollutants, 24-hour average concentrations were used. Daily meteorological data during the study period were collected from Harbin Meteorological Bureau.
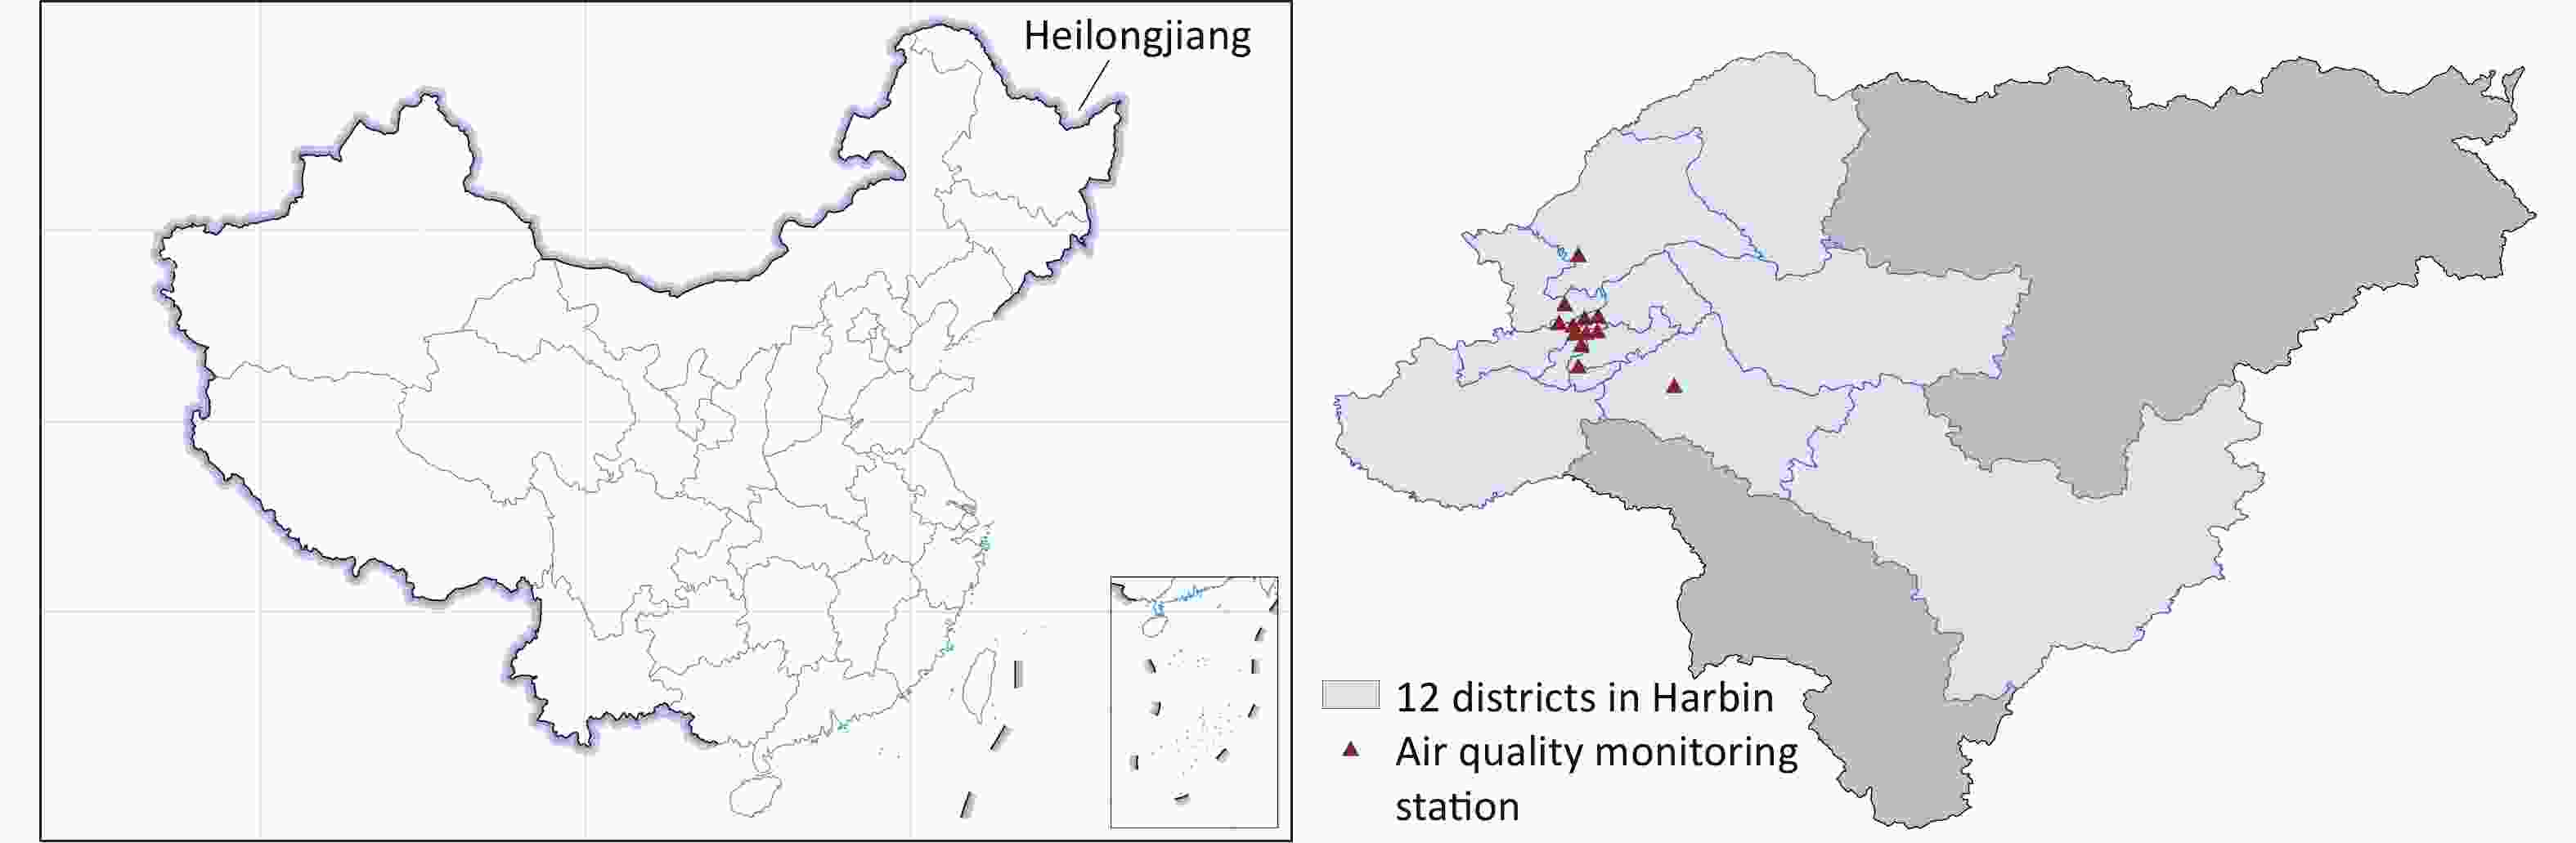
Figure S1. Location of Heilongjiang province and distribution of monitoring sites in Harbin
The association between daily nonaccidental mortality and O3 concentration during 2014–2016 was evaluated using the following model (Equation 1):
$$ {\text{Log}}[{E}{(}{t{Y}}_{{i}}{)}]=\alpha+{Holiday}+{DOW}+{\beta}{{X}}_{{i}}+{s}({time}{,}{df})+{s}({t{Z}}_{{i}}{,}{df}) $$ (1) where
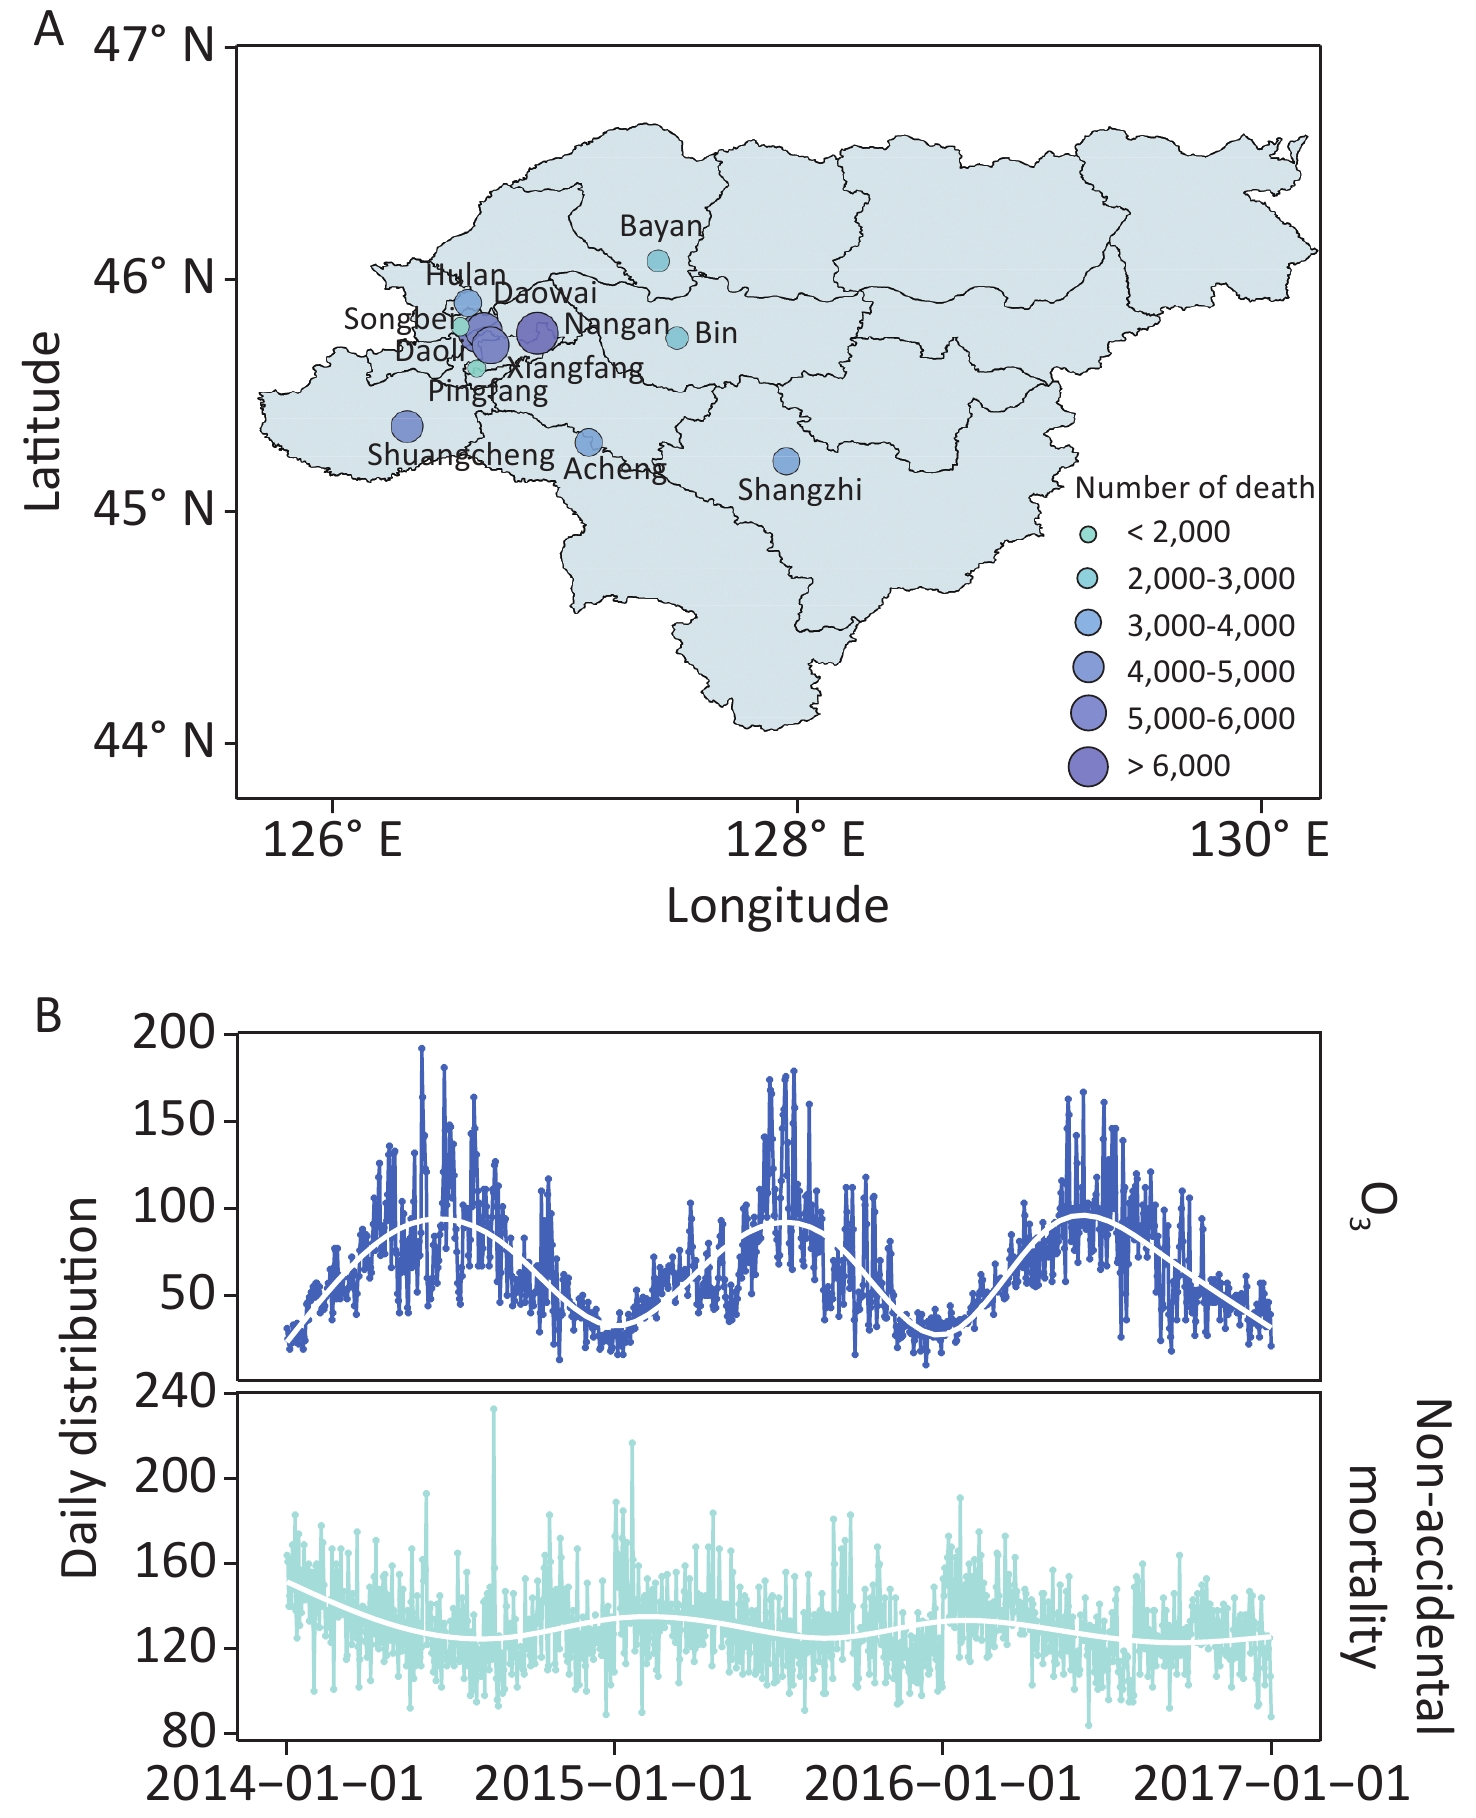
$ E\left({Y}_{i}\right) $ refers to the predicted number of deaths on day i;$ \alpha $ is the intercept term; Holiday and DOW denote adjustments for public holidays and the day of the week, respectively;$ \beta $ is the regression coefficient;$ {X}_{i} $ represents the O3 concentration on day i; s(time, df) and s($ {Z}_{i} $ , df) refer to the spline function of calendar time and meteorological factors, respectively; and df in the spline function represents the degree of freedom. We used the Akaike information criterion to determine the df corresponding to the optimal model fitting. Considering the potential lagged effects of pollutants on mortality, both single-day lag (lag 0 to lag 6: lag 0 is the exposure of the current day and lag 6 is the exposure from 6 days prior) and multiday lag (lag 01 to lag 06: the moving average of the current and prior 1–6 days) structures were analyzed. We also fitted multipollutant models to assess the collinearity between pollutants. After identifying the optimal number of days of lag, the effect of O3 on mortality was calculated by adding other pollutants to the model using natural cubic splines. Furthermore, the data were stratified by sex (female and male) and season (warm season: April–September, and cold season: October–March) for subgroup analyses. Two-sample Z tests were used to determine whether subgroup differences were statistically significant. All analyses were conducted using R version 3.6.1 (R Foundation for Statistical Computing, Vienna, Austria) with the mgcv package. Results are presented as relative risks (RRs) per interquartile range (IQR) increase in O3 concentration. All statistical tests were two-sided, and P values of < 0.05 were considered statistically significant.From 2014 to 2016 (1,096 days), 142,251 nonaccidental deaths (58,711 for females and 83,540 for males) were recorded in the study area. Supplementary Figure S2A (available in www.besjournal.com) shows the spatial distribution of mortality. During the study period, the mean daily number of nonaccidental deaths was 129.79 with a standard deviation of 0.53, and the mean daily maximum 8-hour concentration of O3 was 64.99 μg/m3 with a standard deviation of 0.93 (Supplementary Table S1 available in www.besjournal.com), which is less than the national grade II standard (160 µg/m3); however, the daily maximum was higher than the air quality standard of the World Health Organization (100 µg/m3) on 13% of the days in the study period. Time series analysis revealed a clear seasonal pattern in daily O3 concentrations and mortality. The concentration of O3 was higher in warm seasons than in cold seasons, whereas the daily death count was slightly lower in warm seasons than in cold seasons (Supplementary Figure S2B).
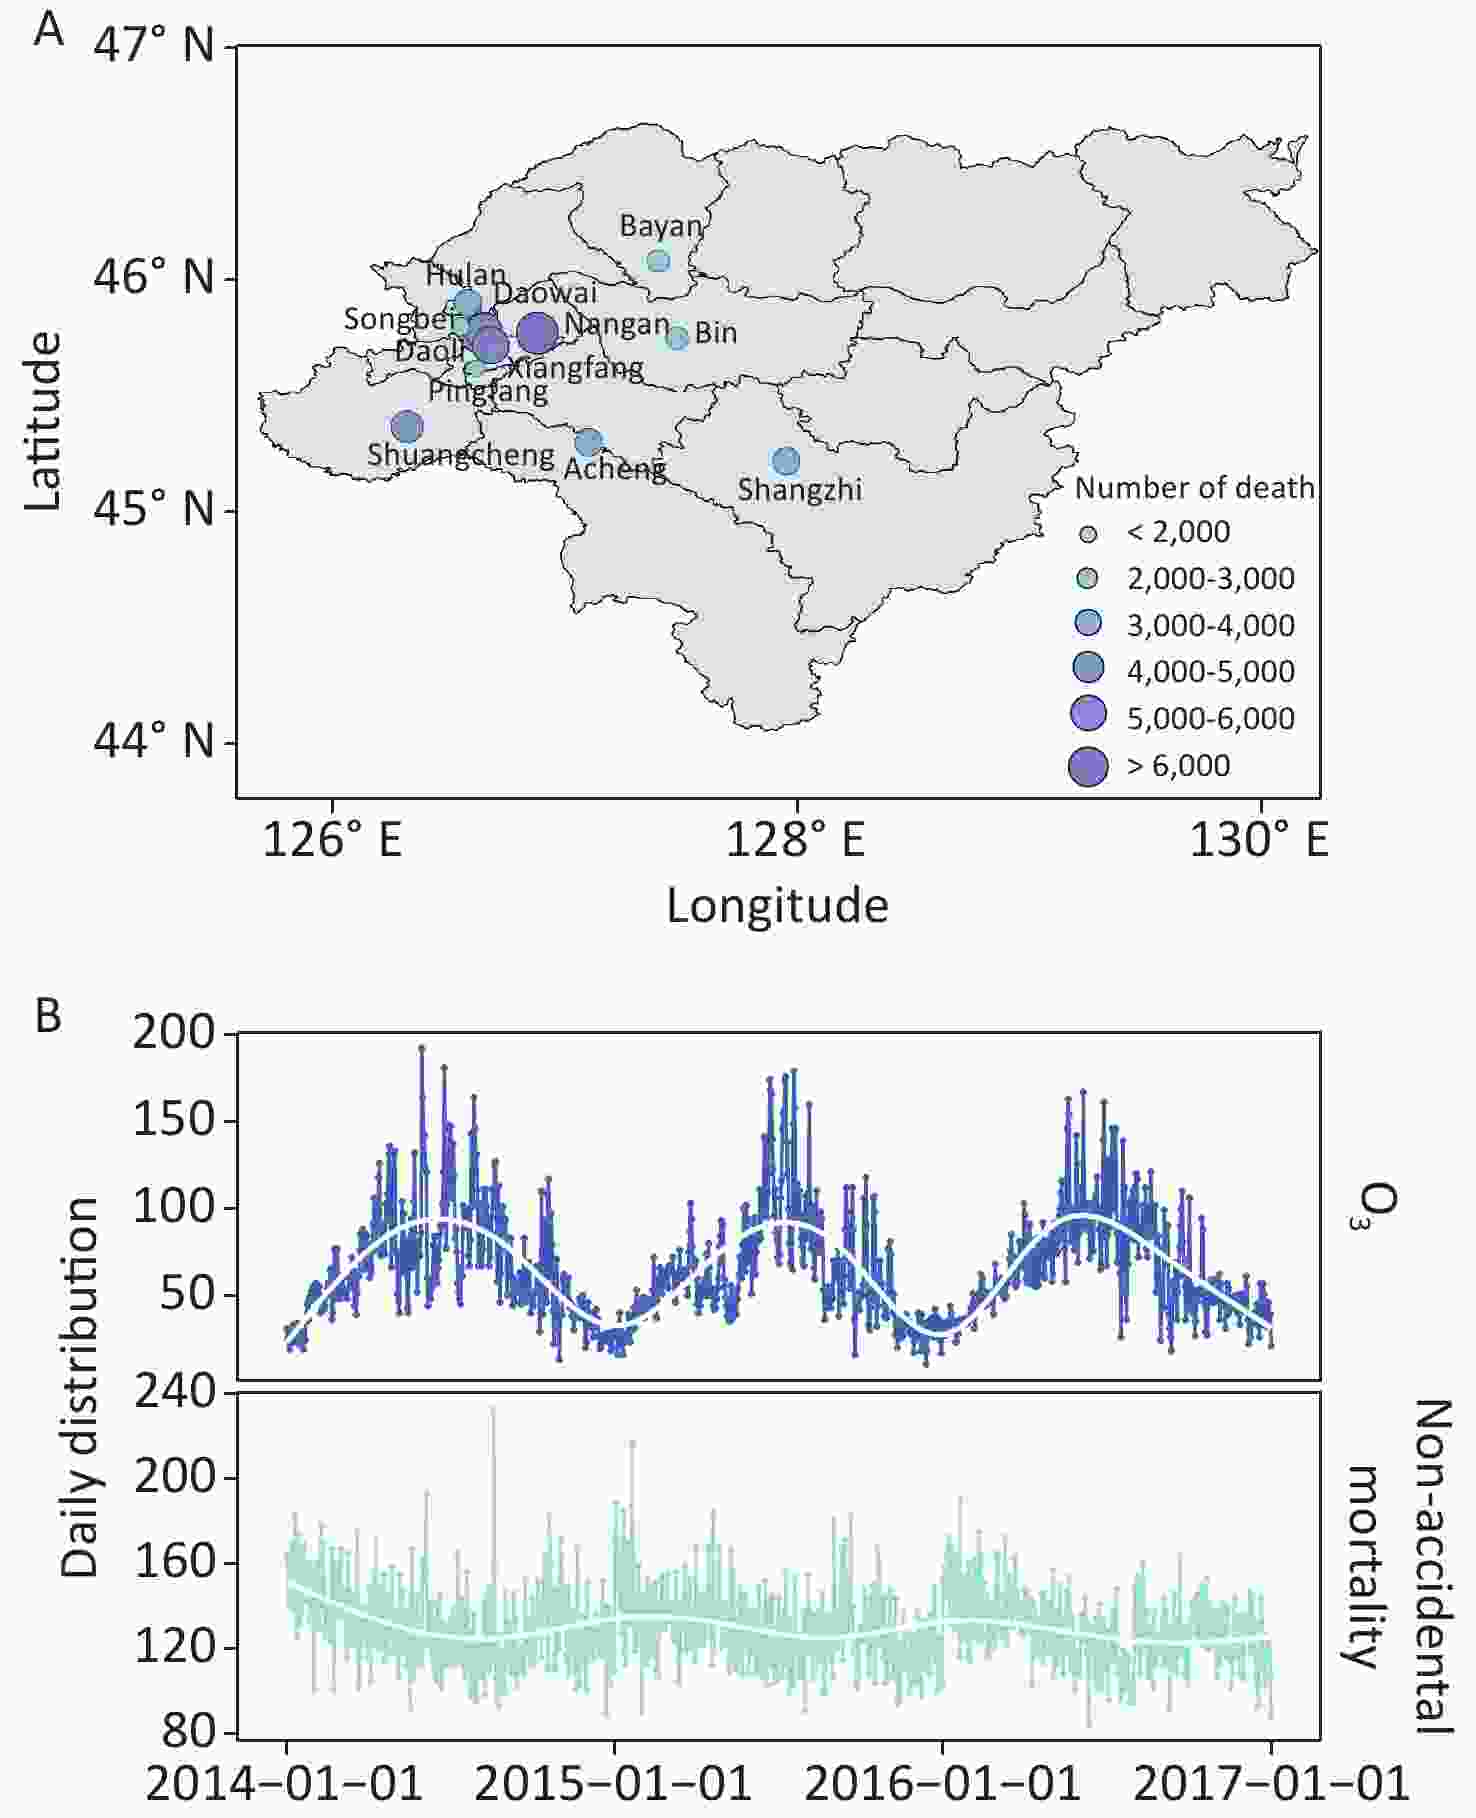
Figure S2. Spatial distribution of death (A) and time series (B) in Harbin, 2014–2016.
Variable Mean ± SD Minimum Maximum Percentile P25 P50 P75 The number of deaths Nonaccidental mortality 129.79 ± 0.53 84.00 233.00 118.00 128.00 140.00 Air pollutant concentrations O3 (μg/m3) 64.99 ± 0.93 10.00 192.00 43.00 58.00 83.00 NO2 (μg/m3) 48.50 ± 0.63 15.00 145.00 34.00 43.00 59.00 SO2 (μg/m3) 41.10 ± 1.36 3.00 234.00 9.00 21.00 61.00 CO (mg/m3) 1.02 ± 0.01 0.40 4.30 0.70 0.90 1.20 PM2.5 (μg/m3) 64.20 ± 1.95 8.00 704.00 24.00 41.00 83.00 PM10 (μg/m3) 95.29 ± 2.23 16.00 628.00 47.00 72.50 122.00 Meteorological factors Temperature (°C) 5.28 ± 0.46 −26.10 29.00 −9.38 7.50 19.60 Air pressure (hPa) 1000.28 ± 0.29 973.20 1025.20 993.00 999.60 1007.60 Relative humidity (%) 65.39 ± 0.45 15.00 97.00 57.00 67.00 76.00 Wind speed (m/s) 8.84 ± 0.10 2.50 23.80 6.30 8.40 10.80 Precipitation (mm) 1.25 ± 0.12 0.00 53.90 0.00 0.00 0.10 Sunshine duration (h) 5.77 ± 0.12 0.00 14.10 2.40 6.20 8.80 Table S1. Descriptive analysis of the daily ambient pollutants, meteorological factors, and nonaccidental mortality in Harbin during 2014–2016
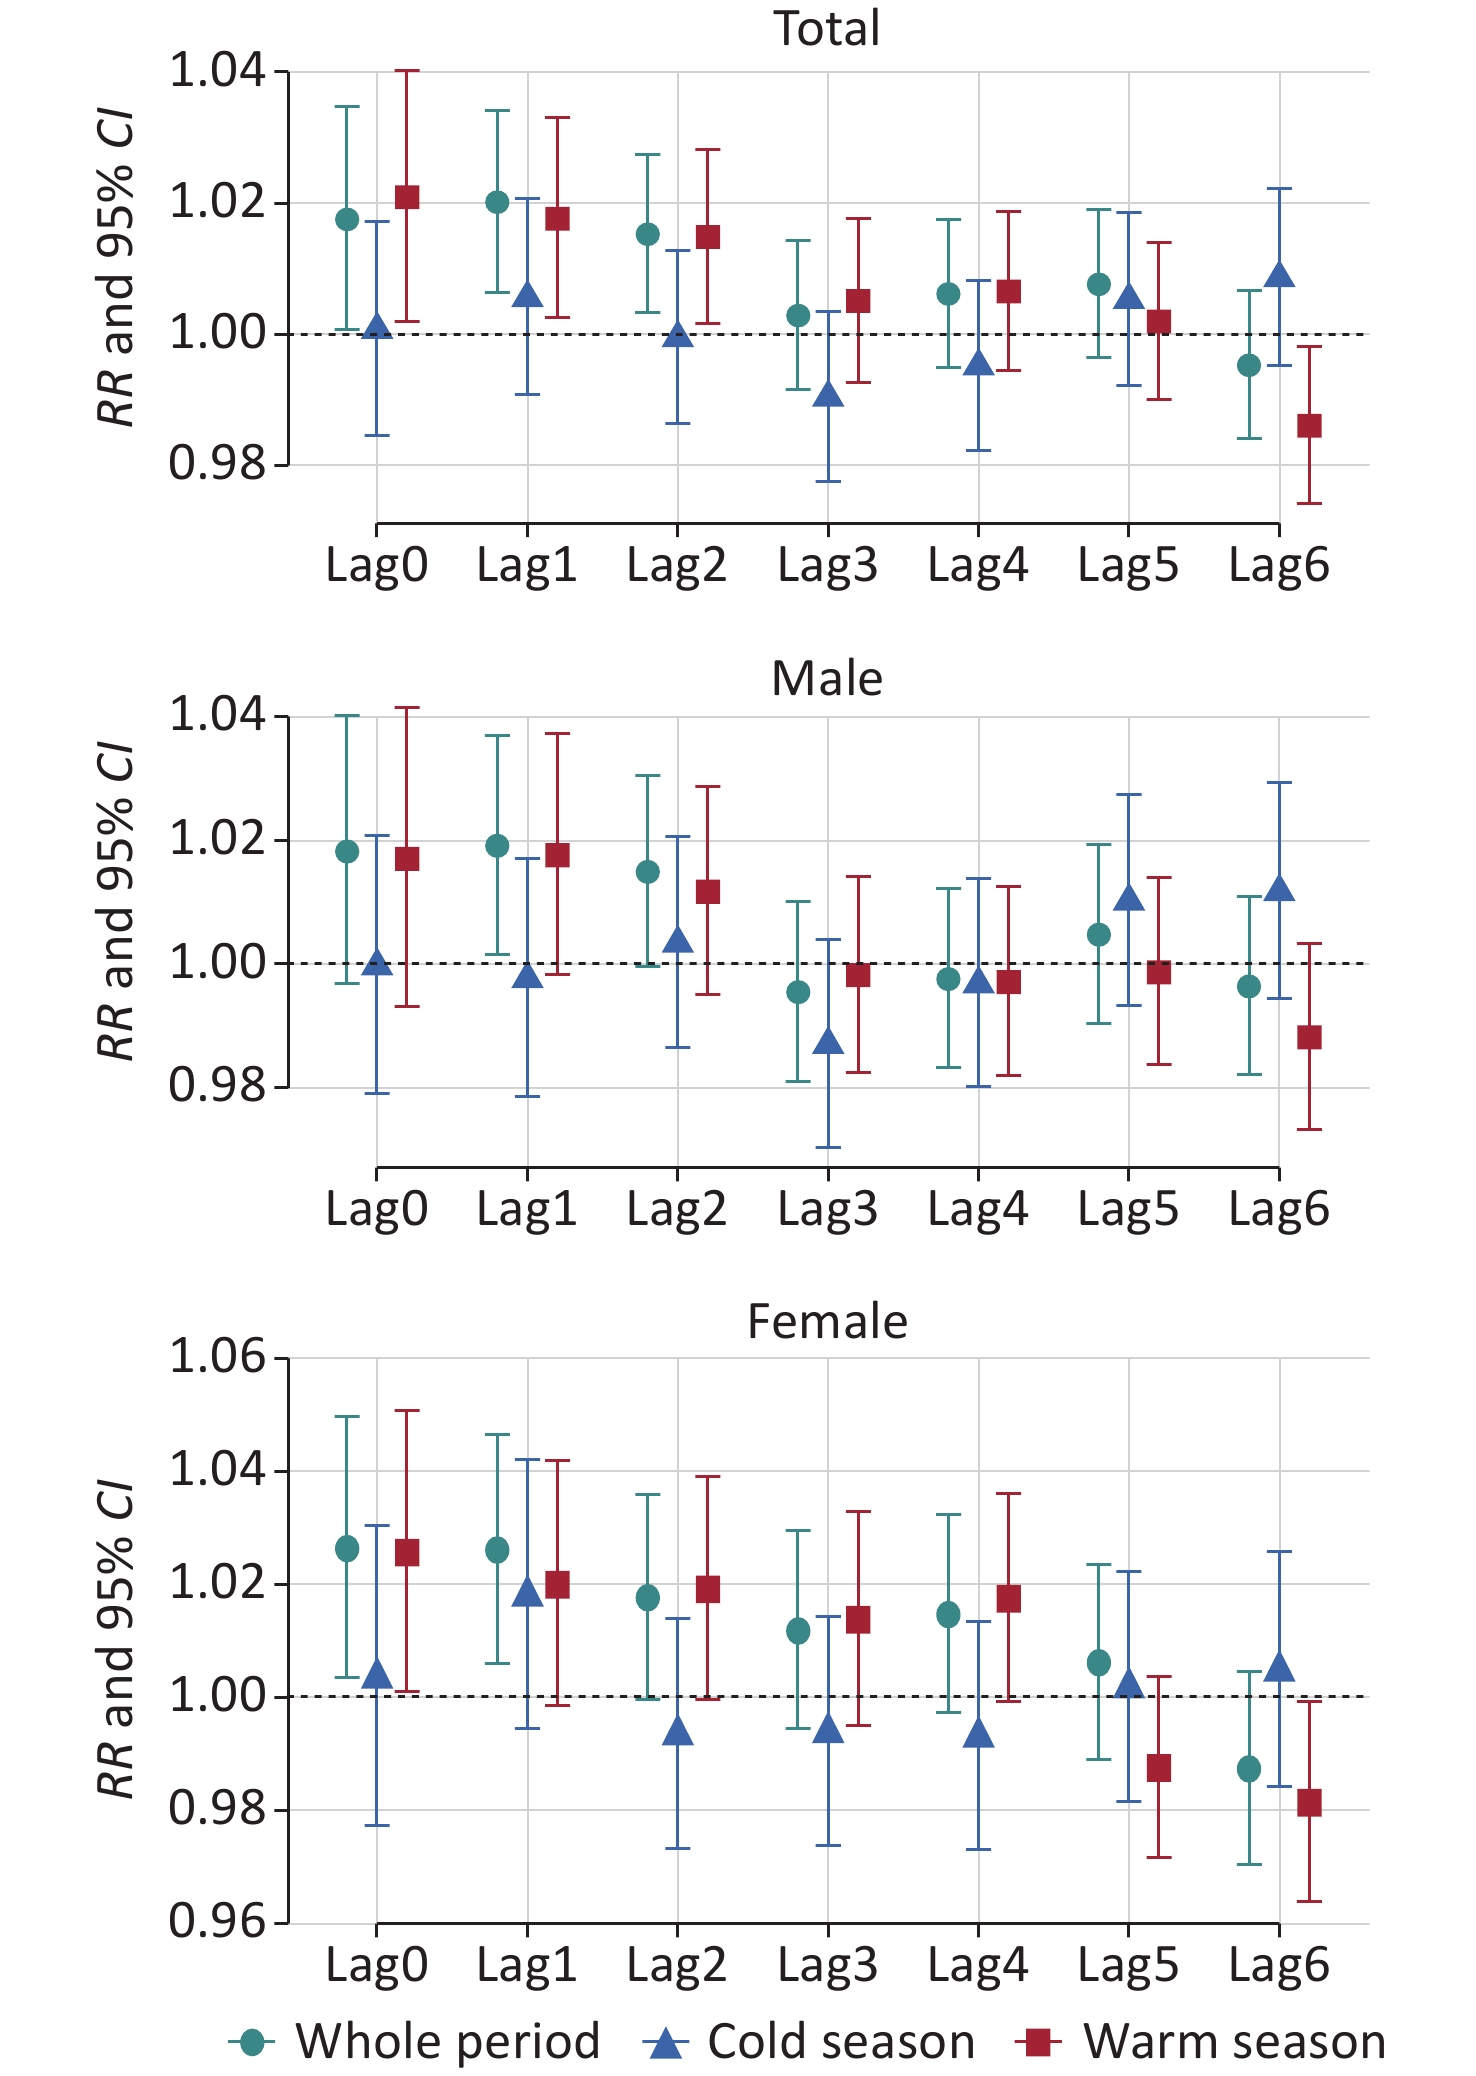
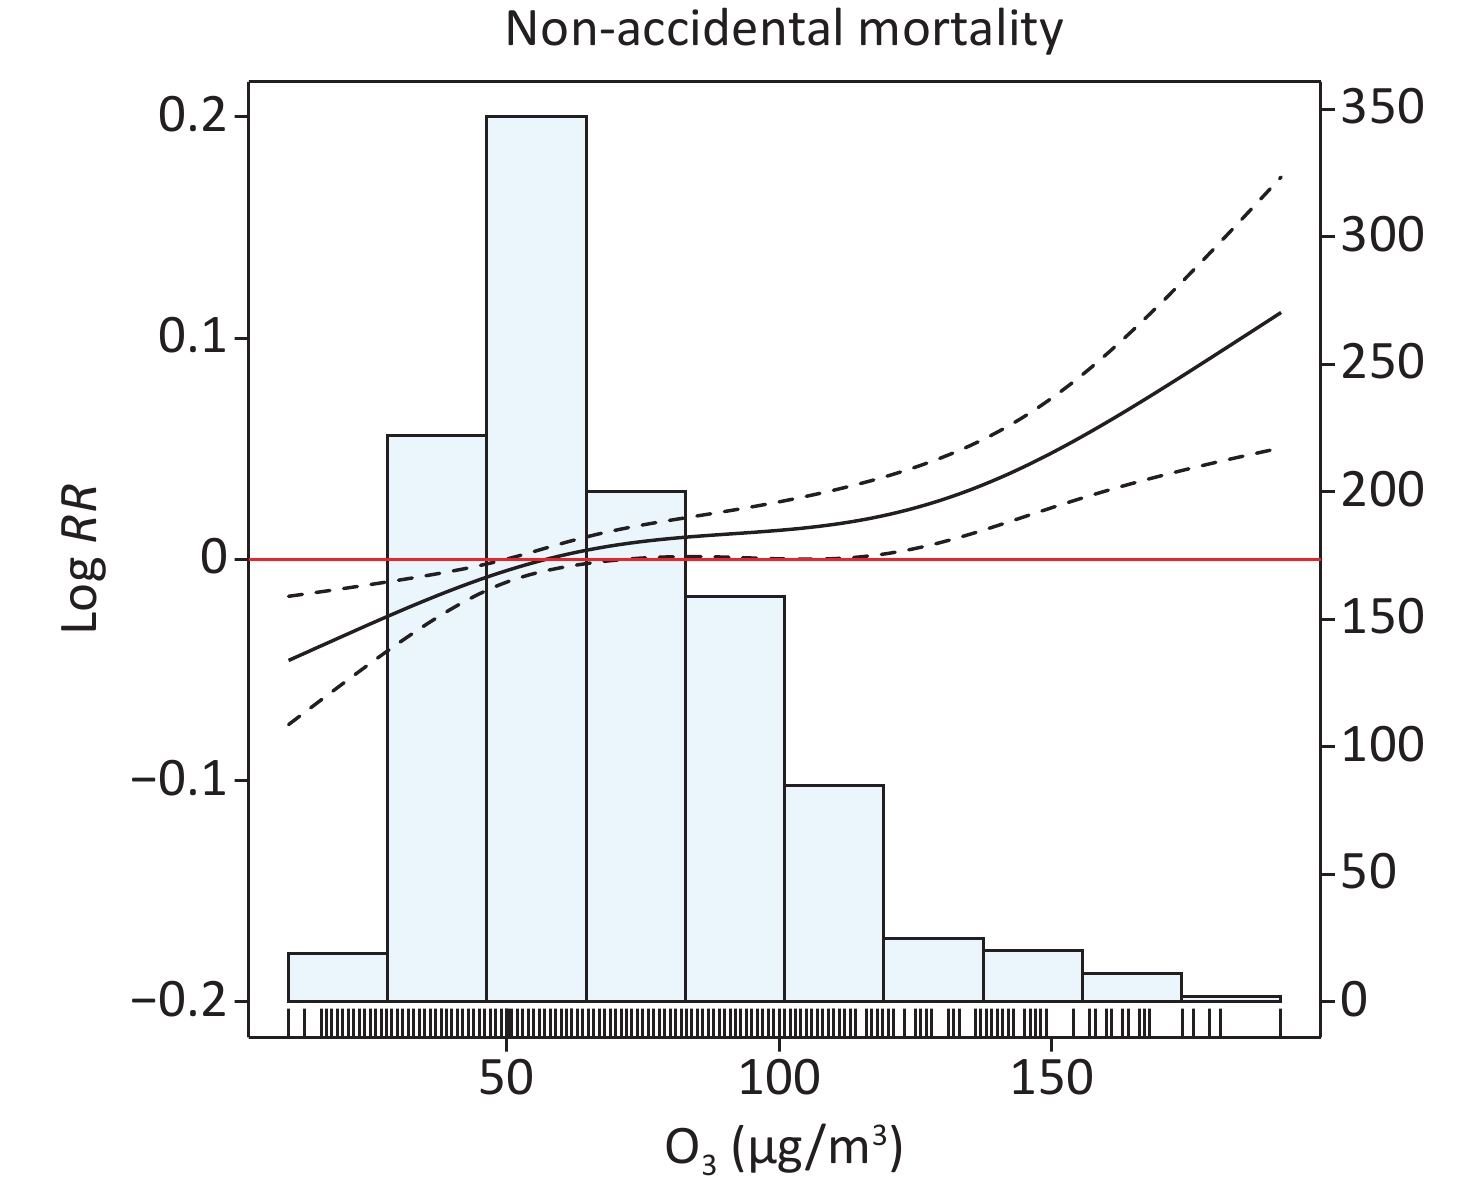
The exposure–response relationship between O3 concentration on the current day and mortality is illustrated in Supplementary Figure S3 (available in www.besjournal.com). The curve indicates that mortality risk was increased with increasing O3 concentration. Given the likely continuous effects of ambient pollutants on human health, the association between O3 exposure and nonaccidental mortality on different lag days is demonstrated in Figure 1. Results indicate that nonaccidental mortality significantly increased by 2.0% [95% confidence interval (CI): 0.6%–3.4%, at lag 1] for an IQR increment in O3 concentration. Previous studies have investigated the health effects of O3. For example, in the early years, the APHENA (Air Pollution and Health: A Combined European and North American Approach) project in Europe and North America showed that for every 10 µg/m3 increment in O3 concentration, the increase in nonaccidental mortality among all age groups was 0.17% (95% CI: 0.09%–0.25%) in Europe, 0.56% (95% CI: 0.28%–0.83%) in Canada, and 0.18% (95% CI: 0–0.35%) in the United States [2]. In Shanghai, China, Kan et al. found a significant correlation between O3 and daily nonaccidental mortality and reported a 0.31% (95% CI: 0.04%–0.58%) increase in mortality due to O3 exposure[5]. Similar findings have been reported in other multicity studies and meta-analyses[6]. However, unlike the aforementioned findings, a few studies have indicated that no significant association exists between O3 exposure and mortality, and some studies have even found a significant negative association. This discrepancy may be explained by the fact that O3 is a highly reactive molecule that is easily consumed when inhaled; thus, its effects on the cardiovascular system remain unclear. Furthermore, studies have shown that oxidative stress may be beneficial at low doses and harmful at moderate to high doses[7]; this leads to uncertainty about the health effects of O3. Additionally, differences between study populations can influence the health burden associated with O3. Nonbiological factors, including climate, geographic location, availability and quality of health care, lifestyle, and differences in study methodology also contribute to discrepancies in the findings of different studies.

Figure 1. RRs and 95% CIs for nonaccidental mortality with each IQR increase in O3 concentration at single-day lags. IQR: per interquartile range.
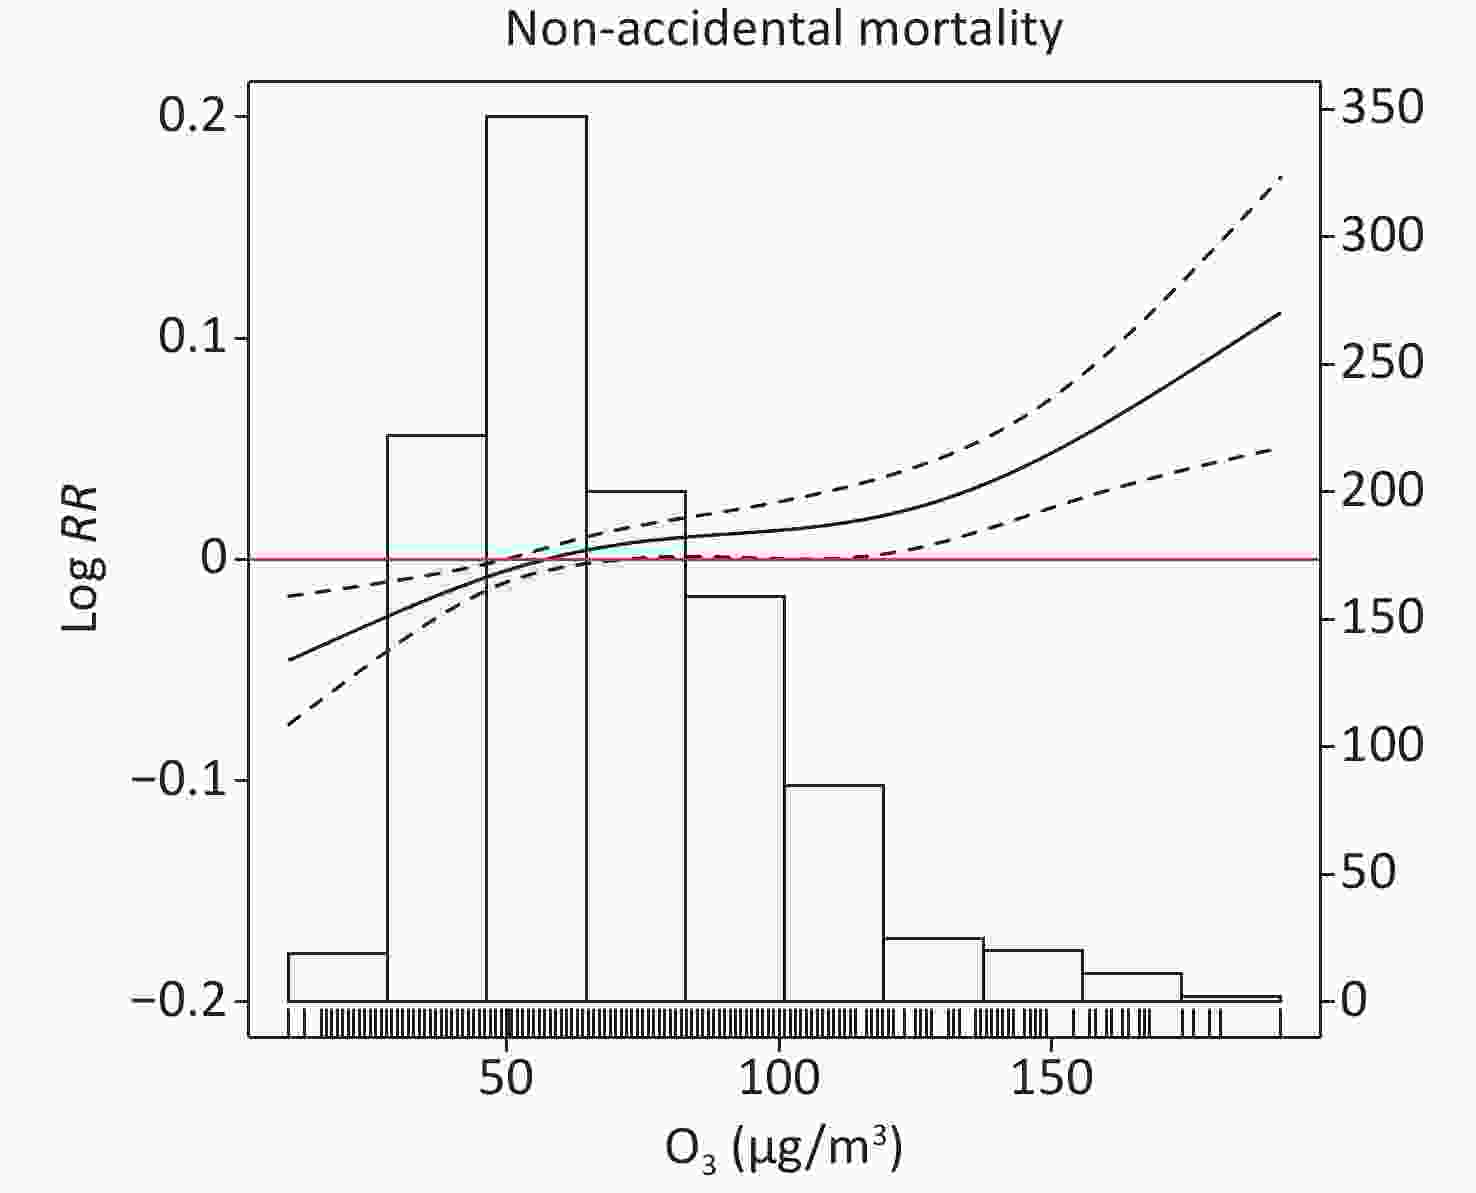
Figure S3. Exposure-response curves. The solid lines represent the Log RR of nonaccidental mortality, and the dotted lines indicate the 95% CI. The blue bars represent the frequencies of different ozone concentrations, and the frequency values are presented on the right-hand side of the Y-axis.
The possible biological mechanisms through which O3 contributes to mortality include oxidative stress, airway inflammation, and the triggering of autonomic reflexes that influence the regulation of heart rate and vascular tone. These changes in the human body may damage respiratory tissues and lung function, alter the autonomic control of cardiac frequency, increase blood pressure, and ultimately lead to fatal outcomes[8].
When stratified by sex, the strongest and most statistically significant association between O3 exposure and nonaccidental mortality was found at lag 0 for females and lag 1 for males; mortality increased by 2.6% (95% CI: 0.3%–5.0%) for females and 1.9% (95% CI: 0.2%–3.7%) for males. O3 had a slightly greater effect on females than on males, although the differences between subgroups were insignificant (Z test: P > 0.05). This may be due to differences in physiological characteristics between females and males. Females have fewer red blood cells and a narrower respiratory tract than males; thus, females are more susceptible to pollutants and have higher airway reactivity than males[9]. When the study period was stratified into cold and warm seasons, the effect of O3 on nonaccidental mortality was generally stronger and more urgent during warm seasons compared with the effect during cold seasons, although the difference was only statistically significant for males (Z test: total: P > 0.05, female: P > 0.05, male: P < 0.05). This may partly be explained by climatic features and human activities. During warm seasons, in northern China, O3 concentrations are typically higher, people spend more time outdoors, and windows tend to be open for longer, which may increase O3 exposure [10]. During cold seasons, however, people go out less frequently and windows are usually closed, which may decrease O3 exposure.
Table 1 presents the results obtained from multiday lag structures. Compared with the estimates calculated from single-day lags (Supplementary Table S2 available in www.besjournal.com), RR values were generally higher under the multiday lag structures. These results indicate that the risk of death from O3 exposure accumulates over time. Because other pollutants in the environment might influence the effects of O3, we added NO2, SO2, CO, PM2.5 (particulate matter < 2.5 μm diameter), and PM10 (PM < 10 μm diameter) into the models to perform multipollutant analysis.
Period Lag Total Male Female Whole period Lag 01 1.029 (1.011−1.048)** 1.028 (1.005−1.052)* 1.038 (1.014−1.063)** Lag 02 1.033 (1.014−1.052)** 1.031 (1.007−1.056)** 1.040 (1.014−1.066)** Lag 03 1.027 (1.008−1.047)** 1.022 (0.998−1.046)* 1.038 (1.011−1.066)** Lag 04 1.028 (1.008−1.048)** 1.017 (0.992−1.043) 1.041 (1.012−1.071)** Lag 05 1.029 (1.008−1.050)** 1.018 (0.992−1.045) 1.039 (1.009−1.071)* Lag 06 1.025 (1.003−1.047)* 1.015 (0.988−1.043) 1.033 (1.001−1.065)* Cold season Lag 01 1.006 (0.987−1.025) 0.998 (0.974−1.022) 1.020 (0.990−1.052) Lag 02 1.003 (0.983−1.024) 1.000 (0.974−1.027) 1.004 (0.973−1.036) Lag 03 0.994 (0.972−1.017) 0.992 (0.964−1.021) 0.993 (0.960−1.028) Lag 04 0.987 (0.963−1.012) 0.989 (0.958−1.020) 0.986 (0.950−1.024) Lag 05 0.990 (0.963−1.017) 0.993 (0.960−1.028) 0.984 (0.945−1.026) Lag 06 0.994 (0.965−1.024) 0.999 (0.963−1.038) 0.989 (0.944−1.035) Warm season Lag 01 1.028 (1.007−1.049)** 1.023 (0.997−1.050) 1.008 (0.985−1.031) Lag 02 1.030 (1.008−1.052)** 1.021 (0.995−1.049) 1.005 (0.982−1.030) Lag 03 1.025 (1.003−1.047)* 1.014 (0.987−1.042) 1.003 (0.979−1.028) Lag 04 1.024 (1.001−1.047)* 1.007 (0.980−1.036) 1.003 (0.978−1.028) Lag 05 1.021 (0.998−1.045) 1.004 (0.975−1.033) 1.043 (1.010−1.077)** Lag 06 1.011 (0.986−1.036) 0.995 (0.965−1.025) 1.036 (1.001−1.071)* Note. **P < 0.01, *P < 0.05. IQR: per interquartile range. Table 1. RRs and 95% CIs for nonaccidental mortality with each IQR increase in O3 concentration at multiday lags
As shown in Table 2, almost all RR values of mortality changed marginally after adjusting for other pollutants, and the estimated effects remained statistically significant, indicating that the results were robust.
Pollutant Total (Lag 1) Male (Lag 1) Female (Lag0) O3 1.020 (1.006−1.034)** 1.019 (1.002−1.037)* 1.026 (1.003−1.050)* O3 + NO2 1.019 (1.006−1.033)** 1.018 (1.001−1.036)* 1.027 (1.003−1.050)* O3 + SO2 1.020 (1.007−1.034)** 1.020 (1.002−1.038)* 1.027 (1.004−1.050)* O3 + CO 1.021 (1.007−1.035)** 1.018 (1.001−1.036)* 1.026 (1.003−1.051)* O3 + PM2.5 1.021 (1.007−1.035)** 1.020 (1.002−1.038)* 1.027 (1.004−1.051)* O3 + PM10 1.021 (1.007−1.035)** 1.020 (1.003−1.039)* 1.027 (1.003−1.050)* Note. **P < 0.01, *P < 0.05. Table 2. Estimated effects of O3 exposure on nonaccidental mortality after adjusting for NO2, SO2, CO, PM2.5, and PM10
The present study has certain limitations. First, as with most time series studies, we used pollutant concentrations from environmental monitoring stations that do not reflect true exposure at the individual level. Second, due to limited data availability, confounding factors such as socioeconomic status and individual behaviors were not controlled for; such factors may mediate the health effects of O3. We were also unable to conduct a stratified analysis according to age due to lack of data. Finally, our study was limited to Harbin; the results may not be generalizable to other regions. Thus, caution should be exercised when extrapolating the results of this study.
The authors have no conflicts of interest to declare.
Period Lag Total Male Female Whole period Lag0 1.018 (1.001−1.035)* 1.018 (0.997−1.040) 1.026 (1.003−1.050)* Lag1 1.020 (1.006−1.034)** 1.019 (1.002−1.037)* 1.026 (1.006−1.046)* Lag2 1.015 (1.003−1.027)* 1.015 (1.000−1.031) 1.018 (1.000−1.036) Lag3 1.003 (0.992−1.014) 0.995 (0.981−1.010) 1.012 (0.994−1.029) Lag4 1.006 (0.995−1.018) 0.998 (0.983−1.012) 1.015 (0.997−1.032) Lag5 1.008 (0.996−1.019) 1.005 (0.990−1.019) 1.006 (0.989−1.023) Lag6 0.995 (0.984−1.007) 0.996 (0.982−1.011) 0.987 (0.970−1.004) Cold season Lag0 1.001 (0.985−1.017) 1.000 (0.979−1.021) 1.003 (0.977−1.030) Lag1 1.006 (0.991−1.021) 0.998 (0.979−1.017) 1.018 (0.994−1.042) Lag2 0.999 (0.986−1.013) 1.003 (0.986−1.021) 0.993 (0.973−1.014) Lag3 0.990 (0.977−1.003) 0.987 (0.970−1.004) 0.994 (0.973−1.014) Lag4 0.995 (0.982−1.008) 0.997 (0.980−1.014) 0.993 (0.973−1.013) Lag5 1.005 (0.992−1.019) 1.010 (0.993−1.027) 1.002 (0.982−1.022) Lag6 1.009 (0.995−1.022) 1.012 (0.994−1.029) 1.005 (0.984−1.026) Warm season Lag0 1.021 (1.002−1.040)* 1.017 (0.993−1.041) 1.026 (1.001−1.051)* Lag1 1.018 (1.002−1.033)* 1.018 (0.998−1.037) 1.020 (0.998−1.042) Lag2 1.015 (1.002−1.028)* 1.012 (0.995−1.029) 1.019 (1.000−1.039) Lag3 1.005 (0.993−1.018) 0.998 (0.982−1.014) 1.014 (0.995−1.033) Lag4 1.007 (0.994−1.019) 0.997 (0.982−1.013) 1.017 (0.999−1.036) Lag5 1.002 (0.990−1.014) 0.999 (0.984−1.014) 0.987 (0.972−1.004) Lag6 0.986 (0.974-0.998)* 0.988 (0.973−1.003) 0.981 (0.964−1.000)* Note. **P < 0.01, *P < 0.05. IQR: per interquartile range. Table S2. RRs and 95% CIs for nonaccidental mortality with each IQR increase in O3 concentration at single-day lags
HTML


 22239Supplementary Materials.pdf
|

|

 Quick Links
 DownLoad: