


-
Stroke is one of the leading causes of mortality and disability worldwide. The 2019 Global Burden of Disease (GBD) Study indicated that ischemic heart disease and stroke were the top-ranked causes of disability-adjusted life years (DALYs) in both the 50–74 years and 75 years and older age groups. Additionally, stroke was the sixth cause of DALYs in the 25–49 age group[1]. Stroke mortality in China is higher than in developed countries (e.g., United States, United Kingdom, or Japan)[2] and is the third leading cause of mortality[3]. In 2020, the prevalence of stroke mortality was 154.39 per 100,000 in China, accounting for 22.8% of the total mortality[3]. In many countries, the stroke mortality rate has dropped significantly[4]. Similar decline has been observed in China. From 1994 to 2013, the age-adjusted stroke mortality rate in China decreased by 18.9% in men and 24.9% in women[5]. However, some studies have reported that the decreasing trend in stroke is now abating or potentially reversing. The pace of the global decline in age-standardized stroke mortality and DALY rates was noticeably slower over the past decade (2010–2019) than in the previous decade (2000–2009) [4]. A trend toward plateauing or increasing stroke incidence or mortality rates, or both, in young and middle-aged adults was recently observed in the USA, Europe, and Brazil[6-10]. This trend might be a reflection of the increased exposure to some risk factors of stroke, such as elevated blood pressure, high body mass index (BMI), and high fasting plasma glucose, across most countries. In China, the stroke mortality rate mainly declined among the subjects aged ≥ 55 years old in urban and ≥ 75 years old in rural regions[11]. However, limited data surround stroke mortality in young adults. Given the potential economic burden due to productivity loss and healthcare costs caused by stroke mortality in the young and middle-aged adults, quantifying the magnitude of the problem to inform health policy measures is important.
-
This ecological study used data obtained from the National Annual Statistics Report. Stroke mortality data were obtained from the China Health Statistical Yearbook (2003–2020). Stroke mortality were those for which the underlying cause listed on the death certificate is classified according to the International Classification of Diseases 10th revision (ICD-10) codes I60—I69. China’s population information was obtained from the China Population Statistics Yearbook (2003–2020). The annual yearbooks release the statistics data of the previous year in China. Thus, the stroke mortality and population data that we actually extracted were from 2002 to 2019. Considering the low mortality rate of stroke in individuals aged < 25 years, the subjects in this study were defined as those aged 25–64 years at the time of death and were divided into young (25–44 years) and middle-aged (45–64 years) adults. Population data used in stroke mortality projections were taken from World Population Prospects (2020–2030,
https://population.un.org/wpp/Download/Standard/CSV/ ). All data are freely available and open for public perusal. This study was exempt from institutional review board approval, given the de-identified nature of the database used. -
Mortality trends from stroke were analyzed in Joinpoint regression software (version 4.9.0.0, National Cancer Institute, USA) [12]. We created an input data file for Joinpoint software. The dataset included year (2002, 2003, …, 2019), sex (male or female), age range (25–29, 30–34, …, 60–64 years), administrative regions (urban or rural areas), number of stroke mortality, population per year (2002–2019), and standard population (Chinese Population Census 2010). Urban areas included municipalities directly under the Chinese central government and prefecture-level cities, and rural areas included counties and county-level cities in China. Then, we set the parameters, executed Joinpoint, and summarized the Joinpoint results. The Joinpoint regression software examined changes by detecting whether any differences between each segment of the annual percent change (APC) were significant. The significance assays use a Monte Carlo permutation method. The APC, average APC (AAPC), and 95% confidence interval were the main indicators in the Joinpoint regression model analysis to describe variations in temporal trends[13]. Statistical significance was set at P < 0.05. The age-adjusted mortality rates (AAMRs) were estimated for each year using the Chinese Population Census in 2010 as the reference population.
-
Changes in stroke mortality can be explained from an age, period, and cohort perspective. The age-period-cohort model is widely used in epidemiological, demographic, and sociological studies[14, 15]. The age-period-cohort-intrinsic estimator (APC-IE) model proved to be unbiased, estimable, and valid in solving identification problems[16]. To use the APC-IE model, stroke mortality data were stratified into eight 5-year age groups (25–29, 30–34, …, 60–64) by sex and location (i.e., urban/rural) and four 5-year periods (2000–2004, 2005–2009, 2010–2014, and 2015–2019). Since 2000 and 2001 data are not publicly available, the average data for 2002–2004 were used to estimate the data for 2000–2004. With the confluence of age groups and periods, 11 corresponding 5-year birth cohorts (1937–1941, 1942–1946, …, 1987–1991) were calculated. The first group of 25–29 years, 2000–2004 period, and 1937–1941 cohort were defined as the reference groups. To intuitively interpret the trends of age, period, and cohort effects on stroke mortality, the relative risk (RR) was calculated based on the estimated coefficient. The RR is the exponent of the difference in the estimated coefficient between the other groups and the reference groups. Statistical analyses were conducted using Stata 12.0 software (StataCorp, Texas 77845 USA). All statistical tests were 2-sided.
-
We predicted the future stroke mortality rates and counts by sex from 2020 to 2030 by running a Bayesian age-period-cohort (BAPC) model, which is available from R-forge (
http://rforge.r-project.org/ ). The BAPC package has been fully demonstrated and recognized in previous studies[17-19]. Age-adjusted projections for mortality rates were computed with the Chinese Population Census 2010 as age-specific weights. -
Between 2002 and 2019, a total of 6,253,951 stroke mortality in young and middle-aged adults were recorded. Of these, 4,152,412 (66.4%) were men and 2,101,539 (33.6%) were women, 654,701 (10.5%) were young adults, and 5,599,250 (89.5%) were middle-aged adults. Moreover, 2,638,344 (42.2%) mortalities occurred in urban and 3,615,607 (57.8%) in rural areas (Supplementary Table S1 available in www.besjournal.com). The AAMRs per 100,000 changed from 55.99 to 48.70 in men [APC, −0.5% (95% CI, −1.2 to 0.3)] and from 33.72 to 18.91 in women [APC, −3.5% (95% CI, −4.5 to −2.5)]. AAMRs were higher in men than in women during the study period (Supplementary Table S2 available in www.besjournal.com).
Year Men Women Urban Rural 25−44 yrs 45−64 yrs 25−44 yrs 45−64 yrs Number AAMRs Number AAMRs Number AAMRs Number AAMRs Number AAMRs Number AAMRs 2002 17,630 9.38 159,030 119.36 9,644 5.31 93,408 72.35 104,476 42.46 175,236 46.76 2003 22,067 11.03 191,542 139.69 12,707 6.49 130,263 98.26 130,755 47.82 225,823 61.36 2004 23,278 11.29 169,892 117.30 14,096 6.91 108,454 77.23 116,080 39.87 199,640 51.56 2005 21,767 10.74 195,120 133.28 13,932 6.74 135,431 95.16 164,593 55.56 201,658 51.94 2006 22,550 10.06 167,041 104.75 11,935 5.20 98,813 63.27 101,221 32.05 199,118 45.61 2007 26,863 11.89 187,372 111.92 13,313 5.79 99,760 60.66 99,240 29.42 228,068 50.96 2008 27,320 12.25 191,011 108.17 12,553 5.55 100,563 58.25 115,545 31.61 215,903 47.51 2009 28,362 12.74 223,113 122.99 12,147 5.39 118,999 66.69 135,021 34.60 247,601 54.71 2010 29,918 13.30 211,283 128.15 11,638 5.38 108,933 68.30 148,044 40.64 213,728 52.90 2011 26,145 11.60 200,481 117.30 10,510 4.86 98,545 59.30 139,224 35.79 196,458 48.45 2012 25,753 11.38 183,560 103.41 9,945 4.56 91,472 52.64 141,089 33.91 169,641 41.80 2013 32,989 14.89 222,515 120.33 11,188 5.22 106,480 58.55 165,339 37.67 207,833 50.64 2014 32,207 14.73 222,250 116.44 9,828 4.67 104,537 55.34 171,729 36.74 197,093 48.56 2015 29,510 13.88 226,885 115.00 9,462 4.59 106,116 54.12 175,426 36.31 196,546 47.33 2016 26,723 12.81 241,194 117.54 8,068 4.00 108,990 53.48 182,241 35.60 202,734 48.40 2017 25,246 12.38 243,014 115.68 7,297 3.67 108,637 52.03 188,100 35.15 196,093 47.19 2018 23,165 11.55 244,903 113.86 6,352 3.24 107,742 50.38 194,009 34.23 188,153 46.45 2019 22,435 11.56 208,280 99.18 6,158 3.25 83,622 40.19 166,213 29.46 154,282 40.85 Total 463,927 − 3,688,485 − 190,773 − 1910,765 − 2,638,344 − 3,615,607 − Table S1. Death number and age-adjusted mortality rates for stroke (AAMRs per 100,000) among young and middle-aged adults in China by sex, age groups and regions, 2002–2019
Year Men Women Total Urban Rural Total Urban Rural 2002 55.99 55.08 56.44 33.72 30.02 36.26 2003 65.56 58.69 70.28 45.39 36.94 51.77 2004 56.22 49.85 60.56 36.71 29.98 41.90 2005 62.68 65.68 60.13 44.22 45.48 43.18 2006 50.19 42.21 55.24 29.81 22.02 35.49 2007 54.29 40.42 64.17 29.04 18.54 37.15 2008 52.90 43.31 60.14 27.88 20.02 34.35 2009 59.46 47.78 68.94 31.37 21.66 39.93 2010 61.98 54.95 67.63 32.05 25.86 37.55 2011 56.40 50.19 61.79 27.93 21.08 34.48 2012 50.38 46.51 54.17 24.94 21.07 28.94 2013 59.58 52.55 67.16 27.82 22.49 33.56 2014 57.84 51.71 65.04 26.14 21.57 31.46 2015 56.73 51.23 63.40 25.58 21.05 30.90 2016 57.20 50.61 65.70 24.97 20.28 30.73 2017 56.16 50.29 64.17 24.16 19.74 29.87 2018 54.91 48.95 63.70 23.22 19.27 28.86 2019 48.70 43.21 57.37 18.91 15.47 24.06 APC (%)
(95% CI)−0.5
(−1.2, 0.3)−0.5
(−1.7, 0.6)0.2
(−0.6, 0.9)−3.5*
(−4.5, −2.5)−3.5*
(−5.2, −1.7)−2.8*
(−3.7, −1.9)Note. *Indicates that the annual percent change (APC) is significantly different from zero at the alpha = 0.05 level. Table S2. Age-adjusted mortality rates for stroke (AAMRs per 100,000) among young and middle-aged adults in China by sex and regions, 2002–2019
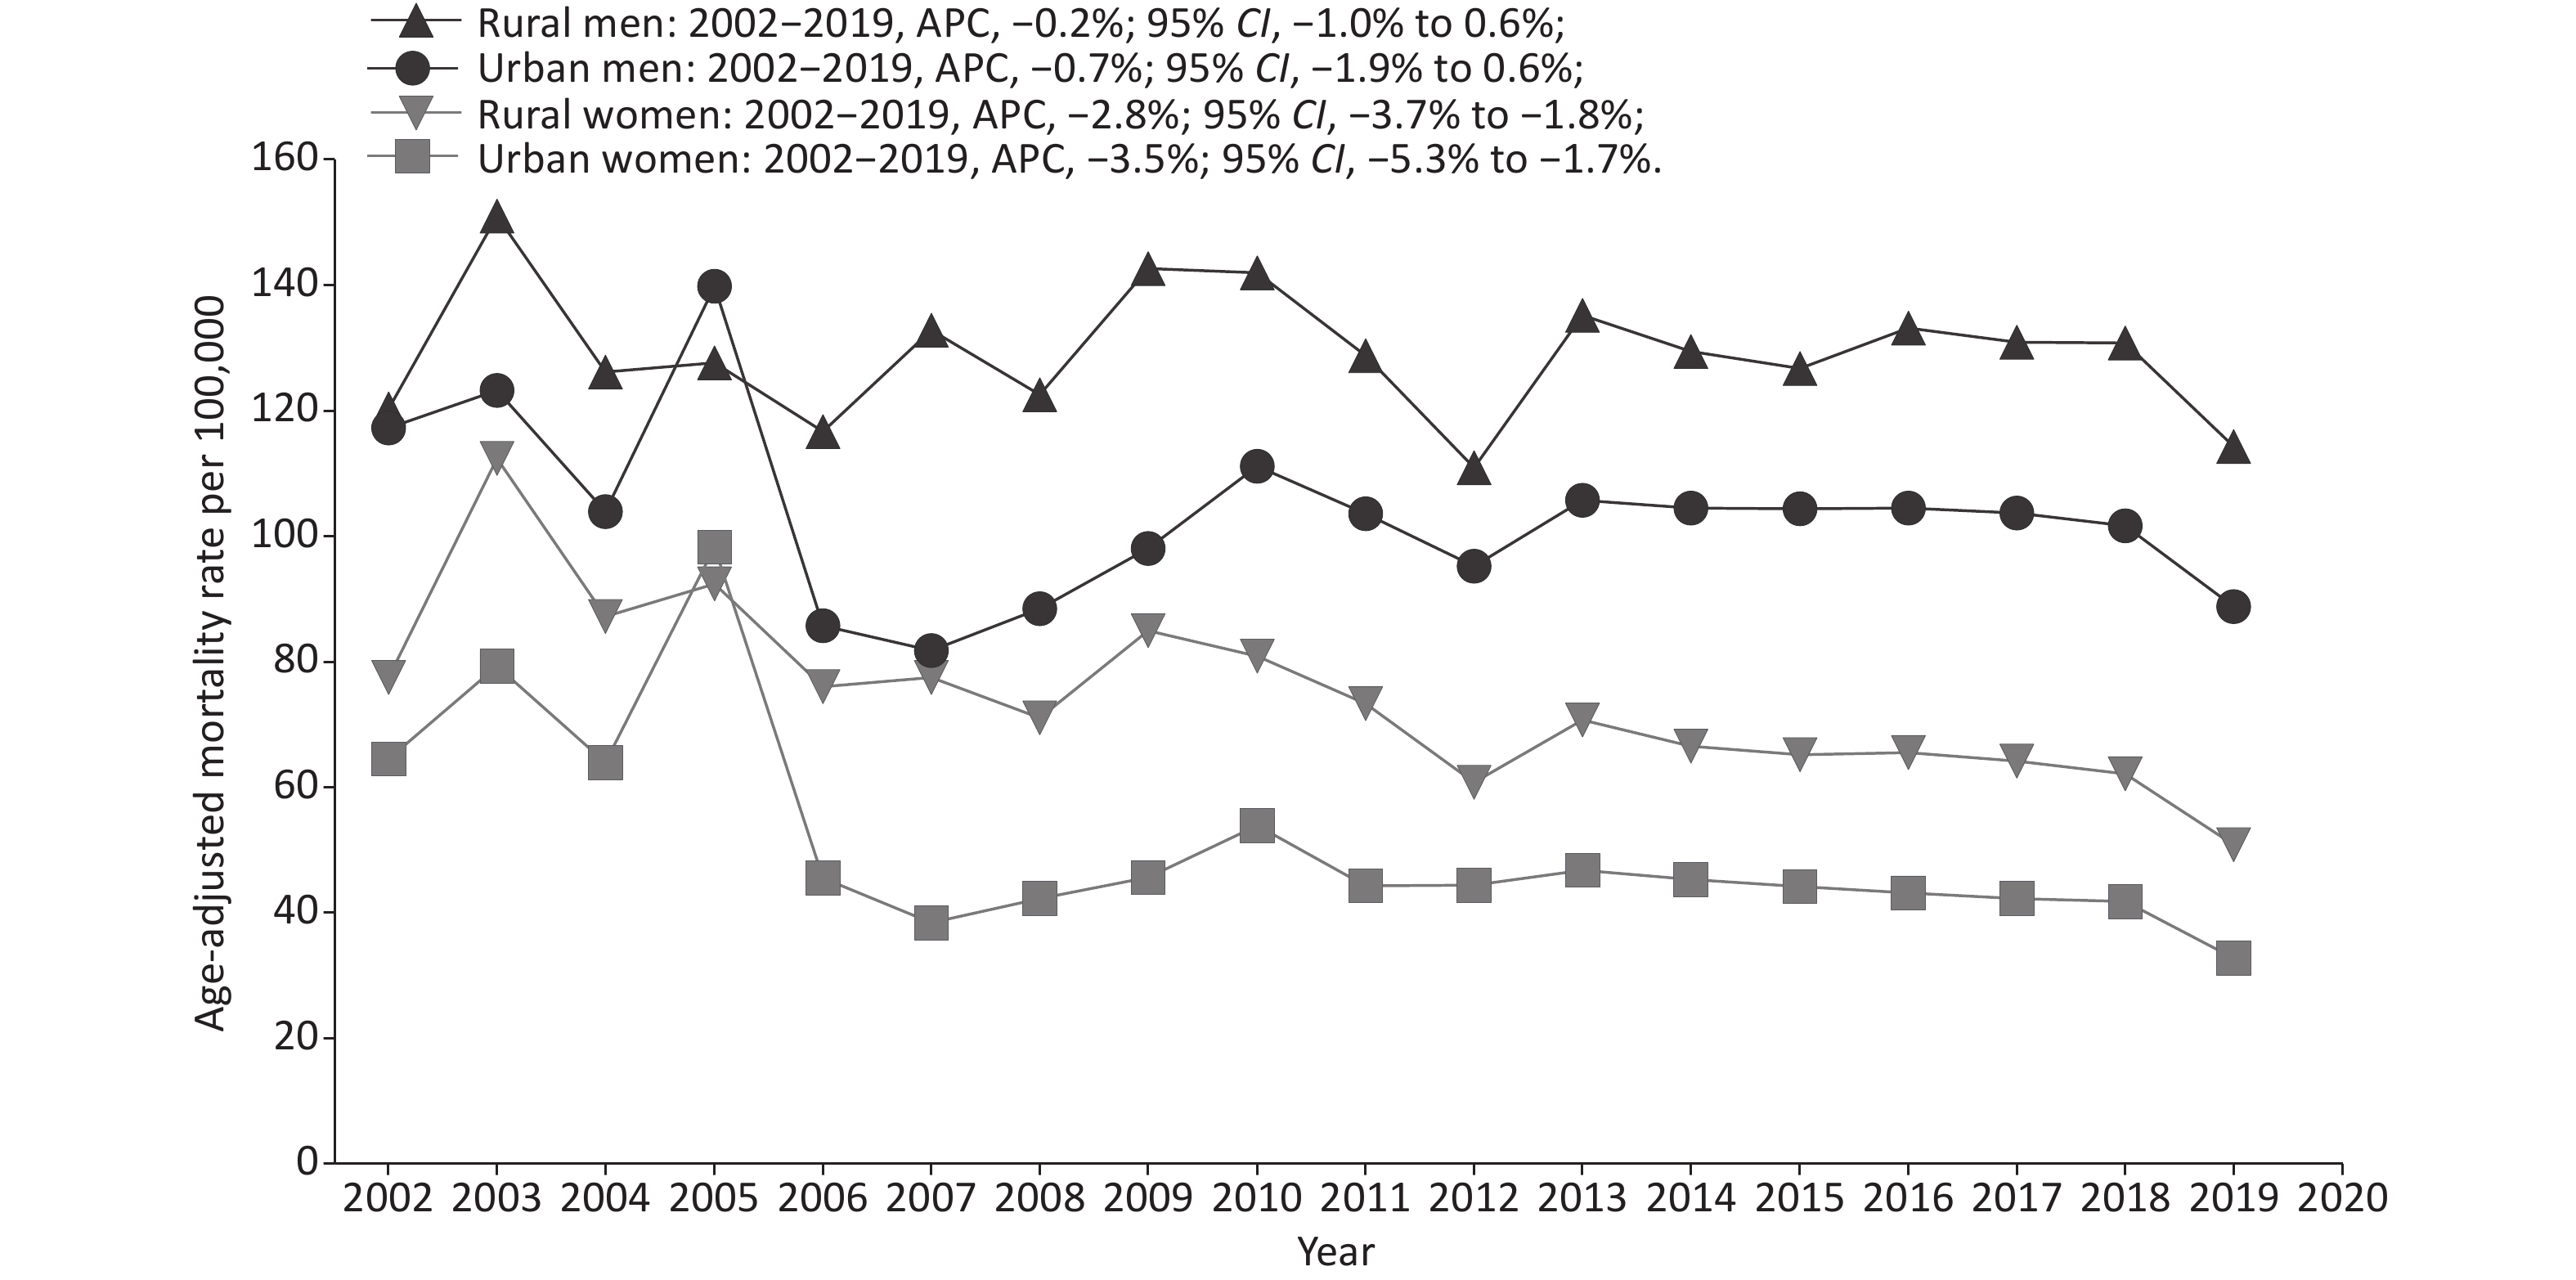
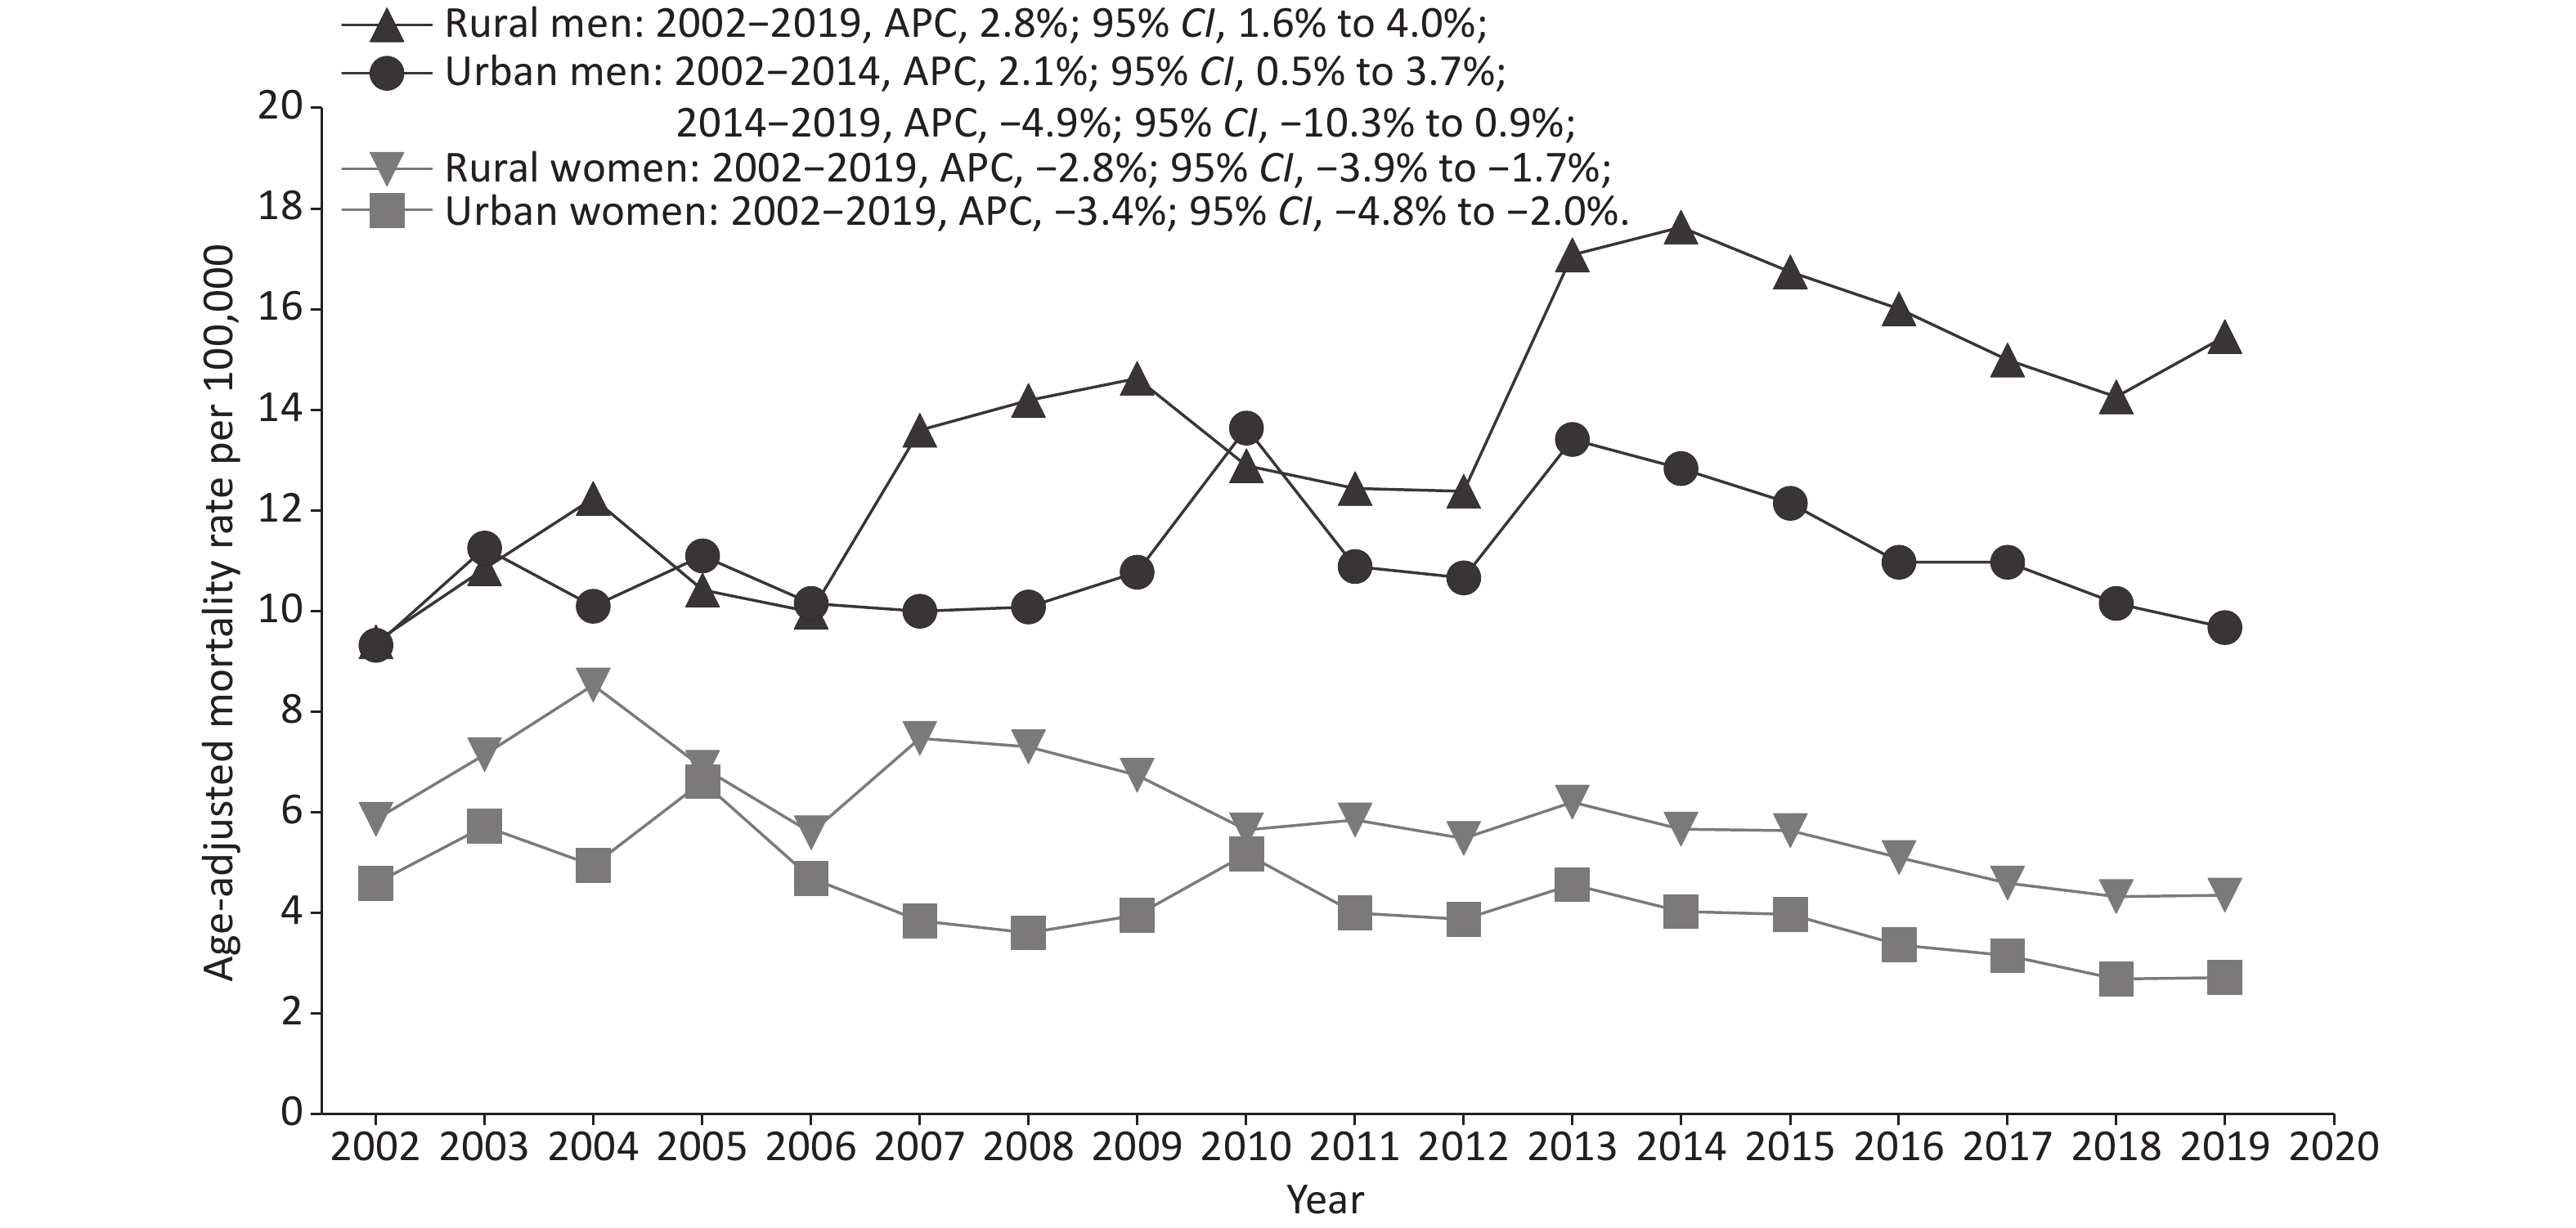
Among young adults (aged 25–44 years), the AAMRs per 100,000 for urban and rural women showed a downward trend, from 4.60 and 5.86 in 2002 to 2.72 and 4.35 in 2019, respectively. The AAMRs per 100,000 for rural men continued to rise, from 9.40 in 2002 to 15.46 in 2019. The AAMRs for urban men showed an upward trend from 2002 to 2014 [APC, 2.1% (95% CI, 0.5 to 3.7)] but no significant decline from 2014 to 2019 [APC, −4.9% (95% CI, −10.3 to 0.9)] (Figure 1). In middle-aged adults (aged 45 to 64 years), the AAMRs of urban [APC, −3.5% (95% CI, −5.3 to −1.7)] and rural [APC, −2.8% (95% CI, −3.7 to −1.8)] women continued to decline as well; however, the AAMRs of urban [APC, −0.7% (95% CI, −1.9 to 0.6)] and rural [APC, −0.2% (95% CI, −1.0 to 0.6)] men remained stable throughout the study period. Except for 2005, the AAMRs of the rural population in middle-aged adults were higher than that of the urban population at all other study time points (Figure 2). Age-specific stroke mortality variation with time is provided in Supplementary Table S3 (available in www.besjournal.com).
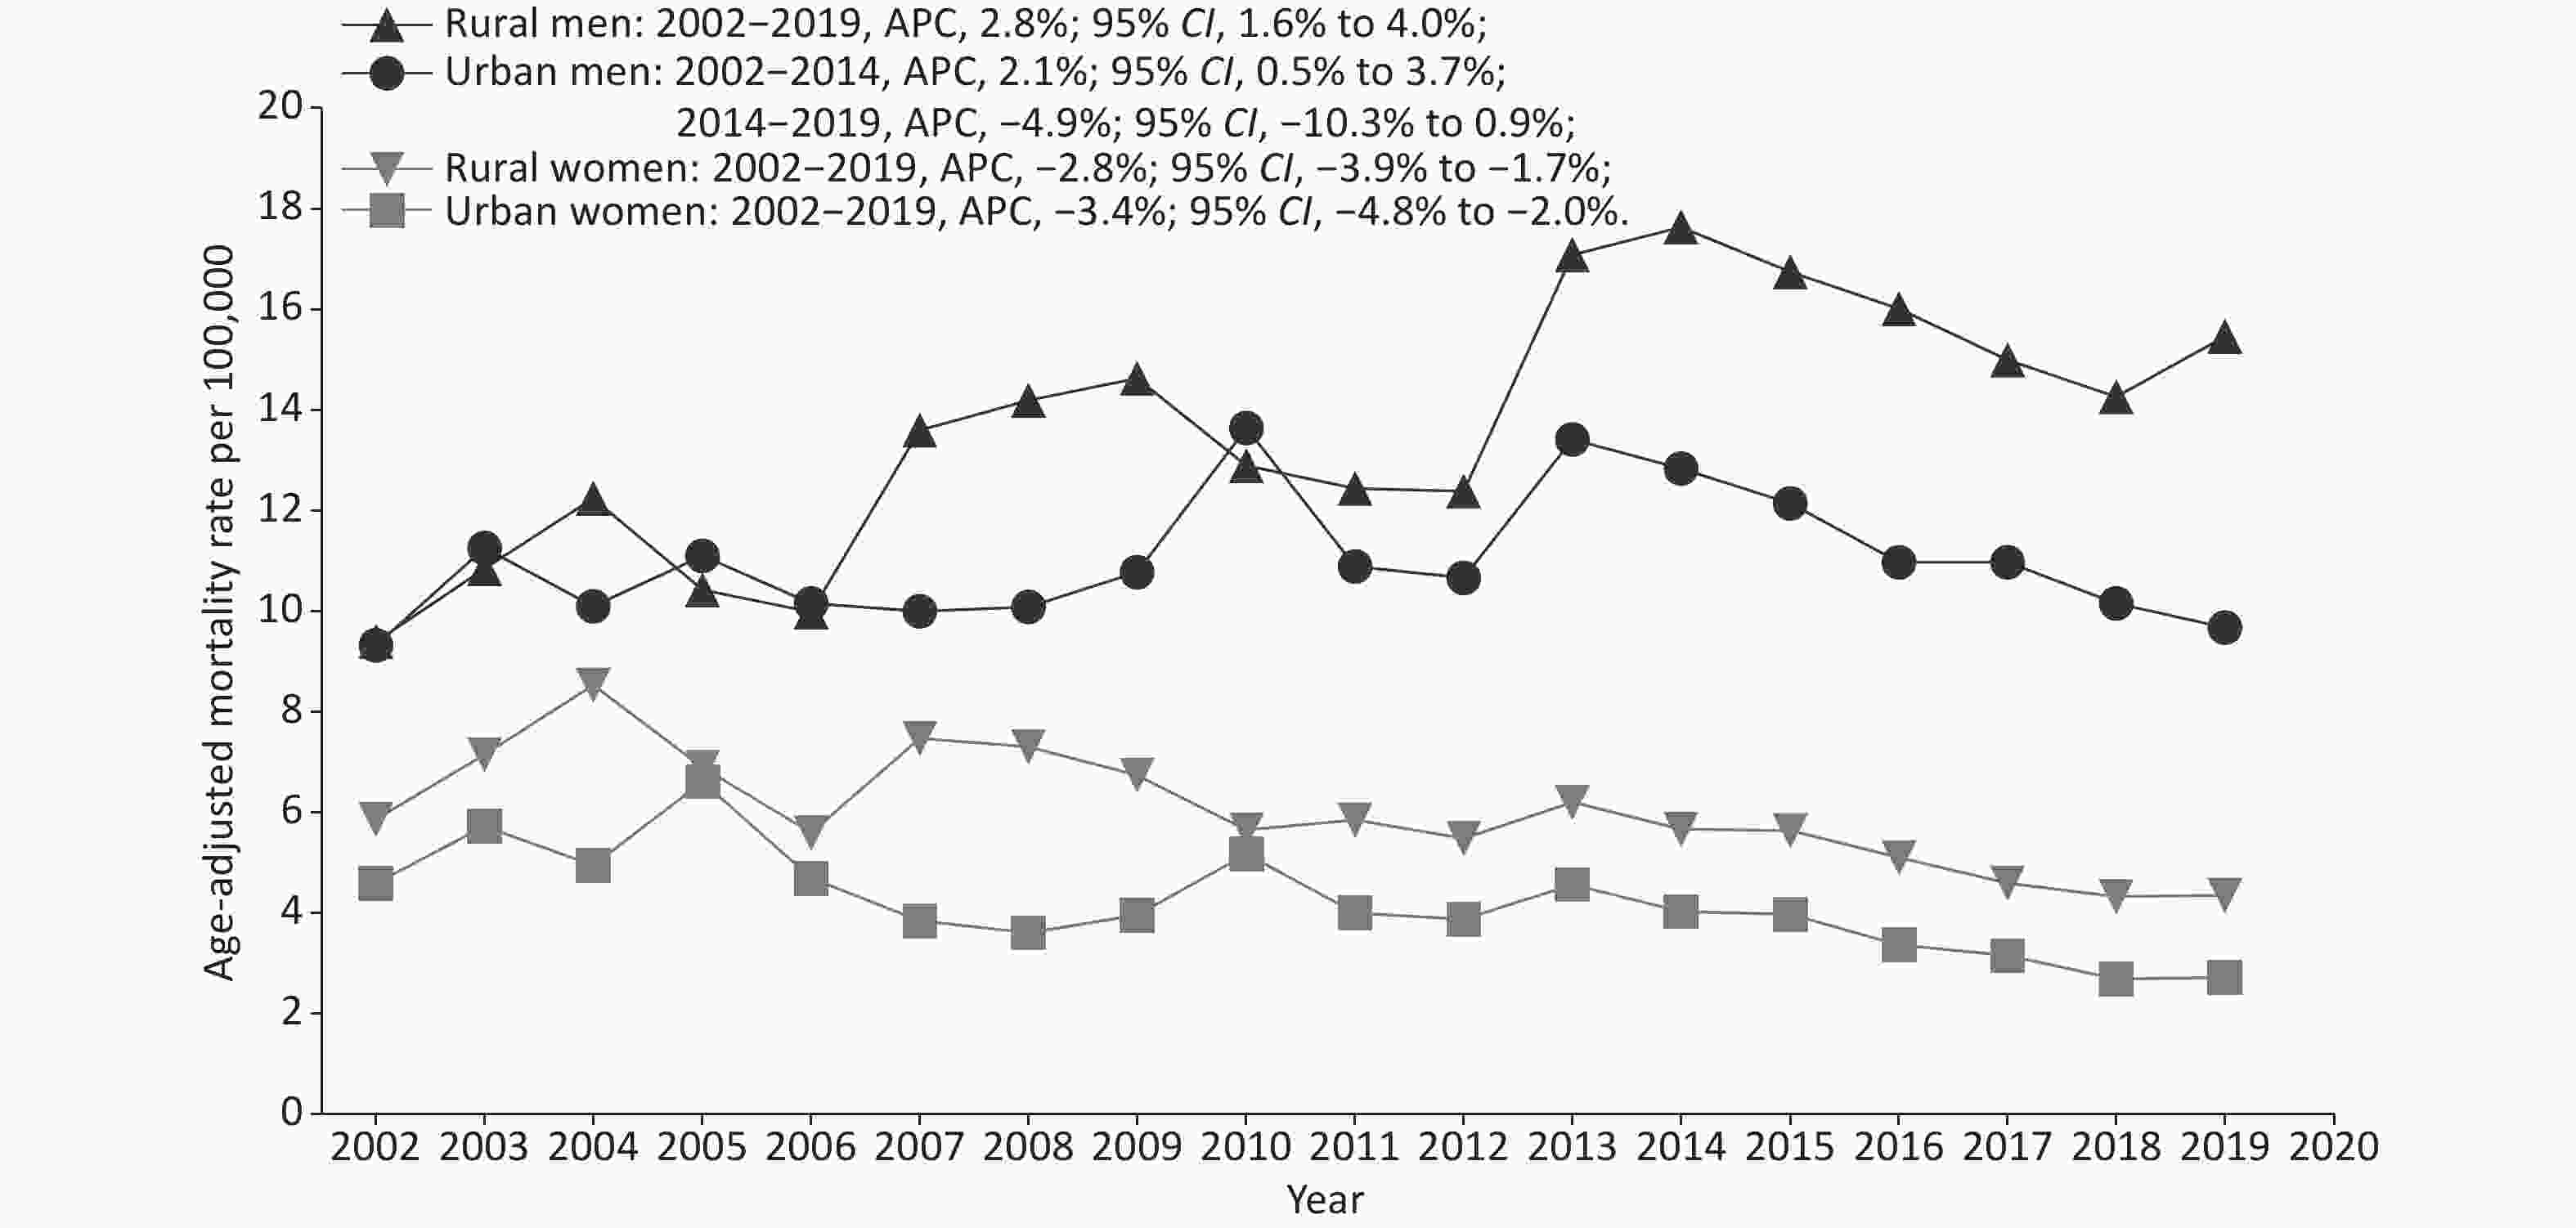
Figure 1. Trends of age-adjusted mortality rates (AAMRs) for stroke by sex and region among young adults in China, 2002–2019.
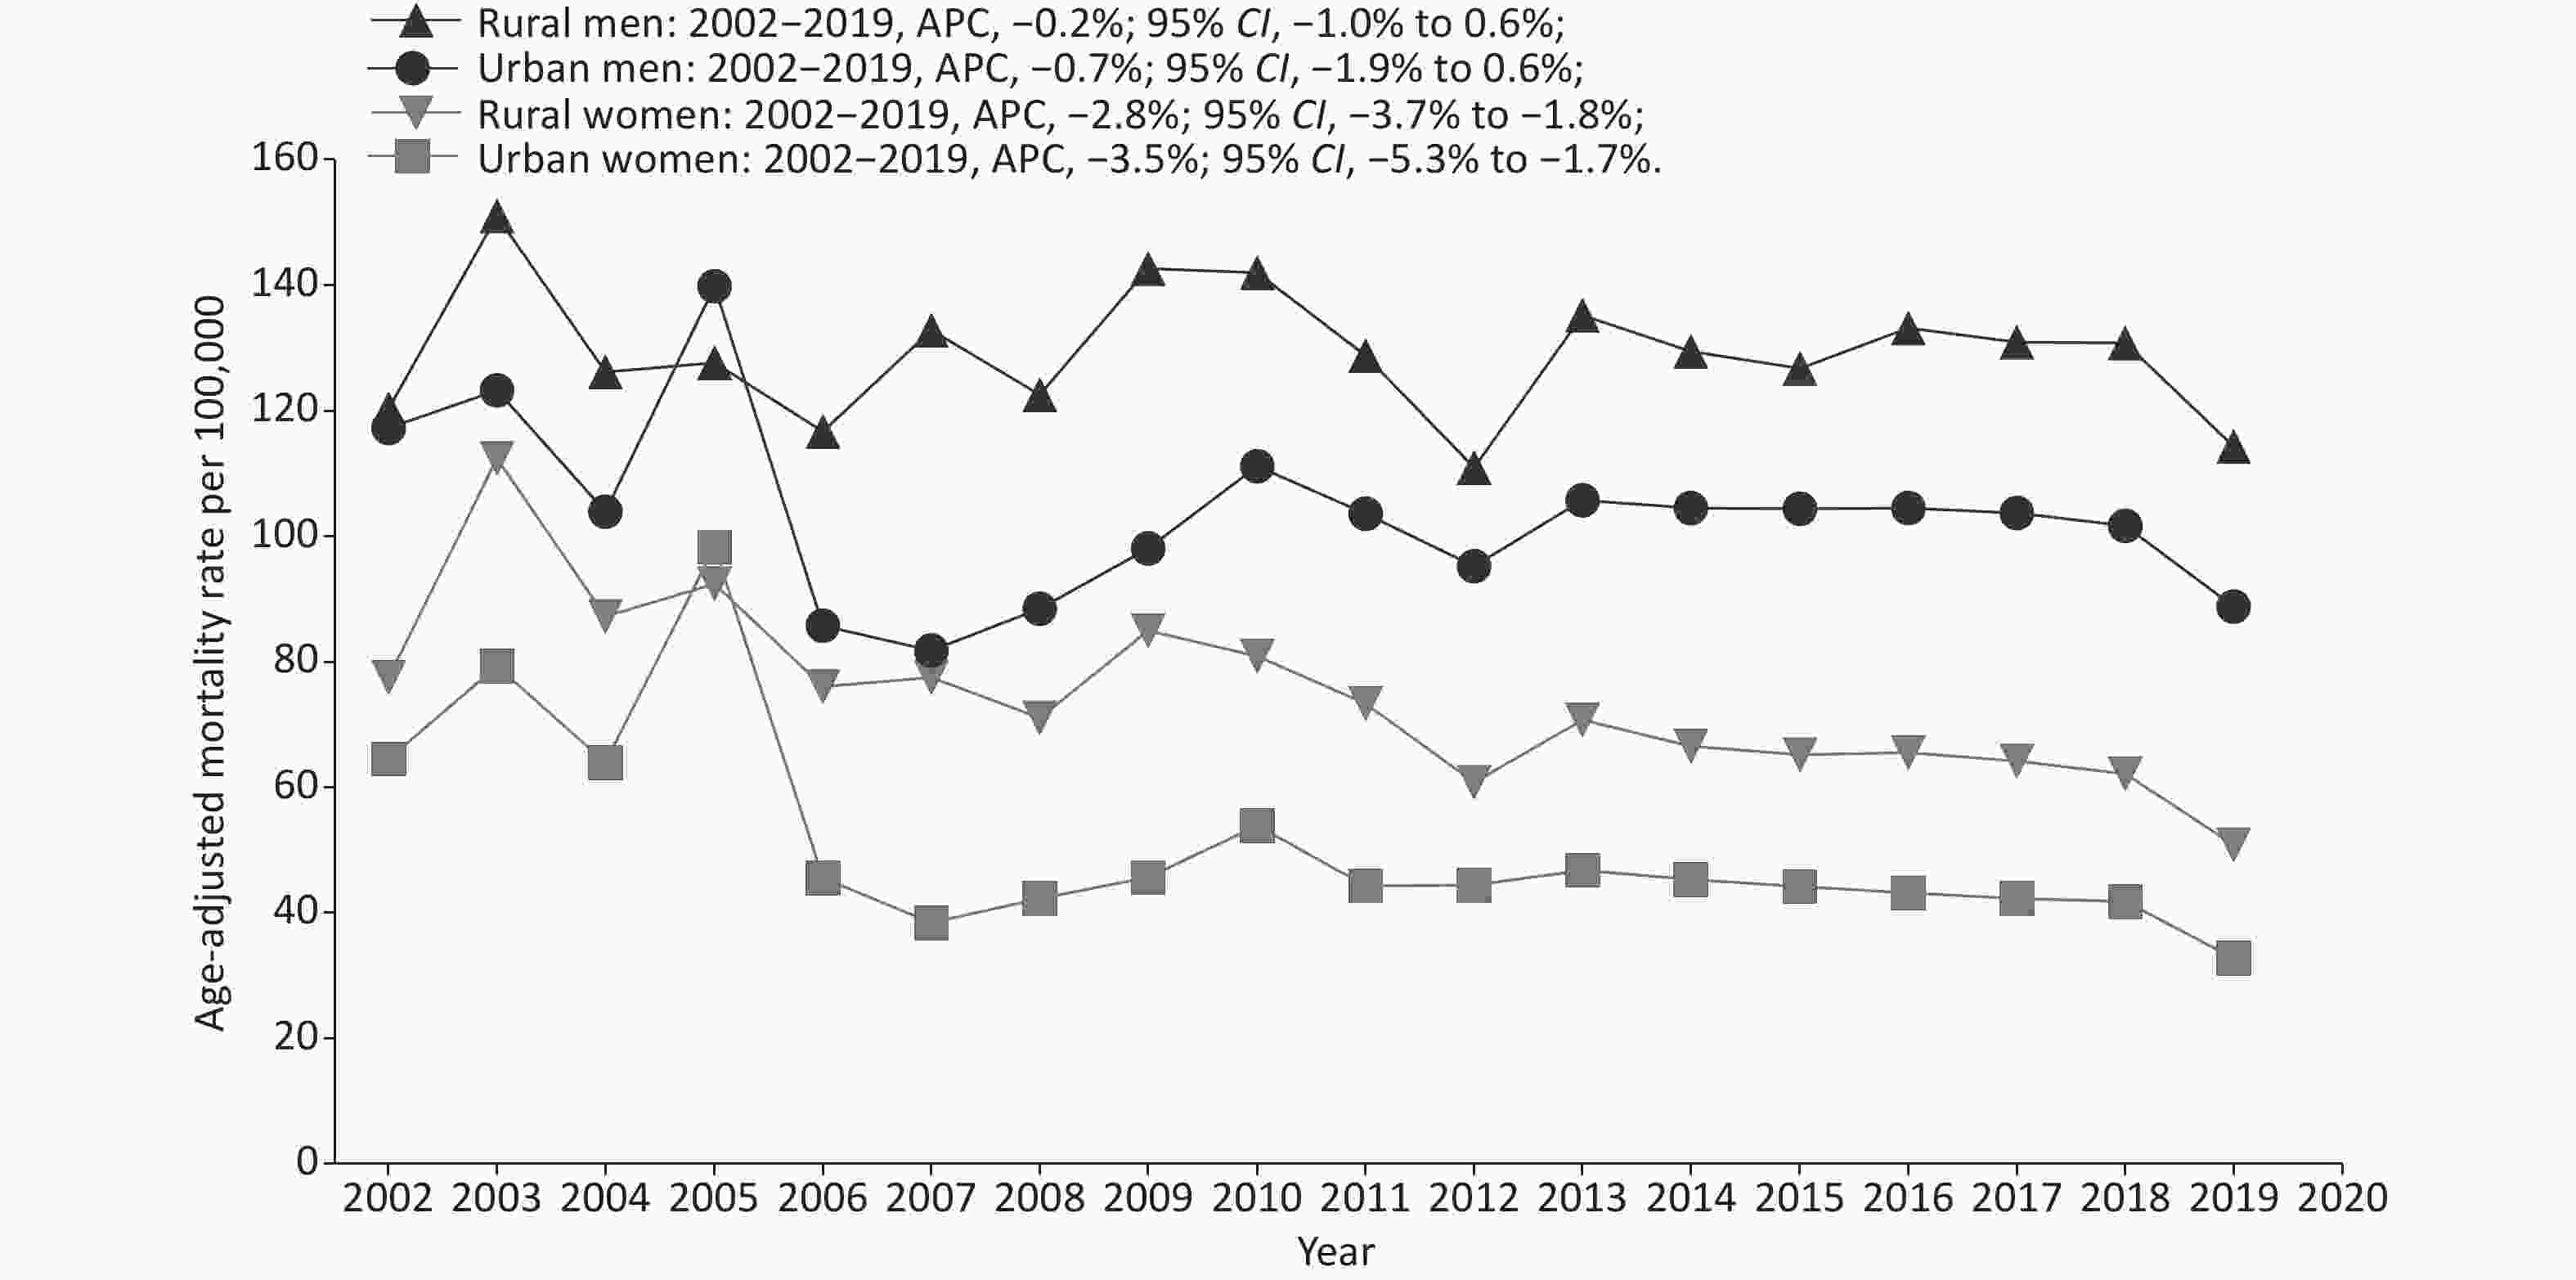
Figure 2. Trends of age-adjusted mortality rates (AAMRs) for stroke by sex and region among middle-aged adults in China, 2002–2019.
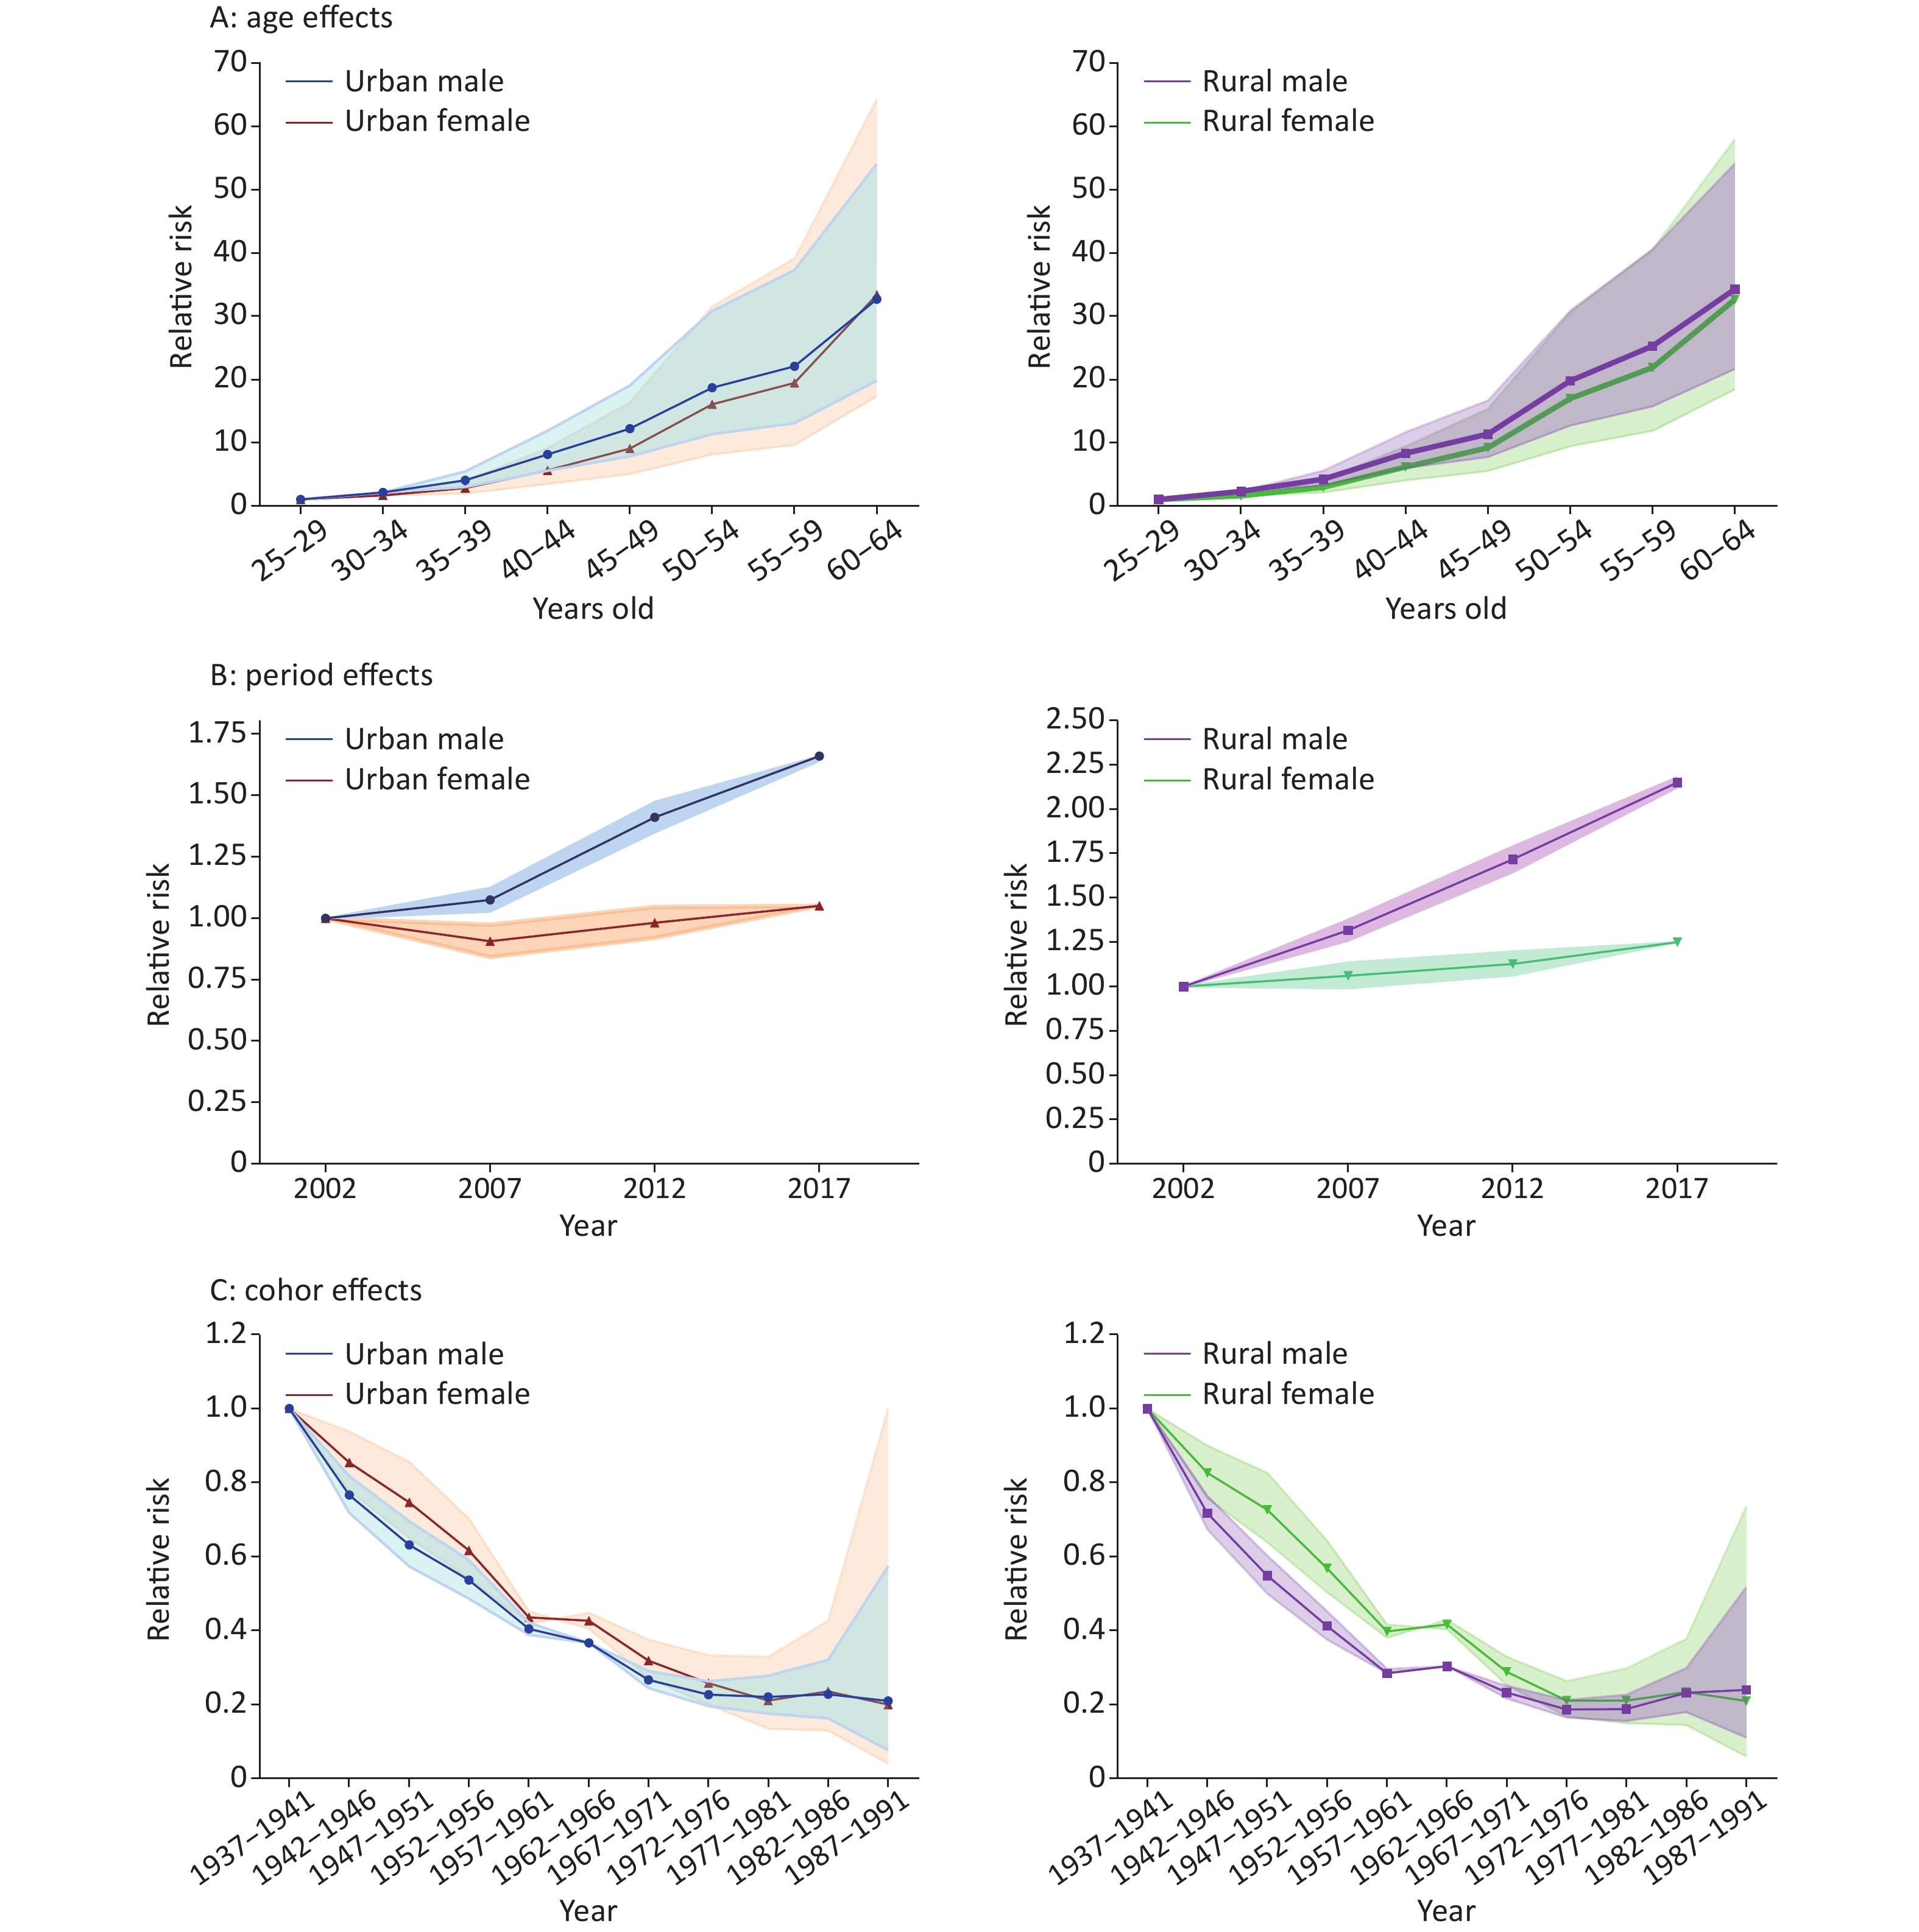
The RR of age, period, and cohort effects of stroke mortality for both sexes in urban and rural areas estimated by the APC-IE analysis are shown in Supplementary Figure S1 (available in www.besjournal.com). After controlling for period and cohort effects, a significant age effect on stroke mortality was found. The mortality risk increased with advancing age for urban and rural men and women. The RR in the group aged 60 to 64 were 32.7, 33.4, 34.2, and 32.6 times greater than those in the group aged 25 to 29 for urban men/women and rural men/women, respectively. The period effect of the mortality risk for urban men, rural men, and rural women showed an upward trend between 2002 and 2019, with the fastest increase in rural men. Compared with the period effect in 2002, the RR of stroke mortality in 2017 was 1.66, 2.15, and 1.25 for urban men, rural men, and rural women, respectively. The period effect of the mortality risk on urban women first dropped and then rose. Compared with the period effect in 2002, the RR of stroke mortality was 0.90 in 2007, 0.98 in 2012, and 1.05 in 2017. The cohort effect for both sexes in urban and rural areas showed significant downward trends before the 1957–1961 cohort, followed by a small platform in the 1962–1966 cohort, and then continued to decline in the 1972–1976 cohort. However, these downward tendencies were slowing down in the recent cohorts, especially for those born after 1977 in urban areas, and showing a slight upward trend for those born after 1977 in rural areas.
Figure S1. Age, period, and cohort effects on stroke mortality among young and middle-aged adults in China by age-period-cohort analysis. (A) Age effects on stroke mortality; (B) Period effects on stroke mortality; (C) Cohort effects on storke mortality.
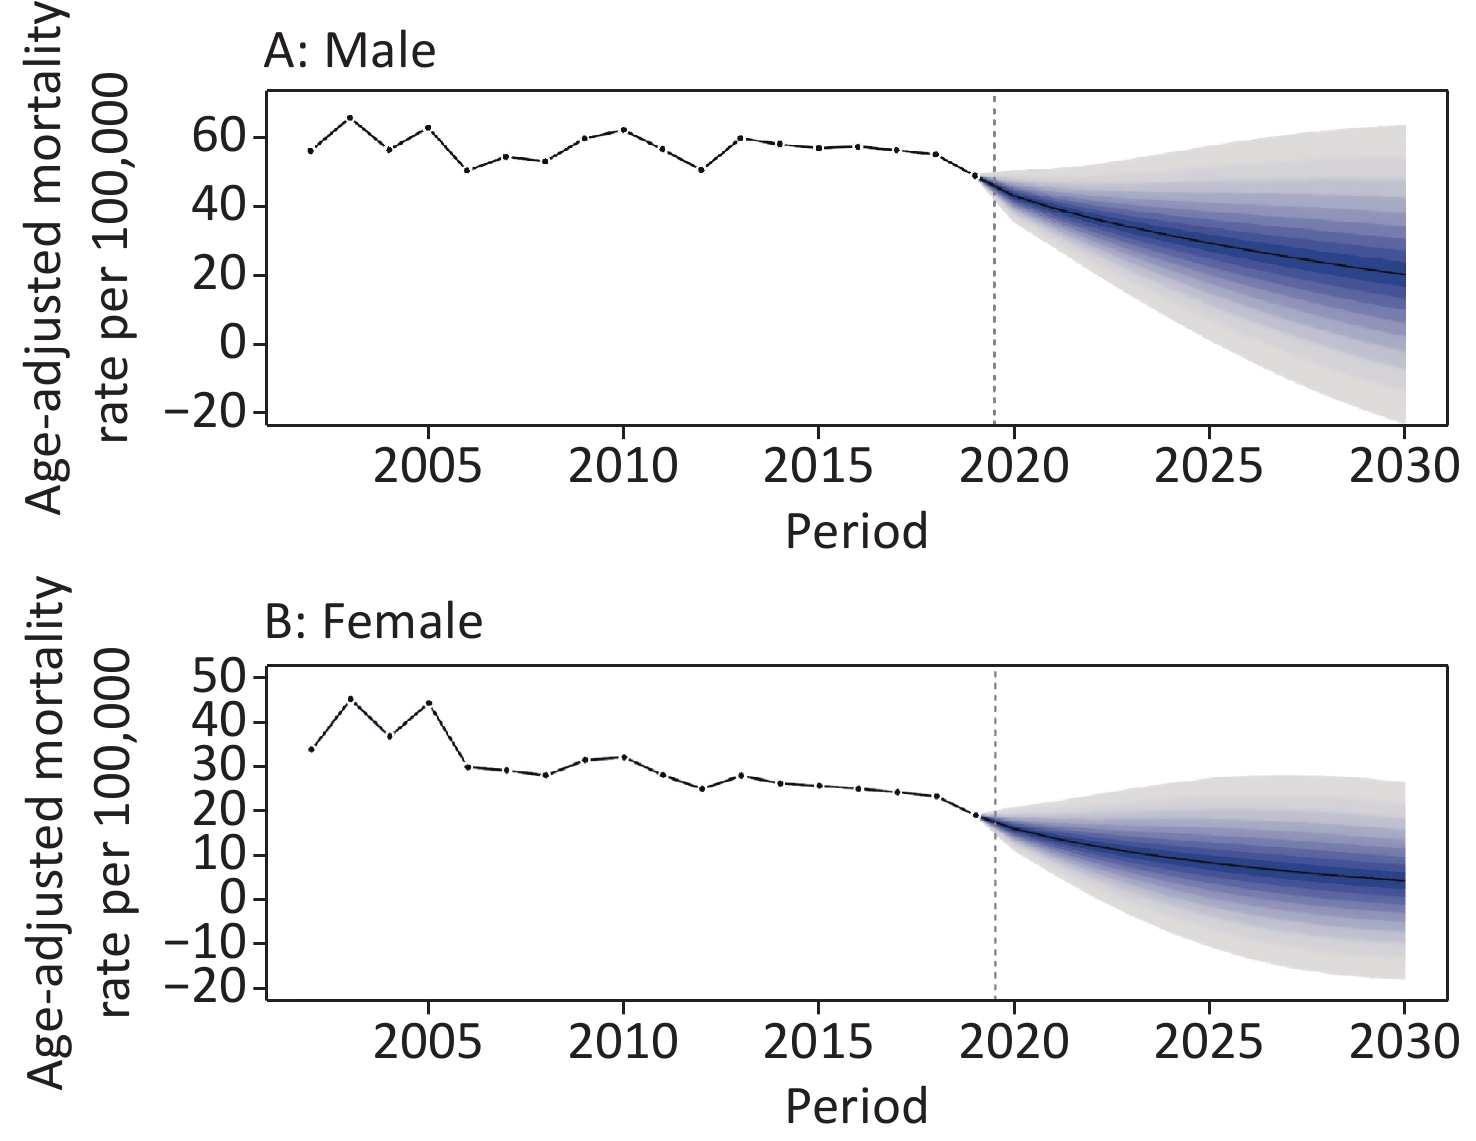
We predicted that the stroke mortality rates of the young and middle-aged population would continue to decrease in China, especially among women. The mortality rates in women were substantially lower than that in men. The estimated AAMRs per 100,000 were 20.16 in men and 4.18 in women in 2030, representing a reduction of 53.0% and 73.7% over 11 years, respectively. Given the aging of the population, according to the World Population Organization’s estimation of China’s population, by 2030, the number of people aged 25–64 years will decline. Therefore, the stroke mortality rate in this age group will continue to decline. Between 2020 and 2030, the projected number of stroke deaths among Chinese adults aged 25–64 years was 1,423,584 in men and 401,712 in women (Table 1 and Supplementary Figure S2 available in www.besjournal.com).
Year Men Women Number of deaths AAMRs Number of deaths AAMRs 2020 184,878 42.90 65,350 15.88 2021 170,067 39.43 56,894 13.83 2022 157,303 36.44 49,794 12.10 2023 146,221 33.84 43,760 10.64 2024 136,001 31.48 38,503 9.37 2025 126,312 29.28 33,830 8.26 2026 117,081 27.22 29,626 7.27 2027 108,412 25.30 25,818 6.37 2028 100,182 23.50 22,350 5.55 2029 92,258 21.77 19,241 4.81 2030 84,869 20.16 16,546 4.18 Table 1. Predicted (2020–2030) mortality number and AAMRs per 100,000 in stroke among young and middle-aged adults in China by sex
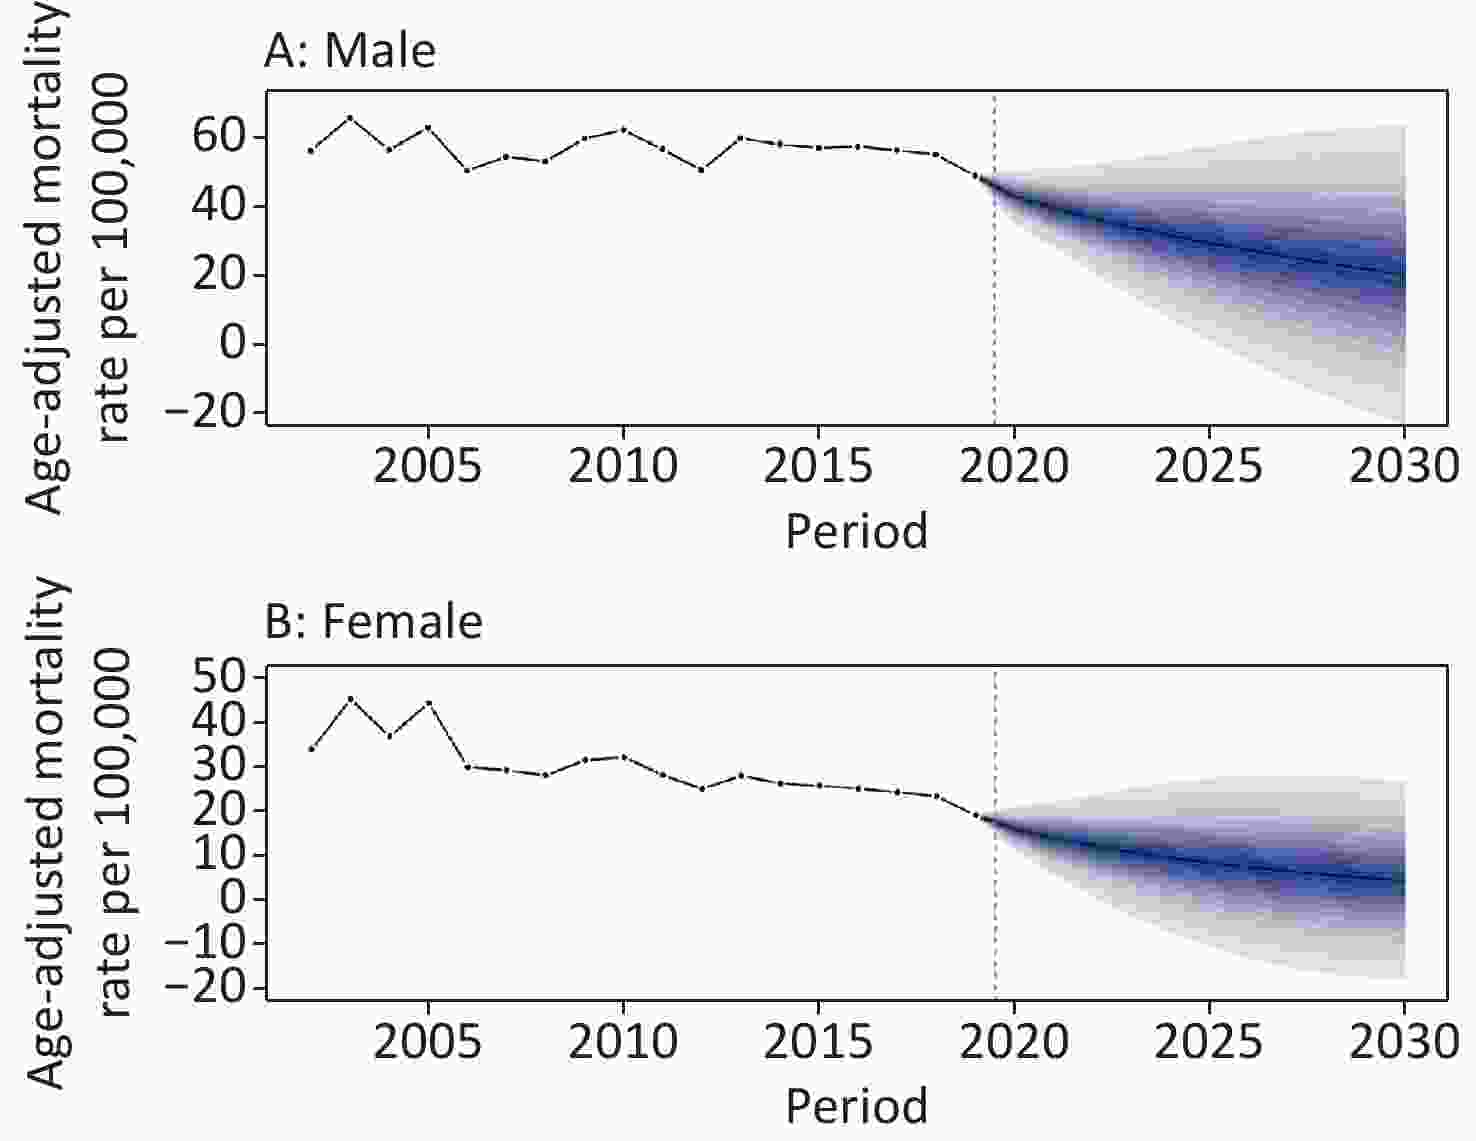
Figure S2. Trends in stroke mortality among young and middle-aged adults in China by sex: observed rates (2002–2019) and predicted rates (2020–2030). Shading indicates the 95% confidence interval of the predicted rates. (A) Trends in stroke mortality for male; (B) Trends in stroke mortality for female.
-
In the JoinPoint analysis of stroke mortality in China, we found that from 2002 to 2019, stroke mortality trends showed sex differences. A clear downward trend was found in women, but not in men. Specifically, young rural men showed a concerning upward trend. In China, men are exposed to more stroke-related risk factors than women. For instance, among Chinese adults aged ≥ 15 years, 50.5% of the men and 2.1% of the women were current smokers in 2018[20]. During the period from 2004 to 2018, relative increases in BMI and obesity in men were significantly higher than that in women[21]. Compared with men, women had stronger health awareness and were more likely to receive health-related information and change their unhealthy lifestyles[22]. In addition, we found that the stroke mortality rate of rural residents was generally higher than that of urban residents, which is consistent with previous research results[23]. The main reason is the significant differences between urban and rural residents in terms of access to health care services, security systems, and household income. Moreover, we noticed the decline trend of stroke mortality among urban young male from 2014 to 2019 (Figure 1) and wide interval of APC (–10.3 to 0.9). We think that the variation of stroke mortality in urban young male is greater than that in middle-aged group, which reduces the statistical power of discovering real decline of stroke mortality from 2014 to 2019.
Age-period-cohort analysis helped in the interpretation of possible causes for Joinpoint analysis results. Our results showed a significant age effect on urban and rural residents and both sexes similarly. Many previous studies have confirmed that increasing age was an independent and important risk factor for stroke, and stroke mortality and disability varied among age groups[24,25].
Period effects usually reflect an impact of a given time that directly influences disease mortality in all age groups, mainly generated by external macro-factors. In this study, period effects indicated that stroke mortality increased from 2002 to 2019, and men had a more elevated trend than women. The GBD 2019 study showed high systolic blood pressure, ambient particulate matter pollution exposure, smoking, and high sodium diet as the leading risk factors for stroke in 2019 in China[26]. Risk factors for stroke have increased rapidly over the past 20 years. For example, from 2002 to 2018, among Chinese adults aged 18–44, hypertension increased from 12.7% to 18.6% in men and from 6.7% to 8.0% in women, obesity increased from 6.8% to 20.1% in men and from 6.1% to 12.7% in women, diabetes increased from 1.5% to 7.4% in men and from 1.1% to 5.0% in women[27]. Dyslipidemia was observed in 27.5% of Chinese adults aged 18–49 years, with 38.3% in men and 19.6% in women[28]. Young men have a higher prevalence of risk factors and faster growth rates than young women, as do middle-aged men and women. In 2009, China launched new reforms in the medical and healthcare system. The state provides all residents with a free package of 41 basic public health services, including health education, free health management four times a year for residents with hypertension or type 2 diabetes, and other services. However, most of the people who participated in hypertension and diabetes management were older. Many major risk factors of stroke were actually not well controlled in China during the study period. For example, stroke may be more related to hypertension control. However, the management rates among young people remain low. The rates of awareness, treatment, and control of hypertension among people aged 18–44 years were 21.6%, 16.1%, and 4.3% in men and 24.1%, 17.8%, and 5.5% in women, respectively. The awareness, treatment, and control rates of diabetes appear to be slightly better, that is, 19.8%, 17.6%, and 30.8% in men and 28.8%, 23.8%, and 36.0% in women aged 18–44 years[27]. In China, rapid socioeconomic development improves stroke diagnosis and treatment, which decreases the fatality rate. However, a large-sample study showed that the utilization rate of the emergency system in China is still low, at only 12.5%, and young people were less likely to use the emergency system[29]. We suggest that a high prevalence and low control rates of risk factors of stroke and the low utilization of essential public health services and facilities may contribute to increased stroke mortality due to period effects from 2002 to 2019.
Cohort effects on stroke mortality showed a declining trend among young and middle-aged Chinese adults, which was consistent with the findings of previous studies[23, 24, 30]. A turbulent society and frequent wars filled in the early years of China, and people born in that period (1937–1956) experienced a higher risk of stroke mortality. From the 1960s to 1970s, China entered a period of economic development and medical service improvement. The declined cohort effects on stroke mortality might be due to the improved medical conditions, which reduced the number of stroke fatality cases[31]. During the decline, a plateau was found for cohorts born in 1957–1961 and 1962–1966, after which the descent started again and continued to the most recent cohorts. Many studies have indicated that maternal and early-child undernutrition has strong associations with the risk of stroke[32-35]. China experienced the Great Chinese Famine between 1959 and 1961. People born in 1957–1961 and the mothers of people born in 1962–1966 may have been affected by the famine. In both sexes, the decreasing trend of the cohort effect witnessed an obvious deceleration in the cohorts born after 1977. This similar deceleration phenomenon also happened in Spain[36], England [37], and Hong Kong, China[38] in earlier cohorts who were born approximately between 1950 and 1970. A Japanese study found that the leveling off of the declines in stroke mortality has occurred in post-1948 men and post-1958 women[39]. Since China began to implement reform and opening-up policy in 1978. As the economy developed, Chinese people changed their traditional diets and lifestyles to Western diets and occupational patterns, with an increase in high-risk behaviors (e.g., excessive calorie intake and physical inactivity)[40-44]. A study in England confirmed that stroke mortality increased rapidly after the war because of the improvement in living conditions and the prevalence of an unhealthy lifestyle[37]. The lifestyle of the generation after the reform and opening up is significantly different from that of preceding generations. As previously discussed, hypertension is less well-controlled in younger versus older age groups. In addition, the increasing prevalence of atrial fibrillation in young people would have a greater effect on the rates of stroke[45]. These factors may help explain the decelerating cohort effect among the later-birth cohorts. A systematic review and meta-analysis showed that temporal trends in stroke incidence are diverging by age in high-income countries, with less favorable trends in younger vs. older groups, highlighting the urgent need to better understand the etiology and prevention of stroke at younger ages[46]. From a global stroke prevention and control perspective, our findings provide complementary data from low- and middle-income countries.
China is experiencing a combined situation of accelerated aging and decreasing birth rate. The population aged ≥ 65 years was 190.64 million in 2020, accounting for 13.5% of the total population, and will reach 16.9% in 2030[47]. The proportion of the population aged 25–64 years will further drop significantly, from 58.5% in 2020 to 55.8% in 2030, an absolute decrease of 25.92 million[48]. Our forecast analysis suggests that stroke mortality and mortality among young and middle-aged Chinese will decline by 2030. We speculated that this decline might be partly explained by the following causes: 1) our projections assume that effects of the age, period and cohort components will remain unchanged into the future, and 2) persistent low fertility rates have led to a decline in young and middle-aged populations. Although the stroke mortality rate is falling, the total number of deaths is still huge. Compared with stroke events in older people, stroke events in young people have a disproportionately large economic effect by dying during their most productive years[48].
In this study, we used nationally representative, high-quality, authoritative mortality data for trend analysis and forecasting on stroke. Meanwhile, the cause-of-death coding practice, which did not change during 2002–2019, could not have influenced the statistical accuracy of stroke mortality trends. This study has several limitations. First, our study did not compare subtype-specific stroke mortality because of the unavailability of data from the national public database. Second, compared with the individualized study, the APC-IE framework concluded the results at the population level, which would be affected by ecological fallacy[49]. Third, since the UN did not provide population prospects data by urban and rural areas of China, this study could only predict future stroke mortality by sex, and the current BAPC analysis does not support the incorporation of covariate effects. Our projections are based on long-term cohort trends and may be less reflective of real-world perturbations, such as the coronavirus disease 2019[50].
-
In this study, significant sex and age disparities in the trends of stroke mortality among young and middle-age adults were identified in China. Targeted health policy measures are needed to address the burden of stroke in the young generation, especially for rural men, with a focus on the prevention and management of high risk factors.
-
ZHAI Yi contributed to the conceptualization of the estimation approach. ZHAI Yi conducted the data analysis with input from SI Xiang. SI Xiang led the data compilation and data management. ZHAI Yi, WANG Wen Zhi, and ZHAO Wen Hua drafted the manuscript. All coauthors convened periodically for the critical revision of the manuscript for important intellectual content. The authors alone are responsible for the views expressed in this article, and they do not necessarily represent the views, decisions, or policies of the institutions with which they are affiliated. ZHAI Yi had full access to all the data in the study and take responsibility for the integrity of the data and the accuracy of the data analysis.
-
None of the authors has any conflicts of interest.
Age group
(Year)Urban male Rural male Urban female Rural female AAPC (%) 95% CI AAPC (%) 95% CI AAPC (%) 95% CI AAPC (%) 95% CI 25−29 3.3* 1.2, 5.5 5.5* 0.5, 10.7 −0.7 −4.0, 2.7 0.6 −2.3, 3.6 30−34 3.7* 1.5, 5.9 3.7 −5.8, 14.2 −1.1 −3.0, 0.8 1.8* 0.3, 3.3 35−39 0.8 −0.6, 2.2 2.9* 1.8, 4.0 −4.1* −5.1, −3.0 −3.3* −4.9, −1.7 40−44 −0.9 −2.4, 0.6 2.2 −0.4, 5.0 −4.0* −6.0, −1.9 −3.6* −5.3, −1.8 45−49 −2.1 −6.2, 2.1 1.6* 0.0, 3.2 −5.0* −6.8, −3.2 −3.4* −5.2, −1.6 50−54 −2.5 −6.5, 1.6 2.0* 0.6, 3.4 −1.9 −11.9, 9.3 −1.7* −3.3, −0.1 55−59 −1.3* −2.5, −0.2 −1.6* −2.7, −0.5 −5.3* −7.1, −3.5 −4.2* −5.6, −2.8 60−64 −0.2 −1.8, 1.3 −0.7 −1.5, 0.2 −2.8* −4.6, −0.9 −2.2* −3.3, −1.2 Note. *Indicates that the average annual percent change (AAPC) is significantly different from zero at the alpha = 0.05 level. Table S3. Age-specific stroke mortality variation with time (per 100,000) among young and middle-aged adults in China, 2002–2019
HTML
Data Sources
Statistical Analyses
Joinpoint Regression Analysis
Age-Period-Cohort Model Analysis
Stroke Mortality Rate Projection
 22316Supplementary Materials.pdf
|

|

 Quick Links
 DownLoad: