


-
Dietary iodine is an essential micronutrient throughout the human life cycle and is vitally important for maintaining normal thyroid function and infant growth and brain development[1]. The iodine requirement increases during pregnancy owing to the transfer of iodine to the fetus and increased maternal thyroid hormone synthesis[2]. Generally, fetal thyroid function is established at the 20th week of gestation, so almost all thyroid hormone required for fetal brain development during the first half of pregnancy originates from the maternal thyroid[3]. Therefore, pregnant women (PW) are highly vulnerable to iodine deficiency (ID). The overall prevalence of ID in PW from different regions of the world has been estimated to be 53% until 10 April 2021[4].
Severe ID during pregnancy can cause adverse obstetric outcomes and irreversible brain damage in offspring, leading to endemic cretinism[5]. ID is the leading cause of preventable intellectual deficits, and severe ID has been relatively rare in China, primarily due to universal salt iodization (USI) programs[6]. However, mild-to-moderate ID remains prevalent in PW in developed and developing countries[4]. Several studies have reported neurocognitive anomalies in children born to mothers with moderate ID in pregnancy[7]. Relevant research does not draw a consistent conclusion that mild maternal ID (a median urinary iodine concentration (mUIC) of 100–149 μg/L) could increase the risk of maternal thyroid disorders or low intelligence quotient in the offspring[8-11]. The 37 studies published between 1981 and 2019 by systematic review and meta-analysis have showed that there is insufficient evidence to support current recommendations for iodine supplementation in pregnancy in areas of mild-to-moderate deficiency[12].
Relationships between thyroid function and mild ID in PW have also varied[13]. Some studies have demonstrated that hypothyroxinemia, caused by ID, impaired growth of the offspring and development in utero and early life[14]. Other studies have concluded that, when compared with normal PW, the infants born to women with hypothyroxinemia showed no physical or mental improvement after maternal levothyroxine treatment[15]. This phenomenon can be explained by no clinical or subclinical symptoms being caused by marginal ID during pregnancy.
Spot mUIC is most frequently used to evaluate iodine nutrition in populations through epidemiological studies recommended by the World Health Organization (WHO), the United Nations Children's Fund (UNICEF), the Iodine Global Network (IGN)[13] and the American Thyroid Association (ATA) Guidelines[16]. According to the epidemiological criteria for iodine nutrition status in PW, mUIC < 100 μg/L is classified as moderate and severe deficiency, an mUIC of 100–149 μg/L is classified as mild deficiency, and an mUIC in the range of 150–249 μg/L is classified as adequate iodine[17]. However, UIC is not a functional biomarker of iodine status; it only reflects recent intake (in the past one or two days) and may not represent an individual's usual intake[18]. To overcome the inter- and intra-individual variation of UIC, it is critical to study a large sample size to evaluate the actual iodine status at the population level. By contrast, the thyroid-specific protein thyroglobulin (Tg) shows promise as a functional biomarker of iodine status that better reflects long-term iodine intake (weeks or months)[19-20]. Serum Tg concentration reflects thyroid volume in both iodine-deficient and iodine-excess settings[21]. In ID, high Tg concentration results from TSH stimulation of the thyroid, leading to thyroid enlargement[20]. Tg is a more sensitive biomarker of iodine status than TSH and FT4, particularly in areas with mild ID[22]. Studies have explored the relationship between iodine status and serum Tg in populations, including school-age children[23], adults[24], and PW[25-26], from different countries. Those studies show that Tg might be a useful functional biomarker of low iodine status and may be used to understand the change in Tg concentration during pregnancy under conditions of mild ID. However, the global cut-off values of serum Tg for iodine sufficiency in pregnancy have not been established. A study among 6,325 pregnant women in China with sufficient iodine status determined by UIC reported a cut-off median serum Tg level of ≤ 13 µg/L and/or < 3% of serum Tg samples > 40 µg/L by using an electrochemiluminescence immunoassay as indicative of adequate iodine status, which was established among children[25].
The upper and lower limit values of the mUIC in PW with adequate iodine status recommended by WHO/UNICEF/IGN and ATA Guidelines have recently been questioned. Research on PW in China showed that, although the mUIC was less than the WHO's 150 μg/L benchmark, normal thyroid function was maintained in the women and their newborn babies[27]. This cross-sectional study enroll 812 healthy pregnant women to collect samples of their household edible salt, urine, and blood during their routine antenatal care in the 18 counties in Fujian Province, China. This study aimed to clarify the relationships between UIC, Tg, and thyroid dysfunction in Chinese PW in counties with an mUIC of 100–149 μg/L and 150–249 μg/L. In addition, this study aimed to explore whether Chinese pregnant women with an mUIC of 100–149 μg/L achieved through sustainable universal salt iodization need iodine supplementation.
-
China was an iodine-deficient country before the 1970s. In 1996, a mandatory program, termed universal salt iodization, was introduced nationwide. By 2000, Fujian Province, China had reached the goal of eliminating IDD. The latest ID survey in 2017, in Fujian Province reported that the overall spot mUIC among school-age children was 186.5 μg/L, with an average of 23.9 mg/kg iodine in household salt and 2.9 μg/L iodine in drinking water, respectively. However, pregnant women’s mUIC in approximately 50% of counties (42 out of 84 counties) was less than 150 μg/L, which were evenly distributed in 9 administrative regions in Fujian Province. Therefore, eighteen counties with an mUIC of PW in 100–149 μg/L or 150–249 μg/L were selected in this study.
-
A multi-stage, stratified, random sampling method was used in this study to obtain a representative sample of the Fujian PW. The formula for calculating stratifed random sampling sample size, n = z2 × S2 × def/d2, was used to calculate the sample size required for analysis. We defined the two-sided signifcance levels α = 0.05, 1−β = 0.9, and zα/2 = 1.96. The deff value of stratifed random sampling was 1. According to the variation in iodine intake, we needed at least 681 subjects. Considering participants’ refusal and the loss to follow-up, we recruited a total of 812 PW into the study. There were 9 administrative regions in Fujian Province, each of which a urban county and a rural county was selected respectively. A total of 18 counties were selected. For each selected county, five towns were randomly selected from five different geographical locations (east, west, south, north, and center). Ten PW routinely visiting antenatal care clinics in each chosen town were invited to participate in this study.
-
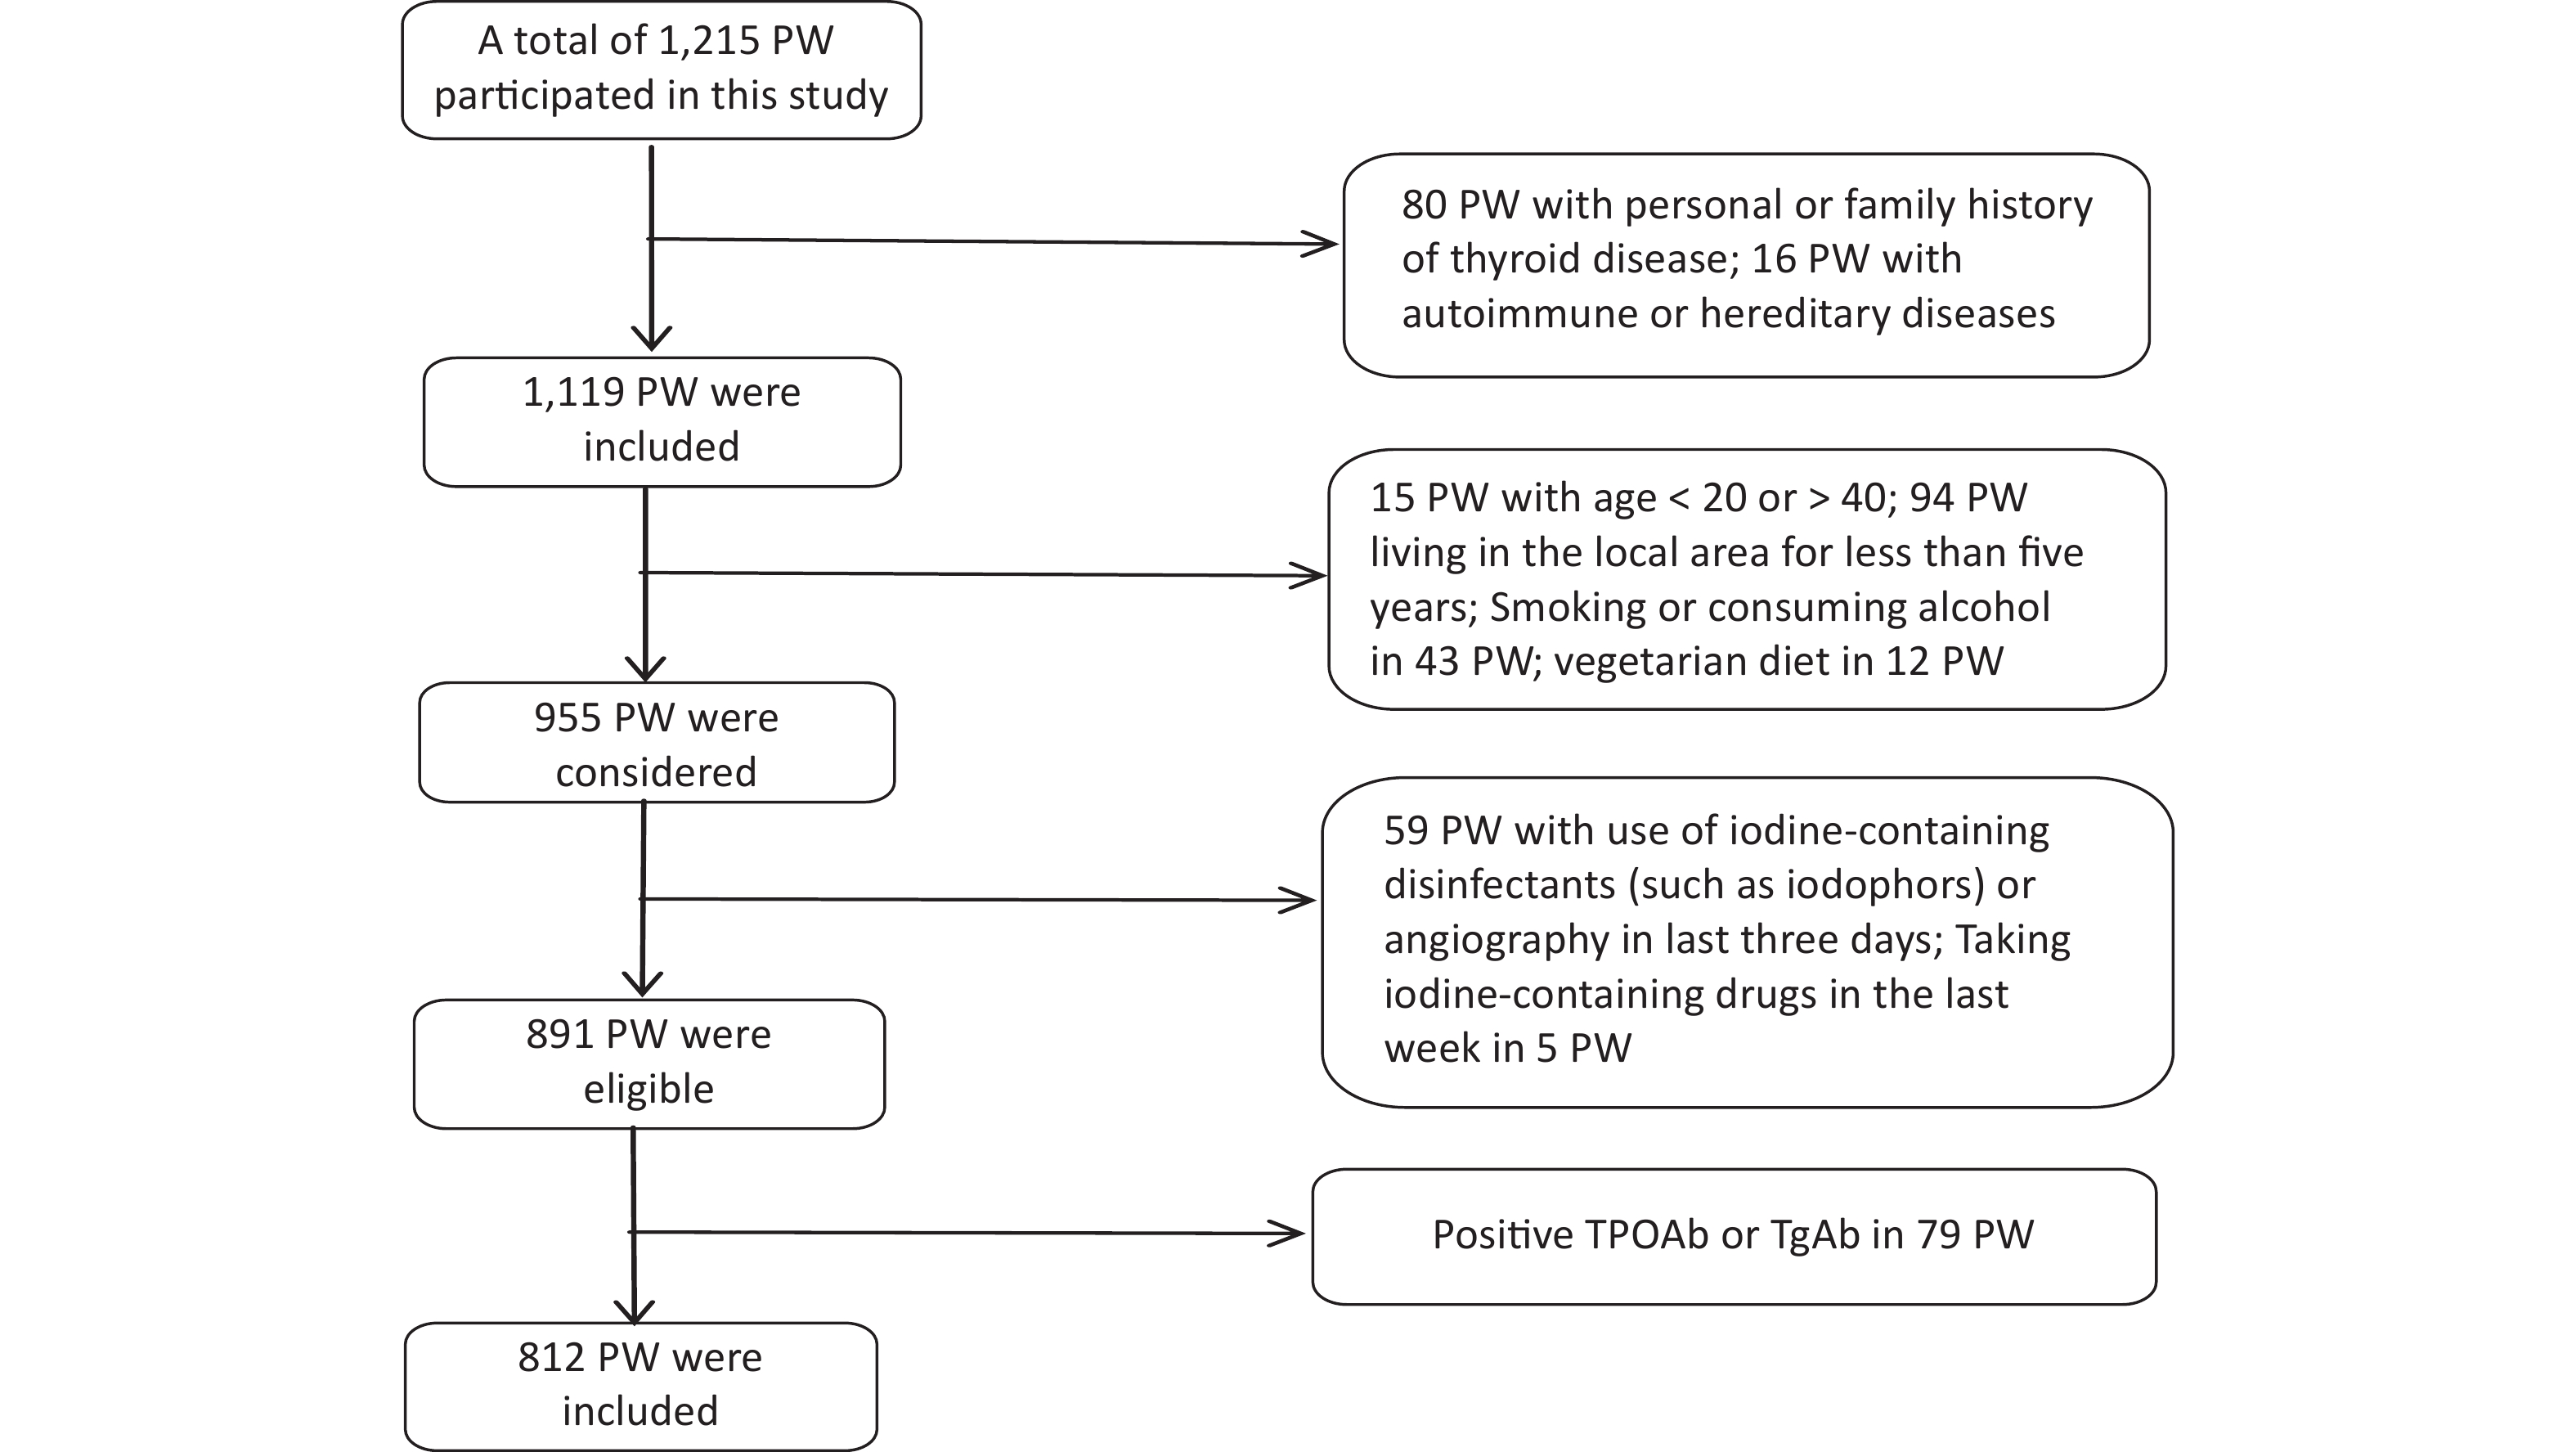
Data collection was conducted from 1 June 2020 to 30 September 2020. The gestational week was determined based on the time of the last menstruation [< 13 weeks was defined as the first trimester (T1), 13–27 weeks was the second trimester (T2), and ≥ 28 weeks was the third trimester (T3)][28]. Recruitment eligibility criteria are shown in Figure 1. 79 PW with Positive TPOAb or TgAb were excluded because Tg antibodies interfere with the detection of Tg in current assays, causing falsely low Tg measurement and potentially resulting in underestimation of the prevalence of iodine deficiency.
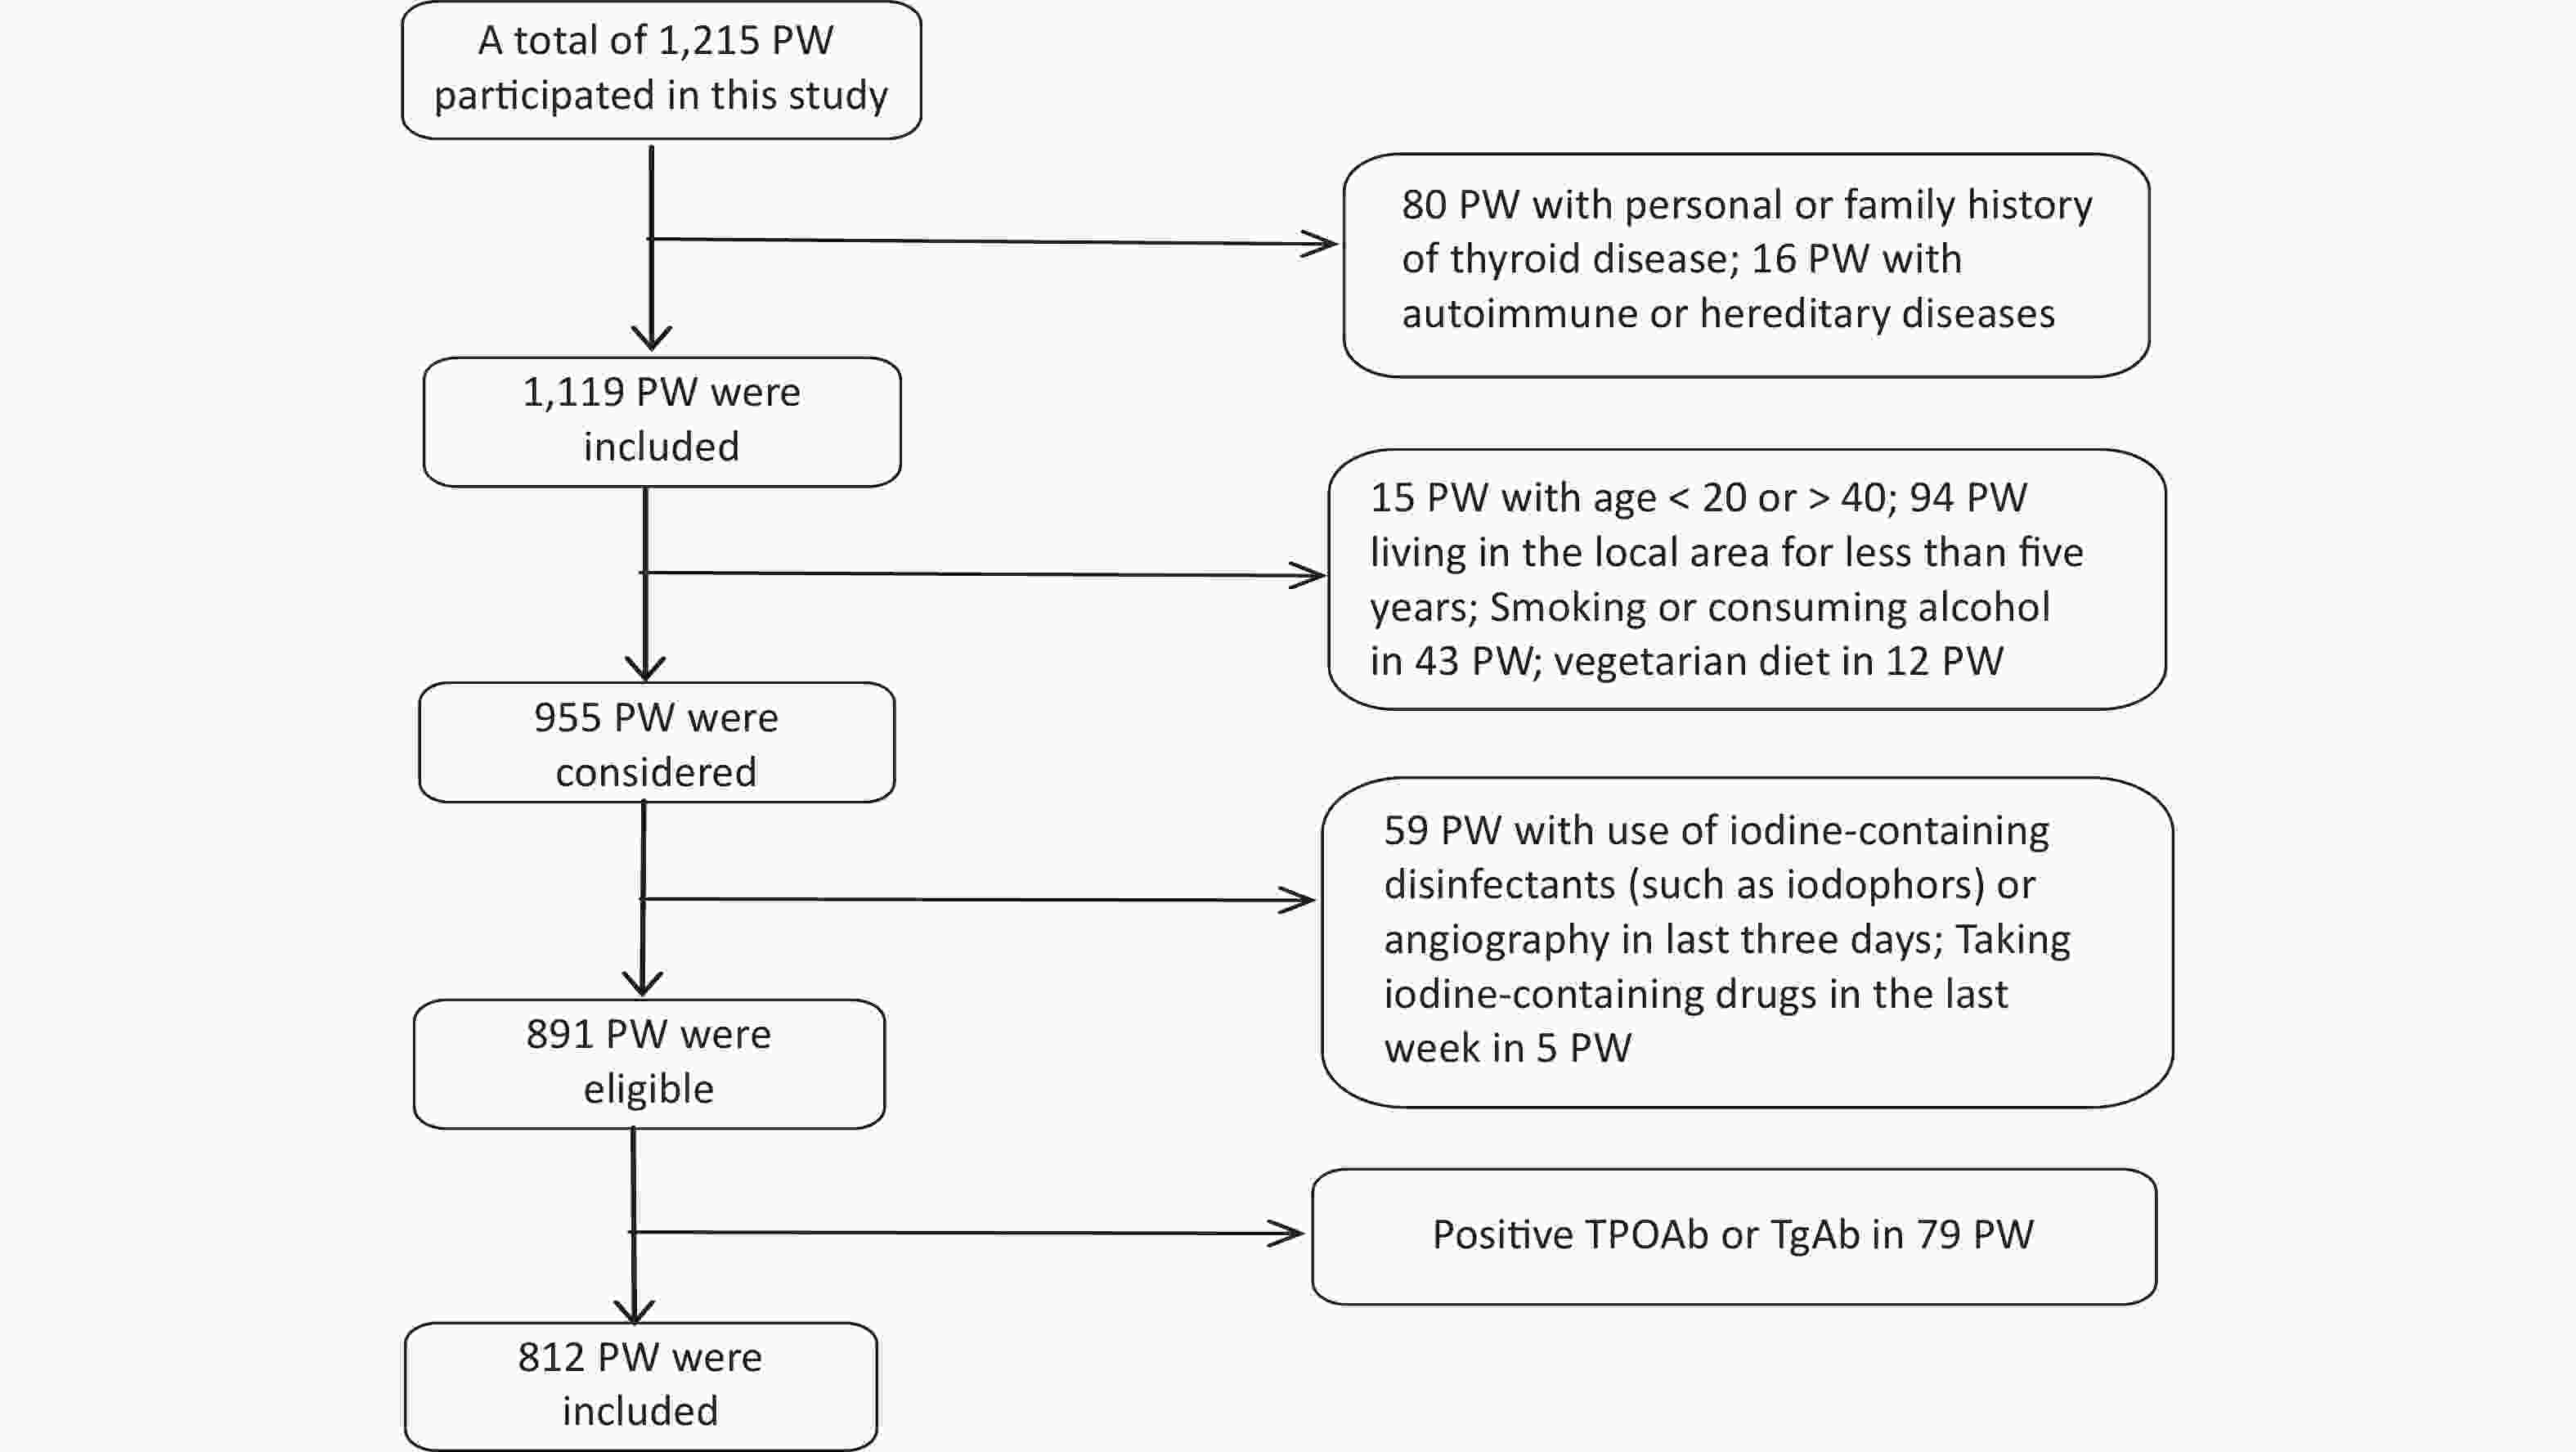
Figure 1. Flowchart of the pregnant women included in the analysis; PW, pregnant women.
The study was conducted according to the guidelines of the Declaration of Helsinki and approved by the Ethics Committee of Fujian Provincial CDC (No. 2020032). Informed consent was obtained from all participants.
-
All participants were asked to complete a questionnaire to obtain information including age, gestational week, parity, gravidity, past medical history, and iodized salt and nutritional supplementation. Height and weight were measured and recorded. Body mass index (BMI) was defined as (weight in kilograms)/(height in meters)2.
-
10 mL of drinking water sample was provided by each participant. Water samples were stored at –20 °C until analysis. We collected at least 50 g of household table salt from all participants in clean, labeled Ziplock bags and tested it for iodine content. A fasting single-spot urine sample was collected in the morning (between 08.00 hours and 11.00 hours) from each participant. Two milliliters of venous blood (no anticoagulant) were collected from study participants, allowed to stand at room temperature for 2 h and then centrifuged at 3,000 ×g. The serum was separated, stored at –80 °C in a clean, well-labeled plastic tube and then held at –20 °C for testing.
-
Thyroid ultrasonography was performed by an experienced examiner using a 7.5 MHz transducer to measure the thyroid volume, nodule diameter, and echogenicity. The depth (d), width (w), and length (l) of each lobe were measured, and the thyroid lobe volume was calculated using the following formula: V (mL) = 0.479 × d × w × l (mm)/1,000 and recorded as the sum of both lobes.
-
The iodine content in drinking water was determined by the method of As3+–Ce4+ catalytic spectrophotometry[29]. The iodine content in the salt samples was determined using the general test method of the salt industry[30]. The UIC was measured according to the health standard method of China for the determination of iodine in urine by As3+–Ce4+ catalytic spectrophotometry[31]. Levels of free triiodothyronine (FT3), free thyroid hormone (FT4), thyroid-stimulating hormone (TSH), thyroglobulin (Tg), thyroid peroxidase antibody (TPOAb) and thyroglobulin antibody (TgAb) were determined using a chemiluminescent immunoassay (Access2, Beckman, California, USA) and performed at the Laboratory Department of Endemic Diseases, Fujian Provincial Center for Disease Control and Prevention in China.
The laboratory assaying process included quality control. The reference substances of were used before, during and after the tests. The standard curves correlation coefcient of UIC had to be greater than 0.999.
-
The standard for iodine content of edible salt in Fujian was 25 mg/kg[32], and the allowable range of qualified iodized salt was 18–33 mg/kg[32]. The iodine content in non-iodized salt was < 5 mg/kg[33]. The coverage rate of iodized salt (CRIS) and consumption rate of qualified iodized salt (CRQIS) were the ratios of iodized salt or qualified iodized salt to the total number of salt samples tested. According to WHO/UNICEF/IGN recommendations, the adequate range of median urinary iodine for PW is 150–249 μg/L[13]. TSH and FT4 were categorized according to gestation period (T1–T3). The normal reference ranges [with 95% confidence interval (CI)] for the test kits (Beckman) used for TSH (in mIU/L) and FT4 (in pmol/L) according to trimester (T1, T2, and T3) were as follows: 0.03–4.00, 0.35–3.86, and 0.46–4.82 mIU/L for TSH and 9.54–16.09, 7.33–12.07, and 6.40–11.21 pmol/L for FT4, respectively. Data of PW with elevated thyroid function status according to these values are summarized in Table 1. TPO-Ab was considered positive with values > 9 IU/mL and TG-Ab with values > 4 IU/mL by the test kits (Beckman). Thyroid ultrasonography was performed according to Chinese health standards and the normal female thyroid volume is < 18 mL[34-35], and thyroid nodule is one or more nodule (> 5 mm) without goiter[36].
Thyroid function TSH (mIU/L)a FT4 (pmol/L)b Normal thyroid function Within normal range Within normal range Clinical hypothyroidism Exceeds normal range Within normal range Subclinical hypothyroidism Exceeds normal range Less than normal range Clinical hyperthyroidism Less than normal range Exceeds normal range Subclinical hyperthyroidism Less than normal range Within normal range Isolated hypothyroxinemia Within normal range Less than normal range Note. aNormal range for TSH (mIU/L): 0.03–4.00 (T1), 0.35–3.86 (T2), and 0.46–4.82 (T3). bNormal range for FT4 (pmol/L): 9.54–16.09 (T1), 7.33–12.07 (T2), and 6.40–11.21 (T3). FT4, free thyroxine; T1, the first trimester; T2, the second trimester; T3, the third trimester; TSH, thyrotropin. Table 1. Thyroid function in relation to plasma levels of TSH and FT4
-
IBM SPSS version 25 software (IBM Corp., Armonk, NY, USA) was used for all analyses. Qualitative data were expressed as numbers and percentages (%). The Kolmogorov–Smirnov test was used for normality. The mean and SD were used to describe the normal variables, while the median and interquartile range (IQR, P25–P75) were used for the skewed-distribute variables. Summary statistics were compared between groups or trimesters using either Student’s t-test or Wilcoxon tests for continuous data and chi-squared tests for categorical data. The comparison of Tg > 40 μg/L and thyroid diseases rate between groups or trimesters was made using either the chi-square test or Fisher’s exact probability method. A P-value below 0.05 was determined to be statistically significant.
-
Supplementary Table S1 (available in www.besjournal.com) shows the basic information on the eighteen studied counties, eight counties with an mUIC of 100–149 μg/L and ten counties with an mUIC of 150–249 μg/L among PW were classified as Group I and Group II, respectively. Table 2 shows the characteristics of 812 Fujian PW, including basic information on pregnancy and thyroid ultrasonography. The median drinking water iodine concentrations in PW in Group I and Group II were both less than 10.0 μg/L. The median salt iodine concentration (SIC) of Group I was lower than Group II (P < 0.05). The mUICs in PW in Group I and Group II were 130.8 (90.1, 193.5) μg/L and 170.2 (122.7, 243.2) μg/L, respectively. Figure 2 shows the frequency distributions of UIC in the two groups. Among PW in Group I, 61.3% had a UIC < 150 μg/L, among which 9.1% were < 50 μg/L, 25.9% had a UIC of 150–249 μg/L, and only five PW (0.8%) were ≥ 500 μg/L (Figure 2). In Group II, a UIC in 40.9% of the PW was < 150 μg/L, in 37.1% was 150–249 μg/L, and in 4.0% was ≥ 500 μg/L.
Sociodemographic characteristics Total Group I Group II P value N (%) 812 (100.0) 425 (52.3) 387 (47.7) Age (years) Mean (mean ± SD) 29.6 ± 4.3 29.4 ± 4.1 29.8 ± 4.5 0.059 Distribution, n (%) 0.339 20–24 115 (14.2) 57 (13.4) 58 (15.0) 25–29 265 (32.7) 151 (35.5) 114 (29.5) 30–34 326 (40.2) 165 (38.8) 161 (41.7) 35–40 105 (12.9) 52 (12.2) 53 (13.7) Gestational weeks Mean (mean ± SD) 20.8 ± 8.7 20.3 ± 8.8 21.3 ± 8.6 0.101 Distribution, n (%) 0.636 T1 (0–12) 190 (23.4) 104 (24.5) 86 (22.2) T2 (13–27) 410 (50.5) 215 (50.6) 195 (50.4) T3 (28–40) 212 (26.1) 106 (24.9) 106 (27.4) Pre-pregnancy BMI, kg/m2 Mean (mean ± SD) 21.6 ± 3.7 21.3 ± 3.3 22.0 ± 4.0 0.114 Categorized, n (%) < 24.0 643 (79.5) 349 (82.3) 294 (76.4) 0.077 24.0–27.9 123 (15.2) 58 (13.7) 65 (16.9) ≥ 28.0 43 (5.3) 17 (4.0) 26 (6.8) Household net income per capita
(RMB), n (%)0.068 ≤ 49,999 262 (32.3) 151 (35.5) 111 (28.7) 50,000–99,999 309 (38.1) 148 (34.8) 161 (41.6) ≥ 100,000 241 (29.7) 126 (29.6) 115 (29.7) Drinking water iodine concentration, μg/L Median, (P25–P75) 3.4 (1.1–5.7) 4.1 (2.4–6.6) 2.1 (0.9–5.5) < 0.001 Urinary iodine concentration, µg/L Median, (P25–P75) 148.2 (103.9–217.6) 130.8 (91.5–198.1) 172.0 (123.5–244.4) < 0.001 Salt iodine content, mg/kg Median, (P25–P75) 24.2 (23.0–25.6) 23.7 (22.4–24.8) 25.0 (23.6–26.4) < 0.001 Categorized n (%) 0.620 Non-iodized (< 5) 37 (4.6) 21 (4.9) 16 (4.1) Inadequately iodized (5 – < 18) 7 (0.9) 5 (1.2) 2 (0.5) Adequately iodized (18–33) 765 (94.2) 398 (93.6) 367 (94.8) Excessively iodized (> 33) 3 (0.4) 1 (0.2) 2 (0.5) Goiter prevalence rate, n (%) 10 (1.2) 6 (1.4) 4 (1.0) 0.626 Thyroid nodule detection rate, n (%) 154 (19.0) 86 (20.2) 68 (17.6) 0.333 Note. Data are expressed as mean ± SD, median (P25–P75) or n (%). Group I, the counties with an mUIC of PW in 100–149 μg/L; Group II, the counties with an mUIC of PW in 150–249 μg/L. T1, the first trimester; T2, the second trimester; T3, the third trimester; PW, pregnant women. Table 2. Characteristics of PW in Group I and Group II
Figure 2. Distribution of urinary iodine concentration in pregnant women (PW) between Group I and Group II.
Group County N WIC
(μg/L)SIC
(mg/kg)UIC
(μg/L)Group I Nanan 30 6.8 (4.1−9.2) 23.6 (22.6−24.2) 119.7 (73.4−221.8) Mingxi 79 0.2 (0.2−0.8) 23.7 (22.4−24.5) 111.8 (81.6−177.6) Taijiang 22 4.3 (4.1−4.3) 23.4 (19.9−25.7) 129.3 (103.6−174.1) Chengxiang 34 2.9 (2.4−3.2) 23.7 (22.4−24.7) 121.3 (86.9−213.0) Xiangcheng 41 8.1 (5.3−9.5) 23.4 (22.6−24.8) 128.8 (92.3−163.1) LiCheng 71 3.2 (2.4−4.0) 23.6 (22.1−24.3) 127.7 (88.9−159.5) Dongshan 57 6.6 (6.6−7.1) 24.5 (21.0−25.6) 128.9 (96.2−183.2) Jimei 46 5.3 (4.8−5.7) 23.9 (23.2−25.0) 147.2 (101.0−216.2) Total 425 4.1 (2.4−6.6) 23.7 (22.4−24.8) 130.8 (91.5−198.1) Group II Jian’ou 33 0.9 (0.9−1.1) 24.8 (23.6−26.6) 153.6 (120.0−204.8) Xiang’an 85 5.5 (5.1−5.5) 24.1 (23.1−25.3) 158.0 (107.2−229.9) Xinluo 40 0.8 (0.7−0.9) 25.1 (24.1−26.1) 171.0 (125.0−229.7) Changle 31 4.0 (4.0−7.2) 21.4 (19.9−26.2) 169.6 (115.4−234.8) Sanyuan 74 0.8 (0.7−2.1) 26.2 (25.0−27.9) 162.2 (127.4−232.5) XiaPu 19 6.0 (6.0−7.7) 24.4 (14.4−26.1) 160.0 (99.0−232.0) Jiaocheng 41 7.2 (7.2−7.2) 23.9 (22.2−25.1) 174.0 (110.0−273.5) Zhangping 54 1.0 (0.9−1.1) 26.6 (25.4−27.7) 185.1 (141.7−249.9) Licheng 35 9.6 (9.4−9.8) 23.7 (23.2−24.4) 195.3 (123.1−255.8) Yanping 25 2.1 (1.3−2.1) 25.5 (24.4−26.6) 215.9 (144.4−303.8) Total 387 2.1 (0.9−5.5) 25.0 (23.6−26.4)a 172.0 (123.5−244.4) Total 812 3.4 (1.1−5.7) 24.2 (23.0−25.6) 148.2 (103.9−217.6) Note. Data are expressed as median (P25–P75). WIC, drinking water iodine concentration; SIC, salt iodine concentration; UIC, urinary iodine concentration. Group I, the counties with median UIC of PW in 100–149 μg/L; Group II, the counties with median UIC of PW in 150–249 μg/L; aP < 0.05 between the two groups with Group I. Table S1. Basic information on the studied counties (n = 18) (medians and quartile ranges)
In this study, there was no difference in either CRIS or CRQIS (P > 0.05) between the two groups. Goiter prevalence and thyroid nodule detection rates showed no difference between the groups. There were no differences in the mean and/or specific distributions of age, gestational week, pre-pregnancy BMI or household net income between the two groups (P > 0.05), as presented in Table 2.
-
In Table 3, levels of UIC, Tg, TSH, FT4, and FT3 in the 812 PW analyzed are reported according to the three trimesters. There was no difference in UIC among different pregnancy periods in both Group I and Group II. The Tg concentration in PW in Group I was not higher than that in Group II 11.8 µg/L (6.9–17.1) vs. 10.6 µg/L (6.7–17.0; P > 0.05). No significant differences were observed in Tg between the two groups in each trimester of pregnancy or among trimesters in each group (P > 0.05). There were significant differences among the levels of serum TSH, FT4, and FT3 across trimesters (P < 0.05). The level of TSH increased across trimesters, and the level of FT4 and FT3 decreased across trimesters in both Group I and Group II. Compared with Group II, the level of FT4 was higher in the second trimester and throughout pregnancy in Group I (P < 0.05) . No significant differences were observed in TSH and FT3 between the two groups in each trimester of pregnancy (P > 0.05).
Indexes Gestation stage Total Group I Group II N M (P25–P75) N M (P25–P75) N M (P25–P75) UIC T1 190 151.8 (105.2–218.5) 104 144.4 (96.2–214.0) 86 168.1 (116.8–237.5)c (μg/L) T2 410 148.9 (106.0–222.0) 215 125.3 (90.3–193.4) 195 175.7 (127.6–244.4)c T3 212 147.9 (100.6–226.9) 106 125.8 (84.1–184.5) 106 166.8 (122.4–254.0)c ALL 812 148.2 (103.9–217.6) 425 128.9 (96.2–183.2) 387 172.0 (123.5–244.4) Tg T1 190 12.4 (7.3–16.8) 104 12.7 (7.1–16.7) 86 11.9 (7.8–16.9) (μg/L ) T2 410 10.4 (6.6–16.1) 215 10.9 (6.9–16.4) 195 10.2 (6.3–15.6) T3 212 11.7 (6.8–18.8) 106 12.1 (7.4–18.8) 106 11.3 (6.7–18.8) All 812 11.0 (6.8–17.1) 425 11.8 (6.9–17.1) 387 10.6 (6.7–17.0) TSH T1 190 1.1 (1.0–1.7) 104 1.1 (0.5–1.8) 86 1.1 (0.4–1.6) (mIU/L) T2 410 1.6 (1.0–2.1)a 215 1.6 (1.0–2.2)a 195 1.5 (1.0–2.0)a T3 212 1.8 (1.2–2.7)ab 106 1.7 (1.1–2.6)ab 106 1.9 (1.2–2.7)ab All 812 1.5 (1.0–2.1) 425 1.5 (1.0–2.1) 387 1.5 (1.0–2.2) FT4 T1 190 11.1 (9.9–12.3) 104 11.4 (10.1–12.4) 86 11.0 (9.9–12.4) (pmol/L) T2 410 8.7 (7.9–9.8)a 215 8.8 (8.1–9.9)a 195 8.6 (7.3–9.6)ac T3 212 8.0 (7.3–8.8)ab 106 8.2 (7.5–8.8)ab 106 7.9 (7.2–8.8)ab All 812 8.9 (7.9–10.3) 425 9.1 (8.1–10.5) 387 8.8 (7.6–10.0)c FT3 T1 190 4.9 (4.5–5.5) 104 5.0 (4.5–5.5) 86 4.9 (4.5–5.6) (pmol/L) T2 410 4.5 (4.3–4.8)a 215 4.5 (4.3–4.8)a 195 4.6 (4.3–4.8)a T3 212 4.4 (4.1–4.6)ab 106 4.4 (4.1–4.6)ab 106 4.5 (4.1–4.6)ab All 812 4.5 (4.3–4.9) 425 4.5 (4.3–4.9) 387 4.6 (4.3–4.9) Note. Data are expressed as median (P25–P75). Group I, the counties with an mUIC of PW in 100–149 μg/L; Group II, the counties with an mUIC of PW in 150–249 μg/L. aP < 0.05 between each trimester with the first trimester; bP < 0.05 between each trimester with the second trimester; cP < 0.05 between the two groups with each trimester or all trimesters. UIC, urinary iodine concentration; Tg, thyroglobulin; TSH, thyroid-stimulating hormone; FT4, free thyroxine; FT3, free triiodothyronine. T1, the first trimester; T2, the second trimester; T3, the third trimester; PW, pregnant women. Table 3. Thyroid function values and abnormal rates in PW at different stages of gestation, compared between Group I and Group II
-
As shown in Table 4, the rates of subclinical hypothyroidism, subclinical hyperthyroidism, clinical hyperthyroidism, isolated hypothyroxinemia, and Tg values > 40 µg/L were 0.7%, 1.2%, 0.9%, 0.5% and 1.9% in Group I, and 1.6%, 2.3%, 2.3%, 1.3%, and 2.3% in Group II, respectively. The rates of subclinical hypothyroidism, subclinical hyperthyroidism, clinical hyperthyroidism, isolated hypothyroxinemia, and Tg values > 40 µg/L in the two groups in trimesters T1, T2, and T3 are presented in Table 4. According to trimesters, the study reported no difference in the TDR and the rate of Tg values > 40 µg/L between the two groups (P > 0.05).
Indexes Gestation stage Total Group I Group II Subclinical hypothyroidism, n (%) T1 7 (3.6) 2 (1.9) 5 (5.8) T2 1 (0.2) 1 (0.5) 0 (0.0) T3 1 (0.5) 0 (0.0) 1 (0.9) All 9 (1.1) 3 (0.7) 6 (1.6) Subclinical hypothyroidism, n (%) T1 2 (1.1) 2 (1.9) 0 (0.0) T2 11 (2.7) 3 (1.4) 8 (4.1) T3 1 (0.5) 0 (0.0) 1 (0.9) All 14 (1.7) 5 (1.2) 9 (2.3) Clinical hyperthyroidism, n (%) T1 9 (4.7) 3 (2.9) 6 (7.0) T2 4 (1.0) 1 (0.5) 3 (1.5) T3 0 (0.0) 0 (0.0) 0 (0.0) All 13 (1.7) 4 (0.9) 9 (2.3) Isolated hypothyroxinemian,
n (%)T1 0 (0.0) 0 (0.0) 0 (0.0) T2 2 (0.5) 0 (0.0) 2(1.0) T3 5 (2.4) 2 (1.9) 3(2.8) All 7 (0.9) 2 (0.5) 5(1.3) TDR,
n (%)T1 30 (15.8) 13 (12.5) 17 (19.8) T2 39 (9.5) 18 (8.4) 21 (10.8) T3 18 (8.5) 6 (5.7) 12 (11.3) All 87 (10.7) 37 (8.7) 50 (12.9) Tg > 40 μg/L,
n (%)T1 2 (1.1) 0 (0.0) 2 (2.3) T2 5 (1.2) 3 (1.4) 2 (1.0) T3 10 (4.7) 5 (4.7) 5 (4.7) All 17 (2.1) 8 (1.9) 9 (2.3) Note. Group I, the counties with an mUIC of PW in 100–149 μg/L; Group II, the counties with an mUIC of PW in 150–249 μg/L. T1, the first trimester; T2, the second trimester; T3, the third trimester; TDR, thyroid diseases prevalence rate; Tg, thyroglobulin; PW, pregnant women. Table 4. TDR and rate of Tg values > 40 µg/L in PW at different stages of gestation, compared between Group I and Group II
-
Table 5 shows the changes in UIC, Tg, TSH, FT4, and FT3 with different supplementation measures between the two groups. The mUIC with iodine salt and iodine-containing compound vitamins (SI&IPMV) was higher than with non-iodine salt (NSI) and only iodine salt (SI) in the two groups (P < 0.05). In Group I, FT4 in PW with SI&IPMV was higher than in those with SI (P < 0.05). Compared with SI, there was no difference in Tg, TSH, and FT3 with SI&IPMV (P > 0.05), neither in Group I or Group II, as presented in Table 5.
Index Iodine supplement
measuresTotal Group I Group II N M (P25–P75) N M (P25–P75) N M (P25–P75) UIC NSI 37 115.9 (85.1–170.1) 21 129.0 (90.2–191.8) 16 103.8 (70.2–139.2) (μg/L) SI 724 148.8 (104.3–218.1) 386 136.0 (96.0–193.0) 338 172.3 (125.5–244.1) SI&IPMV 51 198.7 (130.8–282.4)ab 18 157.9 (103.3–260.0)ab 33 215.3 (146.2–301.7)ab Tg NSI 37 11.8 (7.6–16.0) 21 12.1 (7.0–17.2) 16 14.3 (10.2–19.7) (μg/L) SI 724 11.1 (6.8–17.1) 386 9.8 (6.8–14.5) 338 10.3 (6.6–16.7) SI&IPMV 51 10.2 (6.1–18.1) 18 8.7 (5.7–14.9) 33 10.7 (7.5–19.0) TSH NSI 37 1.5 (0.7–2.0) 21 1.5 (1.0–2.1) 16 1.3 (0.7–2.2) (mIU/L) SI 724 1.6 (1.0–2.2) 386 1.5 (1.0–2.1) 338 1.5 (1.0–2.2) SI&IPMV 51 1.1 (0.7–2.2) 18 1.0 (0.7–2.1) 33 1.4 (0.7–2.3) FT4 NSI 37 8.7 (7.6–11.2) 21 8.7 (7.9–10.8) 16 8.8 (7.2–11.3) (pmol/L) SI 724 8.9 (7.9–10.3) 386 9.1 (8.0–10.4) 338 8.7 (7.6–10.0) SI&IPMV 51 9.8 (7.5–11.5) 18 10.8 (8.8–11.9)b 33 9.1 (7.3–10.9) FT3 NSI 37 4.5 (4.4–4.9) 21 4.5 (4.3–4.9) 16 4.6 (4.5–4.9) (pmol/L) SI 724 4.5 (4.3–4.9) 386 4.5 (4.3–4.9) 338 4.6 (4.3–4.9) SI&IPMV 51 4.6 (4.5–5.2) 18 4.7 (4.4–5.3) 33 4.5 (4.5–4.8) Note. Data are expressed as median (P25–P75). Group I, the counties with an mUIC of PW in 100–149 μg/L; Group II, the counties with an mUIC of PW in 150–249 μg/L. aP < 0.05 between different iodine supplementation measures with NSI; bP < 0.05 between different iodine supplementation measures with SI. NSI, non-iodine salt; SI, only iodine salt; SI&IPMV, iodine salt and iodine-containing compound vitamins; UIC, urinary iodine concentration; Tg, thyroglobulin; TSH, thyroid-stimulating hormone; FT4, free thyroid hormone; FT3, free triiodothyronine; PW, pregnant women. Table 5. Indicators of thyroid function and Tg in PW with different iodine supplementation measures, compared between Group I and Group II
-
Subclinical hypothyroidism, subclinical hyperthyroidism, clinical hyperthyroidism, isolated hypothyroxinemia, and Tg values > 40 µg/L with NSI, SI, and SI&IPMV in the two groups are presented in Table 6. In the two groups, the study found no differences in the TDR and the rate of Tg values > 40 µg/L between different supplementation measures (P > 0.05).
Index Iodine supplement measures Total Group I Group II Subclinical hypothyroidismn,
n (%)NSI 0 (0.0) 0 (0.0) 0 (0.0) SI 8 (1.1) 2 (0.5) 6 (1.8) SI&IPMV 1 (2.0) 1 (5.6) 0 (0.0) Subclinical
hyperthyroidism,
n (%)NSI 0 (0.0) 0 (0.0) 0 (0.0) SI 14 (1.9) 5 (1.3) 9 (2.7) SI&IPMV 0 (0.0) 0 (0.0) 0 (0.0) Clinical
hyperthyroidism,
n (%)NSI 3 (7.7) 1 (4.3) 2 (12.5) SI 10 (1.3) 4 (1.0) 6 (1.6) SI&IPMV 2 (3.6) 0 (0.0) 2 (5.6) Isolated
hypothyroxinemia,
n (%)NSI 0 (0.0) 0 (0.0) 0 (0.0) SI 6 (0.8) 2 (0.5) 4 (1.2) SI&IPMV 1 (2.0) 0 (0.0) 1 (3.0) TDR,
n (%)NSI 3 (8.1) 1 (4.8) 2 (12.5) SI 38 (5.2) 13 (3.3) 25 (7.4) SI&IPMV 4 (7.8) 1 (5.6) 3 (9.1) Tg > 40 μg/L,
n (%)NSI 0 (0.0) 0 (0.0) 0 (0.0) SI 17 (2.3) 8 (2.1) 9 (2.7) SI&IPMV 0 (0.0) 0 (0.0) 0 (0.0) Note. Data are expressed as n (%). Group I, the counties with an mUIC of PW in 100–149 μg/L; Group II, the counties with an mUIC of PW in 150–249 μg/L. NSI, non-iodine salt; SI, iodine salt; SI&IPMV, iodine salt and iodine-containing compound vitamins; TDR, thyroid diseases prevalence rate; Tg, thyroglobulin; PW, pregnant women. Table 6. Rates of thyroid disease and Tg > 40 μg/L in PW with different iodine supplementation measures, compared between Group I and Group II
-
Adequate iodine intake is essential throughout the life cycle, but is particularly critical during pregnancy, as iodine is a necessary component of thyroid hormones needed for normal fetal brain development. In this study, iodine intakes in PW were sufficient in ten counties (172.0 µg/L) and mildly deficient in eight counties (130.8 µg/L). The mUIC in PW in the latter eight counties determined in this study is similar to that reported in some coastal cities in China, such as Shanghai (138.1 µg/L) and Zhejiang (147.5 µg/L)[37] and foreign countries, such as the USA (131.0 µg/L)[38], Brazil (137.7 µg/L)[39], and many European countries[40]. The overall mUIC (148.2 µg/L) is analogous to that of PW (146.0 µg/L) enrolled in the 2015 Chinese Adults Chronic Diseases and Nutrition Surveillance[41]. In this study, UIC showed no change throughout gestation in the counties with an mUIC of 100–149 µg/L or 150–249 µg/L, which is consistent with some previous cross-sectional studies[42-43]. However, increases in renal iodine clearance in early pregnancy may lead to progressive depletion of total body iodine[44]. Other prior cross-sectional studies show decreases in UIC with the progression of pregnancy[14-15,45-46]. In moderately-to-severely iodine-deficient countries, only two previous cohort studies have documented increasing UIC values across gestation[47-48]. The different trends in UIC with the progression of pregnancy may be due to the fact that PW of different trimester in the cross-sectional study were not from the same population.
The increase in TSH throughout gestation in both iodine status groups reflects a well-known physiological change[16]. In the first trimester, TSH is suppressed owing to the transient effect of human chorionic gonadotropin (hCG). TSH then increases in the second and third trimesters[16]. This study showed no difference in TSH between those with an mUIC of 100–149 μg/L and 150–249 μg/L, which is consistent with the previous studies[49-50]. Changes in FT3, FT4, and TSH across pregnancy in our study were consistent with most prior studies, likely due in part to hCG-mediated alterations in thyroid hormone synthesis[37,51]. The changes and relationships of FT3, FT4, and TSH during pregnancy may depend on the stage of gestation.
This study's primary types of abnormal thyroid function was subclinical hypothyroidism (1.7%). The prevalence of subclinical hypothyroidism in pregnant women did not change with pregnancy. There were no significant differences in the prevalence of subclinical hypothyroidism between an mUIC of PW in 100–149 μg/L and 150–249 μg/L. According to a European Thyroid Society report, the global prevalence of subclinical hypothyroidism among PW is 2.0%–2.5%[52]. In the two large-scale epidemiological studies in China, the majority of subclinical hypothyroidism among PW in the groups with a UIC of 100–149 μg/L (2.2% reported by Teng[25] and 4.7%–5.2% by Yang[41]) was not higher than in the groups with a UIC of 150–249 μg/L (2.4% reported by Teng[25] and 5.5% by Yang[41]). Inadequate or excessive iodine intake can lead to subclinical hypothyroidism. With iodine deficiency, thyroid hormone synthesis is insufficient to maintain normal thyroid function, resulting in subclinical hypothyroidism. The cause of excess iodine in subclinical hypothyroidism is twofold. First, excessive iodine intake can cause or aggravate thyroid autoimmune reaction, which may damage the thyroid, leading to a decrease of iodine in the thyroid and an increase of TSH secretion[25]. Second, long-term high iodine intake inhibits pituitary type 2 deiodinase and induces an increase in serum TSH[53].
Maternal isolated hypothyroxinemia during early pregnancy is a vital thyroid disorder that impairs fetal neurodevelopment[54]. Isolated hypothyroxinemia was once attributed to iodine deficiency; however, we did not observe this in our study in the counties with an mUIC of 100–149 μg/L when compared with the counties with an mUIC of 150–249 μg/L.
Further evaluation of the iodine nutrition of PW in the counties with an mUIC of 100–149 μg/L and 150–249 μg/L in this study was provided by serum Tg. Tg has shown promise as an iodine-status marker and has been used successfully, along with UIC, in various populations. A recent review of Tg found the median Tg to be more than 13 μg/L in the majority of studies of PW from iodine-deficient areas[20], but in our study, the median Tg concentration in PW with an mUIC of 100–149 μg/L was 12.7, 10.9, and 12.1 μg/L in trimesters one, two, and three, respectively. There was no difference in the rates of Tg values > 40 μg/L in PW between mUIC of 100–149 μg/L and mUIC of 150–249 μg/L counties. The mUICs of PW with pregnancy process from the same population were < 100 μg/L in the in the majority of studies[20], which may be the reason for the inconsistency with the results of this study.
The overall TDR in this study was similar to reported rates[55]. The TDR in the PW in counties with mUIC of 100–149 μg/L was no higher than that in counties with an mUIC of 150–249 μg/L. Maternal UI was not associated with TDR or maternal thyroid hormone concentrations[56], consistent with some previous studies[55]. However, a large cross-sectional Chinese study by Yang et al. recently concluded that the rate of subclinical hypothyroidism was higher in PW with a UIC > 250 µg/L than in women with a UIC in the range of 120–249 µg/L[41]. Yang’s research was grouped by individual UIC instead of population’s mUIC. Whether having a UIC in the range of 100–149 μg/L adversely affects thyroid function in PW is still unknown[57].
Iodine supplementation had no significant effect on maternal thyroid function across gestation in this study, consistent with Gowachirapant et al.[58]. Thus, the available evidence suggests that pregnant women may be able to adapt physiologically to mildly low iodine intakes during pregnancy, draw from intrathyroidal iodine stores, and maintain fetal euthyroidism, allowing for normal in utero development[13]. It is important to remember that brain damage occurring in utero during ID is not directly caused by a lack of iodine but is indirectly due to the inadequate synthesis of thyroid hormones by the mother and fetus[2]. Thus, maternal and/or infant hypothyroidism is likely the best available surrogate marker for the risk of cognitive damage[2]. Notably, in the review of Dineva et al.[12], despite seven of the RCTs reporting very low baseline maternal mUICs (< 65 μg/L), there was no consistent benefit of iodine supplements on maternal thyroid function. Furthermore, as emphasized by Dineva et al.[12], adequately powered randomized controlled trials of the effect of iodine supplementation in pregnant women on child development are needed to answer this question finally and should be a priority of future research in this field.
Our study results suggest that, in a region in which the USI target has been reached in the long term, an mUIC of PW is 100–149 μg/L with no additional iodine supplementation is probably sufficient to ensure adequate thyroid function in pregnancy. This is consistent with two recent large-sample national nutrition surveys in China: when the UIC is lower than the WHO benchmark, the thyroid function level can still be acceptable[27,59].
Our study has some strengths. We compared PW’s thyroid function and TDR in two county-level units with different iodine nutrition intakes, with detailed grouping by trimester in a reliable and representative population[60]. Many previous studies only compared subgroups of an overall sample of PW with UIC of 150 μg/L or so, but in our research, mUICs of PW were 100–149 μg/L by county-level units. Our analysis compared PW’s thyroid function, TDR, and Tg after excluding PW with thyroid antibody positive status in the counties with an mUIC of 100–149 μg/L and 150–249 μg/L, by trimester, in a large population. In addition, we considered the effect of demographics and the use of iodine supplementation. However, in our study the limitation was no offspring indicators about iodine status, such as neonatal thyroid-stimulating hormone and children’s IQ values. More evidence is needed from a specific cohort study about iodine nutrition, maternal thyroid function, and brain development in the offspring to support our findings.
-
Compared with an mUIC of 150–249 μg/L, the Tg value, rate of Tg values > 40 µg/L, and TDR were not higher in pregnant women in the counties with an mUIC of 100–149 μg/L achieved through sustainable universal salt iodization in Fujian Province, China.
-
The study was conducted according to the guidelines of the Declaration of Helsinki and approved by the Ethics Committee of Fujian Provincial CDC (No. 2020032).
HTML
Survey Areas
Sampling Method
Participant Selection
Data Collection
Sample Collection
Thyroid Volume Measurements and Goiter
Determination of Iodine in Drinking Water, Salt, Urine, and Blood Samples
Reference Standard
Statistical Analysis
Characteristics of Study Participants
Differences in UIC, Tg, FT3, FT4, and TSH at Different Stages of Gestation
TDR and Rate of Tg Values > 40 µg/L at Different Stages of Gestation between the Two Groups
Changes in UIC, Tg, TSH, FT4, and FT3 with Different Supplementation Measures
TDR and Rate of Tg Values > 40 µg/L with Supplementation Measures, Compared between the Two Groups
 22319+Supplementary Materials.pdf
|

|

 Quick Links
 DownLoad:
