


-
Neoadjuvant chemoradiotherapy (nCRT), followed by total mesorectal excision (TME) and adjuvant chemotherapy is the standard therapeutic regimen for patients with locally advanced rectal cancer (LARC)[1]. As previously mentioned[2], nCRT can increase R0 resection rates, improve downstaging accuracy, and reduce recurrence rates. The drawbacks of radiation, including a high prevalence of anastomotic leakage, rectovaginal fistula, delayed healing of perineal incisions, defecation, and sexual dysfunction, have drawn attention to its use[3]. Furthermore, in the majority of clinical trials, nCRT did not increase overall survival. These factors have led to the development of a few clinical trials that have explored the optimization of neoadjuvant chemotherapy (nCT) without radiation and have produced encouraging results[4-6]. nCT was superior to nCRT in sphincter preservation rate and non-inferior to nCRT in downstaging, R0 resection, local relapse, and distant metastasis[6]. Patients who achieve a pathologic complete response (pCR) or near pCR may benefit from organ- and function-preserving strategies such as local excision and wait-and-see[7,8]. In contrast, patients who do not respond to nCT may experience increased nCT-related side effects and financial hardship, in addition to a longer recovery period following surgery. Therefore, it is necessary to develop a reliable method for predicting pathological responses before nCT administration in patients with LARC.
Systemic inflammation is related to the progression of various cancers through the induction of angiogenesis, metastasis, malignant cell proliferation, and alteration of the response to systemic therapy[9]. Neutrophils can mediate tumor angiogenesis and downregulate anticancer immunity[10]. Lymphocytes that infiltrate the tumor tissue have a higher level of specific immunological reactivity against tumor cells[11]. Tumor-associated macrophages significantly delay tumor growth[12]. The interaction between cancer and the immune system may extend beyond local tissues. It is believed that the imbalance between neutrophils and lymphocytes results from tumor necrosis or hypoxia and is linked to anti-apoptotic effects. Previous studies have demonstrated a correlation between the pathological response to nCRT and the prognosis of patients with LARC and the peripheral blood neutrophil-to-lymphocyte ratio (NLR), platelet-to-lymphocyte ratio (PLR), and lymphocyte-to-monocyte ratio (LMR)[13,14]. However, Wang et al. found that systemic inflammatory indices before or after treatment had no significant association with pCR, and the percentage change in NLR from pre-to post-nCRT was a predictor of poor pCR[15]. Serum albumin level and lymphocyte count in the peripheral blood were combined to create the prognostic nutritional index (PNI), a readily quantifiable index reflecting a patient’s nutritional and immunological state[16]. Additionally, studies have demonstrated that pretreatment PNI can be an effective predictor of nCRT response and survival in patients with LACR[17,18]. Nevertheless, all previous studies have focused on a single index and predicted the pathological response in patients with LARC after nCRT. However, the predictive value of these markers for nCT has not yet been investigated.
Consequently, the objective of this retrospective study was to examine the utility of employing pretreatment systemic inflammatory nutritional biomarkers to predict the pathological responses in patients with LARC after nCT.
-
This study was approved by the Ethics Committee of China-Japan Friendship Hospital (No. 2022-KY-072). Because this was a retrospective study, and all data were anonymized and collected routinely in clinical practice, the need for obtaining informed consent from patients was waived.
This single-center, retrospective cohort study was conducted at a tertiary referral hospital in China and included a consecutive series of patients with clinical Stage II/III rectal cancer who underwent nCT between January 2017 and September 2022. The inclusion criteria were as follows: (1) all patients (aged ≥ 18 years) were pathologically diagnosed as rectal adenocarcinoma; (2) locally advanced rectal cancer (cT3-4/N0-2, or any T/N1-2, and M0) cases were confirmed by magnetic resonance imaging (MRI) or computed tomography (CT); (3) all patients underwent standard nCT more than two cycles, followed by standard TME surgery; (4) no metastasis or other tumor events occurred during nCT and operation.
The exclusion criteria were as follows: (1) a history of malignancy or chemoradiation therapy; (2) nonstandard nCT or nCRT or radiotherapy alone; (3) clinical indications of an inflammatory disorder or infection, such as rheumatoid arthritis or inflammatory bowel disease, and (4) insufficient data.
-
The numbers of neutrophils, lymphocytes, monocytes, thrombocytes, and albumin (ALB) in peripheral blood samples taken within one week before the initiation of nCT were recorded. Clinicopathological data were obtained from corresponding medical records.
-
NLR, PLR, and LMR values were calculated as follows: NLR, neutrophil/lymphocyte; PLR, platelet/lymphocyte; LMR, lymphocyte/monocyte; PNI, [10 × serum albumin (g/dL) + 0.005 × total lymphocyte count (/mm3)].
-
TME was undertaken within 4–6 weeks of the completion of nCT. Evaluation of the surgical resection specimen for the residual tumor was performed using a standard reporting protocol. The American Joint Committee of Cancer (AJCC) tumor regression grade (TRG) system[19] was employed to stratify the pathological response as follows: TRG 0 (no viable cancer cells); TRG 1 (single cells or rare small groups of cancer cells); TRG 2 (residual cancer with evident tumor regression but more than single cells or rare small groups of cancer cells), and TRG 3 (extensive residual tumor with no evident tumor regression). TRG 0–2 was defined as a response and TRG 3 was defined as a non-response to evaluate the value of systemic inflammatory-nutritional biomarkers in predicting non-response. In contrast, we defined TRG 0–1 as a good response and TRG 2–3 as a poor response to evaluate the value of systemic inflammatory nutritional biomarkers in predicting patients with pCR and near pCR. TRG was independently evaluated by two experienced gastroenterology pathologists who were blinded to the clinicopathological information of the patients. In cases of disagreement between the two pathologists, a third expert pathologist made the final decision.
-
SPSS for MAC (version 29.0; SPSS, Inc., Chicago, USA) was used to compare the variables. P < 0.05 was considered to indicate a statistically significant difference. Independent t-test and chi-square tests were performed for univariate analyses. Continuous data are expressed as mean ± standard deviation (SD), and categorical data are presented as frequency (percentage). Multivariate logistic regression analysis was performed for statistically significant variables in the univariate analysis using a forward stepwise procedure to examine the final predictors of the pathological response to nCT. The optimum cutoff laboratory values were determined using receiver operating characteristic (ROC) curve analysis.
-
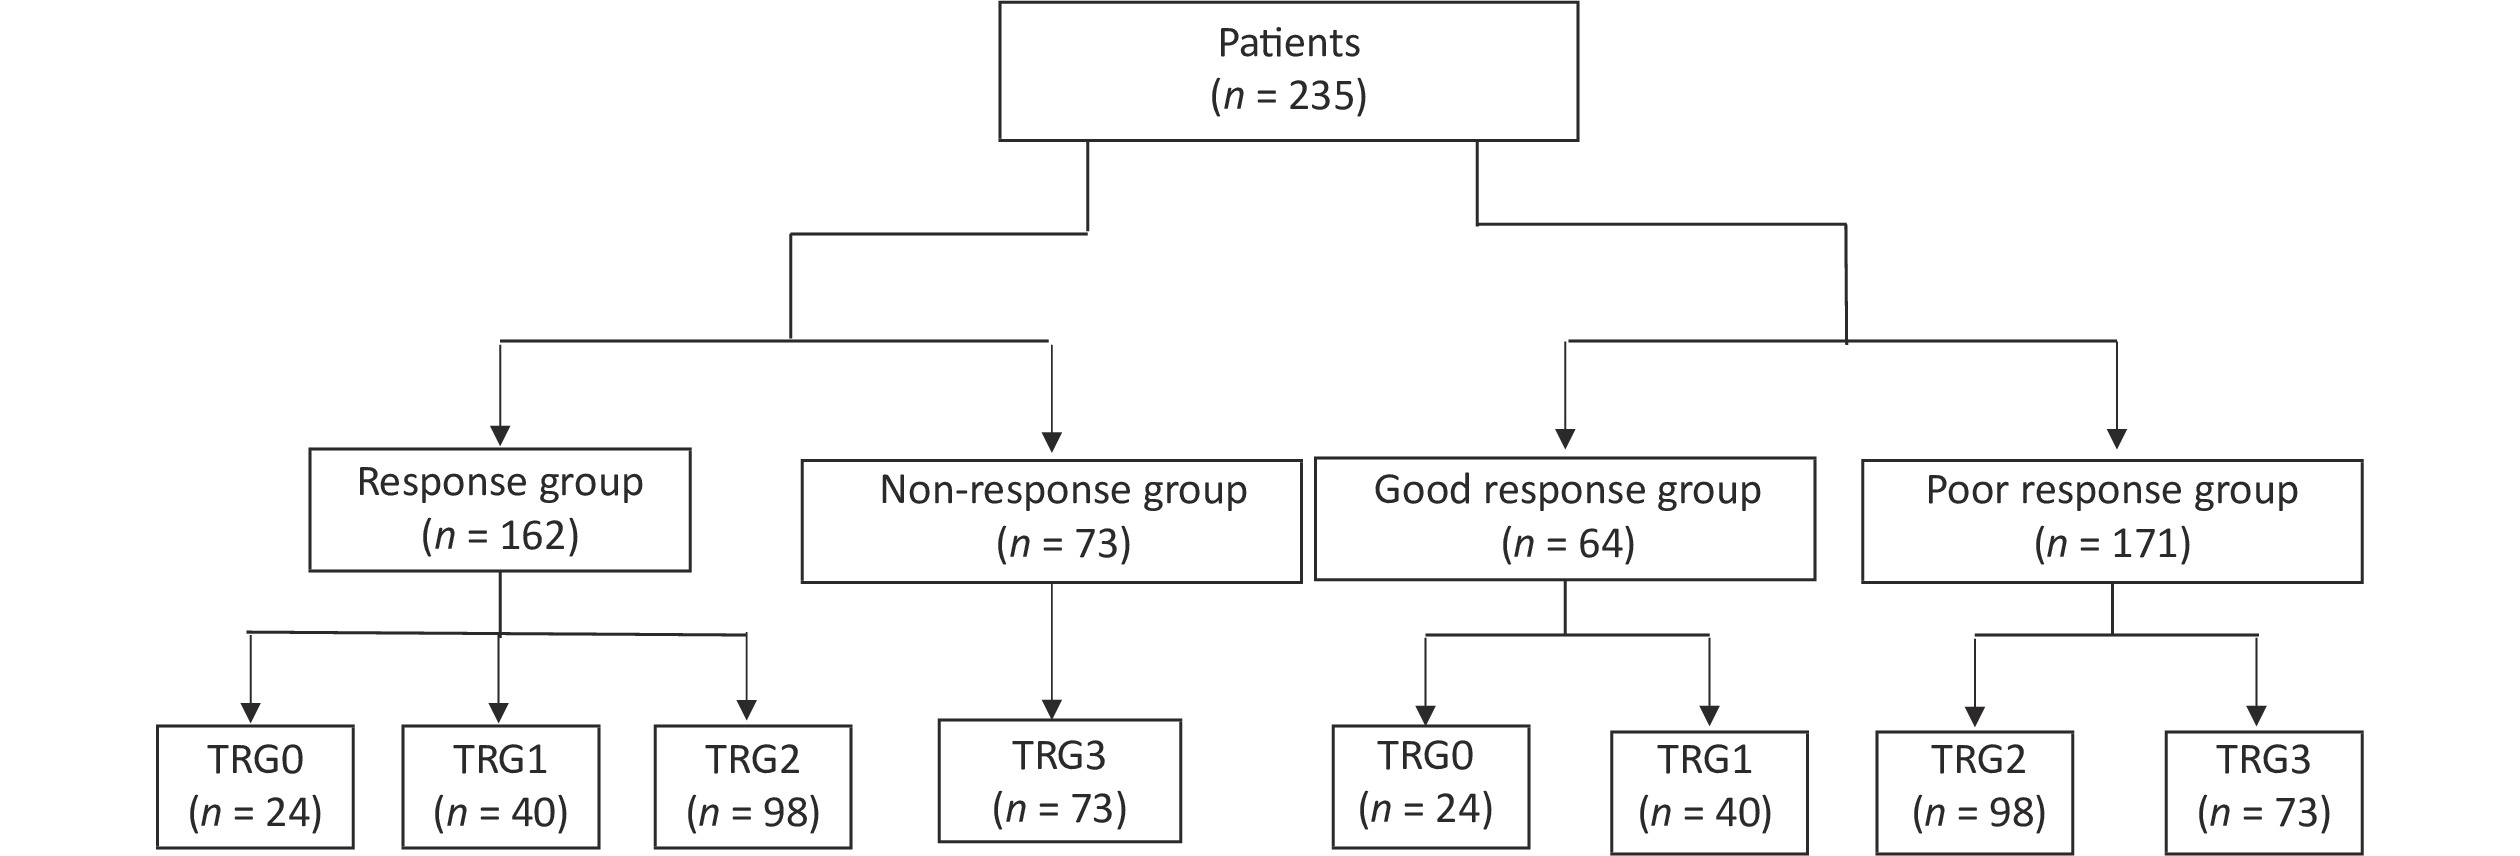
In total, 235 patients with LARC who underwent TME after nCT were enrolled in this study. The number of patients classified as TRG0, TRG1, TRG2, and TRG3 according to the AJCC on Cancer TRG system was 24 (10.2%), 40 (17.0%), 98 (41.7%), and 73 (31.1%), respectively. Subsequently, 162 (68.9%) patients were categorized into the response group, 73 (31.1%) into the non-response group, 64 (27.2%) patients in the good response group, and 171 (72.8%) patients in the poor response group (Figure 1). There were no differences in sex, age, tumor location, clinical tumor (cT) stage, or clinical lymph node (cN) stage between patients with and without a response, and there were no differences between patients with good and poor responses. Demographic and clinicopathological characteristics of the patients are shown in Table 1.

Figure 1. Patient grouping. TRG, tumor regression grade.
Characteristics Response group
(n = 162, 68.9%)Non-response group
(n = 73, 31.1%)P Good response group
(n = 64, 27.2%)Poor response group
(n = 171, 72.8%)P Age (years), mean ± SD 58.8 ± 11.4 58.7 ± 10.6 0.929 59.3 ± 10.9 58.6 ± 11.2 0.654 Gender, n (%) 0.764 0.497 Male 110 (67.9) 51 (69.9) 46 (71.9) 115 (67.3) Female 52 (32.1) 22 (30.1) 18 (28.1) 56 (32.7) Tumor distance from anal
verge (AV, cm), n (%)0.285 0.668 < 5 70 (43.2) 26 (35.6) 28 (43.8) 68 (39.8) 5 – < 10 86 (53.1) 46 (63.0) 35 (54.7) 97 (56.7) 10–15 6 (3.7) 1 (1.4) 1 (1.5) 6 (3.5) Clinical T stage, n (%) 0.676 0.102 cT2 17 (10.5) 10 (13.7) 12 (18.8) 15 (8.8) cT3 125 (77.2) 56 (76.7) 45 (70.3) 136 (79.5) cT4 20 (12.3) 7 (9.6) 7 (10.9) 20 (11.7) Clinical N stage, n (%) 0.110 0.091 cN0 29 (17.9) 20 (27.4) 13 (20.3) 36 (21.1) cN1 89 (54.9) 30 (41.1) 39 (60.9) 80 (46.8) cN2 44 (27.2) 23 (31.5) 12 (18.8) 55 (32.2) Table 1. Patient characteristics and pathological response to neoadjuvant chemotherapy
-
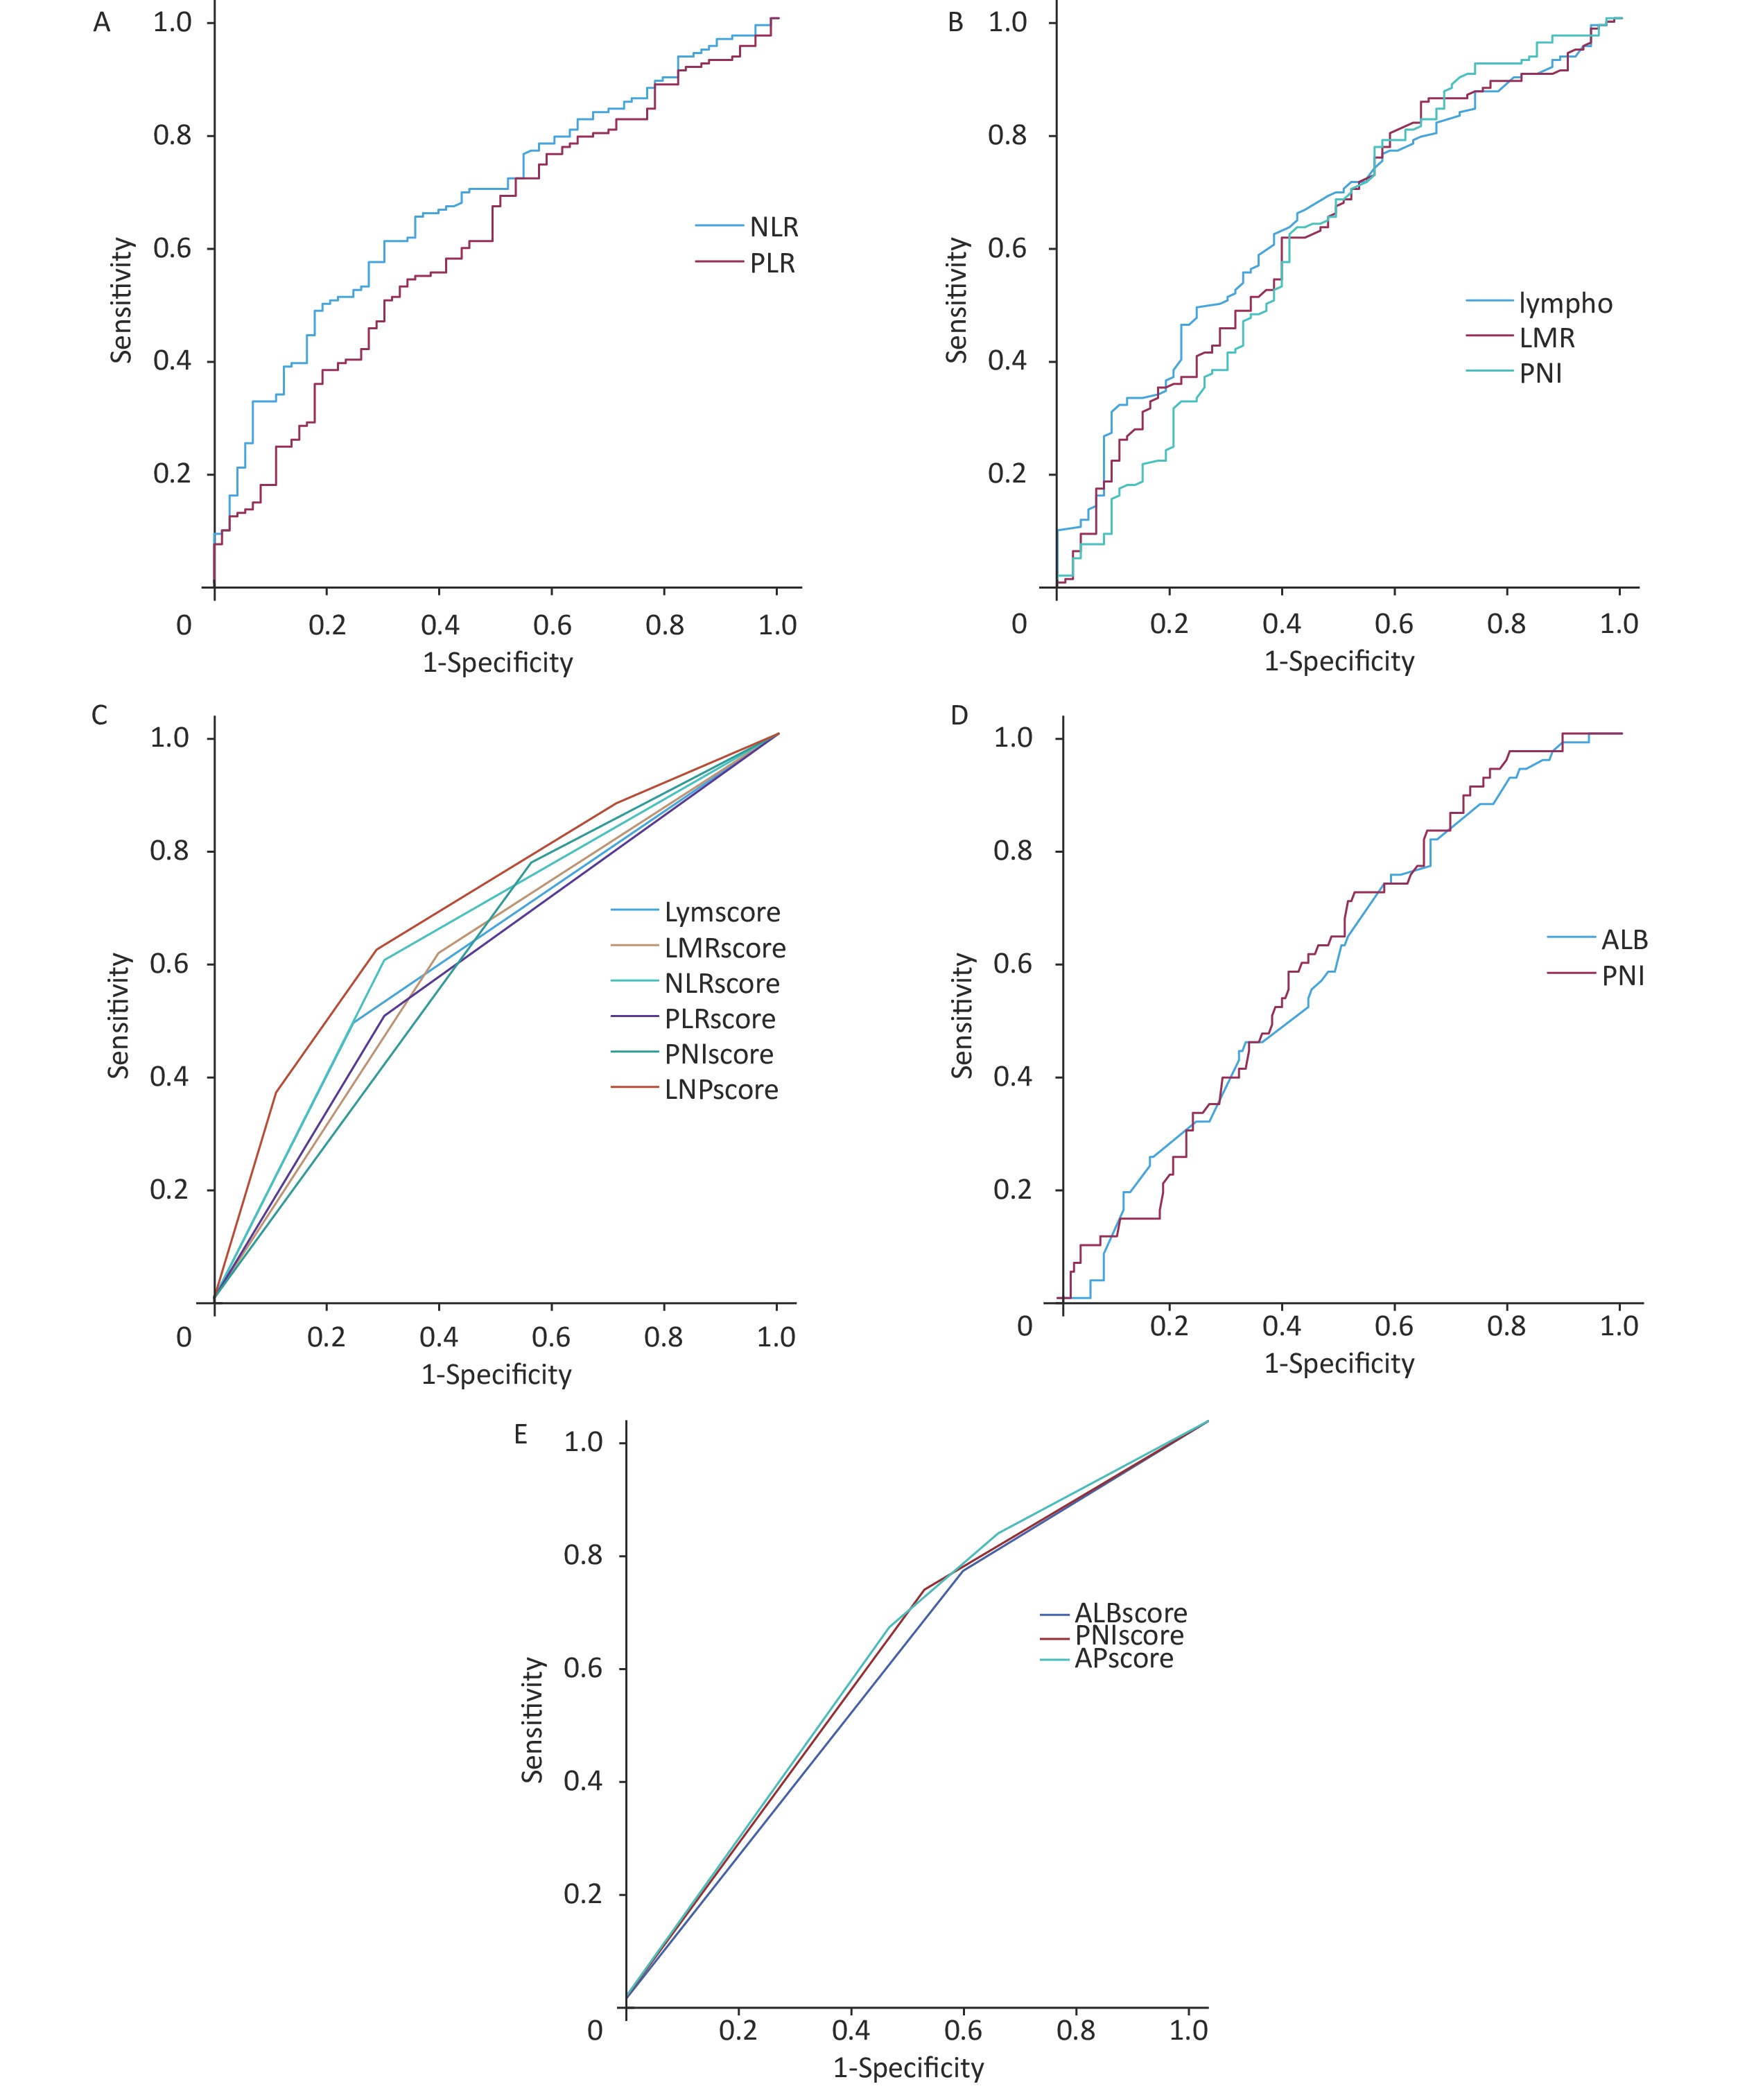
The relationship between pretreatment systemic inflammatory-nutritional biomarkers and the pathological response to nCT is shown in Tables 2–3, respectively. Non-responsive individuals showed lower lymphocyte levels, LMR, and PNI, and greater NLR and PLR than patients who responded. In patients with LARC, NLR could independently predict non-response to nCT according to a multivariate logistic regression analysis. The best cutoff values for pretreatment systemic inflammatory-nutritional markers for identifying non-responders were determined using ROC curve analysis (Figure 2A–B). The results indicated that the threshold values for predicting non-responsive patients were 1,750/mm3, 2.39, 136.07, 3.91, and 50.08, and the areas under the ROC curve (AUC) were 0.641, 0.677, 0.612, 0.620, and 0.607 for lymphocyte level, NLR, PLR, LMR, and PNI, respectively.
Systemic inflammatory-nutrition
biomarkersResponse group
(n = 162, 68.9%)Non-response group
(n = 73, 31.1%)Univariate analysis
PMultivariate analysis
PNeutrophil (/mm3) 4003.7 ± 1295.3 4314.4 ± 1256.3 0.078 Lymphocyte (/mm3) 1812.5 ± 555.0 1544.7 ± 444.1 < 0.001 0.188 Monocyte (/mm3) 449.1 ± 168.1 442.2 ± 144.0 0.760 Platelet (109/L) 252.8 ± 89.4 248.1 ± 64.4 0.684 Albumin (g/L) 43.4 ± 3.7 42.7 ± 5.1 0.262 Pre-Alb (mg/L) 197.9 ± 55.1 193.2 ± 63.5 0.566 NLR 2.39 ± 0.95 2.96 ± 1.29 < 0.001 0.026 PLR 150.16 ± 63.81 173.20 ± 78.3 0.018 0.447 LMR 4.41 ± 1.69 3.87 ± 1.90 0.032 0.928 PNI 52.34 ± 4.60 50.65 ± 5.97 0.033 0.324 Note. Pre-Alb, pre-albumin; NLR, neutrophil-to-lymphocyte ratio; PLR, platelet-to-lymphocyte ratio; LMR, lymphocyte-to-monocyte ratio; PNI, prognostic nutritional index. Table 2. Univariate and multivariate analyses for predicting non-responders (mean ± SD)
Systemic inflammatory-nutrition
biomarkersGood response group
(n = 64, 27.2%)Poor response group
(n = 171, 72.8%)Univariate analysis
PNeutrophil (/mm3) 4153.6 ± 1295.3 4080.2 ± 1234.0 0.689 Lymphocyte (/mm3) 1813.3 ± 485.7 1697.9 ± 552.7 0.143 Monocyte (/mm3) 472.7 ± 194.5 437.4 ± 145.6 0.134 Platelet (109/L) 250.1 ± 103.7 251.8 ± 73.1 0.886 Albumin (g/L) 44.1 ± 3.1 42.8 ± 4.5 0.013 Pre-Alb (mg/L) 203.2 ± 49.3 193.9 ± 60.5 0.275 NLR 2.39 ± 0.82 2.63 ± 1.21 0.134 PLR 144.63 ± 58.99 162.07 ± 72.35 0.086 LMR 4.28 ± 1.64 4.23 ± 1.83 0.838 PNI 53.18 ± 3.68 51.31 ± 5.45 0.003 Note. Pre-Alb, pre-albumin; NLR, neutrophil-to-lymphocyte ratio; PLR, platelet-to-lymphocyte ratio; LMR, lymphocyte-to-monocyte ratio; PNI, prognostic nutritional index. Table 3. Univariate analysis for predicting the patients with good responses (mean ± SD)
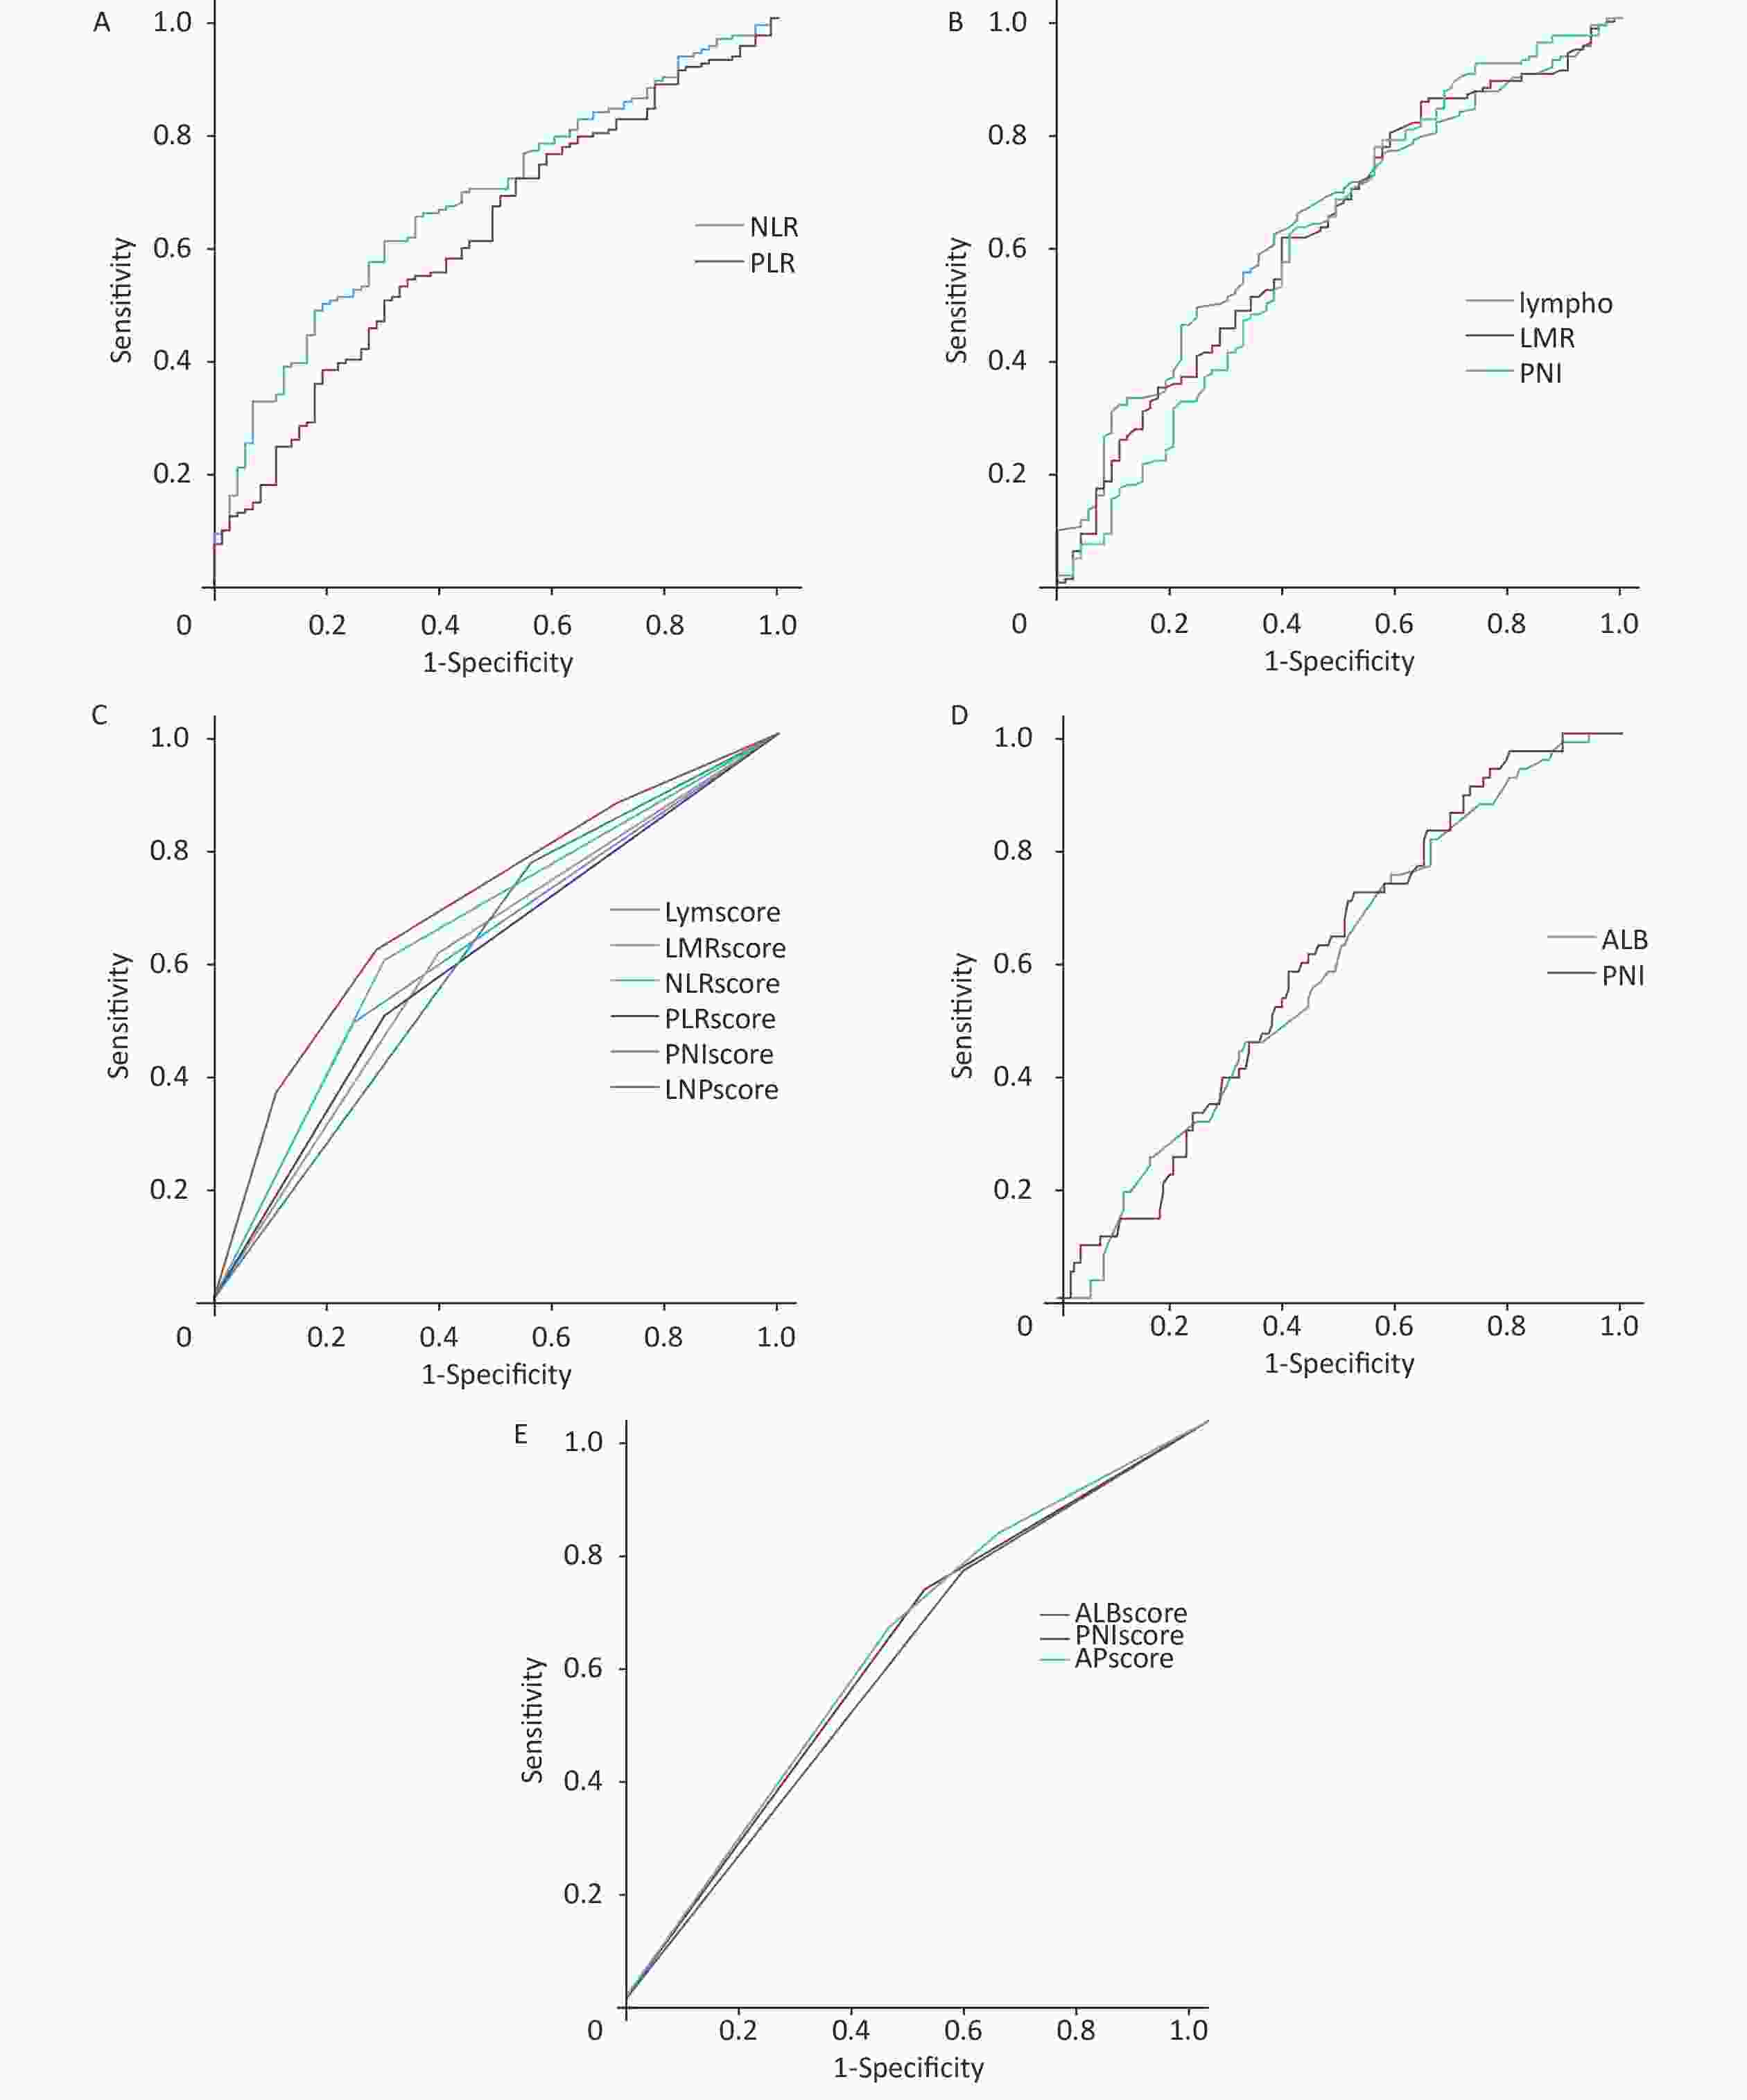
Figure 2. Receiver operating characteristic (ROC) curve analysis of pretreatment systemic inflammatory-nutrition biomarkers for predicting non-responders and patients with good responses. (A) ROC curve analysis of NLR and PLR for predicting non-responders. (B) The ROC analysis of lymphocyte, LMR, and PNI for predicting non-responders. (C) ROC curve analysis of the inflammation-nutrition scoring system for predicting non-responders. (D) ROC analysis of ALB and PNI for predicting the patients with good responses. (E) ROC analysis of the inflammation-nutrition scoring system for predicting the patients with good responses.
The inflammation-nutrition scoring system for predicting patients with non-response was defined as follows: lymphocyte level < 1,750/mm3 was Lymscore 1; LMR < 3.91 was LMRscore 1; PNI < 50.08 was PNIscore 1; NLR > 2.39 was NLRscore 1; PLR > 136.07 was PLRscore1, and other cases were score 0. We used the Lymscore, NLRscore, and PNIscore to create the inflammation-nutrition scoring system (LNPscore) to increase prediction accuracy.
LNPscore = Lymscore + NLRscore + PNIscore.
The predictive efficacy of the score is shown in Figure 2C and Table 4. The AUC of the LNP score was 0.694 from the ROC analysis, and the cutoff value was 2. Thus, the patients were divided into two groups– LNP score-high (LNP score = 2 or 3) and LNP score-low (LNP score = 0 or 1). A total of 121 instances (51.5%) were in the LNP score-low group, and 114 cases (48.5%) were in the LNP score-high group. The clinical characteristics of the patients in both groups are summarized in Table 5. The two groups differed significantly in the TRG.
Group Parameters AUC Sensitivity Specificity Non-response group Lymscore 0.621 0.488 0.753 LMRscore 0.607 0.611 0.603 NLRscore 0.649 0.599 0.699 PLRscore 0.599 0.500 0.699 PNIscore 0.605 0.772 0.438 LNPscore 0.694 0.617 0.712 Good response group ALBscore 0.582 0.409 0.750 PNIscore 0.596 0.474 0.719 APscore 0.605 0.532 0.656 Table 4. Inflammation-nutrition scoring system for predicting non-responders and patients with good responses
Characteristics LNPscore-Low
(121, 51.5%)LNPscore-High
(114, 48.5%)P Age (years, mean ± SD) 57.6 ± 11.6 60.4 ± 10.4 0.097 Gender, n (%) 0.415 Male 80 (66.1) 81 (71.1) Female 41 (33.9) 33 (28.9) Tumor distance from anal verge (AV, cm), n (%) 0.468 < 5 50 (41.3) 46 (40.4) 5 – < 10 69 (57.0) 63 (55.3) 10–15 2 (1.7) 5 (4.4) cT stage, n (%) 0.491 cT2 14 (11.6) 13 (11.4) cT3 96 (79.3) 85 (74.6) cT4 11 (9.1) 16 (14.0) cN stage, n (%) 0.968 cN0 26 (21.5) 23 (20.2) cN1 61 (50.4) 58 (50.9) cN2 34 (28.1) 33 (28.9) TRG, n (%) < 0.001 0 15 (12.4) 9 (7.9) 1 27 (22.3) 13 (11.4) 2 58 (47.9) 40 (35.1) 3 21 (17.4) 52 (45.6) Table 5. Comparison of patient characteristics between LNPscore-Low and LNPscore-High groups
-
Higher ALB levels and PNI were observed in patients with a good response than in those with a poor response. The best cutoff values for pretreatment systemic inflammatory nutritional markers for identifying patients with good responses were determined using ROC curve analysis (Figure 2D). The ALB and PNI had cutoff values of 42.4 g/dL and 51.23, respectively. The inflammation-nutrition scoring system for predicting patients with a good response was defined as follows: ALB > 42.4 g/dL was ALBsocre 1; PNI > 51.23 was PNIscore 1. We used ALBsocre and PNIscore to create an inflammation-nutrition scoring system (APscore) to increase prediction accuracy. APscore = ALBsocre + PNIscore. The predictive efficacy of the score is shown in Figure 2E and Table 4.
-
In this study, an inflammation-nutrition scoring system was developed to identify patients with LARC who did not respond to nCT. Non-responders had higher NLR and LNP scores than responders. The LNP score had a sensitivity of 71.2% and a specificity of 61.7%.
Despite more than two decades since the establishment of nCRT for rectal cancer, differentiating between patients who respond to nCT and those who do not remains difficult prior to the initiation of therapy. The patient's response to nCT may have affected the treatment strategy. For example, intensive nCT could be administered to patients expected to achieve pCR or near pCR, and watch-and-wait or local excision could be used to improve the survival and quality of life[20]. In contrast, for patients who do not respond to chemotherapy, nCT is an alternative treatment unless the tumor is unresectable.
At present, most studies have attempted to predict pCR but have overlooked the prediction of non-response to neoadjuvant therapy in patients with LARC. The non-response rate after neoadjuvant therapy is approximately 32.2%, which is higher than the 15%–27% pCR rate[21-23]. Therefore, to predict non-response, we divided the patients into the TRG 0-2 and TRG 3 groups. The main purpose of our study was to differentiate non-responders from LARC patients receiving nCT using inflammatory nutritional markers.
TRG evaluation methods for neoadjuvant therapy in rectal cancer are based on the AJCC[19], Mandard[24], Dowrak/Rodel[25], and Memorial Sloan-Kettering Cancer Center (MSKCC)[26] guidelines. However, no universally accepted standard exists. A previous study found that the AJCC system more accurately predicts recurrence than other methods and should be adopted as the standard[27]. Therefore, we used the AJCC-TRG to grade the nCT response in our study.
Several studies have reported that radiomic and pathological features help predict the pathological response to nCRT for LARC[21-23,28]. Radiomic and pathomic parameters reflect local tumor circumstances more accurately than host-related characteristics. The onset and progression of rectal cancer are increasingly being understood as dependent on elements linked to the host’s as well as the tumor’s features[29].
Hematological markers such as neutrophils, lymphocytes, NLR, PLR, LMR, and PNI can reflect systemic inflammatory responses. Several previous studies[15,30] have examined the changes in these markers before and after treatment to predict the response and prognosis but it was more accurate than prediction and unable to prevent patients who were resistant to therapy from receiving ineffective preoperative care. Our study chose preoperative systemic inflammatory-nutritional biomarkers to distinguish pathological responses (including total and partial responses) from non-responders with LARC to prevent this occurrence.
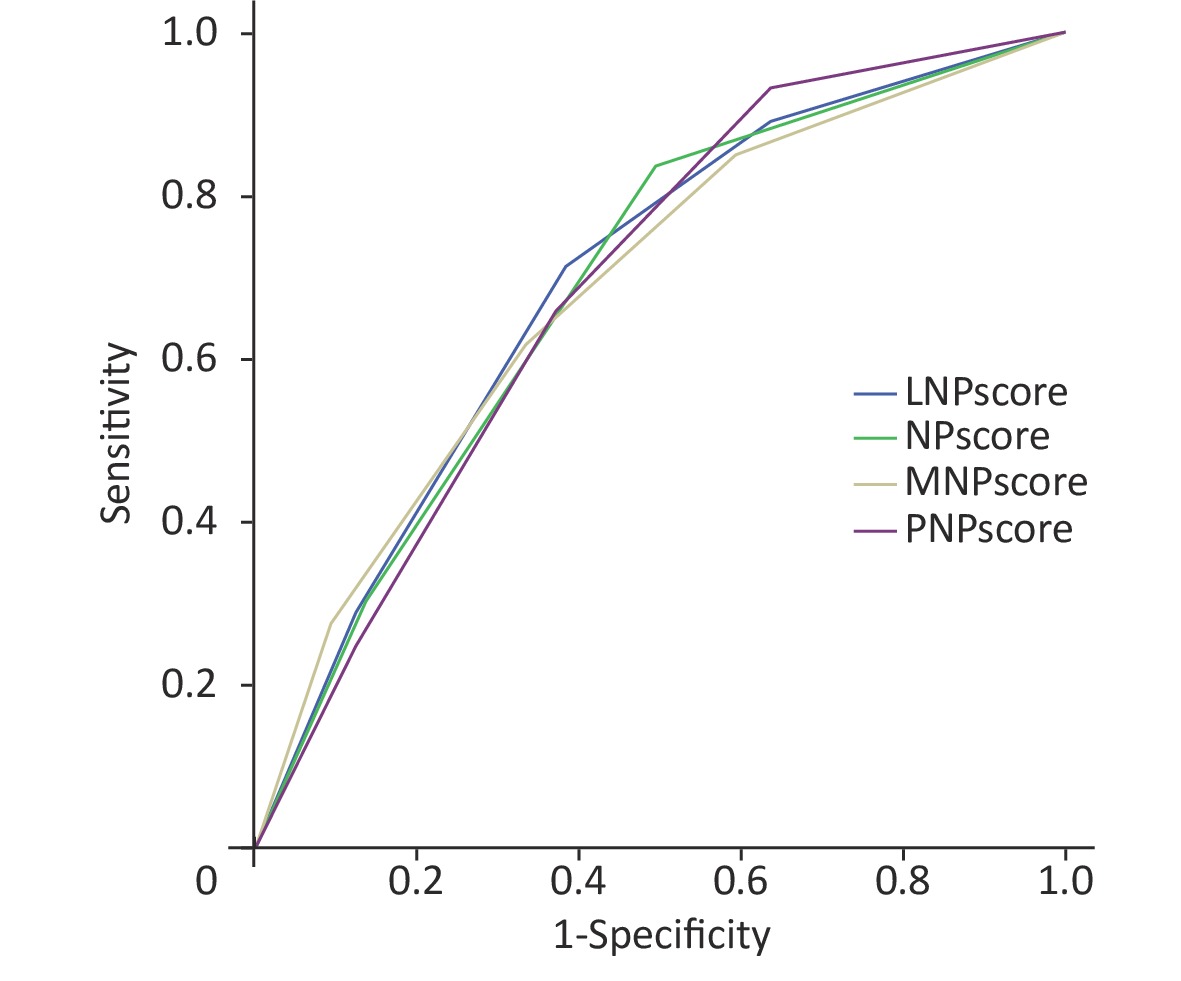
Systemic inflammatory-nutritional markers, such as neutrophils, lymphocytes, NLR, PLR, LMR, and PNI, have been identified in the published literature to have certain value in predicting the pathological response to nCRT in rectal cancer; however, the findings have frequently generated debate. Kim et al.[31] found that it was not possible to employ the NLR, LMR, or PLR to differentiate between complete tumor regression and residual disease following nCRT. Michael et al.[32] reported that in patients with LARC who underwent nCRT followed by radical surgery, NLR and PLR were neither independent biomarkers of pathological response nor prognostic variables. Caputo et al.[33] found postoperative complications and poor responses to nCRT were strongly linked to a greater NLR and derived neutrophil-to-lymphocyte ratio (d-NLR) following nCRT. This study demonstrated that the NLR was an independent predictor of pathological response based on univariate and multivariate analyses. Although lymphocyte level, PLR, LMR, and PNI were significant factors in the univariate analysis, they were insignificant in the multivariate analysis, which may be because these markers naturally correlate with the NLR. The threshold value of NLR for predicting non-response was 2.39, resulting in a sensitivity of 69.9% and a specificity of 59.9%. AUC was 0.649. To increase the prediction accuracy, we created an inflammation-nutrition scoring system using NLR, PNI, and another biomarker. It was found that the inflammation-nutrition scoring system created by lymphocyte count, NLR, and PNI had better predictive performance than the other combinations (Supplementary Figure S1 and Supplementary Table S1, available in www.besjournal.com). We named this scoring system the LNPscore, which had a sensitivity of 71.2% and a specificity of 61.7%. AUC was 0.694.

Figure S1. Receiver operating characteristic (ROC) analysis of pretreatment systemic inflammatory-nutrition scoring system composed of different combinations for predicting the patients with non-response.
Group Parameters AUC Sensitivity Specificity Non-response group NPscore 0.689 0.836 0.506 MNPscore 0.687 0.616 0.667 PNPscore 0.689 0.932 0.364 LNPscore 0.694 0.712 0.617 Note. NPscore = NLRscore + PNIscoer; MNPscore = LMRscore + NLRscore + PNIscoer; PNPscore = PLRscore + NLRscore + PNIscoer; LNPscore = Lymscore + NLRscore + PNIscoer. Table S1. Predictive effectiveness of pretreatment systemic inflammatory-nutrition scoring system composed of different combinations for predicting the patients with non-response
Despite these encouraging results, our study has certain drawbacks. First, although patients were continually included while meeting stringent inclusion and exclusion criteria, there may have been bias in data collection and selection owing to the retrospective design, such as with regard to chemotherapy regimens and the time between nCT and surgery. As previously reported[34], the minimum duration of nCRT should be three cycles of FOLFOX or two cycles of XELOX. Therefore, we limited the inclusion criteria to two or more cycles of chemotherapy. Unless the patient is resistant to chemotherapy, we assumed that the tumor will respond to two cycles of chemotherapy. Second, because the data were obtained from a single center, their representativeness is limited, and we will conduct a multicenter study to verify our results in the future. Third, these biomarkers are frequently used in clinical practice and do not add to the financial burden; however, their predictive value is limited, and further specific markers need to be identified in the future.
In conclusion, this study confirmed that in patients with LARC, pretreatment NLR can independently predict the pathological response to nCT, which is a practical parameter for predicting non-response to nCT. Patients with LNPscore-high are more likely to respond poorly to nCT.
HTML
Patients
Data Collection and Definition
Definitions of NLR, PLR, LMR, and PNI
Pathological Assessment
Statistical Analysis
Patient Characteristics and Pathological Response
Predictive Value of Inflammatory-nutritional Markers for Patients with Non-response
Predictive Value of Inflammatory-nutritional Markers for Patients with Good Response
 23141+Supplementary Materials.pdf
|

|

 Quick Links
 DownLoad: