


-
Hypertension is one of the most common chronic diseases worldwide and can considerably increase the incidence of complications such as stroke, coronary artery disease (CAD), heart failure, chronic kidney disease, aortic aneurysm, atrial fibrillation, and peripheral arterial disease. Data from one of the largest studies on worldwide hypertension trends show that the number of adults aged 30–79 years with hypertension has increased from 650 million to 1.28 billion over the past 30 years[1], which has resulted in huge economic and medical burdens for the public. Hypertension results from interactions between environmental and genetic factors. Methylation level of 5mC in patients with hypertension decreased significantly compared to that in healthy individuals[2], and some researchers further found that the level of 5mC methylation decreased with an increase in hypertension severity[3]. The role of epigenetics in the pathogenesis of diseases including cancer, cardiovascular diseases (CVD), and neurodegenerative diseases has attracted increasing attention. Epigenetic changes are considered valuable biomarkers for the diagnosis and prognosis of cancer and neurological and autoimmune diseases. Epigenetic mechanisms are thought to provide opportunities for disease intervention aimed at preventing or improving the symptoms of diseases by targeting lifestyle and using epigenetic-based treatments.
Mitochondria are the primary sources of cellular energy in the human body and play a crucial role in maintaining normal bodily functions. Epigenetic regulation of mitochondrial DNA (mtDNA), such as mtDNA methylation, is associated with CVD-related risk factors and complications[4]. Nevertheless, most studies have focused on evaluating mtDNA methylation levels within tissues, vessel specimens, and leukocytes, all of which are mixed cell types[5]. Consequently, the effects of mtDNA methylation on individual cellular functions could not be investigated. In the present study, we focused on a certain cell type, platelets, which play an important role in the pathogenesis of atherosclerosis and the incidence of hypertension[6]. As the only genetic material in platelets, mtDNA may be important for maintaining thrombosis and hemostasis. Since hypertension has a pathogenesis similar to that of CVD, the investigation conducted by Corsi et al.[7] highlighting the correlation between mtDNA methylation and CVD risk provided a potential hypothesis for our study, which is that the alteration of platelet mtDNA methylation levels may have an effect on the incidence of hypertension. This study aimed to explore the association between platelet mtDNA methylation levels and hypertension in the general population.
In this study, participants who attended a physical examination at Kailuan Hospital between January 1st, 2014 and December 31st, 2016, were selected from the Kailuan study (Project number: ChiCTR-TNC-11001489), which is a large population cohort study on risk factors and interventions for cardiology, cerebrovascular, and related diseases in Tangshan City, China. The inclusion criteria for the hypertension group were systolic blood pressure (SBP) ≥ 140 mmHg/diastolic blood pressure (DBP) ≥ 90 mmHg or receiving antihypertensive treatment. The inclusion criteria for the control group were SBP of < 140 mmHg and DBP of < 90 mmHg. Individuals with diabetes, myocardial infarction, severe liver and kidney diseases, other chronic diseases, autoimmune diseases, or malignant tumors were excluded from the study. Basic information, disease history, and lifestyle (including smoking, drinking, and physical exercise) were collected by professional medical staff using standardized questionnaires. Fasting blood glucose (FBG), triglyceride (TG), and total cholesterol (TC) levels were provided by the hospitals. Blood pressure was measured using a mercury sphygmomanometer in the sitting position after 5 min of rest. The participants were required to prevent smoking, drinking coffee, and strenuous exercise within 30 min before the measurement. Blood pressure was measured thrice, and the average value was used for further analysis. Cigarette smoking was defined as continuous smoking for more than one year and smoking at least one cigarette every day. Exercise was defined as more than three times a week, and each time not less than 20 min, drinking was defined as drinking at least 100 mL of liquor with more than 50% alcohol content in the past year. A total of 620 participants who met the inclusion criteria were included in the analysis. The study was approved by the Ethics Committee of Kailuan General Hospital, and all participants provided written informed consent.
Blood samples were centrifuged at 3,000 rpm for 10 min to obtain plasma, which was then centrifuged at 1,400 ×g for 15 min to obtain platelets. Platelets were treated with DNase I, proteinase K, and restriction endonuclease BamHI. A DNA Methylation Kit (Zymo Research, Orange, CA, USA) was used for bisulfite conversion and mtDNA extraction. The amplified mtDNA was used for pyrosequencing (PyroMark Q96, QIAGEN). The sequenced genes included those encoding complex IV [Cytochrome C oxidase I (MT-COX1), Cytochrome C oxidase II (MT-COX2), Cytochrome C oxidase III (MT-COX3)], and complex V [ATP synthase 6 (MT-ATP6) and ATP synthase 8 (MT-ATP8)]. Complex IV is a component of the respiratory electron transport chain. MT-COX1, MT-COX2 and MT-COX3 comprise the functional core of complex IV; thus, genetic mutations in COX genes may cause severe metabolic diseases by disrupting the electron transport chain. In addition, MT-ATP6 and MT-ATP8, as the only two genes in the mitochondria encoding ATPases, may directly affect ATP synthesis and energy metabolism. Details of the primers used are listed in Supplementary Table S1 (available in www.besjournal.com). Stringent quality control measures were applied during the mtDNA methylation analysis. All equipment used for mtDNA methylation was thoroughly sterilized, non-pyrogenic, and DNAse/RNAse-free. To monitor potential contamination and ensure the validity of the polymerase chain reaction (PCR), blank samples were included as negative controls in each 96-well plate. Additionally, two samples with known global DNA methylation levels (0% and 100%) as positive controls for pyrosequencing. Moreover, to enhance accuracy, each sample underwent two repeated pyrosequencing runs, and the average value was calculated for subsequent analyses.
Gene Primer Sequence MT-COX1 Forward primer
Reverse biotin primer (5’ to 3’)
Sequencing primer (5’ to 3’)TATTAATTGGTTTTTTAGGGTTTAT
CAACAAATCATTTCATATTACTTCC
TATTTATAGTAGGAATMT-COX2 Forward primer (5’ to 3’)
Reverse biotin primer (5’ to 3’)
Sequencing primer (5’ to 3’)TTTATGAGTTGTTTTTATATTAGGTTTAAA
ACTCCACAAATTTCAAAACATTAAC
TAAAAATAGATGTAATMT-COX3 Forward primer (5’ to 3’)
Reverse biotin primer (5’ to 3’)
Sequencing primer (5’ to 3’)TATATTATTTGTTTAAAAAGGTTTT
AATAAAAAACTCAAAAAAATCCTAC
TATATTATTTGTTTAAAAAGGTTTTMT-ATP6 Forward primer (5’ to 3’)
Reverse biotin primer (5’ to 3’)
Sequencing primer (5’ to 3’)TTATAAATTTAGTTATGGTTATTTTTTTAT
AAACTAAAACATTTTTAATCTTAAAAC
TTATAAATTTAGTTATGGTTATTTTTTTATMT-ATP8 Forward primer (5’ to 3’)
Reverse biotin primer (5’ to 3’)
Sequencing primer (5’ to 3’)AAATTATAATAAATTTTGAGAATTAAAATG
AATAAACCTAAAATTATAAAAACAATAAAT
AAATTATAATAAATTTTGAGAATTAAAATGTable S1. The pyrosequencing primer sequence
In this study, Kolmogorov-Smirnova test was used to test the normality of continuous variables. The continuous variables of skewed distribution were represented by median (M) and interquartile range (IQR). The difference between hypertension group and control group was compared by Mann-Whitney U rank sum test. The categorical data were described as the number of cases (N) and percentage (%), and the comparison between the two groups was performed by χ2 test. Logistic regression was used to analyze the association between each locus and hypertension. mtDNA methylation levels were divided into three groups according to the tertile (low-, middle-, and high-level groups). The low-level group was used as the reference group to explore the risk of hypertension in the middle-level group and the high-level group. All statistical tests were two-sided, and P < 0.05 was considered statistically significant. SAS 9.1 software (SAS Institute, Cary, NC) and SPSS 23.0 (IBM SPSS Statistics for Windows, NY, USA) were used for statistical analysis.
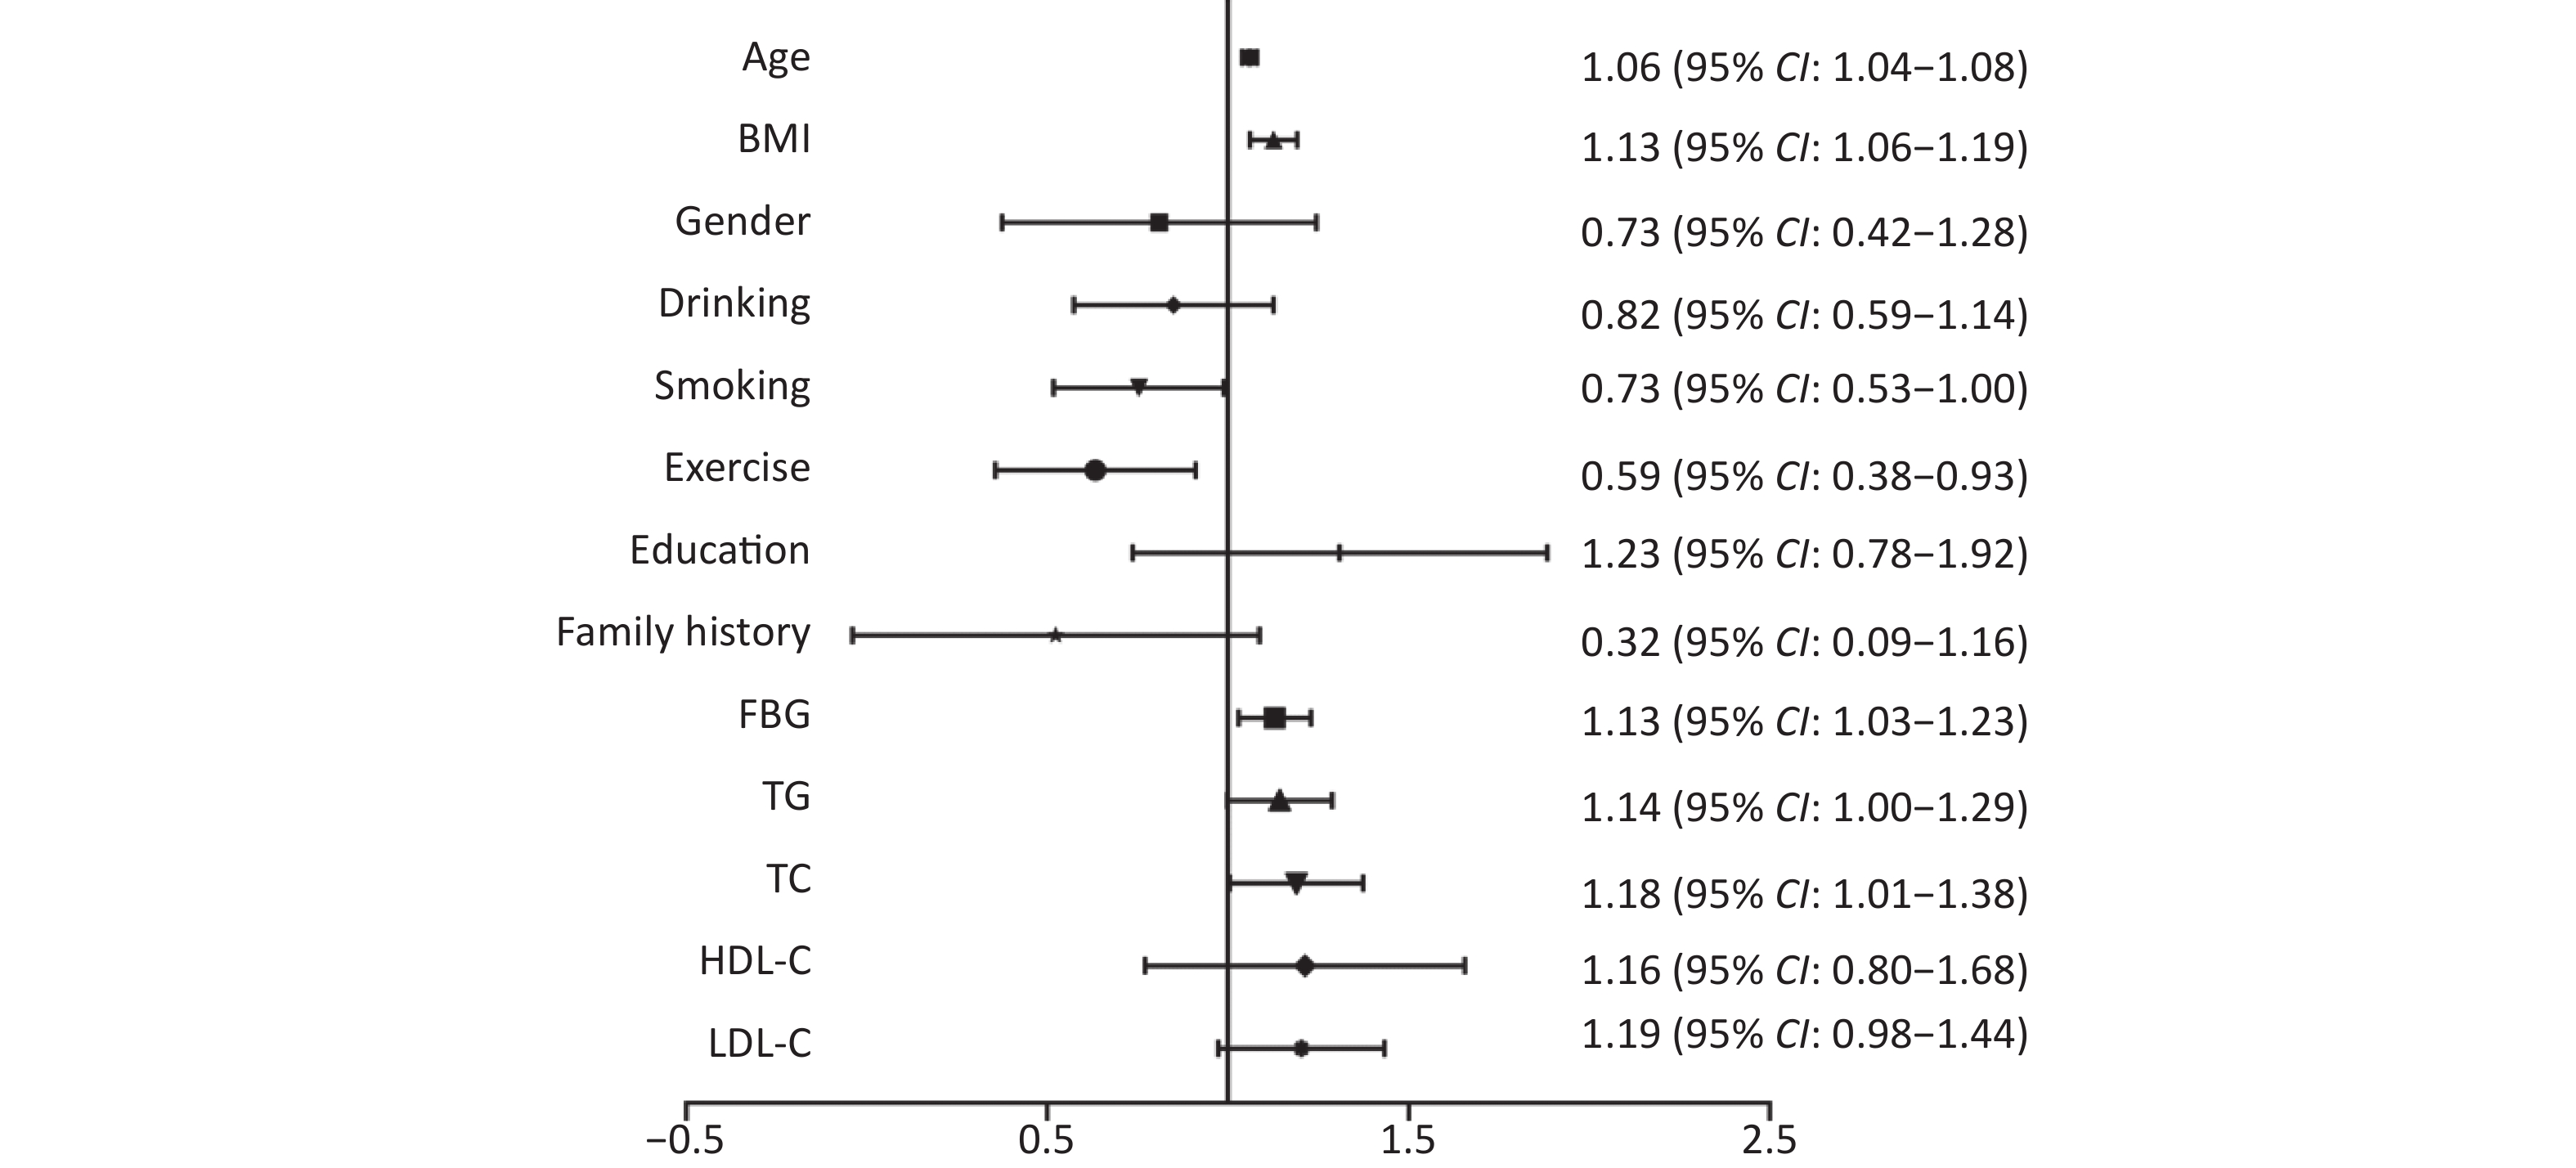
Table 1 summarizes the characteristics of the 620 participants. There were 337 and 283 patients in the hypertension and control groups, respectively. The age of participates was 58.97 years old, with 584 males (91.5%). Compared with the control group, the age, BMI, exercise, TC, TG, FBG, SBP, and DBP levels in the hypertension group were higher than those in the control group (P < 0.05). As shown in Supplementary Figure S1 (available in www.besjournal.com), the univariate logistic regression analysis indicated that age, BMI, exercise, FBG, TG, and TC were significantly associated with the risk of hypertension. Recently, several epidemiological studies have revealed that genomic DNA methylation plays an important role in the development of hypertension. A review article provided multiple perspectives on the potential pathways between gene-specific DNA methylation and hypertension, including the renin-angiotensin-aldosterone system (RAAS), sympathetic nervous system (SNS), and renal sodium retention system (RSRS)[8]. However, the relationship between mtDNA methylation and the risk of hypertension has rarely been studied.
Variables All participants
(N = 620)Hypertension group
(N = 337)Control group
(N = 283)z/χ2 P value Age (years) 58.97 (12.18) 61.74 (11.41) 57.52 (12.36) −6.30 < 0.01 Male, n (%) 567 (91.5) 312 (92.6) 255 (90.1) 1.21 0.27 BMI 25.19 (3.70) 25.65 (4.09) 24.51 (3.42) −4.33 < 0.01 Smoking, n (%) 271 (43.7) 158 (46.9) 113 (39.9) 3.73 0.16 Drinking, n (%) 239 (38.5) 137 (40.7) 102 (36.0) 1.38 0.24 Exercise, n (%) 97 (15.6) 63 (18.7) 34 (12.0) 5.20 0.02 Education, n (%) 90 (14.5) 45 (13.4) 45 (15.9) 0.81 0.37 SBP (mmHg) 142.78 (23.83) 152.00 (19.67) 128.83 (14.92) −20.75 < 0.01 DBP (mmHg) 83.62 (13.33) 88.00 (15.33) 79.33 (9.92) −12.91 < 0.01 FBG (mmol/L) 6.23 (1.33) 5.79 (1.41) 5.47 (1.10) −4.56 < 0.01 TG (mmol/L) 1.67 (0.98) 1.34 (1.10) 1.16 (0.92) −3.49 < 0.01 TC (mmol/L) 5.18 (1.23) 5.19 (1.30) 5.05 (1.27) −2.01 < 0.05 HDL-C (mmol/L) 1.45 (0.49) 1.40 (0.51) 1.34 (0.48) −0.81 0.12 LDL-C (mmol/L) 3.03 (0.83) 3.08 (0.87) 2.96 (0.79) −1.77 0.08 Family history, n (%) 14 (2.3) 11 (3.3) 3 (1.1) 3.34 0.07 Note. Continuous variables that did not conform to the normal distribution were described as medians and interquartile ranges, and differences between the two groups were compared using the Mann-Whitney U test. Categorical variables are presented as frequencies and percentages, and the differences between the two groups were compared using the chi-square test. MT-COX1 represents the average methylation level of MT-COX1Pos.1 and MT-COX1Pos.2. MT-COX3 is the mean methylation level of MT-COX3Pos.1 and MT-COX3Pos.2; MT-ATP6 is the average methylation level of MT-ATP6 Pos.1, MT-ATP6 Pos.2 and MT-ATP6 Pos.3; MT-ATP8 represents the mean methylation level of MT-ATP8 Pos.1 and MT-ATP8 Pos.2; SBP, systolic blood pressure;DBP, diastolic blood pressure; FBG, fasting blood glucose; TG, triglyceride; TC, total cholesterol; HDL-C, high-density lipoproteincholesterol; HDL-C, low-density lipoproteincholesterol. Table 1. Characteristics of included subjects
In this study, the results showed that the methylation levels of MT-COX1Pos.1, MT-ATP8Pos.1, MT-ATP8Pos.2, and MT-ATP8 in the hypertensive group were lower than those in the control group, which were 9.48% vs. 9.98%, 6.44% vs. 7.18%, 6.05% vs. 6.93%, and 6.26% vs. 6.96%, respectively, and the differences were statistically significant (P < 0.05). The methylation levels of MT-COX3Pos.1 and MT-COX3 were higher than those in the control group with statistical differences, which were 4.83% vs. 4.31% and 4.31% vs. 4.09%, respectively (P < 0.05) (Table 2). These findings reveal that the epigenetic regulation of mitochondrial genes may be of great significance in the occurrence of hypertension. To explore whether common risk factors for hypertension can influence the methylation levels in hypertensive patients, we conducted a subgroup analysis. Hypertensive patients were then divided into two groups according to sex (male, female), age (< 60, ≥ 60), BMI (< 24, ≥ 24), smoking (yes, no), drinking (yes, no), antihypertensive treatment (with, without), and the difference in mtDNA methylation levels between the two groups. No significant differences of mtDNA methylation levels could be observed in male and female hypertensive patients, or BMI < 24 and BMI ≥ 24 hypertensive patients (P > 0.05), as shown in Supplementary Tables S2–S3 (available in www.besjournal.com). The results showed that age, smoking, drinking, and antihypertensive treatment affected the methylation levels in patients with hypertension (P < 0.05) (Supplementary Tables S4–S7, available in www.besjournal.com).
Loci All participates
Median (IQR)Hypertension group
Median (IQR)Control group
Median (IQR)Z value P value MT-COX1Pos.1 10.64 (4.92) 9.47 (4.18) 9.98 (6.39) −2.17 0.03 MT-COX1Pos.2 7.75 (3.21) 7.80 (2.88) 7.68 (3.68) −0.99 0.32 MT-COX1 9.40 (3.97) 8.72 (3.26) 8.96 (4.89) −1.01 0.31 MT-COX2 5.56 (2.63) 5.60 (2.61) 5.50 (2.64) −0.55 0.58 MT-COX3Pos.1 4.64 (1.76) 4.83 (1.56) 4.31 (1.87) −3.72 < 0.01 MT-COX3Pos.2 3.79 (1.32) 3.80 (1.17) 3.78 (1.51) −0.21 0.83 MT-COX3 4.23 (1.32) 4.31 (1.18) 4.09 (1.56) −2.10 0.04 MT-ATP6Pos.1 17.65 (5.35) 17.65 (5.06) 17.73 (5.87) −1.32 0.19 MT-ATP6Pos.2 10.84 (3.94) 10.65 (3.97) 11.25 (3.91) −0.97 0.33 MT-ATP6Pos.3 13.33 (5.91) 13.11 (5.73) 13.58 (5.89) −0.98 0.33 MT-ATP6 13.95 (4.43) 13.73 (4.11) 14.10 (4.99) −2.17 0.23 MT-ATP8Pos.1 6.82 (4.11) 6.44 (4.10) 7.18 (3.92) −2.72 < 0.01 MT-ATP8Pos.2 6.48 (3.60) 6.05 (3.61) 6.93 (3.42) −2.82 < 0.01 MT-ATP8 6.68 (3.76) 6.26 (3.81) 6.96 (3.68) −2.81 < 0.01 Note. MT-COX1 represents the average methylation level of MT-COX1Pos.1 and MT-COX1Pos.2. MT-COX3 is the mean methylation level of MT-COX3Pos.1 and MT-COX3Pos.2; MT-ATP6 is the average methylation level of MT-ATP6 Pos.1, MT-ATP6 Pos.2 and MT-ATP6 Pos.3; MT-ATP8 represents the mean methylation level of MT-ATP8 Pos.1 and MT-ATP8 Pos.2. Table 2. Comparison of MtDNA methylation level between hypertension group and control group
Logistic regression analysis was used to investigate the association between each locus and hypertension (Supplementary Table S8, available in www.besjournal.com). In the crude model, the methylation levels of MT-COX1Pos.1, MT-COX1, MT-COX3Pos.1, MT-ATP8Pos.1, MT-ATP8Pos.2, and MT-ATP8 were significantly associated with hypertension (P < 0.05). After adjusting for age, sex, BMI, smoking, drinking, exercise, antihypertensive treatment, and FBG, TG, and TC levels, there was a significant association between MT-COX1Pos.1, MT-COX1 and the risk of hypertension (P < 0.05). For each unit increase in MT-COX1Pos.1 methylation level, the risk of hypertension decreased by 5% (OR = 0.95, 95% CI: 0.92–0.99, P = 0.01). 5% decrease in hypertension risk was associated with MT-COX1 methylation levels every 1% increase (OR = 0.95, 95% CI: 0.90–0.99, P = 0.03). To further investigate the effect of different levels of mtDNA methylation on the risk of hypertension, methylation levels were divided into three groups according to tertiles. After adjusting for age, sex, BMI, smoking, drinking, exercise, antihypertensive treatment, FBG, TG, and TC, compared to the low-level group, the high-level group of MT-COX1 reduced by 36% of hypertension risks (P = 0.04) (Table 3). Our findings are similar to those of a previous study conducted by Corsi et al., who revealed that the methylation level of MT-COX1 was significantly associated with CVD risk in overweight and obese populations, and that the methylation of MT-COX1 may represent a novel intrinsic predictor of CVD risk in a certain population[7]. A review suggested that mitochondrial epigenetics is a new mechanism for understanding the pathophysiology of mitochondrial dysfunction, and that mtDNA methylation mainly affects mitochondrial function by replication, transcription, and translation, eventually leading to the occurrence of mitochondrial dysfunction-related diseases[9]. It has been reported that mitochondrial dysfunction is one of the molecular mechanisms underlying functional and morphological changes in aged vessels, which could lead to hypertension[10]. Thus, our results demonstrated that a higher mtDNA methylation level was associated with a lower risk of hypertension, which may help accumulate evidence on the genomic mechanisms for potential prevention and possible therapeutic targets for hypertension in the future.
Loci Unadjusted model Adjusted model β value OR (95% CI) P value β value OR (95% CI) P value MT-COX1Pos.1 Low level − 1.00 − − 1.00 − Middle level −0.16 0.85 (0.58–1.26) 0.42 −0.12 0.89 (0.58–1.35) 0.57 High level −0.43 0.65 (0.44–0.96) 0.03 −0.40 0.67 (0.44–1.02) 0.06 MT-COX1Pos.2 Low level − 1.00 − − 1.00 − Middle level 0.46 1.58 (1.07–2.33) 0.02 0.30 1.35 (0.89–2.07) 0.16 High level 0.19 1.20 (0.82–1.77) 0.35 −0.25 0.78 (0.51–1.21) 0.27 MT-COX1 Low level − 1.00 − − 1.00 − Middle level 0.31 1.37 (0.92–2.02) 0.12 0.21 1.24 (0.81–1.89) 0.33 High level −0.28 0.75 (0.51–1.11) 0.15 −0.45 0.64 (0.42–0.98) 0.04 MT-COX2 Low level − 1.00 − − 1.00 − Middle level 0.09 1.09 (0.74–1.60) 0.66 −0.05 0.96 (0.63–1.45) 0.83 High level 0.17 1.18 (0.80–1.75) 0.40 −0.05 0.95 (0.62–1.46) 0.82 MT-COX3Pos.1 1 Low level − 1.00 − − 1.00 − Middle level 0.45 1.56 (1.06–2.30) 0.02 0.08 1.08 (0.69–1.68) 0.74 High level 0.76 2.14 (1.44–3.18) < 0.001 0.03 1.03 (0.63–1.69) 0.90 MT-COX3Pos.2 Low level − 1.00 − − 1.00 − Middle level 0.43 1.54 (1.04–2.27) 0.03 0.26 1.30 (0.84–2.01) 0.24 High level 0.10 1.10 (0.75–1.62) 0.62 −0.06 0.94 (0.61–1.44) 0.78 MT-COX3 Low level − 1.00 − − 1.00 − Middle level 0.52 1.69 (1.14–2.49) < 0.001 0.33 1.38 (0.90–2.13) 0.14 High level 0.47 1.60 (1.08–2.36) 0.02 0.01 1.01 (0.64–1.59) 0.98 MT-ATP6Pos.1 Low level − 1.00 − − 1.00 − Middle level 0.14 1.14 (0.78–1.69) 0.49 0.29 1.33 (0.87–2.04) 0.19 High level −0.14 0.87 (0.59–1.29) 0.17 0.15 1.17 (0.76–1.78) 0.48 MT-ATP6Pos.2 Low level − 1.00 − − 1.00 − Middle level −0.10 0.91 (0.61–1.33) 0.61 −0.25 0.78 (0.51–1.20) 0.26 High level −0.20 0.82 (0.56–1.21) 0.32 −0.35 0.71 (0.46–1.09) 0.11 MT-ATP6Pos.3 Low level − 1.00 − − 1.00 − Middle level 0.08 1.08 (0.73–1.59) 0.70 0.16 1.17 (0.77–1.79) 0.47 High level −0.20 0.82 (0.59–1.21) 0.32 −0.10 0.90 (0.59–1.37) 0.63 MT-ATP6 Low level − 1.00 − − 1.00 − Middle level −0.03 0.97 (0.66–1.43) 0.87 0.03 1.03 (0.67–1.57) 0.89 High level −0.21 0.83 (0.55–1.20) 0.30 −0.13 0.88 (0.58–1.34) 0.56 MT-ATP8Pos.1 Low level − 1.00 − − 1.00 − Middle level −0.54 0.58 (0.39–0.86) < 0.01 −0.33 0.71 (0.47–1.10) 0.13 High level −0.58 0.56 (0.38–0.83) < 0.01 −0.22 0.80 (0.52–1.25) 0.32 MT-ATP8Pos.2 Low level − 1.00 − − 1.00 − Middle level −0.51 0.60 (0.41–0.89) 0.01 −0.22 0.81 (0.52–1.24) 0.33 High level −0.48 0.62 (0.42–0.92) 0.02 −0.13 0.88 (0.57–1.37) 0.58 MT-ATP8 Low level − 1.00 − − 1.00 − Middle level −0.44 0.65 (0.44–0.96) 0.03 −0.21 0.82 (0.53–1.26) 0.36 High level −0.52 0.60 (0.40–0.89) 0.01 −0.16 0.86 (0.55–1.34) 0.49 Note. Adjusted model: adjusted for age, sex, BMI, smoking, drinking, exercise, hypertensive treatment, FBG, TC, and TG. Table 3. Association between MtDNA methylation level stratification and hypertension
However, there are still some limitations in this study: first, this study showed a cross-sectional association between mtDNA methylation and the prevalence of hypertension, but which could not draw any conclusions on the long-term effects of mtDNA methylation on the development of hypertension. In addition, blood pressure was measured using a sphygmomanometer during the physical examination as one of the criteria for defining hypertension, which may cause confusion owing to white-coat hypertension. Finally, the study population was relatively small and was limited to individuals from northern China. Therefore, the results of our study should be replicated and verified in other populations.
HTML
-
The authors declare no conflict of interest.
-
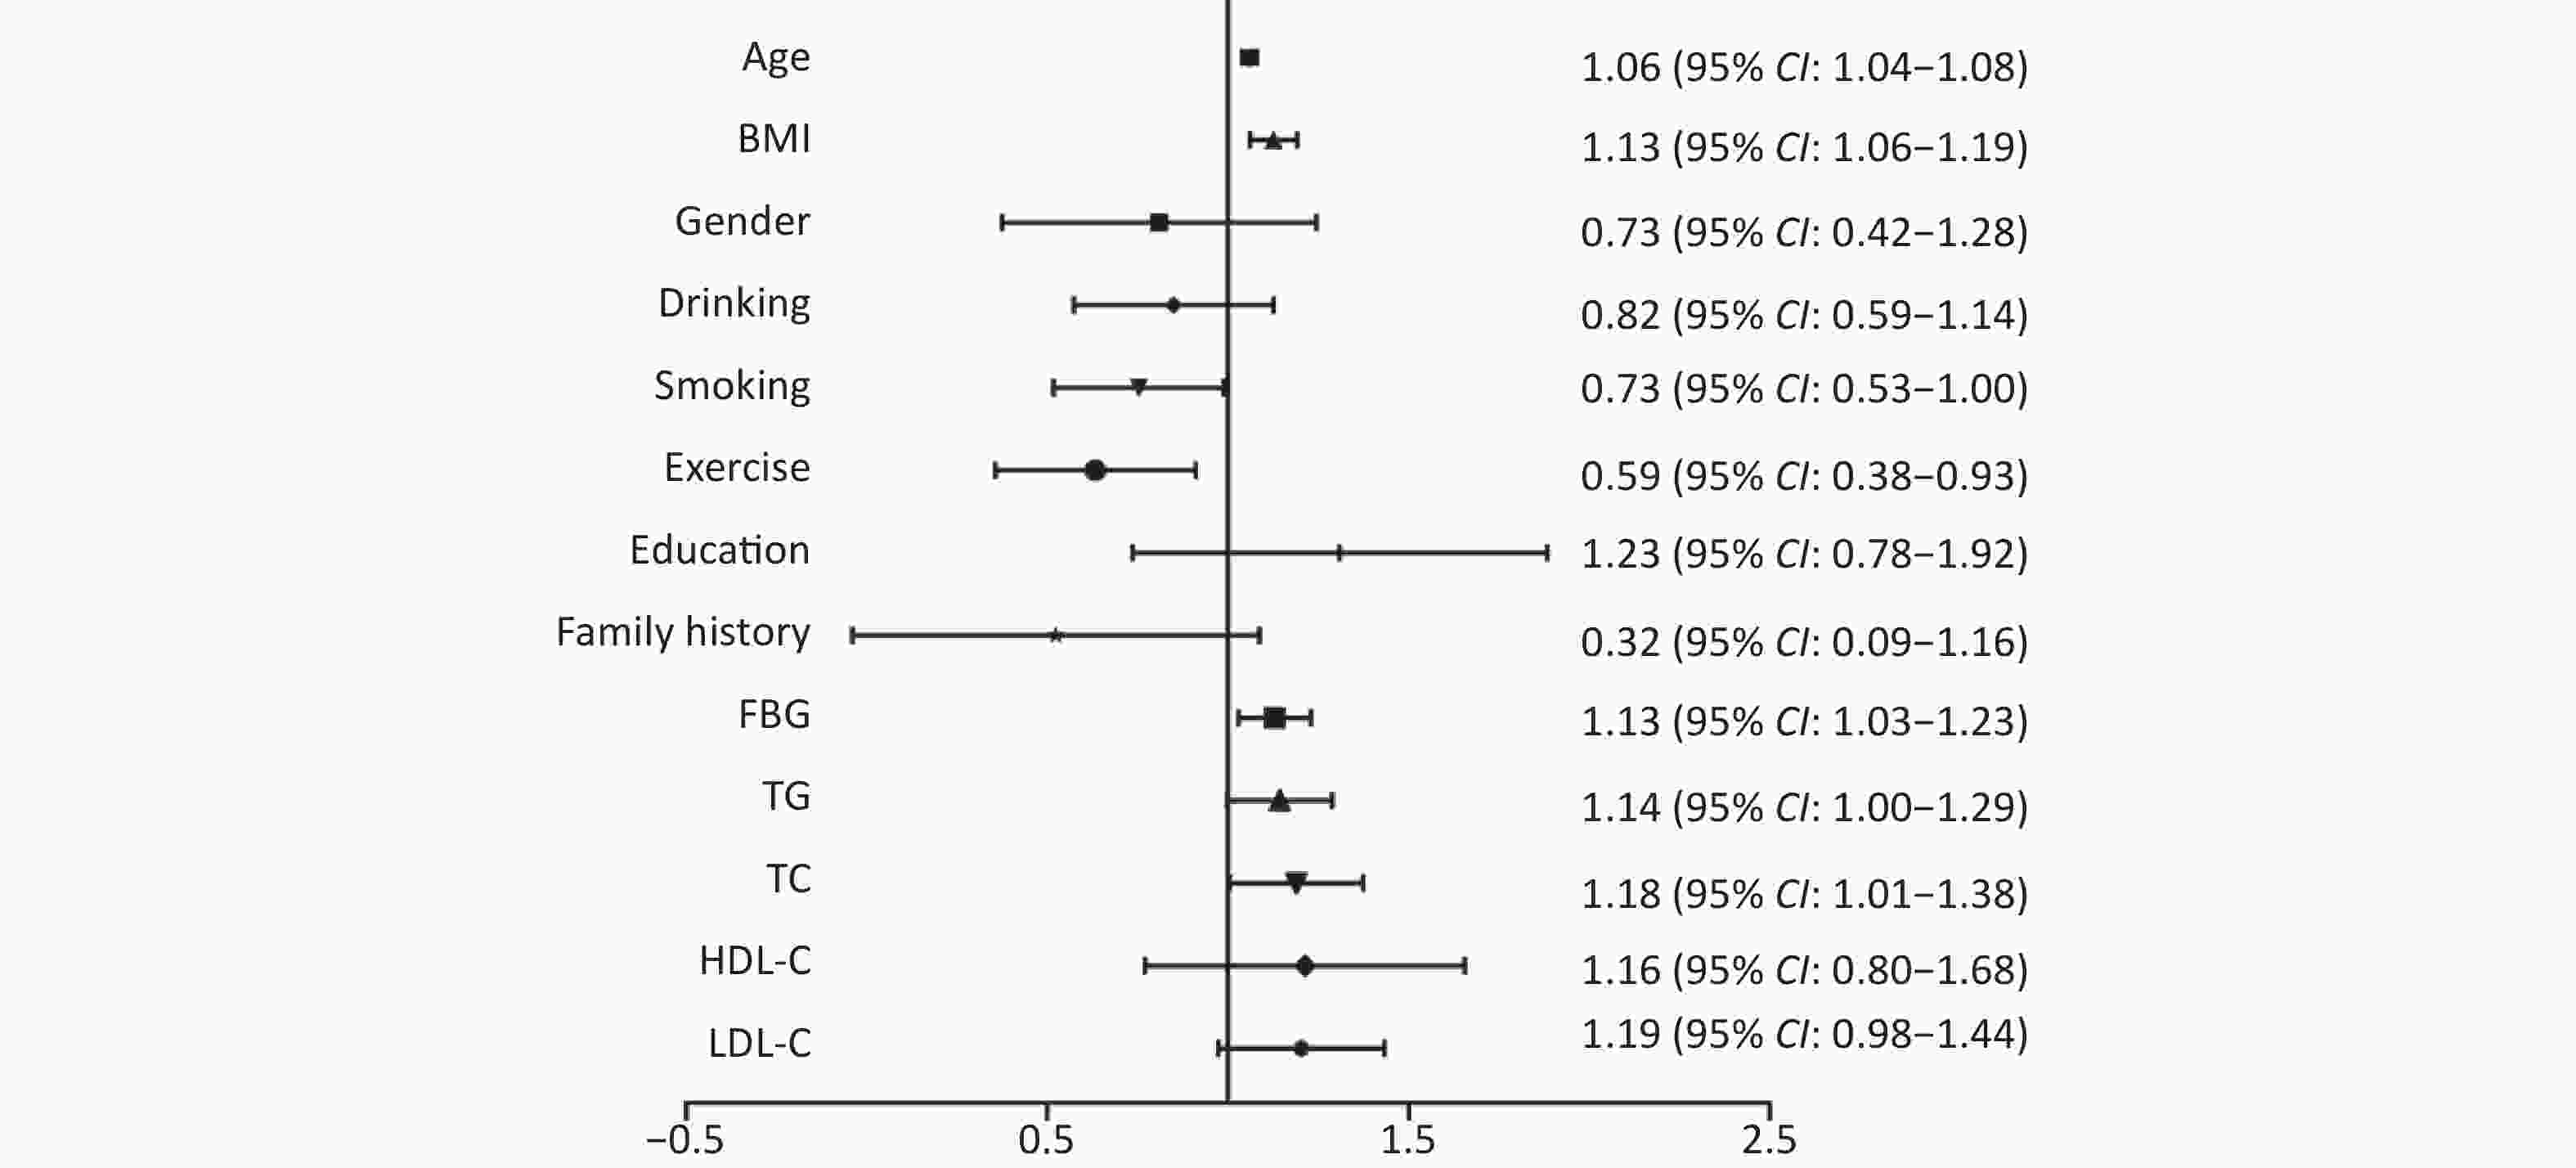
Figure S1. Odds ratios of risk factors for hypertension.
Loci Male group (N = 25) Female group (N = 312) Z value P value MT-COX1Pos.1 9.38 (4.25) 10.24 (4.12) −0.85 0.39 MT-COX1Pos.2 8.43 (3.52) 7.75 (2.84) −0.62 0.53 MT-COX1 9.09 (3.70) 8.72 (3.31) −0.28 0.78 MT-COX2 5.46 (2.60) 5.61 (2.60) −0.05 0.96 MT-COX3Pos.1 4.43 (1.42) 4.85 (1.54) −1.09 0.27 MT-COX3Pos.2 3.66 (1.38) 3.81 (1.18) −0.75 0.45 MT-COX3 4.10 (1.32) 4.34 (1.16) −1.14 0.25 MT-ATP6Pos.1 18.12 (3.44) 17.53 (5.33) −0.44 0.66 MT-ATP6Pos.2 10.34 (4.39) 10.68 (3.97) −1.22 0.22 MT-ATP6Pos.3 13.85 (6.71) 13.04 (5.56) −0.38 0.70 MT-ATP6 14.26 (4.77) 13.58 (4.09) −0.07 0.94 MT-ATP8Pos.1 7.32 (5.24) 6.35 (4.07) −1.46 0.14 MT-ATP8Pos.2 7.10 (4.77) 6.04 (3.59) −1.18 0.24 MT-ATP8 6.77 (5.03) 6.20 (3.76) −1.31 0.19 Note. Continuous variables that do not conform to the normal distribution are descripted by median and interquartile range, and the differences both two groups are compared by Mann-Whitney U test. The categorical variables were presented using frequency and percentage, and the differences both two groups were compared by chi-square test. MT-COX1 is the average methylation level of MT-COX1Pos.1 and MT-COX1Pos.2; MT-COX3 is the mean methylation level of MT-COX3Pos.1 and MT-COX3Pos.2; MT-ATP6 is the average methylation level of MT-ATP6 Pos.1, MT-ATP6 Pos.2 and MT-ATP6 Pos.3; MT-ATP8 is the mean methylation level of MT-ATP8 Pos.1 and MT-ATP8 Pos.2. Table S2. Comparison of methylation levels between male and female hypertensive patients
Loci BMI < 24 (N = 101) BMI ≥ 24 (N = 236) Z value P value MT-COX1Pos.1 9.48 (4.06) 9.46 (4.22) −0.41 0.68 MT-COX1Pos.2 8.22 (2.90) 7.73 (2.78) −1.06 0.29 MT-COX1 8.99 (3.39) 8.56 (3.23) −0.80 0.43 MT-COX2 5.53 (2.61) 5.68 (2.63) −1.54 0.12 MT-COX3Pos.1 4.74 (1.60) 4.91 (1.52) −1.00 0.32 MT-COX3Pos.2 3.81 (1.04) 3.80 (1.19) −0.06 0.95 MT-COX3 4.22 (1.11) 4.35 (1.22) −0.34 0.74 MT-ATP6Pos.1 17.41 (4.90) 17.65 (5.32) −0.27 0.78 MT-ATP6Pos.2 10.58 (3.99) 10.68 (3.97) −0.18 0.86 MT-ATP6Pos.3 13.08 (6.05) 13.12 (5.56) −0.14 0.89 MT-ATP6 13.73 (3.93) 13.70 (4.19) −0.10 0.92 MT-ATP8Pos.1 6.26 (4.27) 6.46 (4.05) −0.02 0.98 MT-ATP8Pos.2 6.07 (3.40) 6.03 (3.59) −0.30 0.77 MT-ATP8 6.15 (3.89) 6.26 (3.92) −0.13 0.90 Note. Continuous variables that do not conform to the normal distribution are descripted by median and interquartile range, and the differences both two groups are compared by Mann-Whitney U test. The categorical variables were presented using frequency and percentage, and the differences both two groups were compared by chi-square test. MT-COX1 is the average methylation level of MT-COX1Pos.1 and MT-COX1Pos.2; MT-COX3 is the mean methylation level of MT-COX3Pos.1 and MT-COX3Pos.2; MT-ATP6 is the average methylation level of MT-ATP6 Pos.1, MT-ATP6 Pos.2 and MT-ATP6 Pos.3; MT-ATP8 is the mean methylation level of MT-ATP8 Pos.1 and MT-ATP8 Pos.2. Table S3. Comparison of methylation levels between BMI ≥ 24 and < 24 hypertensive patients
Loci Age < 60 (N = 139) Age ≥ 60 (N = 198) Z value P value MT-COX1Pos.1 9.18 (4.57) 9.64 (3.98) −0.78 0.43 MT-COX1Pos.2 7.27 (2.68) 8.22 (3.18) −3.58 < 0.001 MT-COX1 8.41 (3.22) 8.93 (3.42) −2.06 0.04 MT-COX2 5.38 (2.63) 5.71 (2.45) −1.91 0.056 MT-COX3Pos.1 4.01 (1.55) 5.23 (1.15) −8.93 < 0.001 MT-COX3Pos.2 3.68 (1.42) 3.86 (1.08) −1.66 0.10 MT-COX3 3.91 (1.35) 4.61 (0.99) −6.48 < 0.001 MT-ATP6Pos.1 18.40 (4.74) 17.09 (4.82) −2.92 0.004 MT-ATP6Pos.2 9.57 (4.04) 10.92 (3.64) −3.27 0.001 MT-ATP6Pos.3 12.95 (5.17) 13.20 (6.16) −0.49 0.62 MT-ATP6 13.80 (4.06) 13.46 (4.11) −0.64 0.52 MT-ATP8Pos.1 7.86 (3.78) 5.35 (3.24) −7.17 < 0.001 MT-ATP8Pos.2 7.41 (3.66) 5.19 (2.97) −6.66 < 0.001 MT-ATP8 7.70 (3.23) 5.40 (3.17) −7.14 < 0.001 Note. Continuous variables that do not conform to the normal distribution are descripted by median and interquartile range, and the differences both two groups are compared by Mann-Whitney U test. The categorical variables were presented using frequency and percentage, and the differences both two groups were compared by chi-square test. MT-COX1 is the average methylation level of MT-COX1Pos.1 and MT-COX1Pos.2; MT-COX3 is the mean methylation level of MT-COX3Pos.1 and MT-COX3Pos.2; MT-ATP6 is the average methylation level of MT-ATP6 Pos.1, MT-ATP6 Pos.2 and MT-ATP6 Pos.3; MT-ATP8 is the mean methylation level of MT-ATP8 Pos.1 and MT-ATP8 Pos.2. Table S4. Comparison of methylation levels between age ≥ 60 and < 60 hypertensive patients
Loci Non-smoking (N = 177) Smoking (N = 158) Z value P value MT-COX1Pos.1 10.20 ± 4.26 10.22 (4.34) −0.24 0.81 MT-COX1Pos.2 7.85 (3.09) 7.75 (2.82) −0.21 0.83 MT-COX1 8.72 (3.20) 8.74 (3.46) −0.04 0.97 MT-COX2 5.45 (2.47) 5.76 (2.79) −0.27 0.79 MT-COX3Pos.1 4.77 (1.57) 4.94 (1.49) −1.27 0.21 MT-COX3Pos.2 3.66 (1.12) 3.92 (1.01) −2.66 < 0.01 MT-COX3 4.19 (1.17) 4.43 (1.05) −2.38 0.02 MT-ATP6Pos.1 16.55 (5.66) 17.80 (4.15) −3.03 < 0.01 MT-ATP6Pos.2 10.43 (3.67) 10.88 (4.01) −1.22 0.22 MT-ATP6Pos.3 12.79 (5.72) 13.37 (5.76) −1.45 0.15 MT-ATP6 12.97 (4.56) 14.18 (3.65) −2.01 0.04 MT-ATP8Pos.1 6.35 (4.58) 6.49 (4.10) −0.56 0.58 MT-ATP8Pos.2 5.94 (3.86) 6.09 (3.46) −0.20 0.85 MT-ATP8 6.15 (4.37) 6.32 (3.57) −0.42 0.68 Note. Continuous variables that do not conform to the normal distribution are descripted by median and interquartile range, and the differences both two groups are compared by Mann-Whitney U test. The categorical variables were presented using frequency and percentage, and the differences both two groups were compared by chi-square test. MT-COX1 is the average methylation level of MT-COX1Pos.1 and MT-COX1Pos.2; MT-COX3 is the mean methylation level of MT-COX3Pos.1 and MT-COX3Pos.2; MT-ATP6 is the average methylation level of MT-ATP6 Pos.1, MT-ATP6 Pos.2 and MT-ATP6 Pos.3; MT-ATP8 is the mean methylation level of MT-ATP8 Pos.1 and MT-ATP8 Pos.2. Table S5. Comparison of methylation levels between smoking and non-smoking hypertensive patients
Loci Non-drinking (N = 198) Drinking (N =137) Z value P value MT-COX1Pos.1 9.42 (4.31) 9.58 (4.39) −0.75 0.46 MT-COX1Pos.2 7.76 (2.83) 7.85 (3.04) −0.71 0.48 MT-COX1 8.72 (3.12) 9.37 (3.94) −0.63 0.53 MT-COX2 5.47 (2.52) 5.68 (2.70) −0.04 0.97 MT-COX3Pos.1 4.78 (1.52) 4.98 (1.48) −1.23 0.22 MT-COX3Pos.2 3.68 (1.11) 3.92 (1.03) −2.32 0.02 MT-COX3 4.19 (1.18) 4.44 (1.01) −2.20 0.03 MT-ATP6Pos.1 16.78 (5.32) 18.13 (4.31) −2.42 0.02 MT-ATP6Pos.2 10.52 (3.59) 10.78 (4.23) −1.28 0.20 MT-ATP6Pos.3 12.78 (5.62) 13.66 (5.86) −1.29 0.20 MT-ATP6 13.20 (4.28) 14.37 (3.99) −1.86 0.06 MT-ATP8Pos.1 6.16 (4.39) 6.59 (3.91) −0.20 0.85 MT-ATP8Pos.2 5.86 (3.59) 6.51 (3.69) −1.00 0.32 MT-ATP8 6.01 (4.10) 6.50 (3.47) −0.60 0.55 Note. Continuous variables that do not conform to the normal distribution are descripted by median and interquartile range, and the differences both two groups are compared by Mann-Whitney U test. The categorical variables were presented using frequency and percentage, and the differences both two groups were compared by chi-square test. MT-COX1 is the average methylation level of MT-COX1Pos.1 and MT-COX1Pos.2; MT-COX3 is the mean methylation level of MT-COX3Pos.1 and MT-COX3Pos.2; MT-ATP6 is the average methylation level of MT-ATP6 Pos.1, MT-ATP6 Pos.2 and MT-ATP6 Pos.3; MT-ATP8 is the mean methylation level of MT-ATP8 Pos.1 and MT-ATP8 Pos.2. Table S6. Comparison of methylation levels between drinking and non-drinking hypertensive patients
Loci Hypertension group Z value P value Anti-hypertensive treatment (56) Without anti-hypertensive treatment (281) MT-COX1Pos.1 8.77 (3.47) 9.62 (4.12) −1.62 0.11 MT-COX1Pos.2 8.13 (2.47) 7.76 (3.06) −0.27 0.79 MT-COX1 8.53 (2.61) 8.83 (3.42) −0.93 0.35 MT-COX2 5.75 (2.68) 5.50 (2.62) −1.14 0.26 MT-COX3Pos.1 5.06 (1.51) 4.82 (1.57) −1.48 0.14 MT-COX3Pos.2 3.68 (1.45) 3.83 (1.07) −0.21 0.83 MT-COX3 4.39 (1.09) 4.30 (1.20) −0.72 0.47 MT-ATP6Pos.1 15.80 (4.75) 17.97 (4.90) −2.70 0.01 MT-ATP6Pos.2 9.99 (3.80) 10.68 (3.96) −1.14 0.25 MT-ATP6Pos.3 12.79 (6.16) 13.12 (5.71) −1.41 0.16 MT-ATP6 12.93 (4.33) 14.01 (4.08) −1.89 0.06 MT-ATP8Pos.1 6.81 (3.97) 6.35 (4.13) −0.23 0.82 MT-ATP8Pos.2 5.87 (3.40) 6.07 (3.65) −0.01 0.99 MT-ATP8 6.28 (3.66) 6.24 (3.89) −0.13 0.90 Note. Continuous variables that do not conform to the normal distribution are descripted by median and interquartile range, and the differences both two groups are compared by Mann-Whitney U test. The categorical variables were presented using frequency and percentage, and the differences both two groups were compared by chi-square test. MT-COX1 is the average methylation level of MT-COX1Pos.1 and MT-COX1Pos.2; MT-COX3 is the mean methylation level of MT-COX3Pos.1 and MT-COX3Pos.2; MT-ATP6 is the average methylation level of MT-ATP6 Pos.1, MT-ATP6 Pos.2 and MT-ATP6 Pos.3; MT-ATP8 is the mean methylation level of MT-ATP8 Pos.1 and MT-ATP8 Pos.2. Table S7. Comparison of methylation levels between with anti-hypertensive treatment and without anti-hypertensive treatment patients
Loci Unadjusted model Adjusted model β value OR (95% CI) P value β value OR (95% CI) P value MT-COX1Pos.1 −0.06 0.95 (0.91–0.98) < 0.001 −0.05 0.95 (0.92–0.99) 0.01 MT-COX1Pos.2 0.01 0.99 (0.94–1.03) 0.58 −0.04 0.96 (0.91–1.01) 0.12 MT-COX1 −0.05 0.95 (0.91–1.00) 0.03 −0.06 0.95 (0.90–0.99) 0.03 MT-COX2 −0.03 0.98 (0.93–1.03) 0.33 −0.04 0.96 (0.90–1.02) 0.17 MT-COX3Pos.1 0.13 1.14 (1.02–1.29) 0.03 −0.06 0.94 (0.82–1.08) 0.38 MT-COX3Pos.2 −0.06 0.95 (0.84–1.07) 0.37 −0.12 0.89 (0.77–1.03) 0.12 MT-COX3 0.06 1.06 (0.93–1.20) 0.39 −0.11 0.90 (0.76–1.05) 0.19 MT-ATP6Pos.1 −0.03 0.97 (0.94–1.01) 0.13 −0.01 0.99 (0.96–1.03) 0.72 MT-ATP6Pos.2 −0.03 0.97 (0.92–1.02) 0.25 −0.05 0.95 (0.90–1.01) 0.12 MT-ATP6Pos.3 −0.02 0.99 (0.96–1.01) 0.29 −0.01 0.99 (0.96–1.02) 0.62 MT-ATP6 −0.03 0.97 (0.93–1.01) 0.16 −0.02 0.98 (0.94–1.03) 0.44 MT-ATP8Pos.1 −0.06 0.94 (0.89–0.99) 0.01 −0.02 0.98 (0.93–1.03) 0.42 MT-ATP8Pos.2 −0.07 0.93 (0.89–0.98) < 0.001 −0.04 0.96 (0.92–1.02) 0.16 MT-ATP8 −0.08 0.93 (0.88–0.98) < 0.001 −0.04 0.97 (0.91–1.02) 0.22 Note. Adjusted model: adjusted for age, gender, BMI, smoking, drinking, exercise, hypertensive treatment, FBG, TC, and TG. Table S8. Association between mtDNA methylation level and the risk of hypertension
 23098+Supplementary Materials.pdf
|

|

 Quick Links
 DownLoad: