


-
Fruit and vegetable rich in nutrients, including minerals, vitamin C, carotenoids, potassium, and dietary fibers[1], play crucial roles in preventing cardiovascular diseases (CVD)[2]. A previous meta-analysis of 26 prospective studies found that a higher intake of fruit and vegetable could reduce the incidence of CVD and all-cause mortality[3], which is consistent with our previous research[4]. Moreover, most food-based dietary guidelines recommend high fruit and vegetable intake to prevent chronic diseases, including CVD[5,6].
To improve cardiovascular health and prevent CVD events and deaths, the American Heart Association (AHA) proposed primordial prevention[7], which focuses on the development of subclinical atherosclerosis and other vascular changes. Arterial stiffness is a measurement of arterial elasticity and the capability of cushioning pulsations that recognizes damaged cardiovascular systems and is regarded as a subclinical endpoint of CVD[8,9]. CVD risk factors such as physical activity, diet, and smoking may influence arterial stiffness[10]. However, previous studies have reported inconsistent associations between fruit and vegetable intake and arterial stiffness[11-14]. Exploring the effects of fruit and vegetable intake on arterial stiffness is essential for the purpose of the primordial prevention of CVD. Currently, arterial stiffness can be assessed by the arterial velocity–pulse index (AVI) and arterial pressure-volume index (API) using a wearable oscillometric device on the upper forearm[15]. The AVI reflects the stiffness of the central artery, which is rich in elastin, by measuring the variation tendency of the systolic waveform of the central artery[16]. The API can represent the peripheral artery, which is rich in vascular smooth muscle cells, specifically the brachial artery[17] based on the association between the cuff pressure and volume of arterial blood[15]. AVI and API have high repeatability[17] and convenience[18], and are reasonable indices for evaluating arterial stiffness[15,18].
Therefore, our research based on the Prediction for Atherosclerotic Cardiovascular Disease Risk in China (China-PAR) aimed to explore the effects of fruit and vegetable intake on AVI and API.
-
This study was based on three prospective cohorts of the China-PAR project, including the China Multi-Center Collaborative Study of Cardiovascular Epidemiology (China MUCA) (1998), the International Collaborative Study of Cardiovascular Disease in Asia (InterASIA), and the Community Intervention of Metabolic Syndrome in China & Chinese Family Health Study (CIMIC). Detailed descriptions of the three cohorts have been described previously[19]. Briefly, all three cohorts underwent a unified, standardized protocol from 2007–2008 to the 2018–2021 follow-up visit. Therefore, we defined the 2007–2008 visit as the baseline for this analysis. Of the participants who accepted AVI and API measurements during the follow-up visit from 2018 to 2021 (n = 7,892), we excluded those who did not have information to calculate the baseline fruit and vegetable intake (n = 1,225) and those with out-of-range fruit and vegetable intake, AVI, and API (n = 39). When given a confidence level of 99.7%, the values exceeding the three standard deviation ranges were not within the random error ranges and could be defined as outliers. Therefore, outliers were determined as those with more than three standard deviations after logarithmic transformation. Finally, 6,628 participants were included in the primary analysis. Furthermore, to calculate changes in fruit and vegetable intake, those with missing information at the 2018–2021 visit were excluded, and 6,481 participants were included in the analysis (Figure 1). We tested the differences between the cohort participants included in the analysis and found that the average difference was smaller (Supplementary Table S1, available in www.besjournal.com), which had a minor impact on the results.
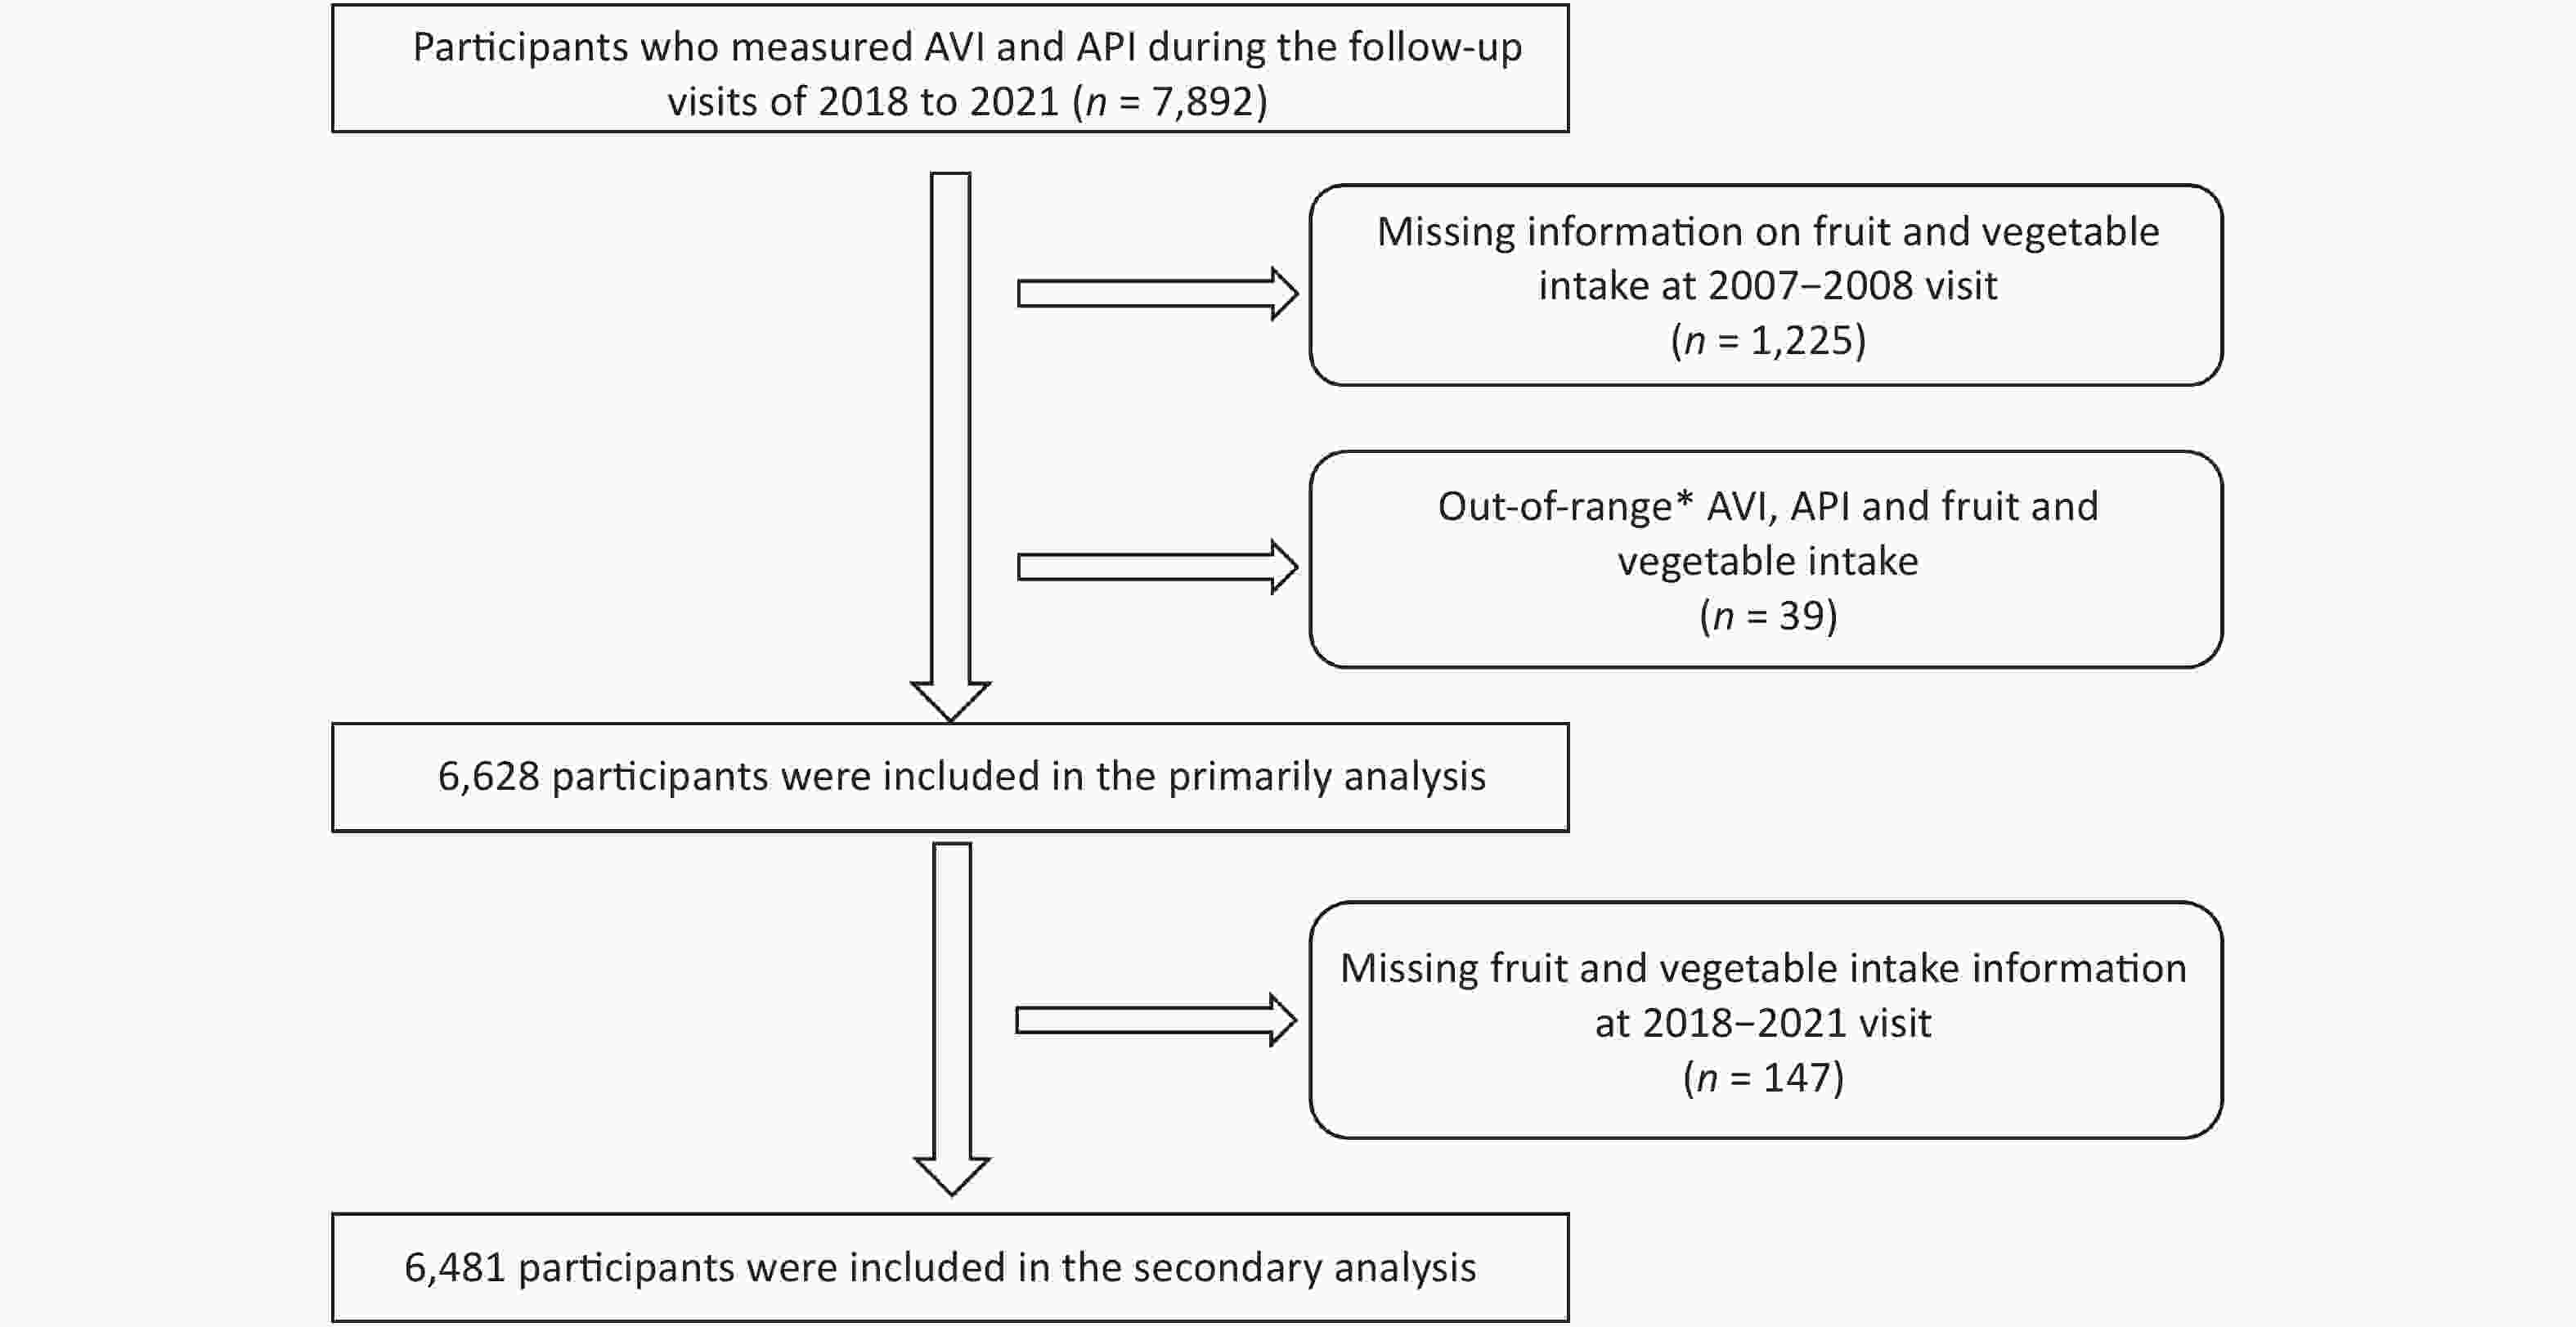
Figure 1. Flow chart of participants selection. *Out-of-range: AVI, API or fruit and vegetable intake above 3 standard deviations after logarithmic transformation. AVI, arterial velocity–pulse index; API, arterial pressure-volume index.
The project was approved by the Institutional Review Board of Fuwai Hospital in Beijing, and all participants provided written informed consent before data collection (No. 2018-1061).
-
The baseline and follow-up visits were conducted by trained research personnel using standard protocols. Fruit and vegetable intake in the past year was estimated using a standardized semi-quantitative food frequency questionnaire (FFQ). Frequency and quantity options were collected in five categories (never, yearly, monthly, weekly, and daily) and the amount of intake per frequency. The frequency and quantity were converted to daily intake (g/d). Potatoes, legumes, and other tuber vegetables were excluded from this study. We defined fruit and vegetable intake as the sum of the fruit and vegetable intake. Furthermore, the high fruit and vegetable intake was defined as ≥ 500 g/d by comprehensively considering the recommended intake by the dietary guidelines for Chinese and the actual intake of our participants[6,20]. Considering the changes in fruit and vegetable intake between baseline and the 2018–2021 follow-up visit, participants were categorized into four groups: maintaining ≥ 500 g/d, increasing from < 500 g/d to ≥ 500 g/d, decreasing from ≥ 500 g/d to < 500 g/d, and maintaining < 500 g/d.
-
A blood pressure monitoring device (PASESA AVE-2000, Shisei Datum, Tokyo, Japan) was used to measure AVI and API. Briefly, the participants were asked to place the upper arm wrapped in the device in a sitting position for 5 min. In addition, they were instructed to avoid drinking, smoking, exercising, eating, and bathing for at least 30 min before the measurement. Elevated AVI and API were defined as values exceeding the diverse upper reference ranges according to individual age. The upper reference ranges are presented in Supplementary Tables S2 and S3 (available in www.besjournal.com) in Supporting Information.
Age
(years)18−23 24−
2627−
2829−
3536−
3738−
4041−
4344−
4647−
4950−
5253−
5455−
5758−
5960−
6162−
6364−
6566−
6768−
6970−
7273 74−
7576 77−
7879 ≥ 80 Upper AVI 15 16 17 18 19 20 21 22 23 24 25 26 27 28 29 30 31 32 33 34 35 36 37 38 39 Note. AVI, arterial velocity–pulse index. Table S2. The upper reference range of AVI in different age
Age
(years)18−26 27−32 33−37 38−43 44−47 48−54 55−58 59−62 63−66 67−71 72−77 78−79 ≥ 80 Upper API 22 23 24 25 26 27 28 29 30 31 32 33 33 Note. API, arterial pressure−volume index. Table S3. The upper reference range of API in different age
-
During the baseline and follow-up visits, we used a standard questionnaire to obtain participants’ information on sociodemographic characteristics (age, sex, income, urbanization, educational level, and domicile), lifestyle (smoking, drinking, dietary habits, and physical activity), and family history of CVD. Ideal diet scores were defined as meeting two or above diet recommendation intakes in soybeans (≥ 125 g/d), red meat (< 75 g/d), fish (> 200 g/week), and tea (≥ 3 times/week)[6,21]. Ideal physical activity was considered as moderate activity at ≥ 150 minutes/week, or vigorous activity at ≥ 75 minutes/week, or an equivalent combination of both[22].
Trained professionals measured weight, height, heart rate, and blood pressure. The body mass index (BMI) was calculated by dividing the body weight (kg) by the square of the height (m2). Obesity was defined as BMI ≥ 28 kg/m2. Hypertension was defined as systolic blood pressure (SBP) ≥ 140 mmHg or diastolic blood pressure (DBP) ≥ 90 mmHg, or the use of anti-hypertensive medication within two weeks. Serum glucose and lipid levels were measured in overnight-fasted blood samples. Dyslipidemia was defined as intake of lipid-lowering medications within two weeks or total cholesterol (TC) ≥ 240 mg/dL (6.2 mmol/L) or triglycerides (TG) ≥ 200 mg/dL (2.3 mmol/L) or low-density lipoprotein cholesterol (LDL-C) ≥ 160 mg/dL (4.1 mmol/L) or high-density lipoprotein cholesterol (HDL-C) < 40 mg/dL (1.0 mmol/L). Diabetes mellitus was defined as fasting blood glucose (FBG) level ≥ 126 mg/dL (7.0 mmol/L) or the use of antidiabetic medications within two weeks.
Moreover, we defined changes in lifestyle (smoking, drinking, ideal physical activity, and ideal diet score) and disease status (hypertension, diabetes mellitus, and dyslipidemia) between baseline and the 2018–2021 follow-up visit. The participants were also categorized into four groups based on changes in lifestyle and disease status: maintaining non-ideal, increasing from non-ideal to ideal, decreasing from ideal to non-ideal, and maintaining ideal.
-
Continuous variables are described as means ± standard deviation for normal distribution or a median with interquartile range for skewed distribution, and categorical variables as percentages. Differences in continuous and categorical variables were examined using the independent t-test and analysis of variance (ANOVA); Wilcoxon-Mann-Whitney test and Kruskal-Wallis test; and chi-square test (categorical variables) for normal distribution, skewed distribution, and categorical variables, respectively.
We determined the associations between fruit and vegetable intake, AVI, and API using general linear models. In addition, logistic regression models were used to calculate the odds ratios (ORs) and corresponding 95% confidence intervals (CIs) for elevated AVI and API associated with high fruit and vegetable intake. Three sets of models were built: Model 1 was adjusted for age, sex, cohort, educational level, urbanization, and region; Model 2, included smoking, drinking, ideal physical activity, ideal diet score, family history of CVD, heart rate, and BMI; and Model 3 was further adjusted for SBP, FBG, LDL-C, HDL-C, anti-hypertensive drugs used, diabetes, and dyslipidemia. When logistic regression models were used to explore the changes in fruit and vegetable intake with elevated AVI and API, we built Model 2a by adjusting for the changes in lifestyle (smoking, drinking, ideal physical activity, and ideal diet score) to replace the baseline lifestyle in Model 2. Additionally, Model 3a was built adjusting for changes in disease status (hypertension, diabetes mellitus, and dyslipidemia) in Model 3. Furthermore, participants with CVD events had a different AVI and API than the general participants. Therefore, we conducted a sensitivity analysis that excluded CVD events to test the robustness of our results. Robustness was tested using the categorical variables of hypertension, diabetes, and dyslipidemia instead of continuous variables such as BMI, SBP, HDL-C, LDL-C, and fasting glucose levels. Subgroup analyses were performed to explore the differences in fruit and vegetable intake and arterial stiffness across baseline characteristics. Specifically, the heterogeneity of different groups was tested using the formula Z = d/SE (d)[23]. The d value is the difference between the coefficients, and SE (d) is the square root of the sum of the squares of separate standard errors.
The two-sided P < 0.05 was considered statistically significant. All analyses were performed using SAS version 9.4 (SAS Institute Inc., Cary, NC, USA) and R version 4.2.0.
-
Among 6,628 participants with a mean age of 54.11 ± 9.89 years, 61.75% were females (Table 1). The mean AVI and API levels were 22.75 ± 8.42 and 36.06 ± 10.72. The proportions of patients with elevated AVI and API were 16.57% and 66.72%, respectively. Females displayed higher AVI than males (23.53 ± 8.56 vs. 21.50 ± 8.03; P < 0.001), and the difference was also observed in API (37.41 ± 10.79 vs. 33.88 ± 10.23; P < 0.001). Females also had a higher proportion of elevated AVI (19.23% vs. 12.27%; P < 0.001) and API (72.71% vs. 57.04%; P < 0.001) and higher BMI, HDL-C, and LDL-C. No significant differences were observed in fruit and vegetable intake between females and males (400 [250–536] vs. 400 [250–543]; P = 0.629). Furthermore, males included in the study resided in urban areas (northern China), were drinkers and current smokers, had better economic conditions, higher educational levels, and ideal dietary scores.
Characteristic Total Males Females P value Participants 6,628 2,535 4,093 Age (year) 54.11 ± 9.89 54.49 ± 9.91 53.88 ± 9.87 0.015 High school or above, n (%) 819 (12.38) 482 (19.06) 337 (8.24) < 0.001 Southern, n (%) 5,193 (78.35) 1,953 (77.04) 3,240 (79.16) 0.042 Urban residents, n (%) 531 (8.01) 263 (10.37) 268 (6.55) < 0.001 Per-capita household income ≥ 1,000 CNY/month, n (%) 1,057 (15.98) 487 (19.23) 570 (13.97) < 0.001 Current smoker, n (%) 1,593 (24.19) 1,518 (60.02) 75 (1.85) < 0.001 Alcohol drinker, n (%) 1,620 (24.48) 1,372 (54.21) 248 (6.07) < 0.001 Ideal physical activity, n (%) 4,737 (71.47) 1,835 (72.39) 2,902 (70.90) 0.193 Ideal diet score, n (%) 3,806 (57.42) 1,712 (67.53) 2,094 (51.16) < 0.001 Family history of CVD, n (%) 2,023 (30.52) 820 (32.35) 1,203 (29.39) 0.011 Heart rate (beats/min) 75.61 ± 11.43 74.26 ± 11.33 76.45 ± 11.42 < 0.001 BMI (kg/m2) 23.91 ± 3.46 23.66 ± 3.30 24.07 ± 3.55 < 0.001 SBP (mmHg) 132.03 ± 20.02 132.20 ± 18.23 131.90 ± 21.05 0.502 FBG (mg/dL) 90.31 ± 23.90 90.68 ± 24.99 90.08 ± 23.19 0.336 HDL-C (mg/dL) 52.75 ± 13.16 51.80 ± 13.65 53.34 ± 12.81 < 0.001 LDL-C (mg/dL) 95.10 ± 27.49 92.44 ± 27.19 96.73 ± 27.55 < 0.001 Fruit and vegetable (g/d) 400 (250, 536) 400 (250, 543) 400 (250, 536) 0.629 AVI 22.75 ± 8.42 21.50 ± 8.03 23.53 ± 8.56 < 0.001 API 36.06 ± 10.72 33.88 ± 10.23 37.41 ± 10.79 < 0.001 Elevated AVI 1,098 (16.57) 311 (12.27) 787 (19.23) < 0.001 Elevated API 4,422 (66.72) 1,446 (57.04) 2,976 (72.71) < 0.001 Note. Continuous variables are presented as mean ± standard deviation or median (interquartile range) and categorical variables are presented as number (percentages). AVI, arterial velocity-pulse index; API, arterial pressure-volume index; CVD, cardiovascular disease; BMI, body mass index; SBP, systolic blood pressure; FBG, fasting blood glucose; HDL-C, high-density lipoprotein cholesterol; LDL-C, low-density lipoprotein cholesterol. Table 1. Baseline characteristics of the study population by sex
-
We found an inverse relationship between fruit and vegetable intake and arterial stiffness (Table 2). A per 100 g/d increment in fruit and vegetable intake was associated with a 0.11 decrease in AVI (B = −0.11; 95% CI: −0.20, −0.02; P = 0.016) in the multivariable model, whereas no significant association was observed for API (B = 0.02; 95% CI: −0.09, 0.13; P = 0.735). The AVI and API results did not change substantially in the sensitivity analysis (Supplementary Table S4, available in www.besjournal.com). Significant heterogeneity was observed in the association of fruit and vegetable intake per 100 g/d increment with AVI between alcohol drinkers and non-drinkers (B = −0.02 vs. B = −0.18, P = 0.037) (Supplementary Figure S1, available in www.besjournal.com). The proportion of elevated AVI (18.17% vs. 14.05%; P < 0.001) is lower in adults with high fruit and vegetable intake (≥ 500 g/d) than in those who had low fruit and vegetable intake (< 500 g/d) (Table 3), and the adjusted OR (95% CI) was 0.82 (0.70, 0.97). We observed heterogeneity in high fruit and vegetable intake with elevated AVI between participants aged ˂ 65 and > 65 years (OR = 0.76 vs. OR = 1.07; P = 0.043). Heterogeneity was also observed between smokers and non-smokers (OR = 0.47 vs. OR = 0.91; P = 0.002) (Supplementary Figure S2, available in www.besjournal.com).
Variables B estimate 95% CI P value AVI Model 1 −0.16 −0.26, −0.06 < 0.001 Model 2 −0.11 −0.19, −0.02 0.014 Model 3 −0.11 −0.20, −0.02 0.016 API Model 1 0.03 −0.07, 0.13 0.597 Model 2 −0.01 −0.11, 0.09 0.832 Model 3 0.02 −0.09, 0.13 0.735 Note. Model 1 adjusted for age, sex, region, urbanization, cohorts and educational level; Model 2 adjusted for age, sex, region, urbanization, cohorts, educational level, smoking, drinking, ideal physical activity, ideal diet score, family history of CVD, heart rate and body mass index; Model 3 adjusted for age, sex, region, urbanization, educational level, ideal physical activity, ideal diet score, family history of CVD, heart rate, body mass index, systolic blood pressure, fasting blood glucose, high-density lipoprotein cholesterol, low-density lipoprotein cholesterol and the drug used for hypertension, diabetes, and dyslipidemia. AVI, arterial velocity–pulse index; API, arterial pressure-volume index; CI, confidence interval; CVD, cardiovascular disease. Table 2. Association of AVI/API levels with per 100 g/d increment in fruit and vegetable intake
Variables Fruit and vegetable intake P value < 500 g/d ≥ 500 g/d Elevated AVI Case/total (%) 735/4,045 (18.17) 363/2,583 (14.05) < 0.001 Odds ratios (95% CI) Model 1 1.00 0.79 (0.68, 0.91) < 0.001 Model 2 1.00 0.83 (0.71, 0.98) 0.015 Model 3 1.00 0.82 (0.70, 0.97) 0.019 Elevated API Case/total (%) 2,749/4,045 (67.96) 1,673/2,583 (64.77) 0.007 Odds ratios (95% CI) Model 1 1.00 0.96 (0.86, 1.08) 0.525 Model 2 1.00 0.93 (0.83, 1.05) 0.233 Model 3 1.00 0.91 (0.81, 1.03) 0.169 Note. Model 1 adjusted for age, sex, region, urbanization, cohorts, and educational level; Model 2 adjusted for age, sex, region, urbanization, cohorts, educational level, smoking, drinking, ideal physical activity, ideal diet score, family history of CVD, heart rate, and body mass index; Model 3 adjusted for age, sex, region, urbanization, educational level, ideal physical activity, ideal diet score, family history of CVD, heart rate, body mass index, systolic blood pressure, fasting blood glucose, high-density lipoprotein cholesterol, low-density lipoprotein cholesterol and the drug used for hypertension, diabetes, and dyslipidemia. AVI, arterial velocity–pulse index; API, arterial pressure-volume index; CVD, cardiovascular disease. Table 3. Association of elevated AVI and API with fruit and vegetable intake
-
This study included 6,481 participants to assess the relationship between change in fruit and vegetable intake and arterial stiffness (median follow-up = 11.5 years; maximum follow-up = 14 years). The characteristics of the participants according to the different groups of fruit and vegetable intake are provided in Supplementary Table S5 (available in www.besjournal.com). Specifically, participants maintaining a fruit and vegetable intake ≥ 500 g/d had the least AVI (21.84 ± 7.79, 23.10 ± 8.52, 22.67 ± 8.68, 23.02 ± 8.38) and the proportion of elevated AVI (11.70%, 18.78%, 15.77%, 17.29%). They were more likely to be from an urban population and had a higher proportion of individuals maintaining ideal physical activity and ideal diet scores. In addition, they had a lower proportion of family histories of CVD.
Variables Total Maintaining <
500 g/dIncreasing from <
500 g/d to ≥ 500 g/dDecreasing from ≥ 500 g/d to <
500 g/dMaintaining ≥ 500 g/d P value Participants 6,481 2,668 1,446 1,290 1,077 Age (year) 54.14 ± 9.85 53.33 ± 10.67 54.94 ± 9.47 54.76 ± 9.57 54.33 ± 8.28 < 0.001 Female, N (%) 4,007 (61.82) 1,651 (61.88) 885 (61.20) 810 (62.79) 661 (61.37) 0.840 High school or above, N (%) 803 (12.41) 235 (8.82) 177 (12.27) 144 (11.17) 247 (22.98) < 0.001 Southern, N (%) 5,090 (78.54) 2,427 (90.97) 901 (62.31) 1,139 (88.29) 623 (57.85) < 0.001 Urban residents, N (%) 524 (8.09) 110 (4.12) 142 (9.82) 56 (4.34) 216 (20.06) < 0.001 Per-capita household income ≥ 1,000 CNY/month, N (%) 1,042 (16.12) 462 (17.38) 207 (14.32) 172 (13.37) 201 (18.68) < 0.001 Maintaining smoke status, N (%) 811 (12.60) 379 (14.30) 155 (12.11) 164 (11.43) 113 (10.56) 0.093 Maintaining drink status, N (%) 846 (13.09) 388 (14.56) 187 (14.53) 149 (10.33) 122 (11.40) < 0.001 Maintaining Ideal physical activity, N (%) 1,852 (28.58) 778 (29.16) 348 (26.98) 407 (28.15) 319 (29.62) < 0.001 Maintaining Ideal diet score, N (%) 2,278 (35.15) 889 (33.32) 469 (36.36) 494 (34.16) 426 (39.55) < 0.001 Family history of CVD, N (%) 1,992 (30.74) 963 (36.09) 395 (27.32) 350 (27.13) 284 (26.37) < 0.001 Heart rate change (beats/min) −0.78 ± 11.86 −0.09 ± 11.99 −1.46 ± 11.45 −0.40 ± 11.52 −2.03 ± 12.36 < 0.001 BMI change (kg/m2) −1.09 ± 2.53 −1.24 ± 2.49 −1.13 ± 2.44 −1.03 ± 2.62 −0.81 ± 2.60 < 0.001 Maintaining hypertension, N (%) 2,460 (38.29) 1,072 (40.53) 575 (40.07) 466 (36.52) 347 (32.49) < 0.001 Maintaining diabetes mellitus, N (%) 651 (10.05) 254 (9.52) 150 (10.38) 149 (11.57) 254 (9.52) 0.001 Maintaining dyslipidemia, N (%) 999 (16.46) 435 (17.20) 234 (17.36) 172 (14.33) 158 (15.94) 0.271 AVI 22.78 ± 8.42 23.10 ± 8.52 22.67 ± 8.68 23.02 ± 8.38 21.84 ± 7.79 < 0.001 API 36.08 ± 10.72 36.28 ± 10.99 35.91 ± 10.50 36.34 ± 10.60 35.51 ± 10.48 0.164 Elevated AVI 1,078 (16.63) 501 (18.78) 228 (15.77) 223 (17.29) 126 (11.70) < 0.001 Elevated API 4,334 (66.87) 1,816 (68.07) 954 (65.98) 879 (68.14) 685 (63.60) 0.039 Mean fruit and vegetable intake, g/d 379 (277, 504) 257 (197, 311) 431 (378, 499) 420 (377, 482) 617 (544, 765) < 0.001 Note. Continuous variables are presented as mean ± standard deviation or median (interquartile range) and categorical variables are presented as numbers (percentages). AVI, arterial velocity–pulse index; API, arterial pressure-volume index; CVD, cardiovascular disease; BMI, body mass index. Table S5. Baseline characteristics by fruit and vegetable intake change
Participants maintaining a fruit and vegetable intake ≥ 500 g/d had a lower risk of elevated AVI by 36% (OR = 0.64; 95% CI: 0.49, 0.83) than those maintaining < 500 g/d intake (Table 4). No significant association was observed between intake changes and API.
Variables Maintaining < 500 g/d
(n = 2,668)Increasing from < 500 g/d
to ≥ 500 g/d (n = 1,446)Decreasing from ≥ 500 g/d
to < 500 g/d (n = 1,290)Maintaining ≥ 500 g/d
(n = 1,077)Elevated AVI Case/total (%) 501/2,668 (18.78) 228/1,446 (15.77) 223/1,290 (17.29) 126/1,077 (11.70) Odds ratios (95% CI) Model 1 1.00 0.89 (0.75, 1.07) 0.85 (0.71, 1.01) 0.63 (0.50, 0.78) Model 2a 1.00 0.92 (0.76, 1.11) 0.91 (0.75, 1.09) 0.65 (0.52, 0.82) Model 3a 1.00 0.90 (0.73, 1.10) 0.90 (0.73, 1.09) 0.64 (0.49, 0.83) Elevated API Case/total (%) 1,816/2,668 (68.07) 954/1,446 (65.98) 879/1,290 (68.14) 685/1,077 (63.60) Odds ratios (95% CI) Model 1 1.00 1.05 (0.91, 1.22) 1.00 (0.87, 1.16) 0.97 (0.82, 1.14) Model 2a 1.00 0.99 (0.84, 1.15) 0.90 (0.77, 1.04) 0.89 (0.74, 1.05) Model 3a 1.00 1.00 (0.83, 1.19) 0.88 (0.75, 1.05) 0.89 (0.73, 1.09) Note. Model 1 adjusted for age, sex, region, urbanization, cohorts, and educational level; Model 2a adjusted for age, sex, region, urbanization, cohorts, educational level, family history of CVD, heart rate and heart rate change, smoke change, drink change, ideal physical activity change, ideal diet score change, body mass index and body mass index change; Model 3a adjusted for age, sex, region, urbanization, educational level, family history of CVD, smoke, drink, ideal physical activity and ideal diet score change, heart rate, body mass index, body mass index change, hypertension change, diabetes mellitus change and dyslipidemia change. AVI, arterial velocity–pulse index; API, arterial pressure-volume index. Table 4. Association of elevated AVI and API with the change in fruit and vegetable intake
-
In this study, we observed an inverse association between fruit and vegetable intake and AVI and maintaining a high intake at baseline reduced the risk of an elevated AVI. These effects are more obvious in non-drinkers. Furthermore, maintaining a high intake of fruit and vegetable for a long period of time could be more beneficial for the prevention of angiosclerosis. Our study provides evidence that adherence to fruit and vegetable recommendations has beneficial effects on subclinical cardiovascular disease in the Chinese population, especially in situations of inadequate fruit and vegetable intake.
As a strong independent predictor of CVD, arterial stiffness is influenced by fruit and vegetable intake. We found that fruit and vegetable intake significantly decreased arterial stiffness as assessed by AVI, consistent with the findings of previous studies assessed by other indexes. The Cardiovascular Risk in Young Finns Study, a prospective study that included 1,622 participants aged 3–18 years, found that fruit and vegetable intake was inversely associated with pulse wave velocity (PWV)[11]. A cross-sectional study from Jiangsu, China, including 11,392 adults with high CVD risk, reported that vegetable intake was inversely associated with the development of carotid plaque[24]. However, randomized clinical trials focusing on specific fruit have reported inconsistent results regarding arterial stiffness. Specifically, increased daily blueberry[25,26] intake may not change arterial stiffness; however, increased apple[27] and pitaya[28] intake may reduce arterial stiffness. In contrast to previous studies that focused on young or high-CVD-risk individuals, our study focused on middle-aged and older adults. Our findings provide evidence that increased fruit and vegetable intake is associated with reduced arterial stiffness. However, we did not observe a significant potential benefit of fruit and vegetable intake on peripheral arterial stiffness, as assessed by the API. The association of fruit and vegetable intake with ankle-brachial index (ABI) remained controversial in previous studies[29,30]. The following reasons may explain the differences between the AVI and API results. The potential protective effect against peripheral arterial stiffness may begin in adolescence rather than at older ages above 54 years, as observed in this study. Furthermore, the association between AVI and API was lower[16]. The central artery is more flexible and susceptible to environmental factors[31]. Therefore, increased fruit and vegetable intake is recommended if participants have elevated central arterial stiffness as assessed by the AVI. However, increasing fruit and vegetable intake might not improve peripheral arterial stiffness, as assessed by the API. We found that fruit and vegetable intake had greater preventative effects on AVI among nondrinkers. Alcohol intake can influence vascular smooth muscle cells and aggravate arterial stiffness[32], which may counteract the positive effects of fruit and vegetable intake. Moreover, greater protective effects between high fruit and vegetable intake and elevated AVI were observed among smokers and aged ˂ 65 years. Age is the strongest risk factor for arterial stiffness[33] and antioxidants in fruits and vegetables[34] may reduce the burden of age-related hardening of the arteries. These results recommend a high fruit and vegetable intake at a young age for protection against arterial stiffness. The proportion of patients with elevated AVI was higher among smokers, which may have made it easier for us to observe the protective effects of fruit and vegetable intake among smokers. We observed that the sources of heterogeneity in the AVI and elevated AVI differed. However, AVI was consistently associated with elevated AVI in this direction. Heterogeneity was not significant, according to the strict thresholds. In addition, the insufficient sample size after subgroup analysis may also be a cause for heterogeneity.
Dietary trends have changed over time[35]. In this study, we observed a decrease in the ideal diet score. Compared with the participants at baseline, the proportion of participants maintaining an ideal diet score decreased from 57.42% to 35.15% in the median of 11.5 years of follow-up. To minimize bias, our study adjusted for lifestyle changes, including the ideal diet score, to investigate the association between changes in fruit and vegetable intake and arterial stiffness. We found that participants who maintained a high fruit and vegetable intake had benefits for decreasing the elevated AVI risk compared to those who maintained a low intake. However, we did not find a protective effect of the API. A previous study reported the relationship between changes in ideal cardiovascular health (CVH), including fruit and vegetable intake, and the burden of cardiovascular disease. The results showed that maintaining high CVH levels from childhood onward may be associated with reduced carotid intima-media thickness[36]. However, the Atherosclerosis Risk in Communities (ARIC) study found no significant association between changes in diet quality and the risk of incident CVD[37].
Fruit and vegetable contain abundant substances that protect cardiovascular health[1,38]. Several mechanisms may explain the reduction in arterial stiffness associated with fruit and vegetable consumption. First, nitrate is recycled into nitric oxide (NO) via the nitrate-nitrite-NO pathway. NO inhibits blood flow by altering the vascular tone and resulting in the development of arterial stiffness[39,40]. Second, dietary fiber intake can prevent accelerated arterial stiffness[41,42] by reducing the ratio of cholesterol[43], C-reactive protein levels, apolipoprotein levels, and blood pressure[44]. Third, potassium has antioxidant effects that protect the blood vessels by reducing free radical formation[45]. Finally, bioactive compounds such as polyphenols have pleiotropic anti-oxidative and anti-inflammatory properties that can protect the vascular structure and ameliorate arterial stiffness[46].
Our study had the following strengths: A large number of participants from multiple provinces throughout China were enrolled to reduce regional effects. Our models were comprehensively adjusted for various demographic and lifestyle characteristics to reduce the impact of residual confounders. However, our study had several potential limitations. First, arterial stiffness information was collected at the 2018–2021 follow-up visit; our baseline analysis did not have this information, so a causal relationship was not established. Second, our model did not estimate the total energy intake of the participants; however, our main analyses were adjusted for both physical activity and obesity, which together could be considered a good proxy for total energy intake. Finally, fruit and vegetable intake was assessed using FFQs, and the measurement error of self-reported dietary data should be considered.
-
In conclusion, fruit and vegetable intake is negatively associated with arterial stiffness, emphasizing the need for adherence to fruit and vegetable intake for the potential prevention of arterial stiffness and CVD.
HTML
Study Population
Definition of Fruit and Vegetable Intake and Classification
Measurement of Arterial Stiffness
Assessment of Covariates
Statistical Analysis
Study Population Characteristics
Association of Fruit and Vegetable Intake with Arterial Stiffness
Change in Fruit and Vegetable Intake and Arterial Stiffness
 23119+Supplementary Materials.pdf
|

|

 Quick Links
 DownLoad: