

-
Sepsis is a common condition associated with high mortality and long-term morbidity[1]. Despite declining age-standardized incidence and mortality rates, sepsis remains a major global health concern[2]. Furthermore, sepsis has been recognized by the World Health Organization as a global health priority[3].
Although asepsis is generally treated as a single disease, identifying distinct sepsis clusters can significantly improve research, treatment, and patient prognosis. Knox et al.[4] identified four distinct clusters in patients with severe sepsis or septic shock: 1) shock with elevated creatinine, 2) minimal multi-organ dysfunction syndrome, 3) shock with hypoxemia and altered mental status, and 4) hepatic disease. The mortality rates for these clusters were 11%, 12%, 28%, and 21%, respectively (P < 0.001). Seymour et al.[5] identified four sepsis phenotypes: α (33%), with the lowest vasopressor use; β (27%), older with more chronic illnesses and renal dysfunction; γ (27%), marked by inflammation and pulmonary dysfunction; and δ (13%), with liver dysfunction and septic shock. In the derivation cohort, the 28-day mortality rates were 5%, 13%, 24%, and 40% for the α, β, γ, and δ phenotypes, respectively. Xu et al.[6] identified four distinct Sequential (sepsis-related) Organ Failure Assessment (SOFA) scores that are trajectory-based sub-phenotypes of sepsis: 1) rapidly worsening (13.1%), 2) delayed worsening (20.5%), 3) rapidly improving (41.3%), and 4) delayed improving (25.1%). The rapidly worsening sub-phenotype had the highest in-hospital mortality rate (28.3%, P < 0.001), whereas those with an improving sub-phenotype of sepsis demonstrated a lower mortality risk. Bhavani et al.[7] identified four vital sign trajectory sub-phenotypes: Group A (28%), presenting hyperthermia, tachycardia, tachypnea, and hypotension; Group B (13%), presenting hyperthermia, tachycardia, tachypnea (less pronounced than Group A), and hypertension; and Groups C (32%) and D (27%), presenting lower vital signs, including patients with normotension and hypotension, respectively. Groups A and B included younger patients with varying comorbidities. Those in Groups A and D had the highest vasopressor use (P < 0.001). Logistic regression analyses showed significantly higher 30-day mortality rates in Groups A and D (P < 0.001 and P = 0.03, respectively). These phenotypes have distinct clinical outcomes that reflect underlying pathophysiological differences and could potentially facilitate tailored treatment or research directions.
Liu et al.[8] reported a novel clinical state of sepsis referred to as “pre-shock”. Patients with sepsis who entered this state were highly likely to develop septic shock at some point in the future. This pre-shock state was physiologically distinct from both the sepsis and septic shock states. The top three distinguishing features of the pre-shock state were lactate, cardiovascular SOFA score, and Glasgow Coma Scale (GCS) score. To date, the definition of “pre-shock state” remains controversial.
Based on the Sepsis-3 criteria[9], sepsis can be classified as either sepsis or septic shock. Sepsis is characterized by a rise in the SOFA score by ≥ 2 points. Septic shock is defined as the need for vasopressors to maintain a mean arterial pressure ≥ 65 mmHg and serum lactate level exceeding 2 mmol/L (> 18 mg/dL) in the absence of hypovolemia[9]. Notably, some patients with sepsis may experience hypotension or elevated lactate level, although they do not meet the diagnostic criteria for septic shock. We hypothesized that the prognosis of these patients differs from that of patients with sepsis or septic shock. In this study, these patients were categorized as the “pre-shock state” group, and we evaluated the impact of the pre-shock state on short- and long-term mortality in patients with sepsis.
-
This was a retrospective cohort study conducted in the medical intensive care unit (ICU) of a university-affiliated urban teaching hospital in China between May 2015 and December 2021. The study protocol was approved (approval number: M2022135) by the Medical Science Research Ethics Committee of Peking University Third Hospital, Beijing, China. The need to obtain written informed consent was waived owing to the retrospective nature of the study. Patients or the public were not involved in the design, conduct, reporting, or dissemination plans of our research.
-
Patients with sepsis who were admitted to the medical ICU were included. The inclusion criteria were as follows: 1) patients who met the Sepsis-3 diagnostic criteria, which were defined as the presence of life-threatening organ dysfunction caused by a dysregulated host response to infection, with SOFA score of 2 points; and 2) age ≥ 18 years.
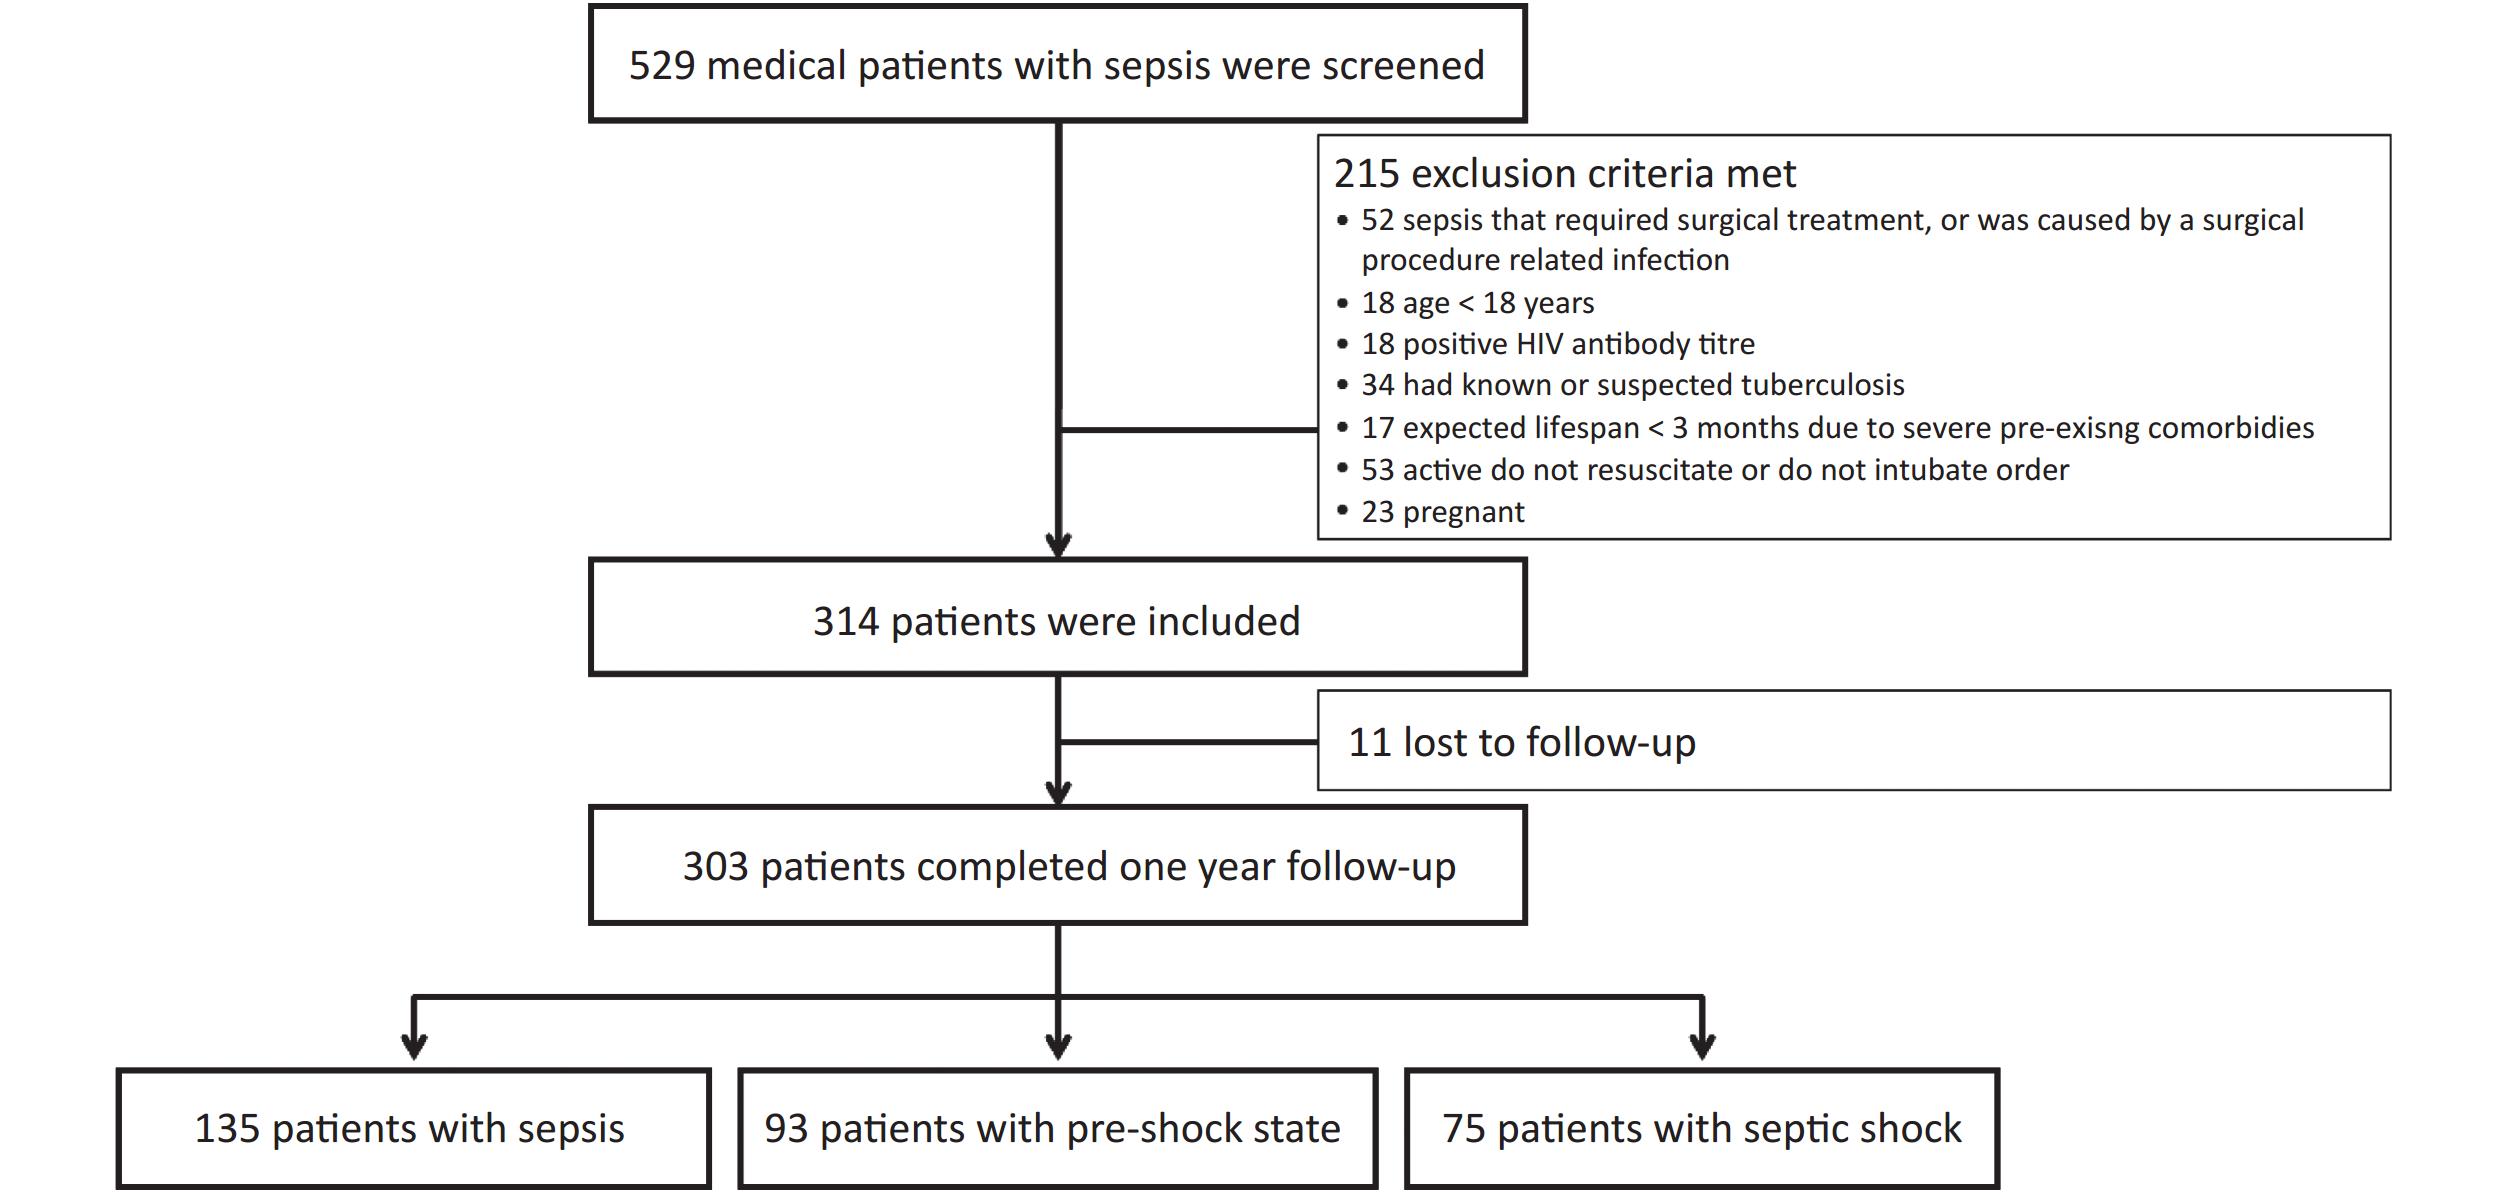
Patients were excluded from the study if they met one of the following criteria: 1) had sepsis that required surgical treatment or was caused by an infection related to a surgical procedure; 2) had a positive human immunodeficiency virus antibody titer or known/suspected tuberculosis at baseline; 3) had an expected lifespan < 3 months owing to severe preexisting comorbidities, as this could potentially influence the analysis of survival-related outcomes; 4) had an active do-not-resuscitate or do-not-intubate order; and 5) pregnancy.
All patients received treatment according to the International Guidelines for the Management of Sepsis and Septic Shock[10-12]. We collected the following demographic and clinical data: sex, age, weight, height, primary site of infection, community-acquired or hospital-acquired infection, blood pressure, lactate level, urine output, partial pressure of oxygen in arterial blood to the fraction of inspired oxygen ratio (PaO2/FiO2), serum creatinine, total bilirubin, platelets, GCS score, SOFA score, acute physiology and chronic health evaluation (APACHE) II score, positive blood culture, noninvasive ventilation, intubation, duration of ICU stay, and duration of hospital stay. Body mass index (BMI) was defined as weight in kilograms divided by the square of height in meters (kg/m2), which was used in our previous study[13]. Patients who survived till discharge were followed up for 1 year.
Sepsis and septic shock were defined using the Sepsis-3 criteria. Sepsis was defined as a life-threatening organ dysfunction caused by a dysregulated host response to infection. For clinical operationalization, organ dysfunction can be represented by an increase in the SOFA score by ≥ 2 points. Septic shock was a subset of sepsis, in which underlying circulatory and cellular metabolism abnormalities were profound enough to substantially increase mortality. Patients with septic shock can be clinically identified by vasopressor requirement for maintenance of a mean arterial pressure ≥ 65 mmHg and serum lactate level > 2 mmol/L (> 18 mg/dL) in the absence of hypovolemia.
In this study, we defined the pre-shock state of sepsis as the reversal of hypotension after adequate fluid resuscitation or a lactate level > 2 mmol/L (18 mg/dL) without shock. Considering this, the patients were assigned to the sepsis, pre-shock state, or septic shock groups for analysis.
-
The primary outcome was the 28-day mortality rate. The secondary outcomes were the 90-day, 180-day, and 1-year mortality rates.
-
Continuous variables are presented as medians (interquartile ranges), and categorical variables are presented as numbers (%). Clinical data were compared among the three study groups (sepsis, pre-shock state, and septic shock). Continuous variables were compared using the nonparametric Kruskal–Wallis H test, whereas categorical variables were compared using the chi-square test. The Kaplan–Meier survival curves were constructed to show the survival probabilities at day 365 according to disease severity classification and compared using the log-rank test. Compared with sepsis, the death risk analysis of the pre-shock state and septic shock was performed using univariate Cox proportional hazard regression analysis.
Patients were subdivided into older (≥ 65 years) and younger (< 65 years) patient groups. The mortality rates of the two groups were compared using the chi-square test.
Patients were also subdivided into survival and non-survival groups based on in-hospital clinical outcomes. The durations of hospital and ICU stays were compared using the nonparametric Mann-Whitney U test.
All analyses were conducted using SPSS, version 22.0 (IBM, Armonk, NY, USA). A P-value < 0.05 was considered significant.
-
This study included 314 patients. Of these, 303 patients (199 males [65.7%]) completed the 1-year follow-up (11 patients were lost to follow-up and removed from the final statistical analysis) (Figure 1). The median age (interquartile range) was 77 (65–84) years, and 228 patients (75.2%) were aged > 65 years. The most common primary site of infection was the lung (229 patients, 75.6%), followed by the abdomen (19 patients, 6.3%), urinary tract (18 patients, 5.9%), gastrointestinal tract (12 patients, 4.0%), and other sites (25 patients, 8.3%). The SOFA score was 6.0 (4.0–9.0) points, and the APACHE II score was 18.0 (13.0–23.0) points. Blood culture was positive in 65 patients (21.5%). In total, 105 patients (34.7%) received noninvasive ventilation, and 129 (42.6%) received invasive mechanical ventilation. The 28-day, in-hospital, 90-day, 180-day, and 1-year mortality rates were 31.0%, 36.6%, 43.2%, 45.9%, and 49.8%, respectively. The median durations of ICU and hospital stays were 12 (7–21) and 15 (9–25) days, respectively (Table 1).
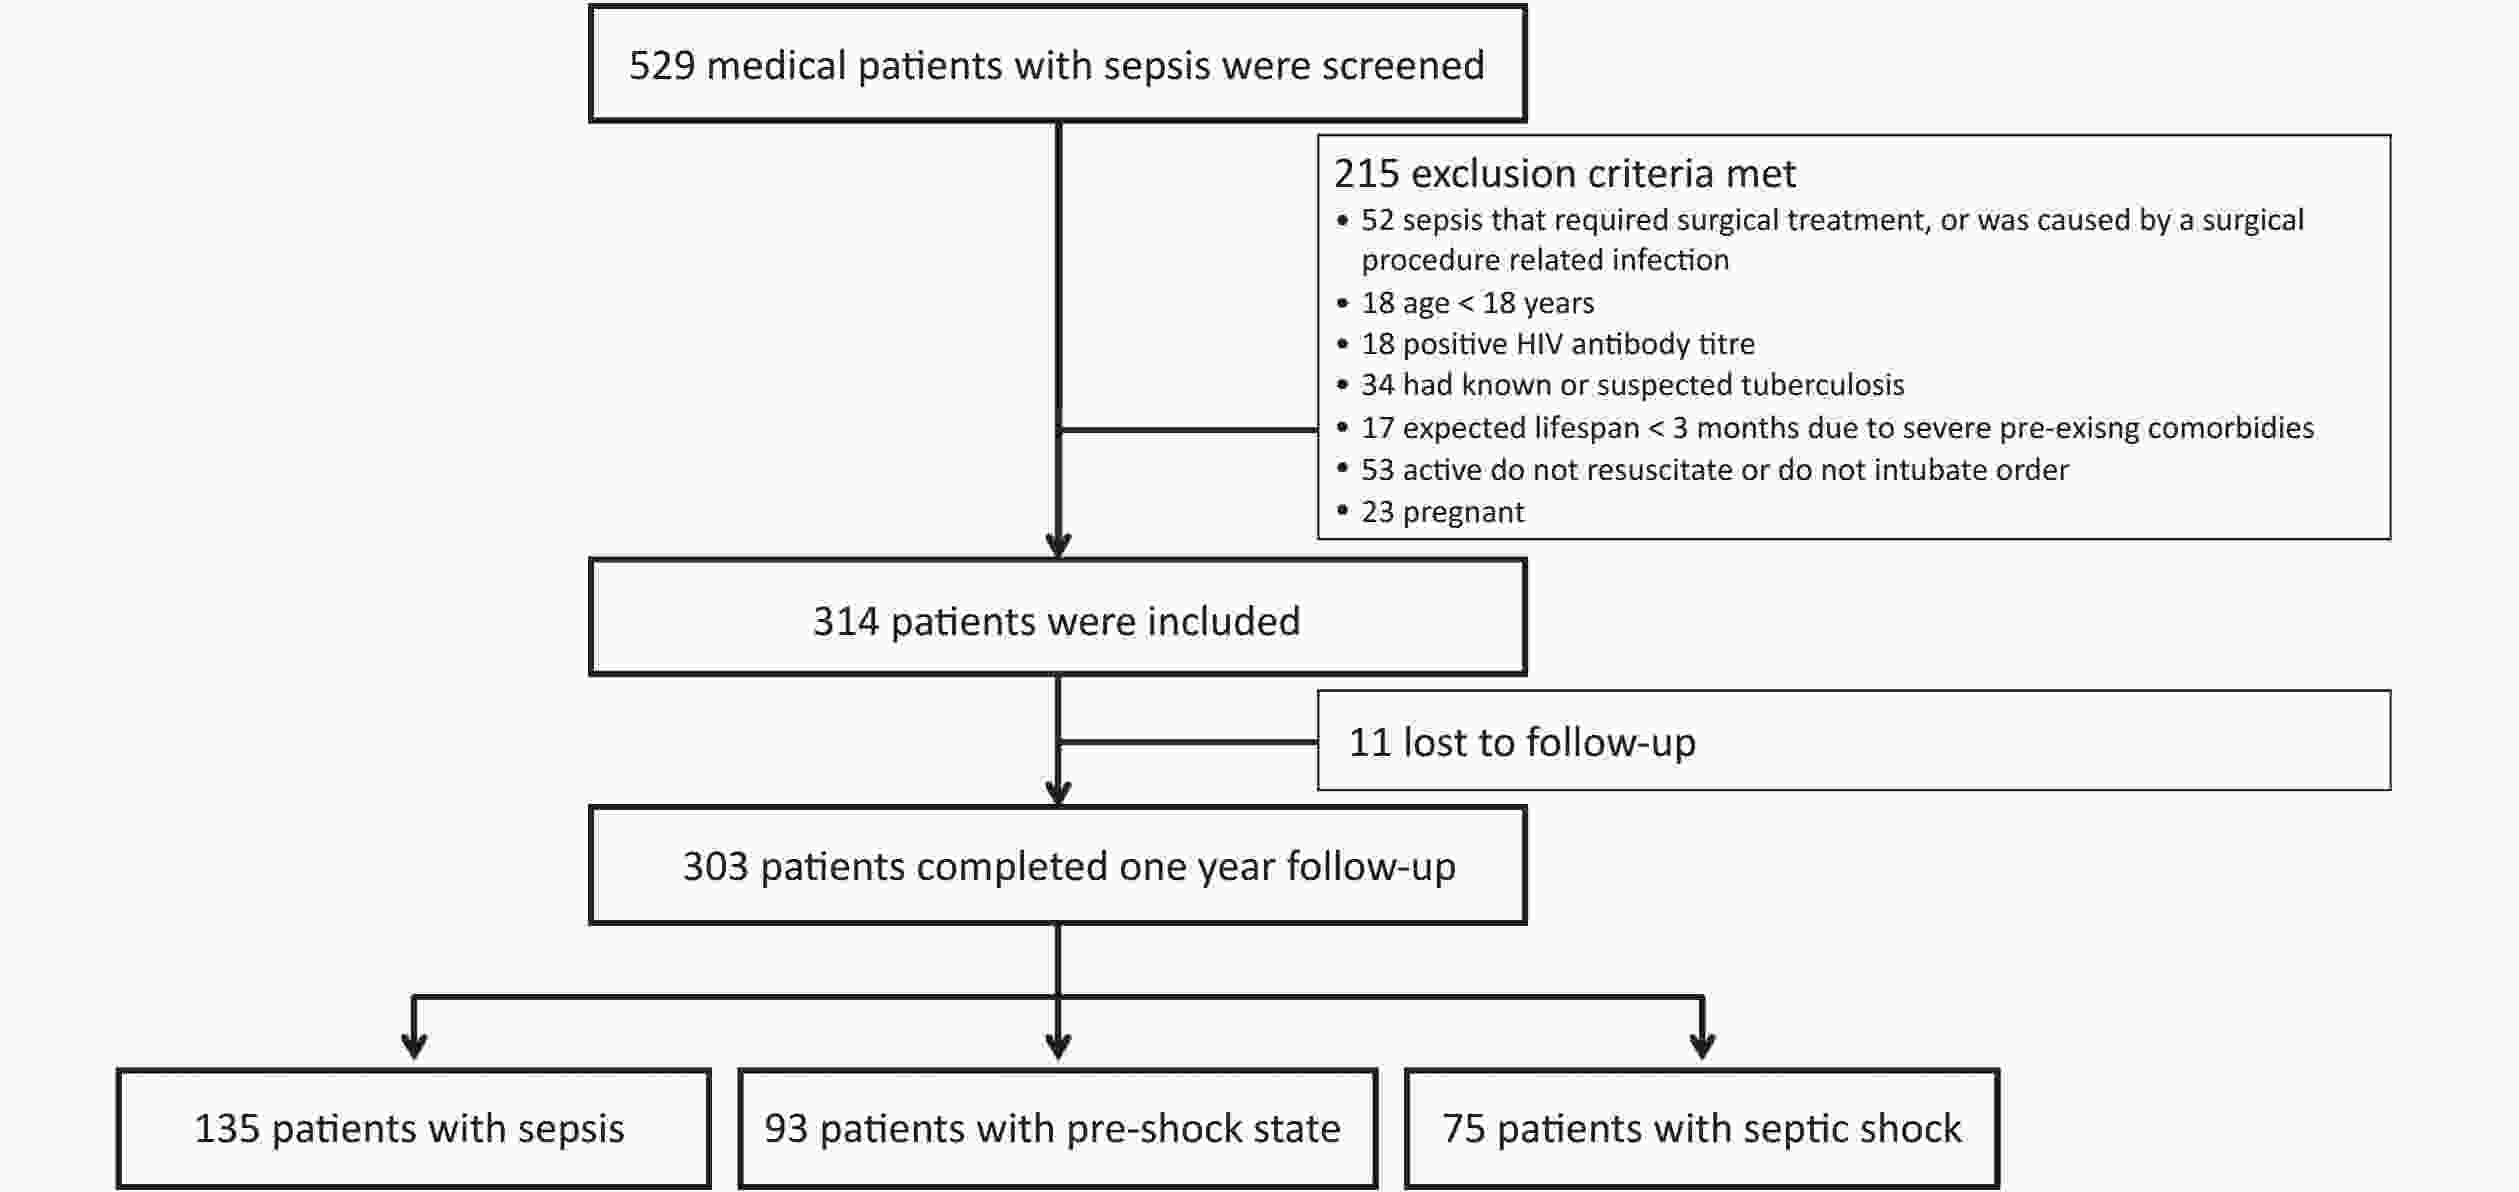
Figure 1. Flow diagram illustrates the study design and patient progression.
Characteristics All patients (n = 303) Sepsis (n = 135) Pre-shock state (n = 93) Septic shock (n = 75) P-value Age (years) 77.0 (65.0–84.0) 77.0 (63.0–84.0) 77.0 (67.0–84.5) 78.0 (65.0–83.0) 0.540 Males 199 (65.7) 96 (71.1) 54 (58.1) 49 (65.3) 0.125 Comorbidities COPD 41 (13.5) 24 (17.8) 10 (10.8) 7 (9.3) 0.148 Diabetes mellitus 82 (27.1) 33 (24.4) 29 (31.2) 20 (26.7) 0.529 Cerebrovascular disease 78 (25.7) 41 (30.4) 19 (20.4) 18 (24.0) 0.223 Neoplasm 44 (14.5) 15 (11.1) 19 (20.4) 10 (13.3) 0.138 Liver disease 13 (4.3) 3 (2.2) 4 (4.3) 6 (8.0) 0.141 Heart failure 55 (18.2) 23 (17.0) 19 (20.4) 13 (17.3) 0.790 Chronic renal failure 41 (13.5) 25 (18.5) 9 (9.7) 7 (9.3) 0.075 Body mass index (kg/m2) 22.9 (19.7–26.2) 23.3 (20.7–27.2) 22.5 (19.8–26.0) 22.0 (18.4–24.7) 0.049 Primary site of infection Lung 229 (75.6) 120 (88.9) 64 (68.8) 45 (60.0) < 0.001 Abdomen 19 (6.3) 3 (2.2) 9 (9.7) 7 (9.3) 0.033 Urinary tract 18 (5.9) 4 (3.0) 6 (6.5) 8 (10.7) 0.075 Gastrointestinal tract 12 (4.0) 1 (0.7) 2 (2.2) 9 (12.0) < 0.001 Other site 25 (8.3) 7 (5.2) 12 (12.9) 6 (8.0) 0.114 Community-acquired infection 240 (79.2) 102 (75.6) 73 (78.5) 65 (86.7) 0.161 Lactate level (mmol/L) 1.7 (1.0–3.2) 1.0 (0.8–1.4) 2.5 (1.8–3.6) 3.6 (2.2–6.0) < 0.001 Oliguria 34 (11.2) 5 (3.7) 8 (8.6) 21 (28.0) < 0.001 PaO2/FiO2 (mmHg) 181.0 (119.0–251.0) 181.0 (124.5–245.0) 175.0 (100.0–253.0) 193.5 (129.5–257.0) 0.685 Serum creatinine (µmol/L) 95.0 (61.0–178.0) 82.0 (57.0–138.0) 96.5 (63.5–167.0) 125.0 (84.0–224.0) 0.003 Total bilirubin (µmol/mL) 14.7 (10.6–25.0) 12.6 (9.1–17.6) 16.6 (11.3–23.7) 24.2 (13.2–44.9) < 0.001 Platelets (×109/L) 161.0 (102.0–228.5) 188.0 (129.0–237.0) 136.0 (89.0–201.5) 132.0 (68.0–213.0) 0.001 Glasgow Coma Scale 14.0 (9.0–15.0) 15.0 (11.0–15.0) 14.0 (10.0–15.0) 11.0 (5.0–15.0) 0.002 SOFA score 6.0 (4.0–9.0) 5.0 (3.0–6.0) 7.0 (4.0–9.0) 10.0 (7.0–12.0) < 0.001 APACHE II score 18.0 (13.0–23.0) 17.0 (13.0–22.0) 18.0 (13.0–24.0) 22.0 (16.0–30.0) < 0.001 Positive blood culture 65 (21.5) 20 (14.8) 20 (21.5) 25 (33.3) 0.007 Noninvasive ventilation 105 (34.7) 53 (39.3) 32 (34.4) 20 (26.7) 0.185 Intubated 129 (42.6) 52 (38.5) 40 (43.0) 37 (49.3) 0.314 Note. Data are presented as n (%) or medians (interquartile ranges). APACHE: acute physiology and chronic health evaluation; COPD: chronic obstructive pulmonary disease; PaO2/FiO2: ratio of the partial pressure of oxygen in arterial blood to the fraction of inspired oxygen; SOFA: sequential organ failure assessment. Table 1. Demographic and clinical data comparison among groups defined by sepsis severity
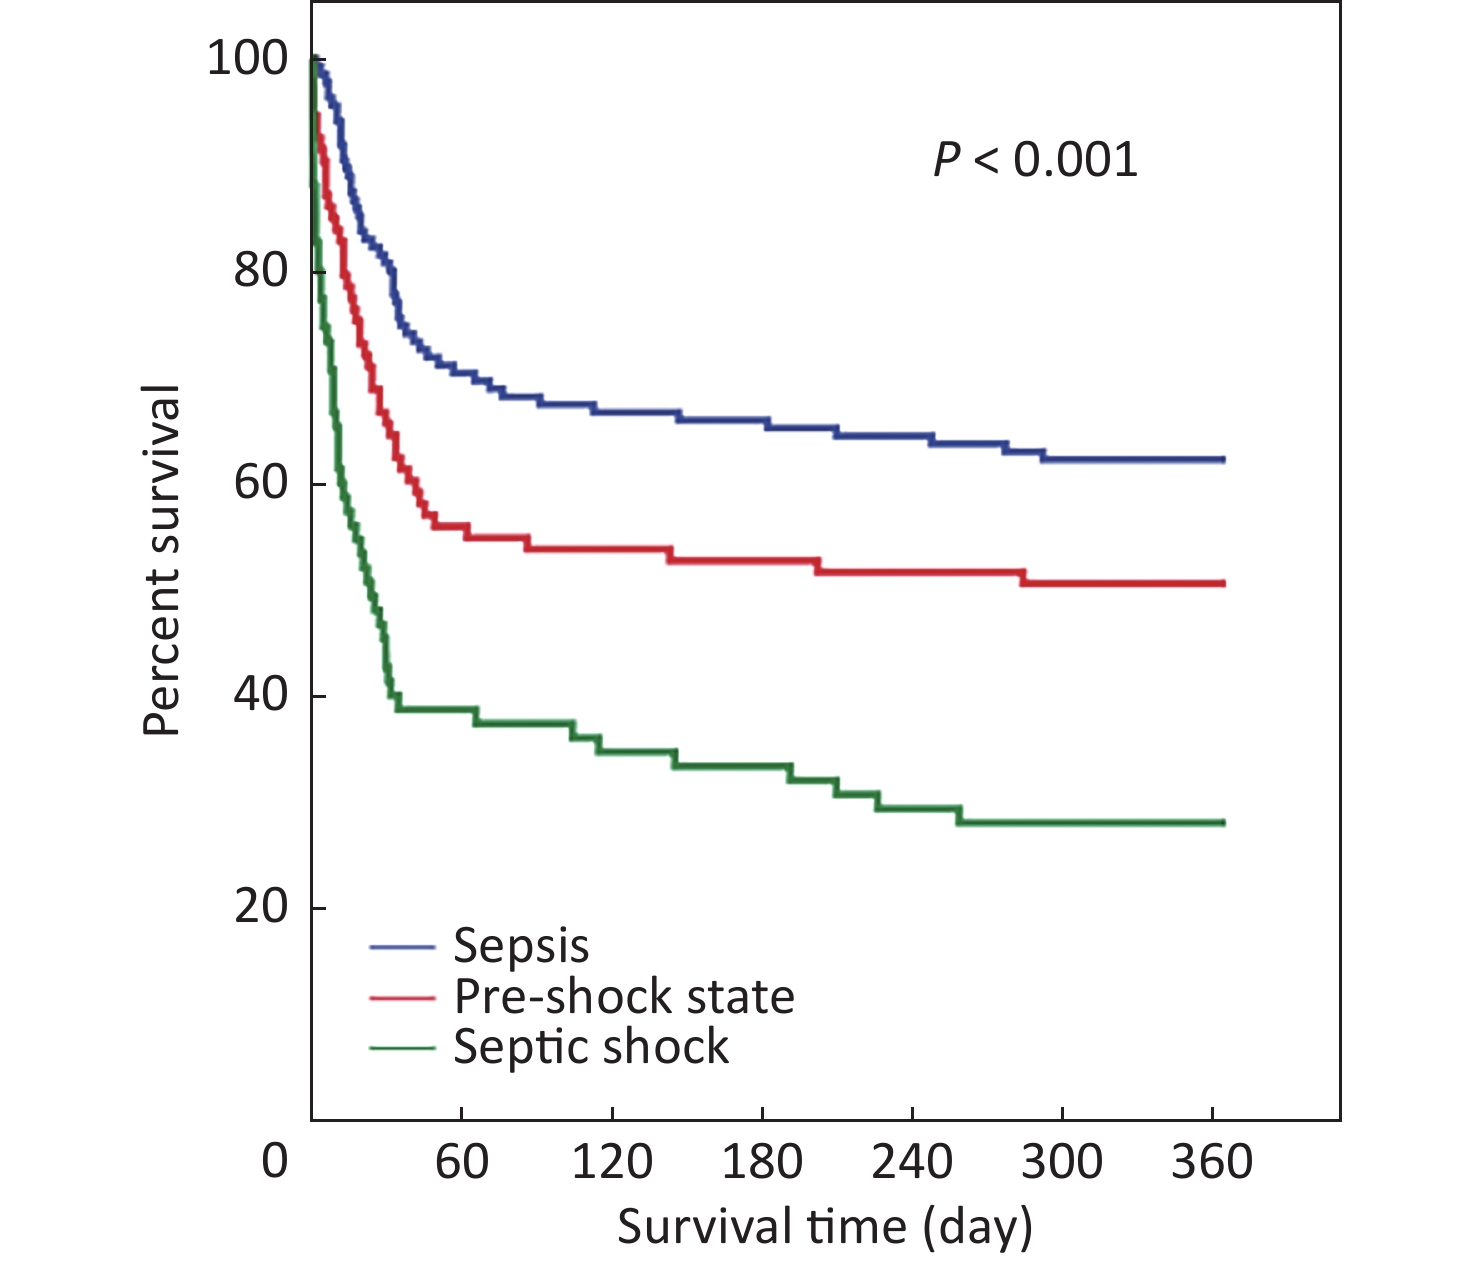
Patients were divided into sepsis (135 patients [44.6%]), pre-shock state (93 patients [30.7%]), and septic shock (75 patients [24.8%]) groups. The lactate level, frequency of oliguria, serum creatinine level, total bilirubin level, SOFA score, APACHE II score, and frequency of positive blood culture significantly increased with increased disease severity, whereas BMI, platelet count, and GCS score significantly decreased (Table 1). The 28-, 90-, and 180-day and 1-year mortality rates of the pre-shock state group (31.2%, 44.1%, 46.2%, and 49.5%, respectively) were all significantly higher than those of the sepsis group (18.5%, 32.6%, 34.1%, and 37.8%, respectively) and significantly lower than those of the septic shock group (53.3%, 61.3%, 66.7%, and 72.0%, respectively), especially in older patients (Table 2). Differences in the 1-year mortality rates among the three groups were demonstrated using Kaplan–Meier survival analysis (Figure 2).
Mortality Total Sepsis Pre-shock state Septic shock P-value All patients n = 303 n = 135 n = 93 n = 75 28-day 94 (31.0) 25 (18.5) 29 (31.2) 40 (53.3) < 0.001 90-day 131 (43.2) 44 (32.6) 41 (44.1) 46 (61.3) < 0.001 180-day 139 (45.9) 46 (34.1) 43 (46.2) 50 (66.7) < 0.001 1-year 151 (49.8) 51 (37.8) 46 (49.5) 54 (72.0) < 0.001 Older patients (≥ 65 years) n = 228 n = 99 n = 72 n = 57 28-day 81 (35.5) 21 (21.2) 27 (37.5) 33 (57.9) < 0.001 90-day 114 (50.0) 39 (39.4) 36 (50.0) 39 (68.4) 0.002 180-day 122 (53.5) 41 (41.4) 38 (52.8) 43 (75.4) < 0.001 1-year 133 (58.3) 46 (46.5) 41 (56.9) 46 (80.7) < 0.001 Younger patients (< 65 years) n = 75 n = 36 n = 21 n = 18 28-day 13 (17.3) 4 (11.1) 2 (9.5) 7 (38.9) 0.021 90-day 17 (22.7) 5 (13.9) 5 (23.8) 7 (38.9) 0.116 180-day 17 (22.7) 5 (13.9) 5 (23.8) 7 (38.9) 0.116 1-year 18 (24.0) 5 (13.9) 5 (23.8) 8 (44.4) 0.046 Note. Data are presented as n (%). Table 2. Comparison of mortality among groups defined by sepsis severity
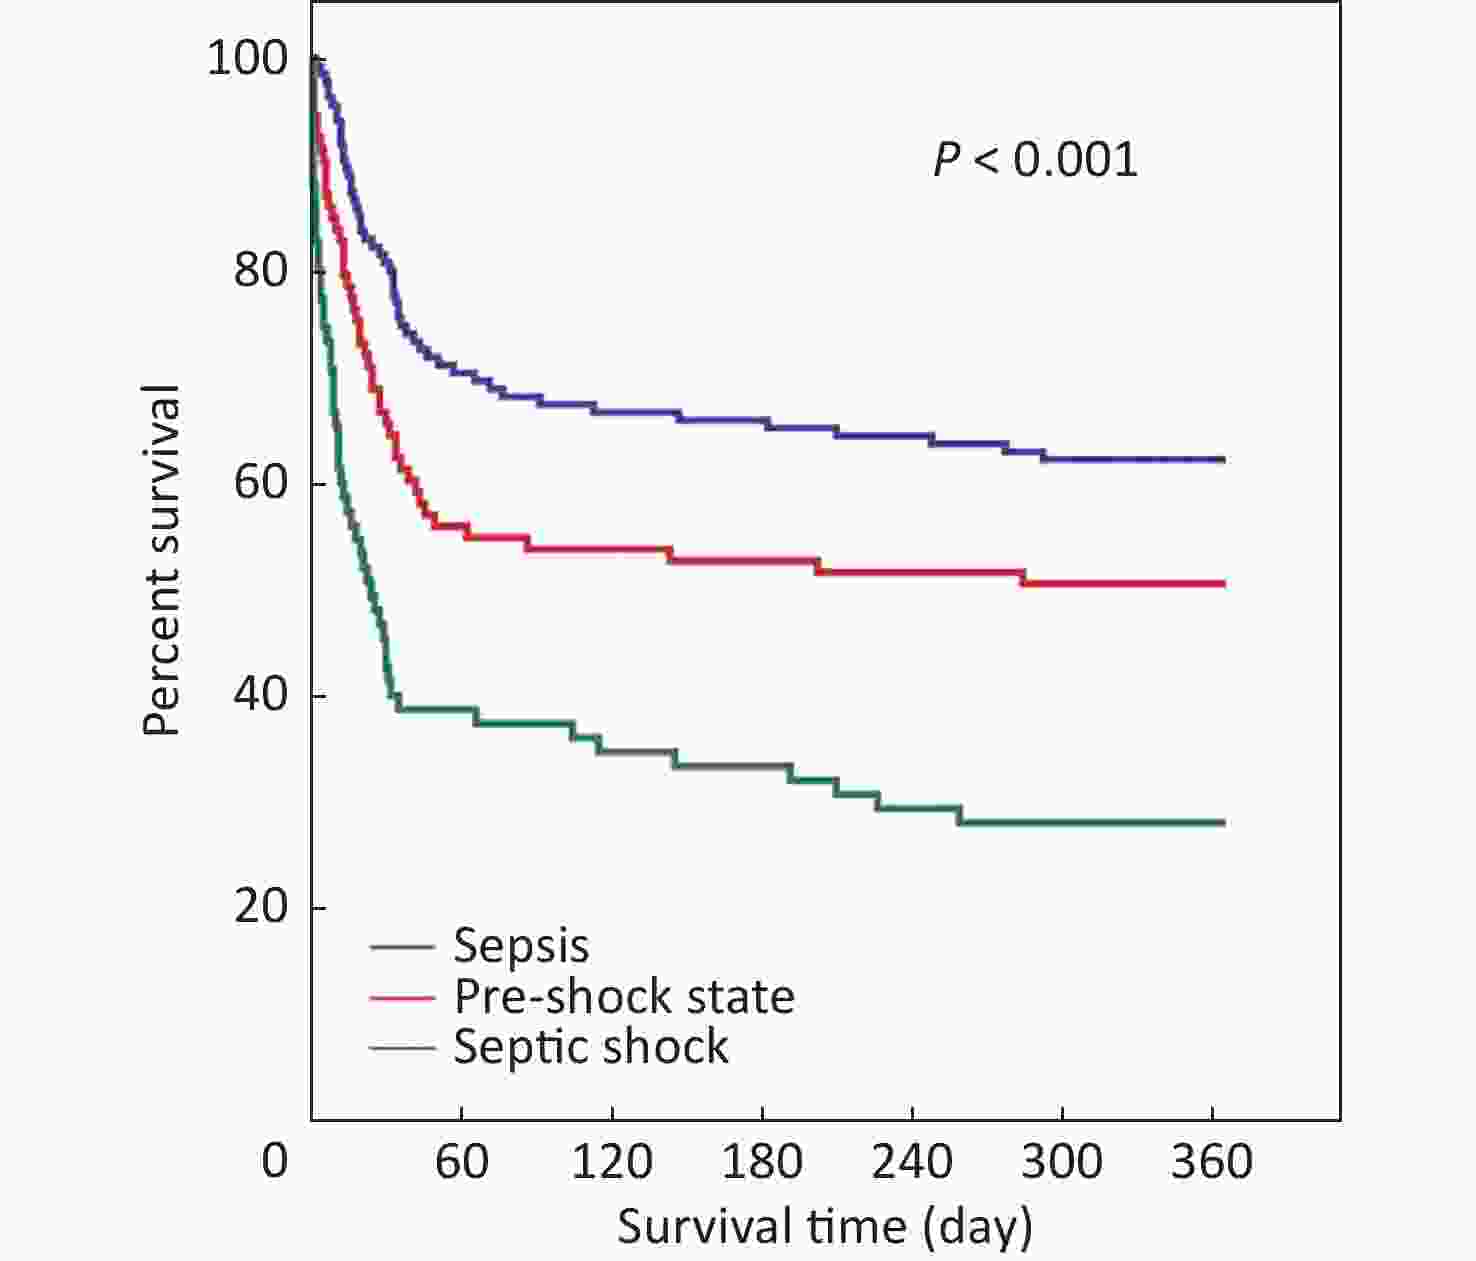
Figure 2. Kaplan-Meier survival plot for 1-year survival rates of 303 patients, which included those in sepsis, pre-shock state, or septic shock.
Compared with the pre-shock state group, mortality risks in the 28-, 90-, and 180-day and 1-year periods were significantly lower in the sepsis group (hazard ratio [HR]: 0.540, 0.649, 0.644, and 0.663, respectively; all P < 0.05) and higher in the septic shock group (HR: 2.110, 1.815, 1.896, and 1.952, respectively; all P < 0.01) according to univariate Cox proportional hazard regression analysis (Table 3).
Mortality Variables Hazard ratio 95% confidence interval P-value 28-day Sepsis 0.540 0.316–0.922 0.024 Pre-shock state Reference Septic shock 2.110 1.307–3.405 0.002 90-day Sepsis 0.649 0.424–0.994 0.047 Pre-shock state Reference Septic shock 1.815 1.191–2.767 0.006 180-day Sepsis 0.644 0.425–0.975 0.038 Pre-shock state Reference Septic shock 1.896 1.261–2.853 0.002 1-year Sepsis 0.663 0.445–0.987 0.043 Pre-shock state Reference Septic shock 1.952 1.316–2.895 0.001 Table 3. Fatality risk in patients with pre-shock state or septic shock using the univariate Cox proportional hazard regression analysis
Of the 93 patients in the pre-shock state group, 30 progressed to septic shock after 3.0 (1.0–15.0) days, and 63 improved to sepsis after 2.0 (1.0–5.0) days (Figure 3).

Figure 3. Evolution of the condition in patients with a pre-shock state of sepsis
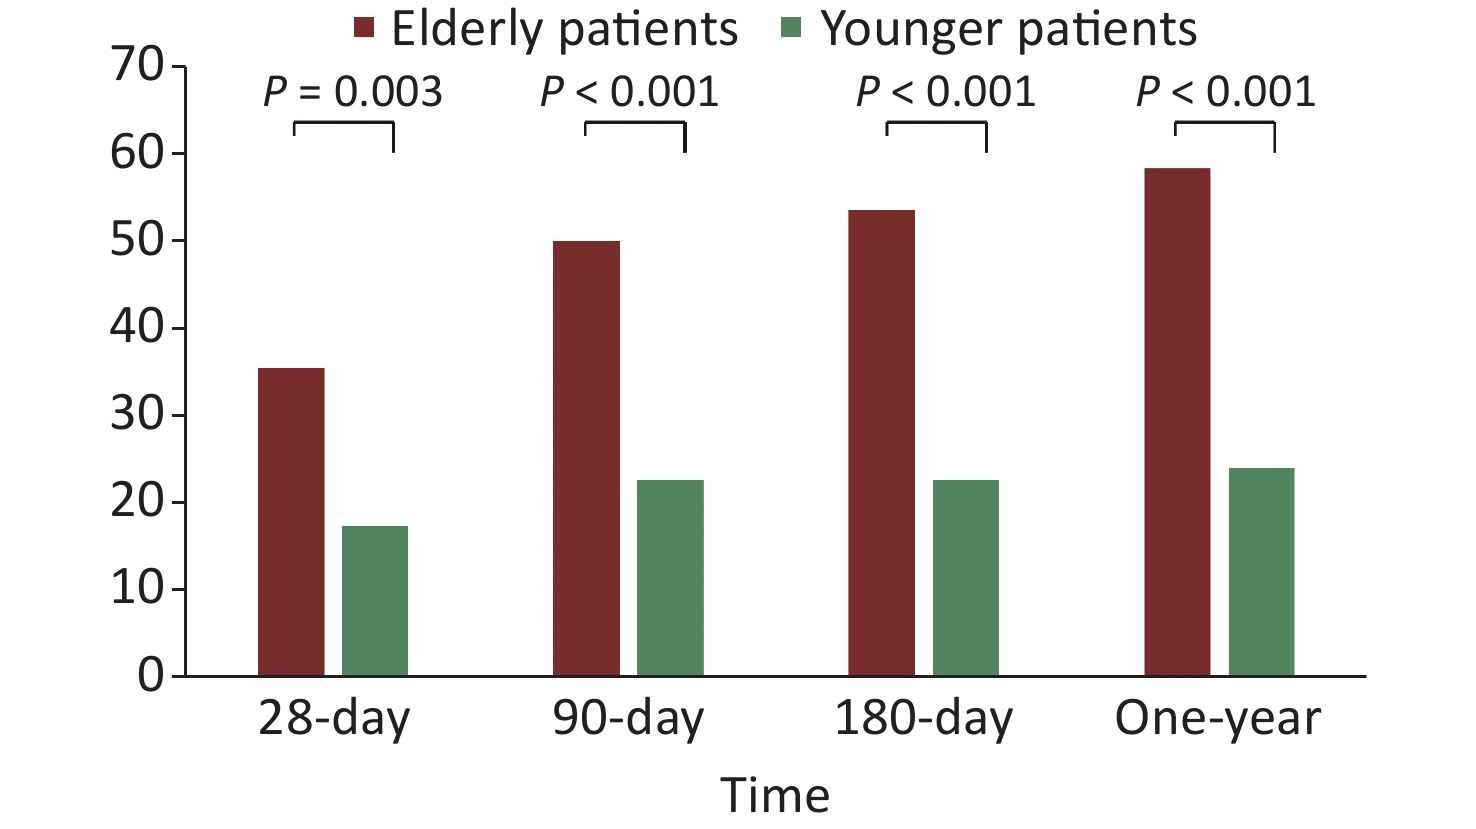
The 28-, 90-, and 180-day and 1-year mortality rates of the older patients (≥ 65 years) were all significantly higher than those of the younger patients (< 65 years) (35.5% vs. 17.3%, P = 0.003; 50.0% vs. 22.7%, P < 0.001; 53.5% vs. 22.7%, P < 0.001; and 58.3% vs. 24.0%, P < 0.001, respectively; Figure 4).
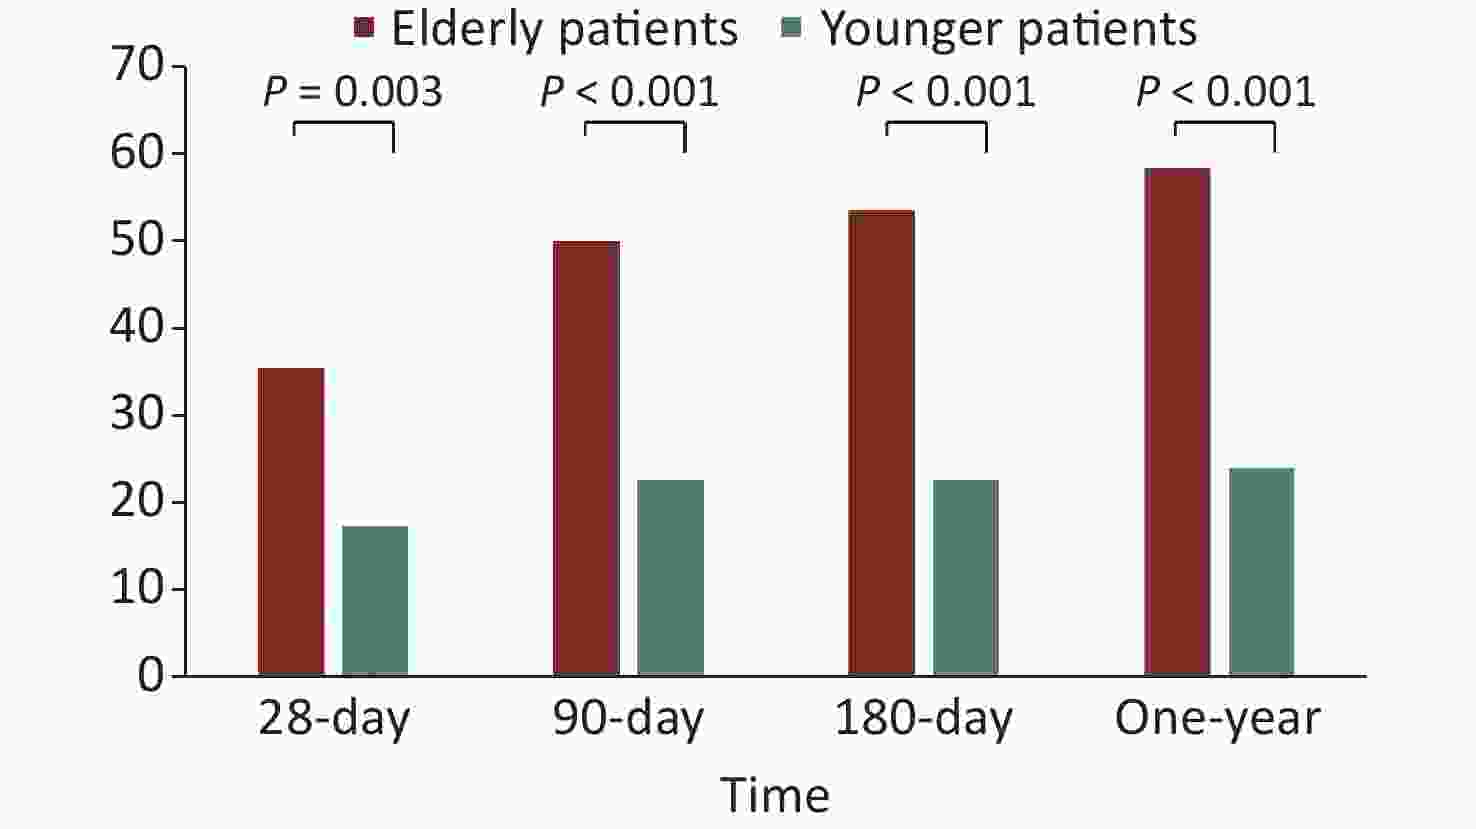
Figure 4. The short- and long-term mortality rates of older patients and younger patients with sepsis.
The ICU and hospital stay durations were 12.0 (7.0–21.0) and 15.0 (9.0–25.0) days, respectively (Table 4). In the survival group, the ICU and hospital stay durations increased with the severity of sepsis (Table 4). However, in the non-survival group, the trend was the opposite (Table 4) because a more severe disease resulted in premature deaths.
Characteristics Total Sepsis Pre-shock state Septic shock P-value All patients n = 303 n = 135 n = 93 n = 75 Duration of ICU stay (days) 12.0 (7.0–21.0) 12.0 (8.0–23.0) 13.0 (6.0–22.0) 10.0 (4.0–18.0) 0.030 Duration of hospital stay (days) 15.0 (9.0–25.0) 15.0 (10.0–27.0) 16.5 (10.0–26.0) 12.0 (5.0–21.0) 0.024 Survival patients n = 192 n = 101 n = 59 n = 32 Duration of ICU stay (days) 11.0 (8.0–20.0) 11.0 (7.0–18.0) 12.0 (7.0–21.0) 13.0 (8.0–24.5) 0.718 Duration of hospital stay (days) 16.0 (10.0–24.0) 14.0 (10.0–24.0) 17.5 (11.0–26.5) 17.5 (10.5–26.0) 0.476 Non-survival patients n = 111 n = 34 n = 34 n = 43 Duration of ICU stay (days) 12.0 (5.0–25.0) 18.5 (12.0–33.0) 14.0 (5.5–26.0) 7.0 (2.0–13.0) < 0.001 Duration of hospital stay (days) 13.0 (5.0–26.0) 19.5 (12.0–33.0) 14.0 (5.5–26.0) 9.0 (2.0–19.0) < 0.001 Note. Data are presented as medians (interquartile ranges). ICU, intensive care unit. Table 4. Durations of ICU and hospital stays
-
This retrospective cohort study focused on medical patients with sepsis admitted to the ICU. The results showed that the short- and long-term mortality rates were significantly higher in the pre-shock state group than in the sepsis group but significantly lower than in the septic shock group. Moreover, the mortality rates of older patients were significantly higher than that of younger patients. The results of this study supported the inclusion of the pre-shock state as a distinct entity of sepsis.
Sepsis has always been a serious clinical challenge in the ICU[14,15]. The in-hospital mortality rate of patients with sepsis was generally considered to be > 10%, whereas the in-hospital mortality of septic shock was > 40%. Wang et al.[15] conducted a multicenter prospective cohort study in China and found that the ICU mortality rate was 13.1% in patients with sepsis, 39.0% in patients with septic shock, and varied with geographical regions. Shah et al.[16] reported that the ICU mortality rate according to the source of sepsis was highest for ICU-acquired sepsis (23.7%), followed by hospital-acquired sepsis (18.6%) and community-acquired sepsis (12.9%). Interestingly, a previous meta-analysis showed that the prognosis of sepsis was even worse. The meta-analysis reported that more than 25%–30% of patients with sepsis died from the condition, with hospital mortality for septic shock approaching 40%–60%[1]. Bauer et al.[17] performed a systematic review and meta-analysis of 170 studies. The results showed that the average 30- and 90-day sepsis mortality rates were 24.4% and 32.2%, respectively, whereas the average 30- and 90-day septic shock mortality rates were 34.7% and 38.5%, respectively. Rates varied among regions, with 30-day sepsis mortality rates of 19.6% in North America, 23.6% in Europe, and 18.7% in Australia, whereas the 30-day septic shock mortality rates were 33.7% in North America, 32.5% in Europe, and 26.4% in Australia. Recently, Liu et al.[18] reported the mortality rates of sepsis and septic shock in China in a systematic review and meta-analysis of 29 studies. The pooled mortality rates of sepsis, severe sepsis, and septic shock were 29.0%, 31.1%, and 37.3%, respectively, which were much higher than those in North America, European countries, and Australia. In this study, the 28-day mortality rates of sepsis and septic shock were 31.0% and 53.3%, respectively. Our results were even higher, probably because 75.2% of patients were aged > 65 years, and 75.6% of patients had pulmonary sepsis.
Age is an important factor influencing sepsis prognosis. The incidence of sepsis is disproportionately increased in older adults (≥ 65 years). Age is also an independent predictor of mortality[19]. Age > 65 years is one of the factors associated with increased mortality (odds ratio: 1.82; 95% confidence interval: 1.80–1.84)[20]. Compared with younger patients with sepsis, older non-survivors of sepsis die earlier during hospitalization[19]. Moreover, age is independently associated with long-term mortality. Shankar–Hari et al.[21] observed the long-term mortality in adult sepsis survivors with a maximum follow-up period of 6 years. Sepsis survivors had a mean (standard deviation) age of 61.3 (17.0) years. However, 1 year after hospital discharge, 15% of sepsis survivors had died, with 6%–8% dying per year over the subsequent 5 years. In this study, the 28-, 90-, and 180-day and 1-year mortality rates were all significantly higher in older patients than in younger patients. These findings are consistent with previous studies. Furthermore, the long-term mortality of older patients was even higher.
Lower respiratory tract infection, the most common cause of medical sepsis, is associated with the highest mortality rate. In a national population-based study of sepsis in Spain, medical diagnostic categories comprised the majority of sepsis causes, whereas surgical diagnoses were identified in only 26% of cases[22]. Scheer et al.[23] found that the most common primary site of infection differed between those with medical versus surgical sepsis. The lung was the most common primary site (42.0%–56.7%) in medical patients, whereas the abdomen (48.4%–64.4%) was the most common in surgical patients. He et al.[24] analyzed 483 patients with sepsis. Of these, 272 (56.3%) had pulmonary sepsis, and 180 (37.3%) had abdominal sepsis. Pulmonary sepsis led to higher ICU (31.7% vs. 12.6%) and 1-year mortality (45.4% vs. 24.4%) rates than abdominal sepsis. Additionally, pulmonary infection was a risk factor for 1-year mortality and reduced quality of life after sepsis. Health insurance claims data of Taiwan, China from 2002 to 2012 were analyzed to determine the incidence and mortality trends among patients with emergency-treated and hospital-treated sepsis. Lower respiratory tract infection was found to be the most common source of sepsis in patients and was associated with the highest mortality rate[25].
The pre-shock state is a novel clinical sepsis state. Sepsis is a heterogeneous condition. Identification of distinct clinical phenotypes may facilitate more precise therapy and improve patient care. Liu et al.[8] studied the “pre-shock” state (defined as physiologically distinct from both the sepsis and septic shock states). The top three distinguishing features of the pre-shock state were: lactate, cardiovascular SOFA score, and GCS score. Serum lactate is commonly measured and significantly associated with the mortality of patients with sepsis[26-29]. It has superior discriminative power compared with quick SOFA scores and shows a discriminative ability similar to those of SOFA scores[30]. Based on the important predictive role of hyperlactacidemia, Sepsis-3 proposed a new definition of septic shock that excludes patients without hyperlactacidemia. However, Qu et al.[31] conducted a retrospective multicenter observational study in a Chinese cohort, which demonstrated that patients with hypotension but without hyperlactacidemia in the ICU also show high 28-day mortality. They included 1,194 patients in the study (282 with hypotension and hyperlactacidemia, 250 with hypotension but without hyperlactacidemia, 161 with hyperlactacidemia but without hypotension, and 501 without hypotension and hyperlactacidemia). The 28-day mortality rates of the four groups were 48.2%, 43.2%, 26.1%, and 24.8%, respectively. Age, APACHE II score, hyperlactacidemia, hypotension, intra-abdominal infection, and cancer increased the risk of 28-day mortality, whereas soft tissue infection and coming from the operating room were associated with a decreased mortality risk. Both hypotension and hyperlactacidemia were independent risk factors of mortality in patients with sepsis, even if the patients did not fulfill the diagnostic criteria of septic shock. Because hypotension and hyperlactacidemia are the two main characteristics of the pre-shock state, we defined the pre-shock state in this study as the reversal of hypotension after adequate fluid resuscitation or lactate levels > 2 mmol/L (18 mg/dL) without shock. The results of our study showed that the short- and long-term prognosis of the pre-shock state group were significantly different from those of the sepsis and septic shock groups. Our findings suggest that the pre-shock state is a potentially distinct sepsis sub-phenotype. Compared with patients with sepsis but without hypotension and hyperlactacidemia, mortality risks in the 28-, 90-, and 180-day and 1-year periods significantly increased for those in the pre-shock state and those with septic shock. Consequently, recognizing the pre-shock state may aid in the early identification of patients in severe conditions and expedite prompt treatment, including resuscitation and antimicrobial therapy. These measures are crucial for improving clinical outcomes.
-
Our study has several limitations. First, only medical patients with sepsis were included, and patients were excluded if they had sepsis that required surgical treatment or was caused by an infection related to a surgical procedure. Second, the study included 303 participants, and a large proportion of these patients were aged > 65 years and had pulmonary sepsis, which may have led to a sample-related bias. Third, it was a retrospective single-center study; further research is needed to determine the utility of the pre-shock state of sepsis in clinical care and to inform trial design and interpretation.
-
The short- and long-term mortality rates of patients in the pre-shock state were significantly different from those of patients with sepsis or septic shock. The findings of this study suggest that a modified sepsis severity classification that considered sepsis, pre-shock state, and septic shock may provide additional prognostic information.
Influence of the Pre-shock State on the Prognosis of Medical Patients with Sepsis: A Retrospective Cohort Study
doi: 10.3967/bes2023.150
Funds:
This work was funded by the Clinical Cohort Construction Program of Peking University Third Hospital [No. BYSYDL2021019] and the National Natural Science Foundation of China [Grant No. 82272197].
- Received Date: 2023-07-31
- Accepted Date: 2023-10-09
-
Key words:
- Critical care /
- Mortality /
- Pre-shock state /
- Sepsis /
- Septic shock
Abstract:
The authors have no competing interests to declare.
&These authors contributed equally to this work.
| Citation: | ZHANG Lei, GAI Xiao Yan, LI Xin, LIANG Ying, WANG Meng, ZHAO Fei Fan, ZHOU Qing Tao, SUN Yong Chang. Influence of the Pre-shock State on the Prognosis of Medical Patients with Sepsis: A Retrospective Cohort Study[J]. Biomedical and Environmental Sciences, 2023, 36(12): 1152-1161. doi: 10.3967/bes2023.150

|

 Quick Links
 DownLoad: