


-
Grip strength is considered a simple test for clinical and research assessment and has strong predictive power to identify people at risk[1]. It is also a commonly used and reliable marker of muscle strength[2], neuromotor function[3] and aging[4]. Decreased grip strength is associated with an increased risk of cardiovascular disease and all-cause mortality, cognitive decline and physical disability in older adults[5,6]. Therefore, identifying modifiable risk factors that can reduce grip strength loss is essential to advocating appropriate prevention strategies.
Energy intake or the lack of exercise does not fully explain the loss of grip strength, and environmental pollutants may also be associated with such condition[2]. The current research suggests that copper (Cu), arsenic (As), strontium (Sr), iron (Fe) and lead (Pb) are strongly associated with grip strength[2,3,7-9]. Cu is a heavy metal and an essential trace element; however, low and high Cu concentrations can cause oxidative stress through the induction of hydroxyl radicals and produce adverse health effects[10]. As is an element that causes numerous environmental and human health problems[8]. A recent cross-sectional study conducted in Wuhan, China showed a negative association between urinary metallic As and grip strength levels[8]. Plumbum (Pb) is a harmful environmental pollutant, and Pb disrupts the balance of oxidant-antioxidant system and induce inflammatory responses in various organs with highly toxic effects on many body organs[11]. A similar study by the US National Health and Nutrition Examination Survey (NHANES) reported that a low exposure to Pb at population levels was associated with a weak grip strength in women[3]. Oxidative stress may explain the reduced grip strength due to heavy metal exposure given that various heavy metals, including Cu, As and Pb, can promote oxidative stress[10-12]. The study revealed that heavy metals, including Cu, As and Pb, can also impair mitochondrial function and induce the formation of mitochondrial reactive oxygen species (ROS), which can lead to alterations in the electron transport chain and considerably induce oxidative degradation of biomolecules; as a result, cellular damage in muscle tissue occurs[2]. In addition, exposure to certain metals may cause neurotoxic effects[13]. These effects may lead to impairment of neuromotor function[3].
Most previous studies have focused on the association between individual metal elements or a few heavy metals and markers of aging[7,14,15]. A recent NHANES study indicated that exposure to metal mixtures was significantly associated with reduced muscle strength in children, with several heavy metals, including Co, Mo, Pb, Sb, Sr, Tl and Cs, associated with reduced grip strength in children[2]. The potential effect of these heavy metal mixtures on grip strength remains unclear. Therefore, this study provides additional insights into the early prevention of grip strength loss due to heavy metal exposure by examining the effects of exposure to a mixture of heavy metals, including metallic Cu, As, Sr, barium (Ba), Fe, Pb and manganese (Mn), on grip strength in Chinese adults.
-
A cross-sectional study was conducted from December 2018 to December 2019 in Gongcheng County, Guangxi, China, in which information was collected from 4,356 local residents. We further excluded the following participants: a) respondents with amputations, limb deformities, fractures, paralysis or casts or bandages on the arm, hand or fingers (including the thumb); b) patients who had hand or wrist surgery within the past 3 months or any pain, tingling, stiffness or discomfort in the hand or wrist within the previous 7 days; c) respondents with cirrhosis of the liver, renal failure, cancer or poststroke; d) subjects who did not complete the questionnaire or had missing data on covariates in the questionnaire; e) outliers for metal elements (defined as 3 times the 99th percentile) and outliers for grip strength levels (defined as the mean below grip strength level minus three standard deviations (3 SD) or mean above grip strength level plus 3 SD). Finally, 2,829 study subjects were included in our analysis.
The study was conducted in accordance with the guidelines of the Declaration of Helsinki, and all procedures involving human subjects were approved by the Ethics Committee. Written informed consent was provided by all participants.
-
Urine samples were sent to our laboratory through the cold chain and stored at −80 °C until analysis. Frozen urine samples were dissolved at room temperature by the gradient method and homogenized. An aliquot of urine (1.0 mL) was then transferred into a polypropylene tube containing 9.0 mL of 1% HNO3 and stored in a refrigerator at 4 °C for nitrification overnight. The concentrations of metals in urine were determined using inductively coupled plasma-mass spectrometry (ICP-MS; NexION 350, PerkinElmer, USA) in the morning of the next day. The external standard method was used to detect the content of metal ele-ments in urine, and the calibrated standard curve was used to obtain the concentration of target metal elements in the measured urine. To control the quality of the urine metal content determination, we evaluated the precision and accuracy of the method by three replicate determinations and standard recoveries (100 randomly selected samples). The standard recoveries were controlled in the range of 80%–120%. For ICP-MS accuracy, a parallel sample was placed after every 15 samples (urine samples from the normal population were diluted at the same multiple), and urine controls for trace elements were measured after every 30 samples (levels 1 and 2). If the metal concentration was below the limit of detection (LOD), the measurement below the LOD level was replaced by LOD/2[16]. Table 1 shows the LODs for each element. The number of plasma metal elements below the LOD was less than 20% for all elements.
Metal
(μg/g creatinine)Range of values
(μg/g creatinine)LOD < LOD
(%)Cu 2.357–409.448 0.0061 0.00 As 1.214–791.672 0.0117 0.00 Sr 2.148–1733.782 0.0062 0.00 Ba 0.002–181.836 0.0038 0.29 Fe 0.162–2505.057 0.1263 0.00 Pb 0.000–28.195 0.0009 0.71 Mn 0.002–2021.789 0.0037 3.64 Note. Cu, copper; As, arsenic; Sr, strontium; Ba, barium; Fe, iron; Pb, lead; Mn, manganese; LOD, limit of detection. Table 1. Limits of metal detection in urine
Urinary metals were corrected using the creatinine correction method. Urinary creatinine levels were measured using a creatinine assay kit (sarcosine oxidase method, Nanjing Chengjian Institute of Biological Engineering) in accordance with the manufacturer’s instructions. Three parallel samples were set up for each sample with a relative standard deviation of less than 5%. The final concentrations of metals in the urine were expressed as µg/g creatinine.
-
Grip strength (kg) was assessed using a grip strength dynamometer (Model T.K.K. 5401, Takei Scientific Instruments Co., Niigata, Japan). Prior to the measurement of grip strength, the dynamometer was adjusted to fit the subject’s hand size until the second joint of the index finger was at a 90° angle to the handle. The participant was asked to squeeze the dynamometer as hard as possible with one hand. Each hand was tested thrice, with alternation between the two tests while testing the same hand with a 60 s rest period. Grip strength was defined as the maximum measured grip strength of the dominant hand[17].
-
In face-to-face interviews, standardised and structured questionnaires were used to obtain information on age, gender (male and female), education level (illiterate, primary school and below and junior secondary school and above), smoking (smoking and nonsmoking), alcohol consumption (drinking or nondrinking) and ethnicity (Yao and other ethnic groups). A full body health check was also carried out. Body mass index (BMI) was calculated as weight divided by height squared (kg/m2); diabetes mellitus was defined as fasting blood glucose greater than 7.0 mmol/L, glycated haemoglobin level greater than 6.5% or taking glucose-lowering medication.
-
Urine metal detection values were log10 transformed[18] to attain the approximately normal distribution of data for subsequent analysis. Normally distributed quantitative data were described by means and standard deviations, and comparisons between groups were conducted using the independent t-test. Data with non-normal distribution were described by medians and interquartile spacing, and comparisons between groups were conducted using the Wilcoxon or Kruskal‒Wallis rank sum tests. Categorical variables were expressed as percentages (%), and comparisons were performed using chi-square test. Linear regression models were used to assess the relationship between various metal elements and grip strength levels. Adjusted factors included smoking, alcohol consumption, age, sex, education, ethnicity, diabetes and BMI. The confounders selected and adjusted for in the model were those reported in previous studies and professionally considered to be strongly associated with grip strength levels[17-19].
-
Linear regression models were built to explore association between single metal exposure and grip strength among adults. Metals were both fitted as log10 transformed continuous variable and to calculate odds ratios and corresponding 95% confidence intervals (CI). Model was adjusted for smoke, alcohol consumption, age, sex, education, ethnicity, diabetes mellitus and BMI.
-
In addition, given the nonlinear and joint effects of the relationship between multimetal exposure and grip strength, we assessed the effect of the joint effect of multimetal mixtures on grip strength using Quantile g-computation, a statistical method based on a parametric, generalised linear model[20] that treats all metals as a mixture and explores the effect of each additional quartile of all metals on grip strength levels. Qgcomp, a novel statistical strategy, was implemented to explore the overall effect of heavy metals on grip strength and corresponding weights for each heavy metal. Qgcomp was used to estimate the change on grip strength for a simultaneous one quantile increase in the seven urinary heavy metals.
-
Subsequently, Bayesian kernel function regression (BKMR) models were used to assess the overall association between metal coexposure and grip strength levels, to address potential nonline-arity and non-additivity. This study considered the possible interactions between the seven metals and nonlinear dose response and grip strength levels. Given the relatively high correlation between the metals, a hierarchical variable selection method with 20,000 iterations was implemented a Markov chain Monte Carlo algorithm[21]. We proposed posteriori inclusion probabilities, which were calculated by the BKMR model, for each metal to identify the most important metals in the mixture. The effect of metals varying between the 25th and 75th percentiles on grip strength levels when other metals in the mixture were fixed at the 25th, 50th and 75th percentiles further showed the exposure-response curves for specific metals and the potential interactions between metals[18]. The covariates adjusted for in the BKMR model were the same as those used in the multimetal linear regression analysis. All data were statistically analysed using the ‘qgcomp’ and ‘bkmr’ packages of R 4.2.2 software (the R Foundation for Statistical Computing). P values were tested using a two-tailed test at 0.05.
-
Table 2 shows the demographic characteristics of the study population. A total of 2,829 subjects (males, 37.40%; females, 62.60%) were included in this study. The mean grip strength level of the total population was 23.10 kg, with males having a significantly higher mean grip strength level than females.
Characteristics Total (N = 2,829) Men (N = 1,058 ) Women (N = 1,771 ) P value* Age, years < 0.001 30–59 1,473 (52.07) 473 (44.71) 1,000 (56.47) ≥ 60 1,356 (47.93) 585 (55.29) 771 (43.53) Smoking < 0.001 No 2,316 (81.87) 555 (52.46) 1,761 (99.43) Yes 513 (18.13) 503 (47.54) 10 (0.56) Drinking < 0.001 No 1,958 (69.21) 505 (47.73) 1,453 (82.04) Yes 871 (30.79) 553 (52.27) 318 (17.96) Ethnicity 0.003 Yao 2,112 (74.66) 823 (77.79) 1,289 (72.78) Other 717 (25.34) 235 (22.21) 482 (27.22) Education < 0.001 Illiterate 392 (13.86) 76 (7.18) 316 (17.84) Primary school 1,379 (48.75) 461 (43.57) 918 (51.84) Junior high school and above 1,058 (37.40) 521 (49.24) 537 (30.32) BMI (kg/m2) 0.360 ≤ 23.9 1,902 (67.23) 695 (65.69) 1,207 (68.15) 24.0–27.9 740 (26.16) 287 (27.13) 453 (25.58) ≥ 28.0 187 (6.61) 76 (7.18) 111 (6.27) Diabetes mellitus < 0.001 No 2,517 (88.97) 907 (85.73) 1,610 (90.91) Yes 312 (11.03) 151 (14.27) 161 (9.09) Handg rip Strength, kg 23.10 (18.00–29.05) 29.50 (23.08–36.80) 20.4 (16.40–24.70) < 0.001 Note. P values was performed between Men and Women; *P < 0.05; adjusted for smoke, alcohol consumption, age, sex, education, ethnicity, diabetes mellitus and BMI. BMI, Body mass index. Table 2. The characteristics of the study population, n (%)
-
Table 3 shows the distribution of urinary metal elements in people with different characteristics. The distribution of all metals was greater in females than in males. Urinary concentrations of Cu, As, Fe, Pb and Mn were significantly higher in older adults than in participants aged 30–59 years. The Sr and Ba concentrations were significantly lower in older adults than in participants aged 30–59 years.
Characteristics Cu (μg/g creatinine)a As (μg/g creatinine)a Sr (μg/g creatinine)a Ba (μg/g creatinine)a Fe (μg/g creatinine)a Pb (μg/g creatinine)a Mn (μg/g creatinine)a Total (n = 2,829) 19.97
(14.38–27.81)41.44
(30.98–56.19)113.38
(70.06–173.05)1.31
(0.69–2.44)55.88
(36.20–85.15)0.38
(0.25–0.59)0.62
(0.25–1.42)Sex Men (n = 1,058) 18.83
(13.43–25.55)38.10
(28.35–51.37)95.38
(55.01–149.92)0.98
(0.54–1.89)50.27
(31.68–74.9)0.35
(0.22–0.53)0.41
(0.17–0.88)Women (n = 1,771) 20.54
(14.84–29.23)43.91
(32.57–59.35)124.03
(79.00–188.59)1.55
(0.82–2.82)60.93
(39.63–90.9)0.40
(0.27–0.61)0.78
(0.34–1.77)P-value* < 0.001 < 0.001 < 0.001 < 0.001 < 0.001 < 0.001 < 0.001 Age (years) 30–59 (n = 1,473) 18.72
(13.44–25.56)37.97
(29.07–51.28)120.91
(74.49–186.24)1.38
(0.74–2.77)52.29
(32.92–78.7)0.36
(0.24–0.56)0.46
(0.20–1.00)≥ 60 (n = 1,356) 21.44
(15.55–30.25)46.19
(33.91–61.38)105.99
(65.58–158.85)1.21
(0.64–2.20)61.64
(40.81–91.4)0.41
(0.27–0.62)0.84
(0.36–1.87)P-value* < 0.001 < 0.001 < 0.001 < 0.001 < 0.001 < 0.001 < 0.001 Note. aThe log10 transformation of metal concentration was not performed. *P < 0.05; adjusted for smoke, alcohol consumption, age, sex, education, ethnicity, diabetes mellitus and BMI. BMI, Body mass index; Cu, copper; As, arsenic; Sr, strontium; Ba, barium; Fe, iron; Pb, lead; Mn, manganese. Table 3. Concentrations of Cu, As, Sr, Ba, Fe, Pb and Mn in urinary metals samples of different population characteristics
-
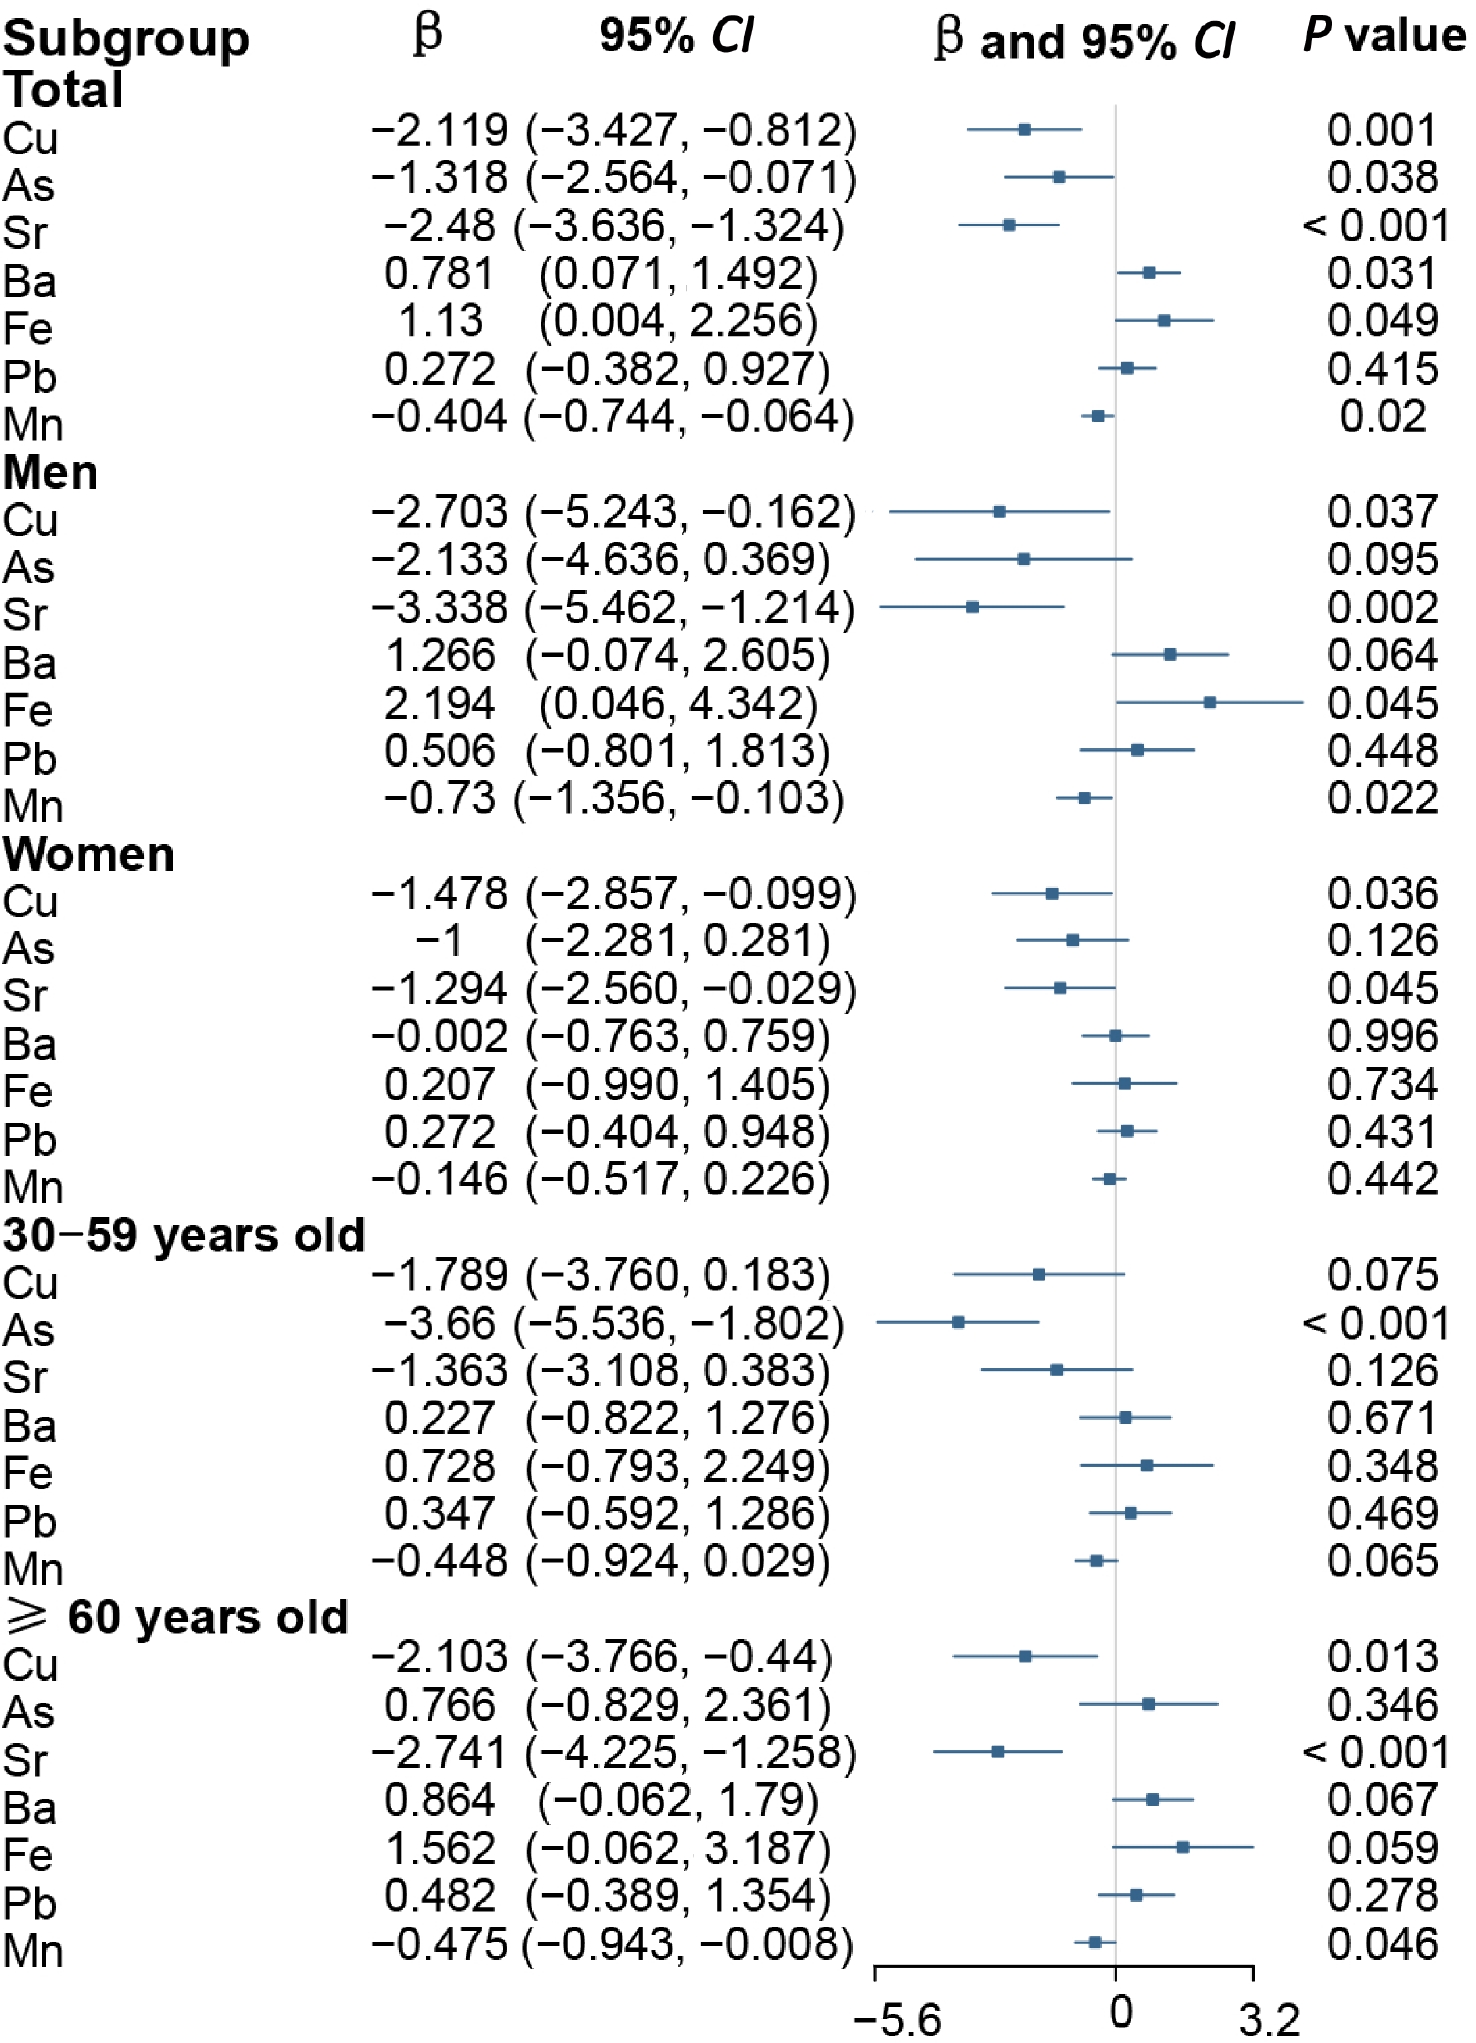
Figure 1 shows the results of the linear regression analysis. Seven urinary metal elements and correction factors were included in the linear regression model. Fe was positively associated with the grip strength levels of participants in the total population (β = 1.13) and in males (β = 2.194) (all P < 0.05). In the total population (β = 0.781) participants, Ba was positively associated with grip strength level (all P < 0.05). Cu was negatively associated with grip strength in the total population (β = −2.119), in males (β = −2.703), in females (β = −1.478) and in participants aged ≥ 60 years (β = −2.103) (all P < 0.05). As was negatively associated with grip strength in the total population (β = −1.318) and in participants aged 30–59 years (β = −3.669) (all P < 0.05). Sr was negatively associated with grip strength in the total population (β = −2.480), males (β = −3.338), females (β = −1.294) and participants aged ≥ 60 years (β = −2.741) (all P < 0.05). Mn was negatively associated with grip strength in the total population (β = −0.404), males (β = −0.73) and participants aged ≥ 60 years (β = −0.475) (all P < 0.05).
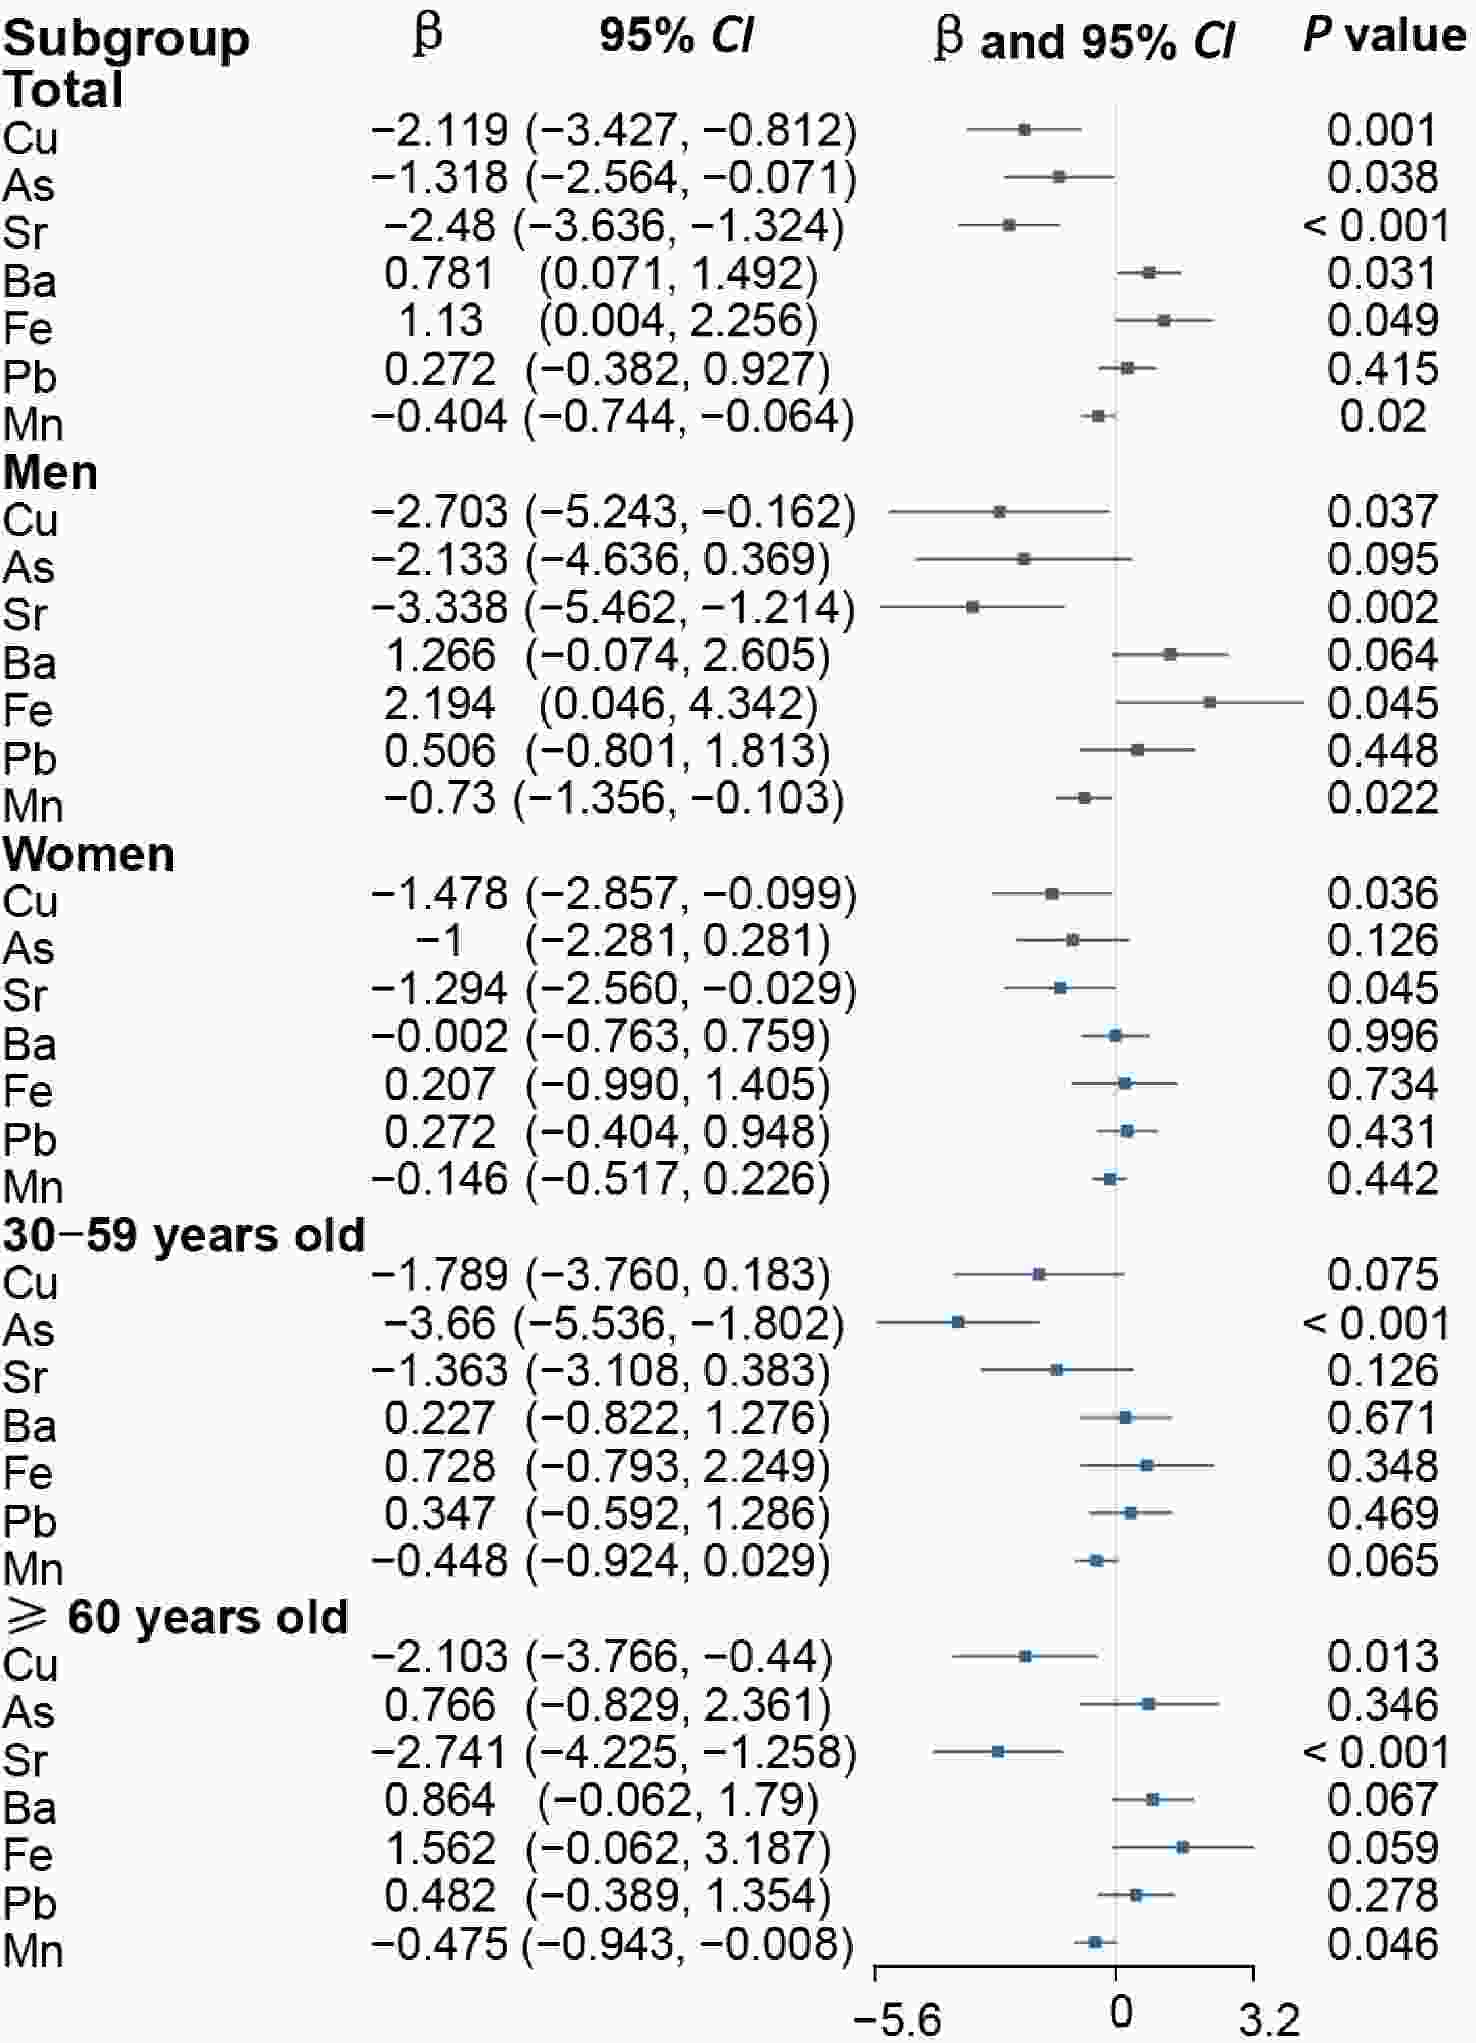
Figure 1. Association of Cu, As, Sr, Ba, Fe, Pb and Mn with handgrip strength: estimated change from multivariate linear regression using ordinary least squares. Model adjusted for smoke, alcohol consumption, age, sex, education, ethnicity, diabetes mellitus and BMI. BMI, Body mass index; Cu, copper; As, arsenic; Sr, strontium; Ba, barium; Fe, iron; Pb, lead; Mn, manganese.
-
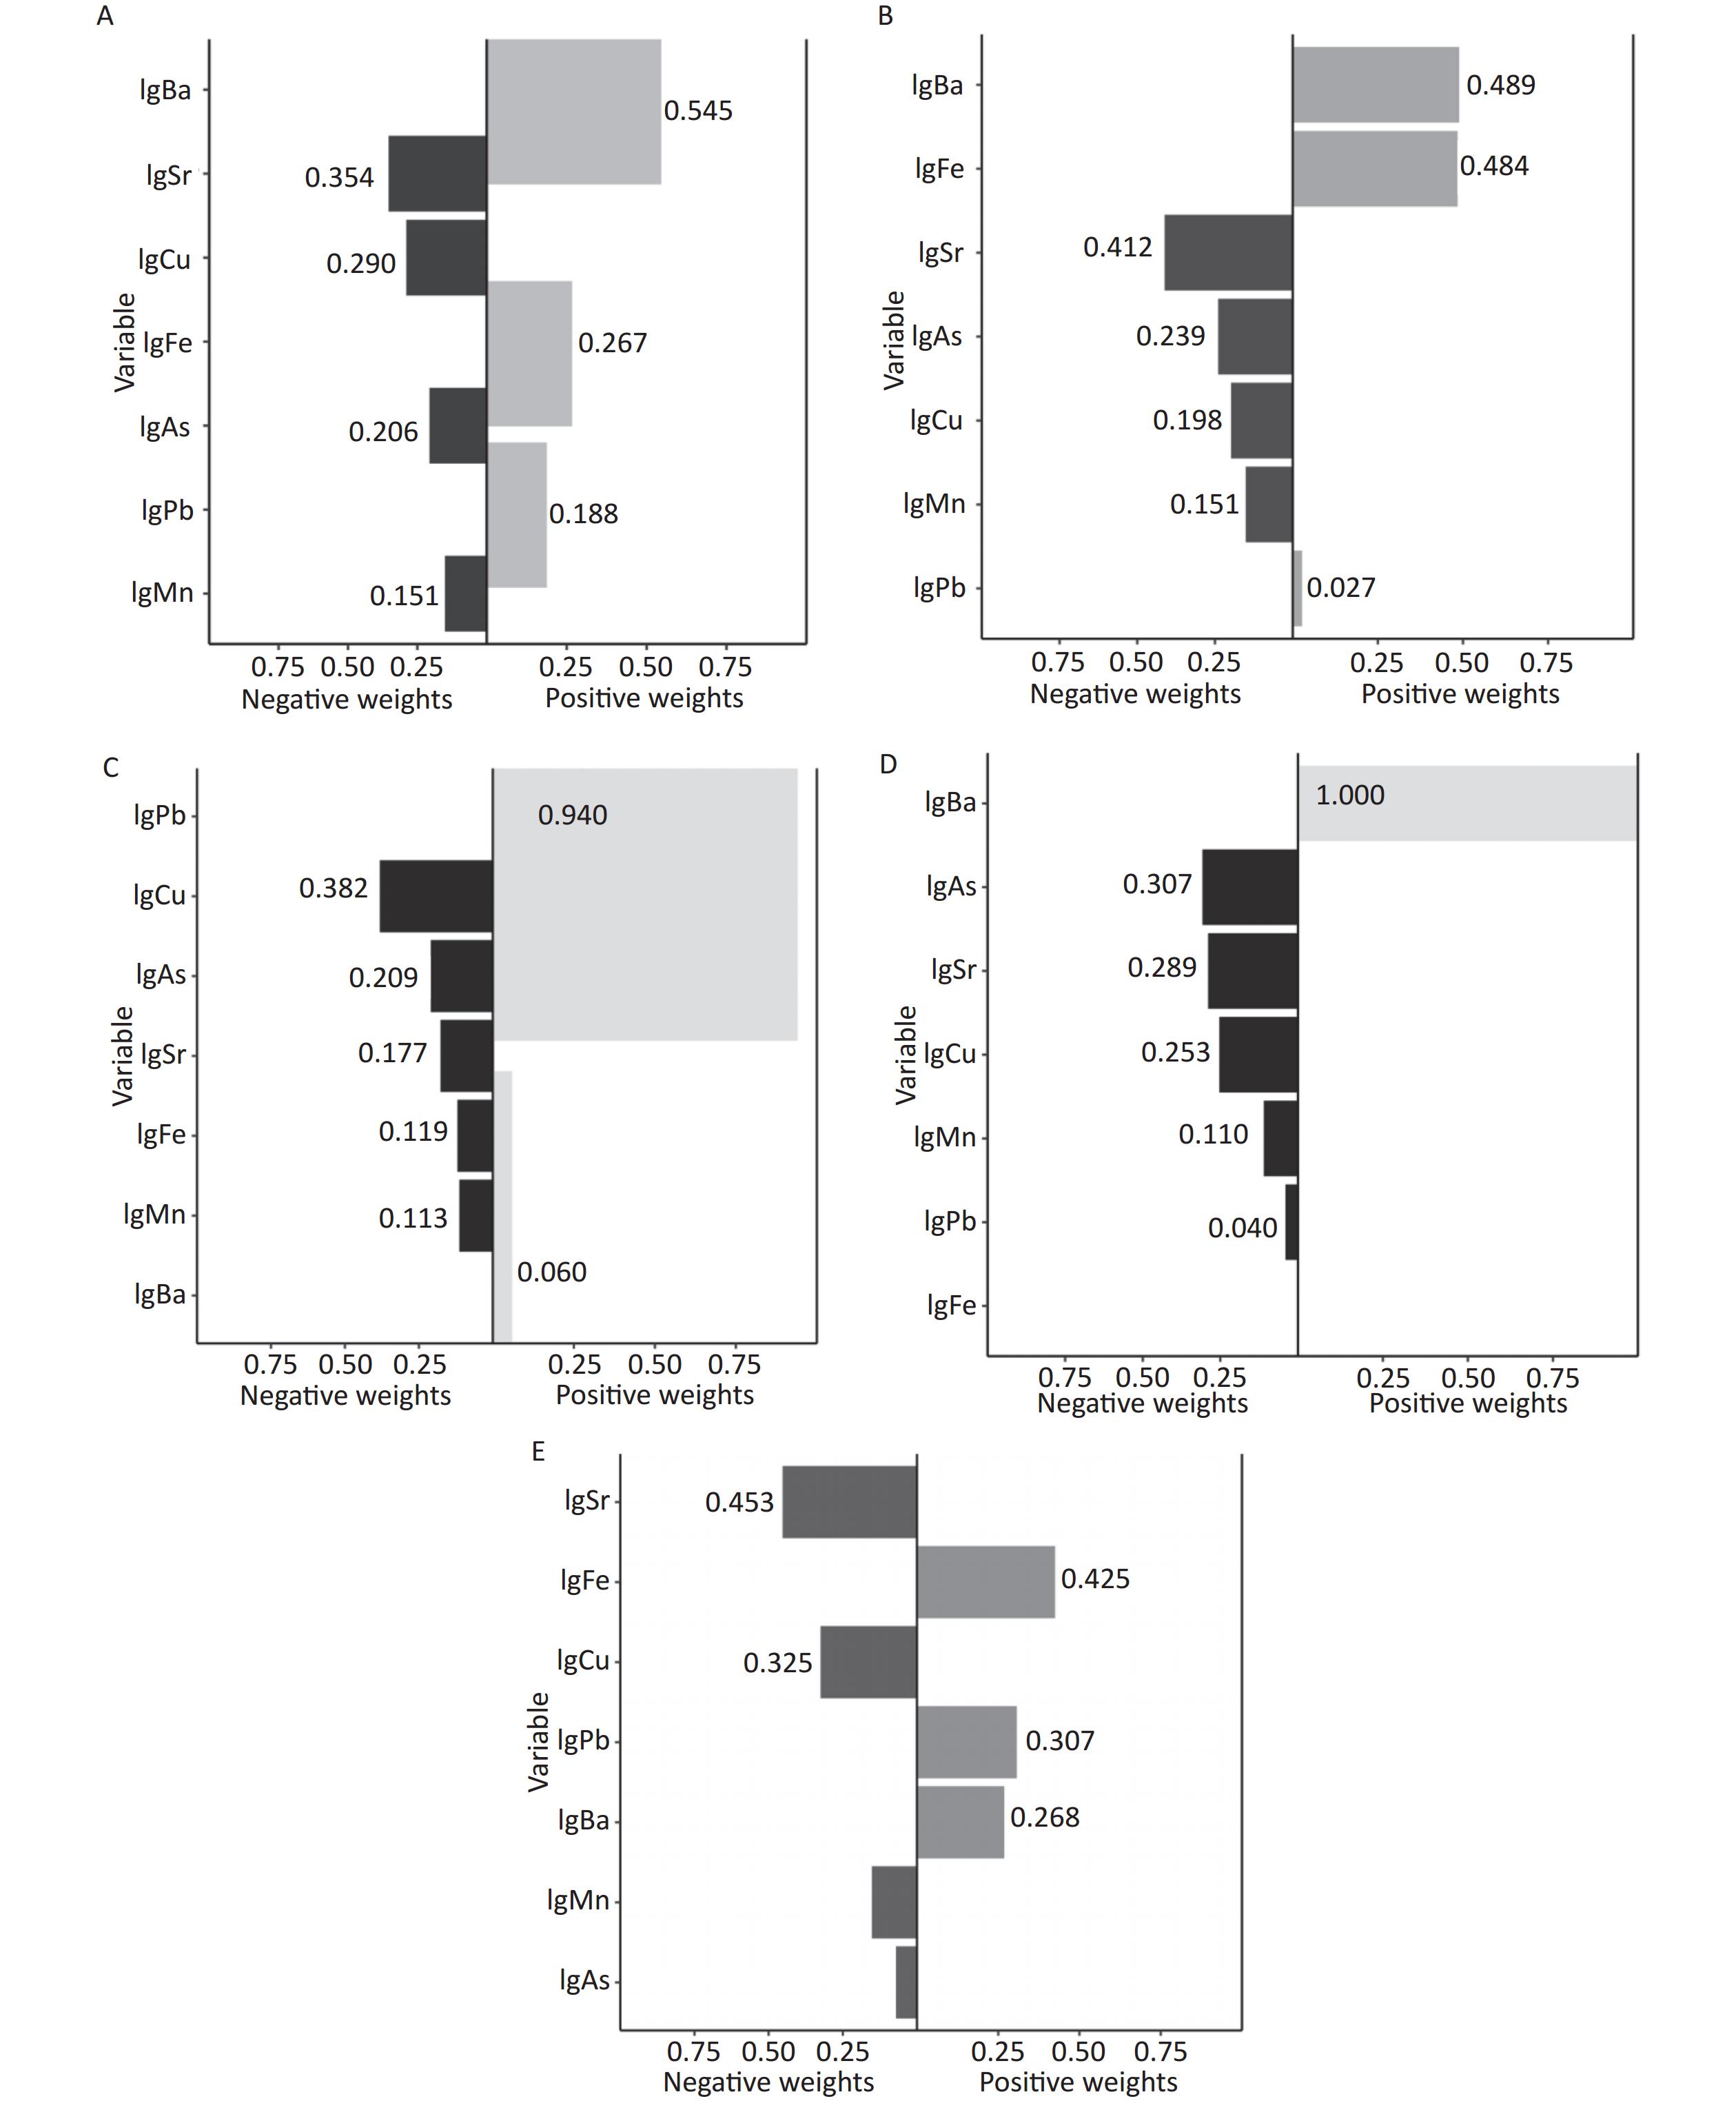
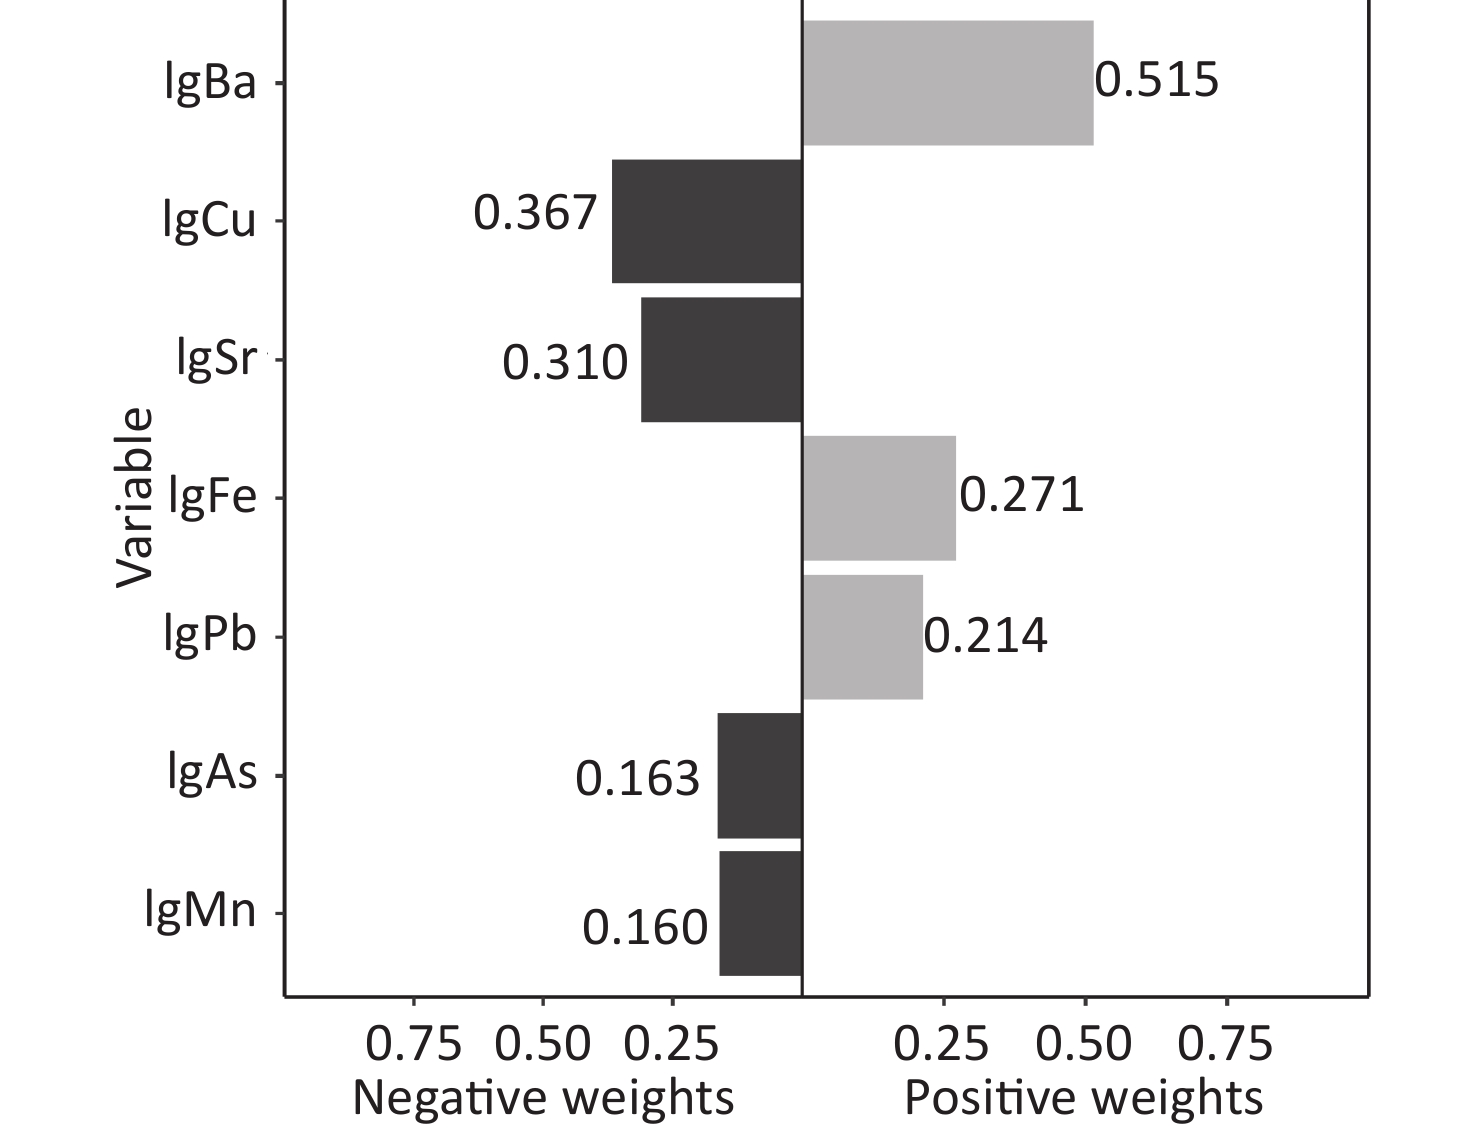
Table 4 shows the results of quantile g-computation analysis. We used quantile g-computation to explore the relationship between the exposure to the metal mixture and handgrip strength. The results are shown for the total population, males, females and participants aged 30–59 years. For each additional quartile of a mixture of seven metals, the risks of grip strength reduction were −1.007 [95% confidence interval (CI): −1.362, −0.652], −1.218 (95% CI: −1.936, −0.501), −0.856 (95% CI: −1.210, −0.503) and −1.497 (95% CI: −2.002, −0.991), P < 0.05, with Sr and Cu having the greatest weight in the negative association with grip strength and Ba and Fe having the greatest weight in the positive association with grip strength (Figure 2).
Characteristics n β 95% CI P-value* Total 2,829 −1.007 −1.362, −0.652 < 0.001 Sex Men 1,058 −1.218 −1.936, −0.501 < 0.001 Women 1,771 −0.856 −1.210, −0.503 < 0.001 Age (years) 30–59 1,473 −1.497 −2.002, −0.991 < 0.001 ≥ 60 1,356 −0.355 −0.820, 0.109 0.134 Note. *P < 0.05; adjusted for smoke, alcohol consumption, age, sex, education, ethnicity, diabetes mellitus and BMI. Table 4. Quantile g-computation evaluates the association of metal mixture exposure with handgrip strength
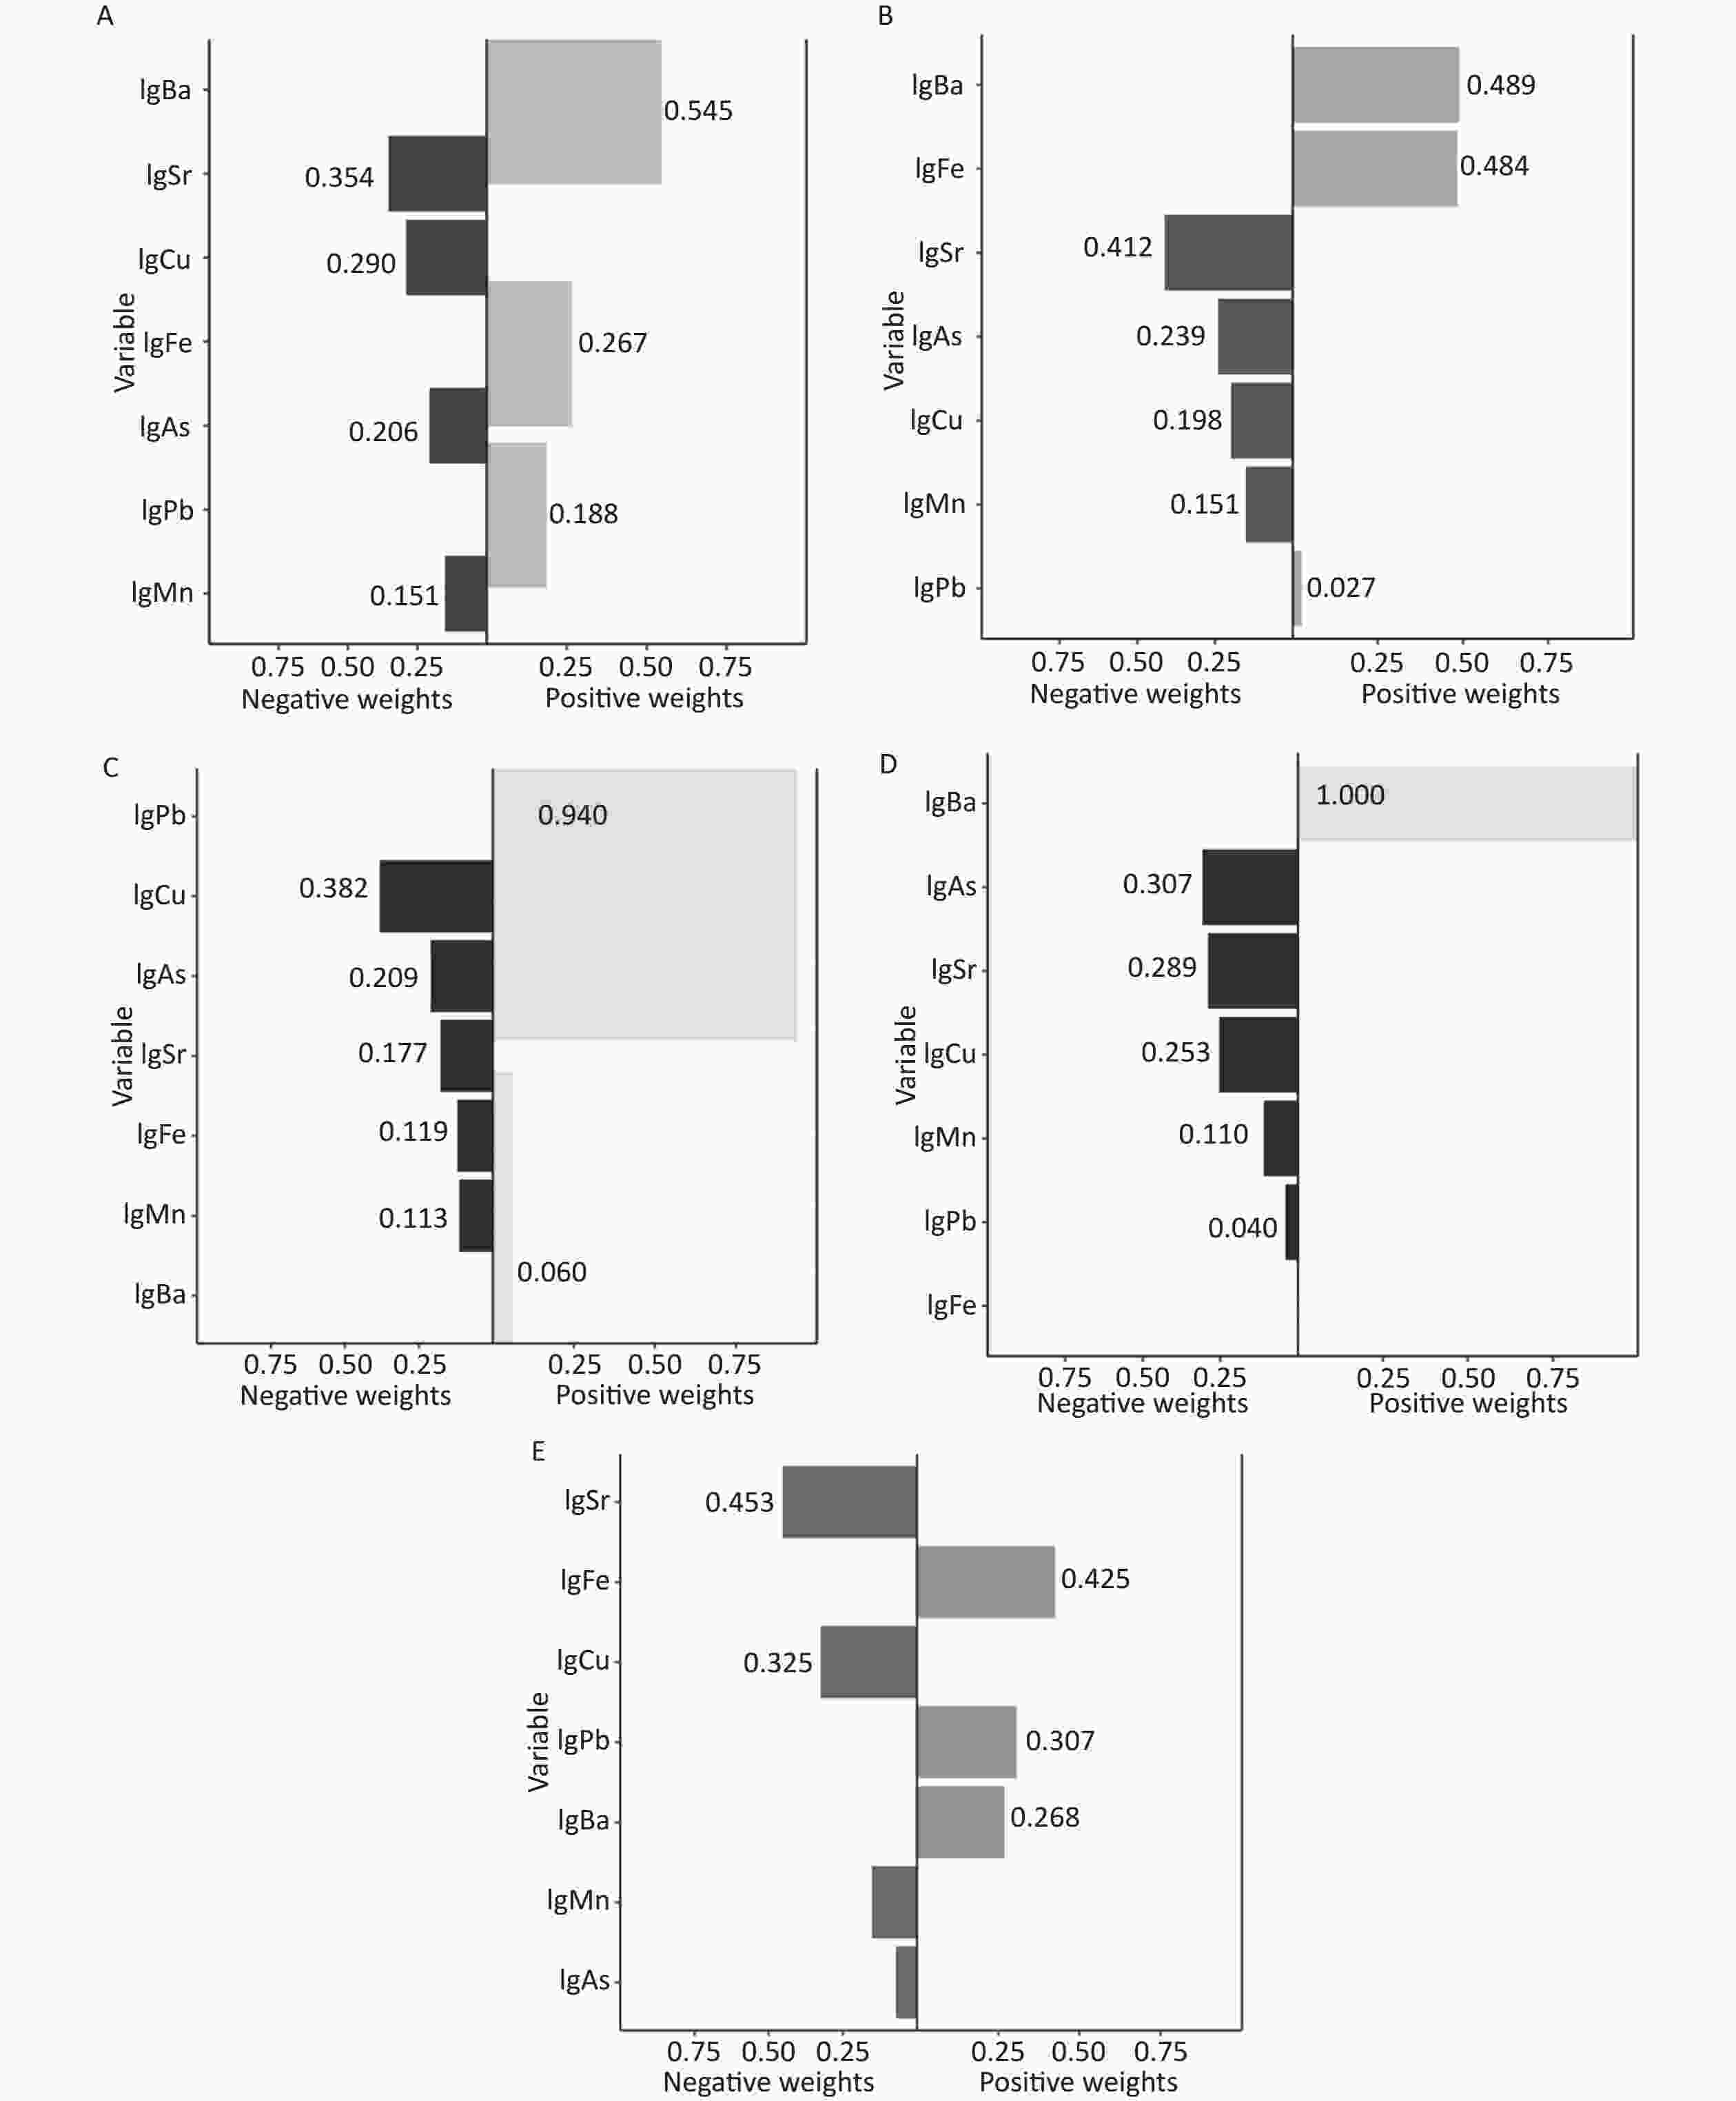
Figure 2. Weight ratio of each metal in the positive-negative association in the Quantile g-computation. (A) Total; (B) Men; (C) Women; (D) 30–59 years old; (E) ≥ 60 years old. Exposures have been log10-transformed and models have been adjusted for smoke, alcohol consumption, age, sex, education, ethnicity, diabetes mellitus and BMI. BMI, Body mass index; Cu, copper; As, arsenic; Sr, strontium; Ba, barium; Fe, iron; Pb, lead; Mn, manganese.
-
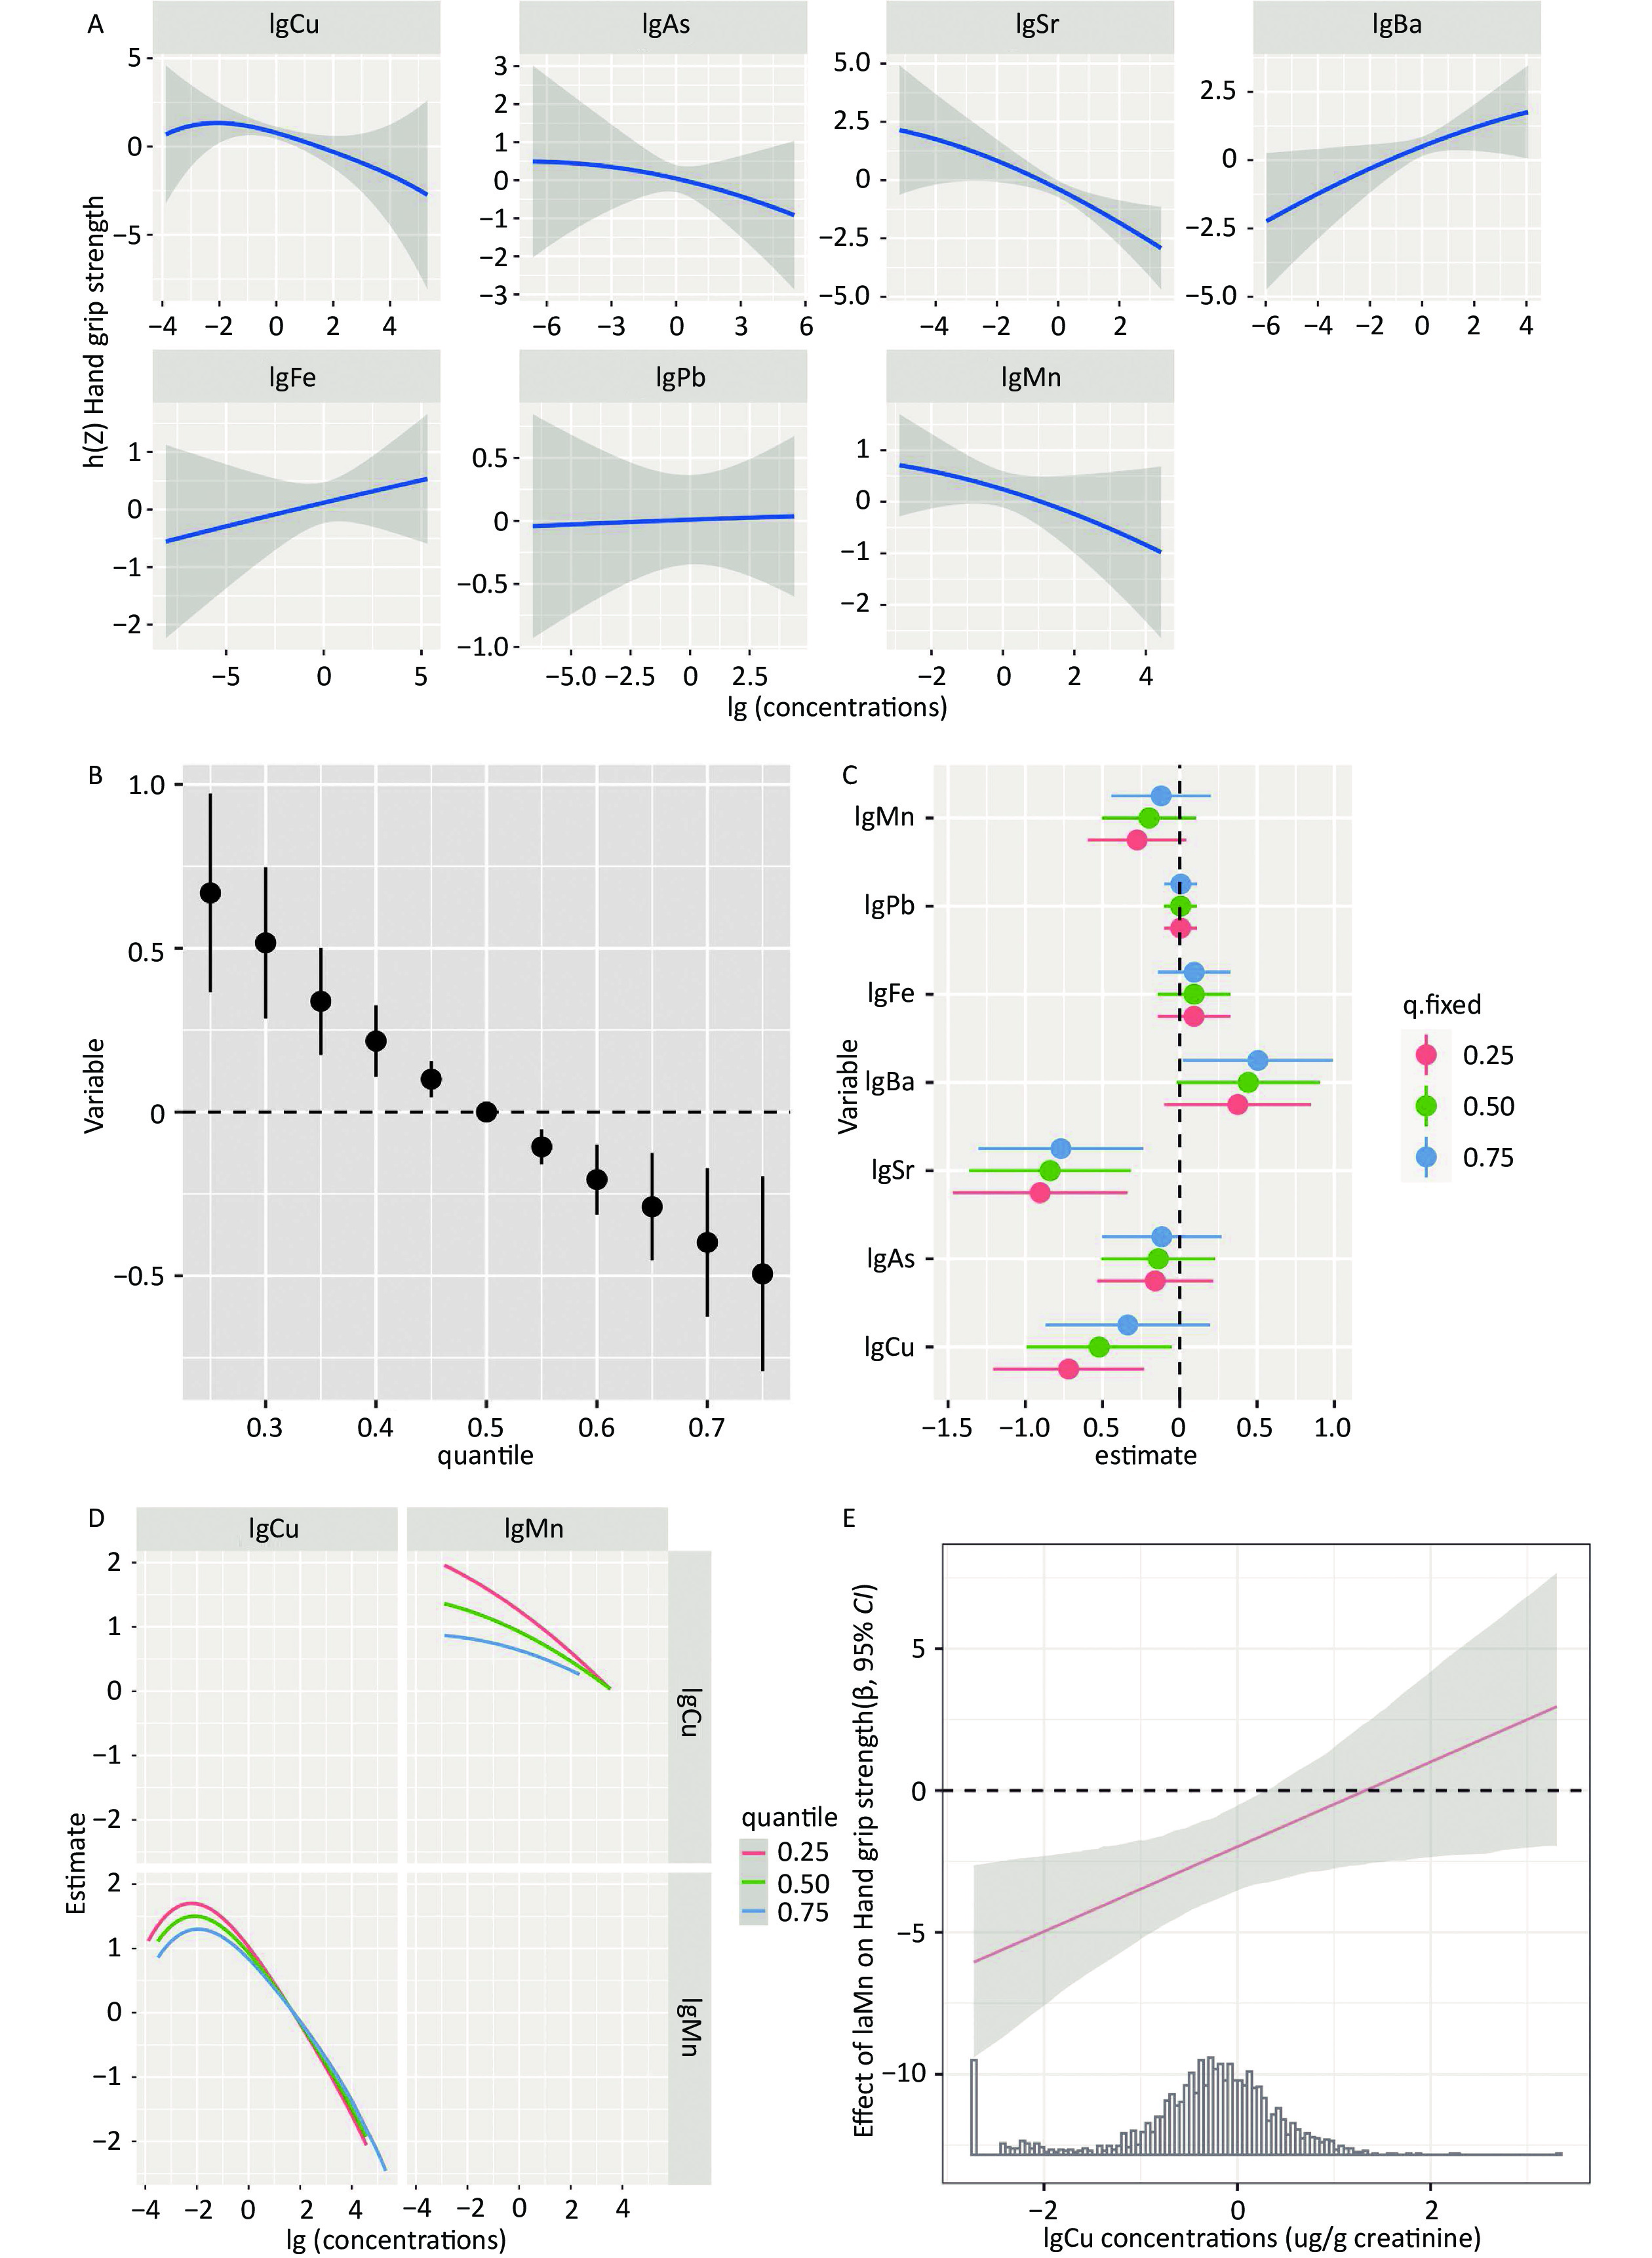
BKMR was used to investigate the potential nonlinear exposure–response relationships between specific metals and grip levels when other metals were kept at moderate concentrations. The results indicate that single-metal exposure–response relationships are generally consistent with the findings of multimetal linear regression models. In the total population, Cu and As may have a nonlinear relationship with grip strength levels (Figure 3).
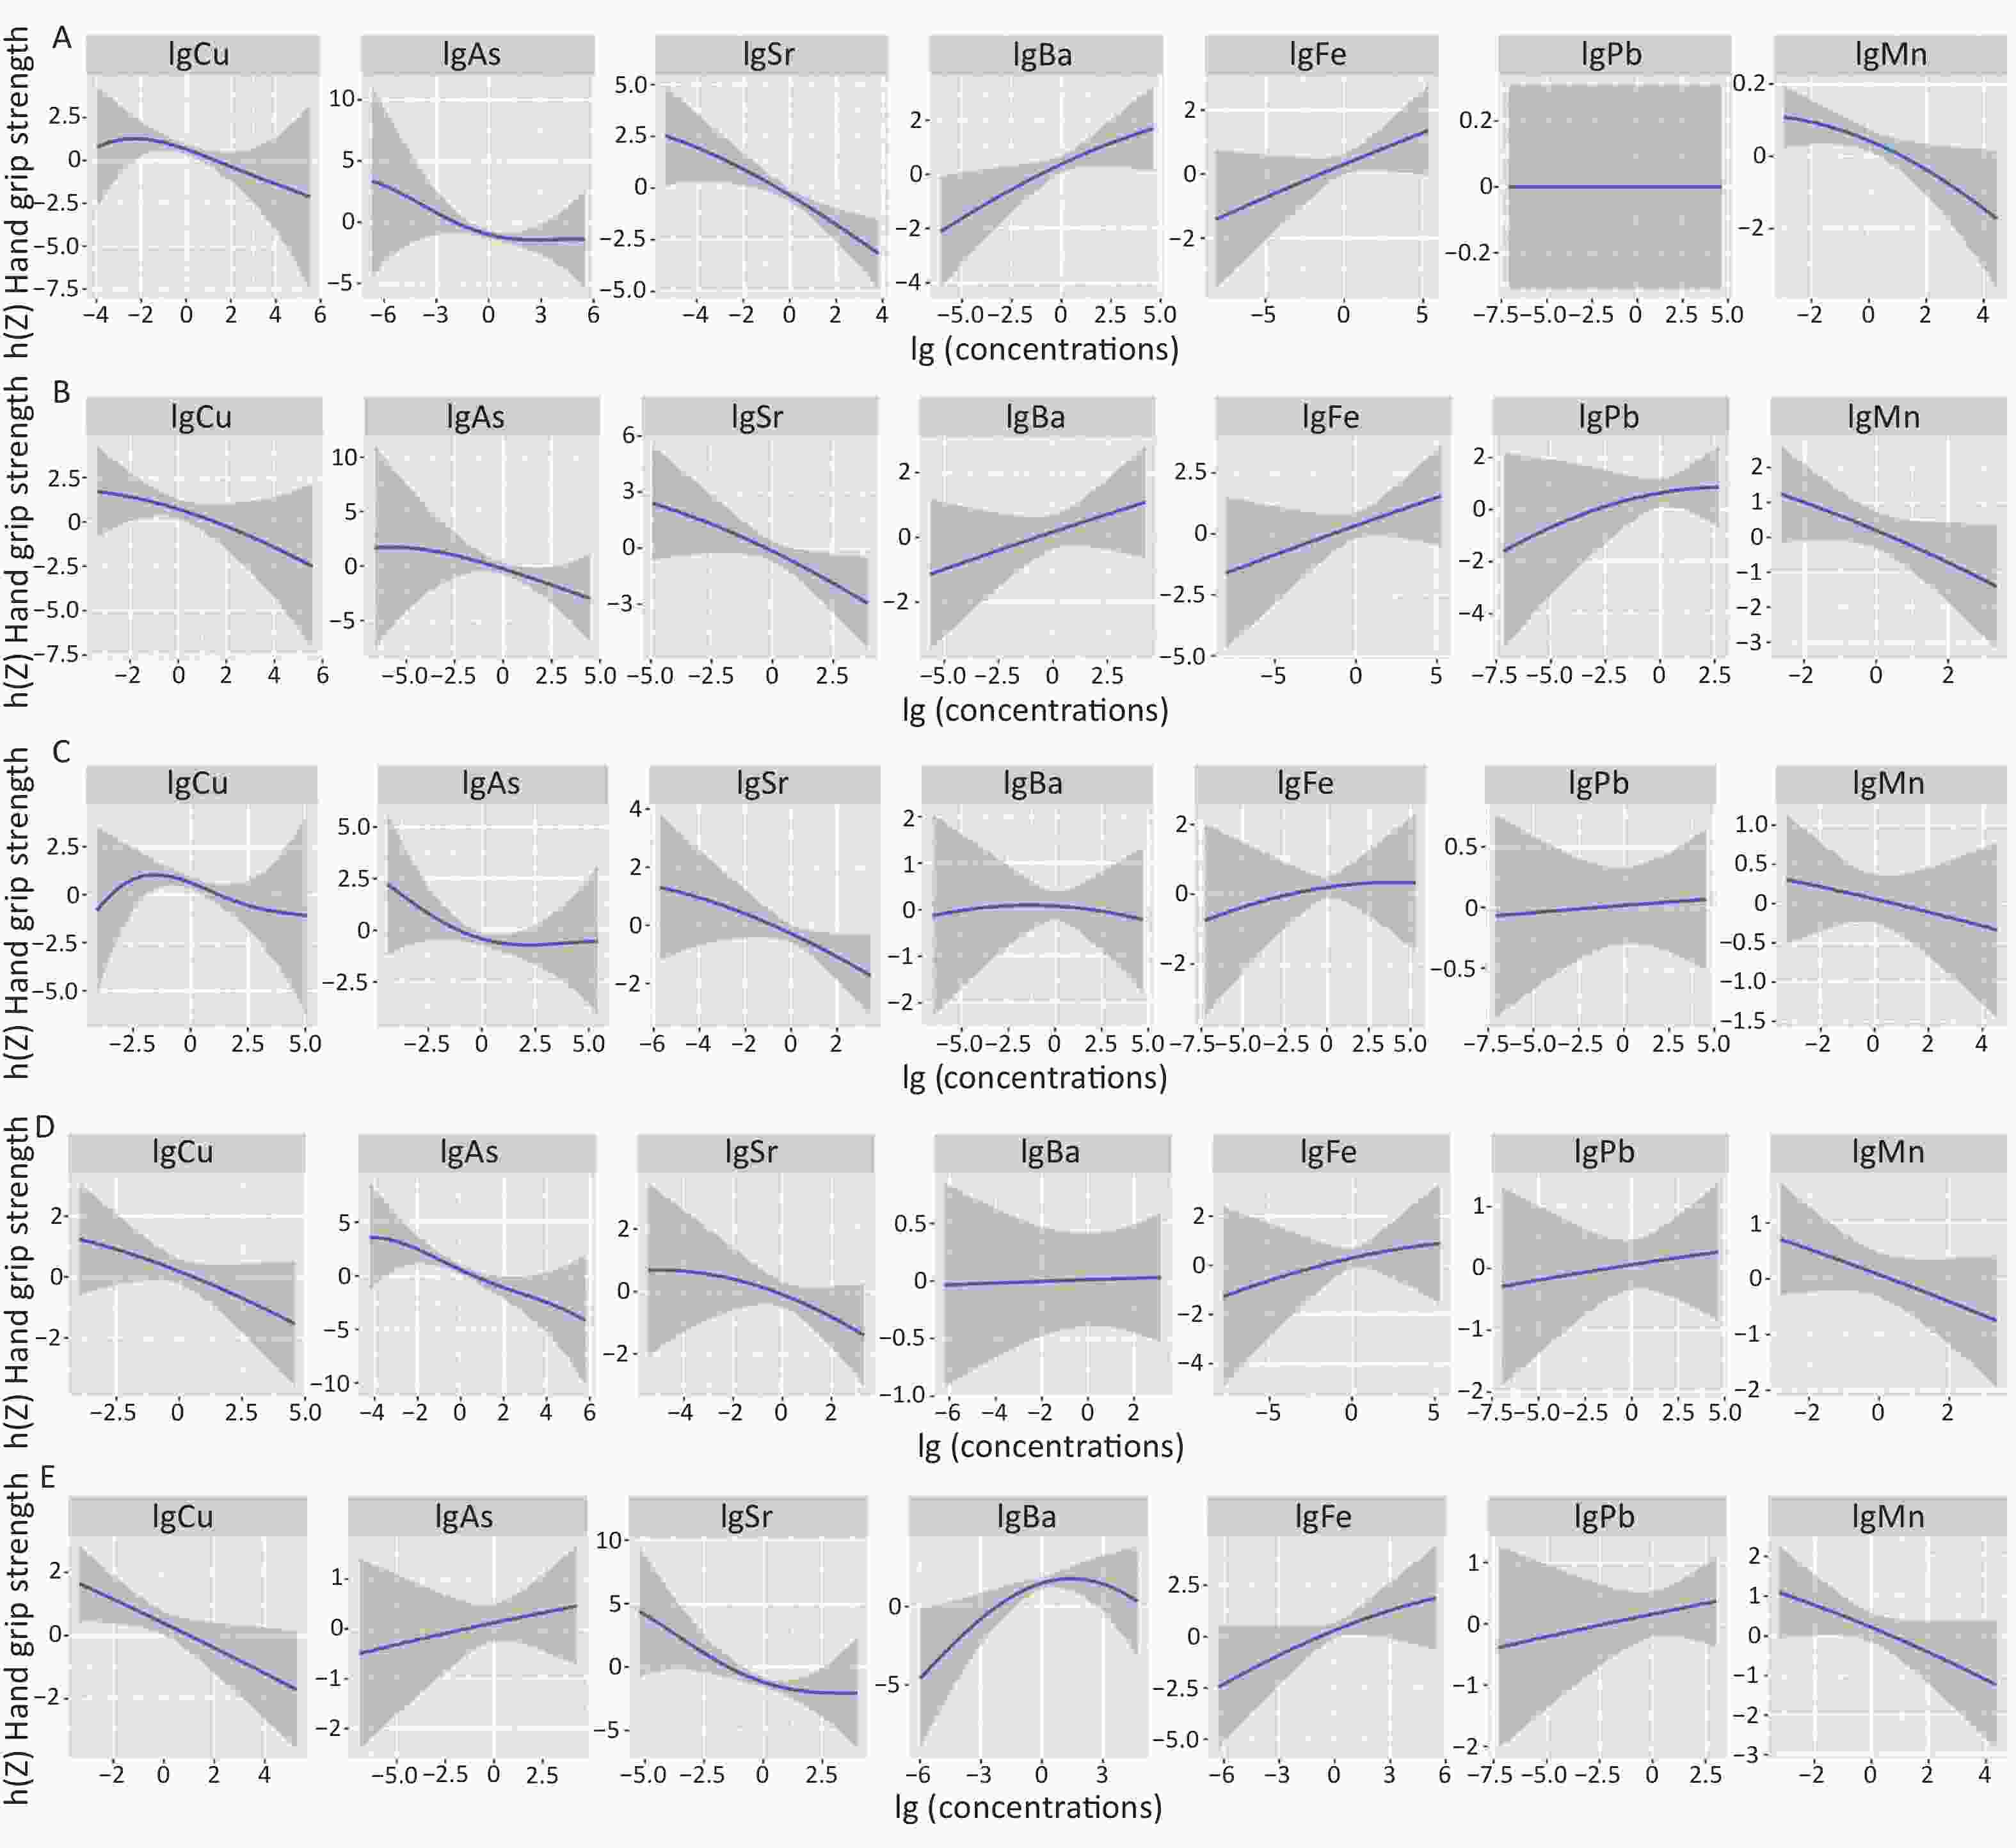
Figure 3. Univariate exposure-response functions and 95% credible intervals (shaded areas) for each metal with the other metals kept at the median. Estimate can be interpreted as the contribution of predictors to the response. (A) Total; (B) Men; (C) Women; (D) 30–59 years old; (E) ≥ 60 years old. Exposures have been log10-transformed and models have been adjusted for and/or sex, and/or age, smoke, alcohol consumption, education, ethnicity, diabetes mellitus and BMI. BMI, Body mass index; Cu, copper; As, arsenic; Sr, strontium; Ba, barium; Fe, iron; Pb, lead; Mn, manganese.
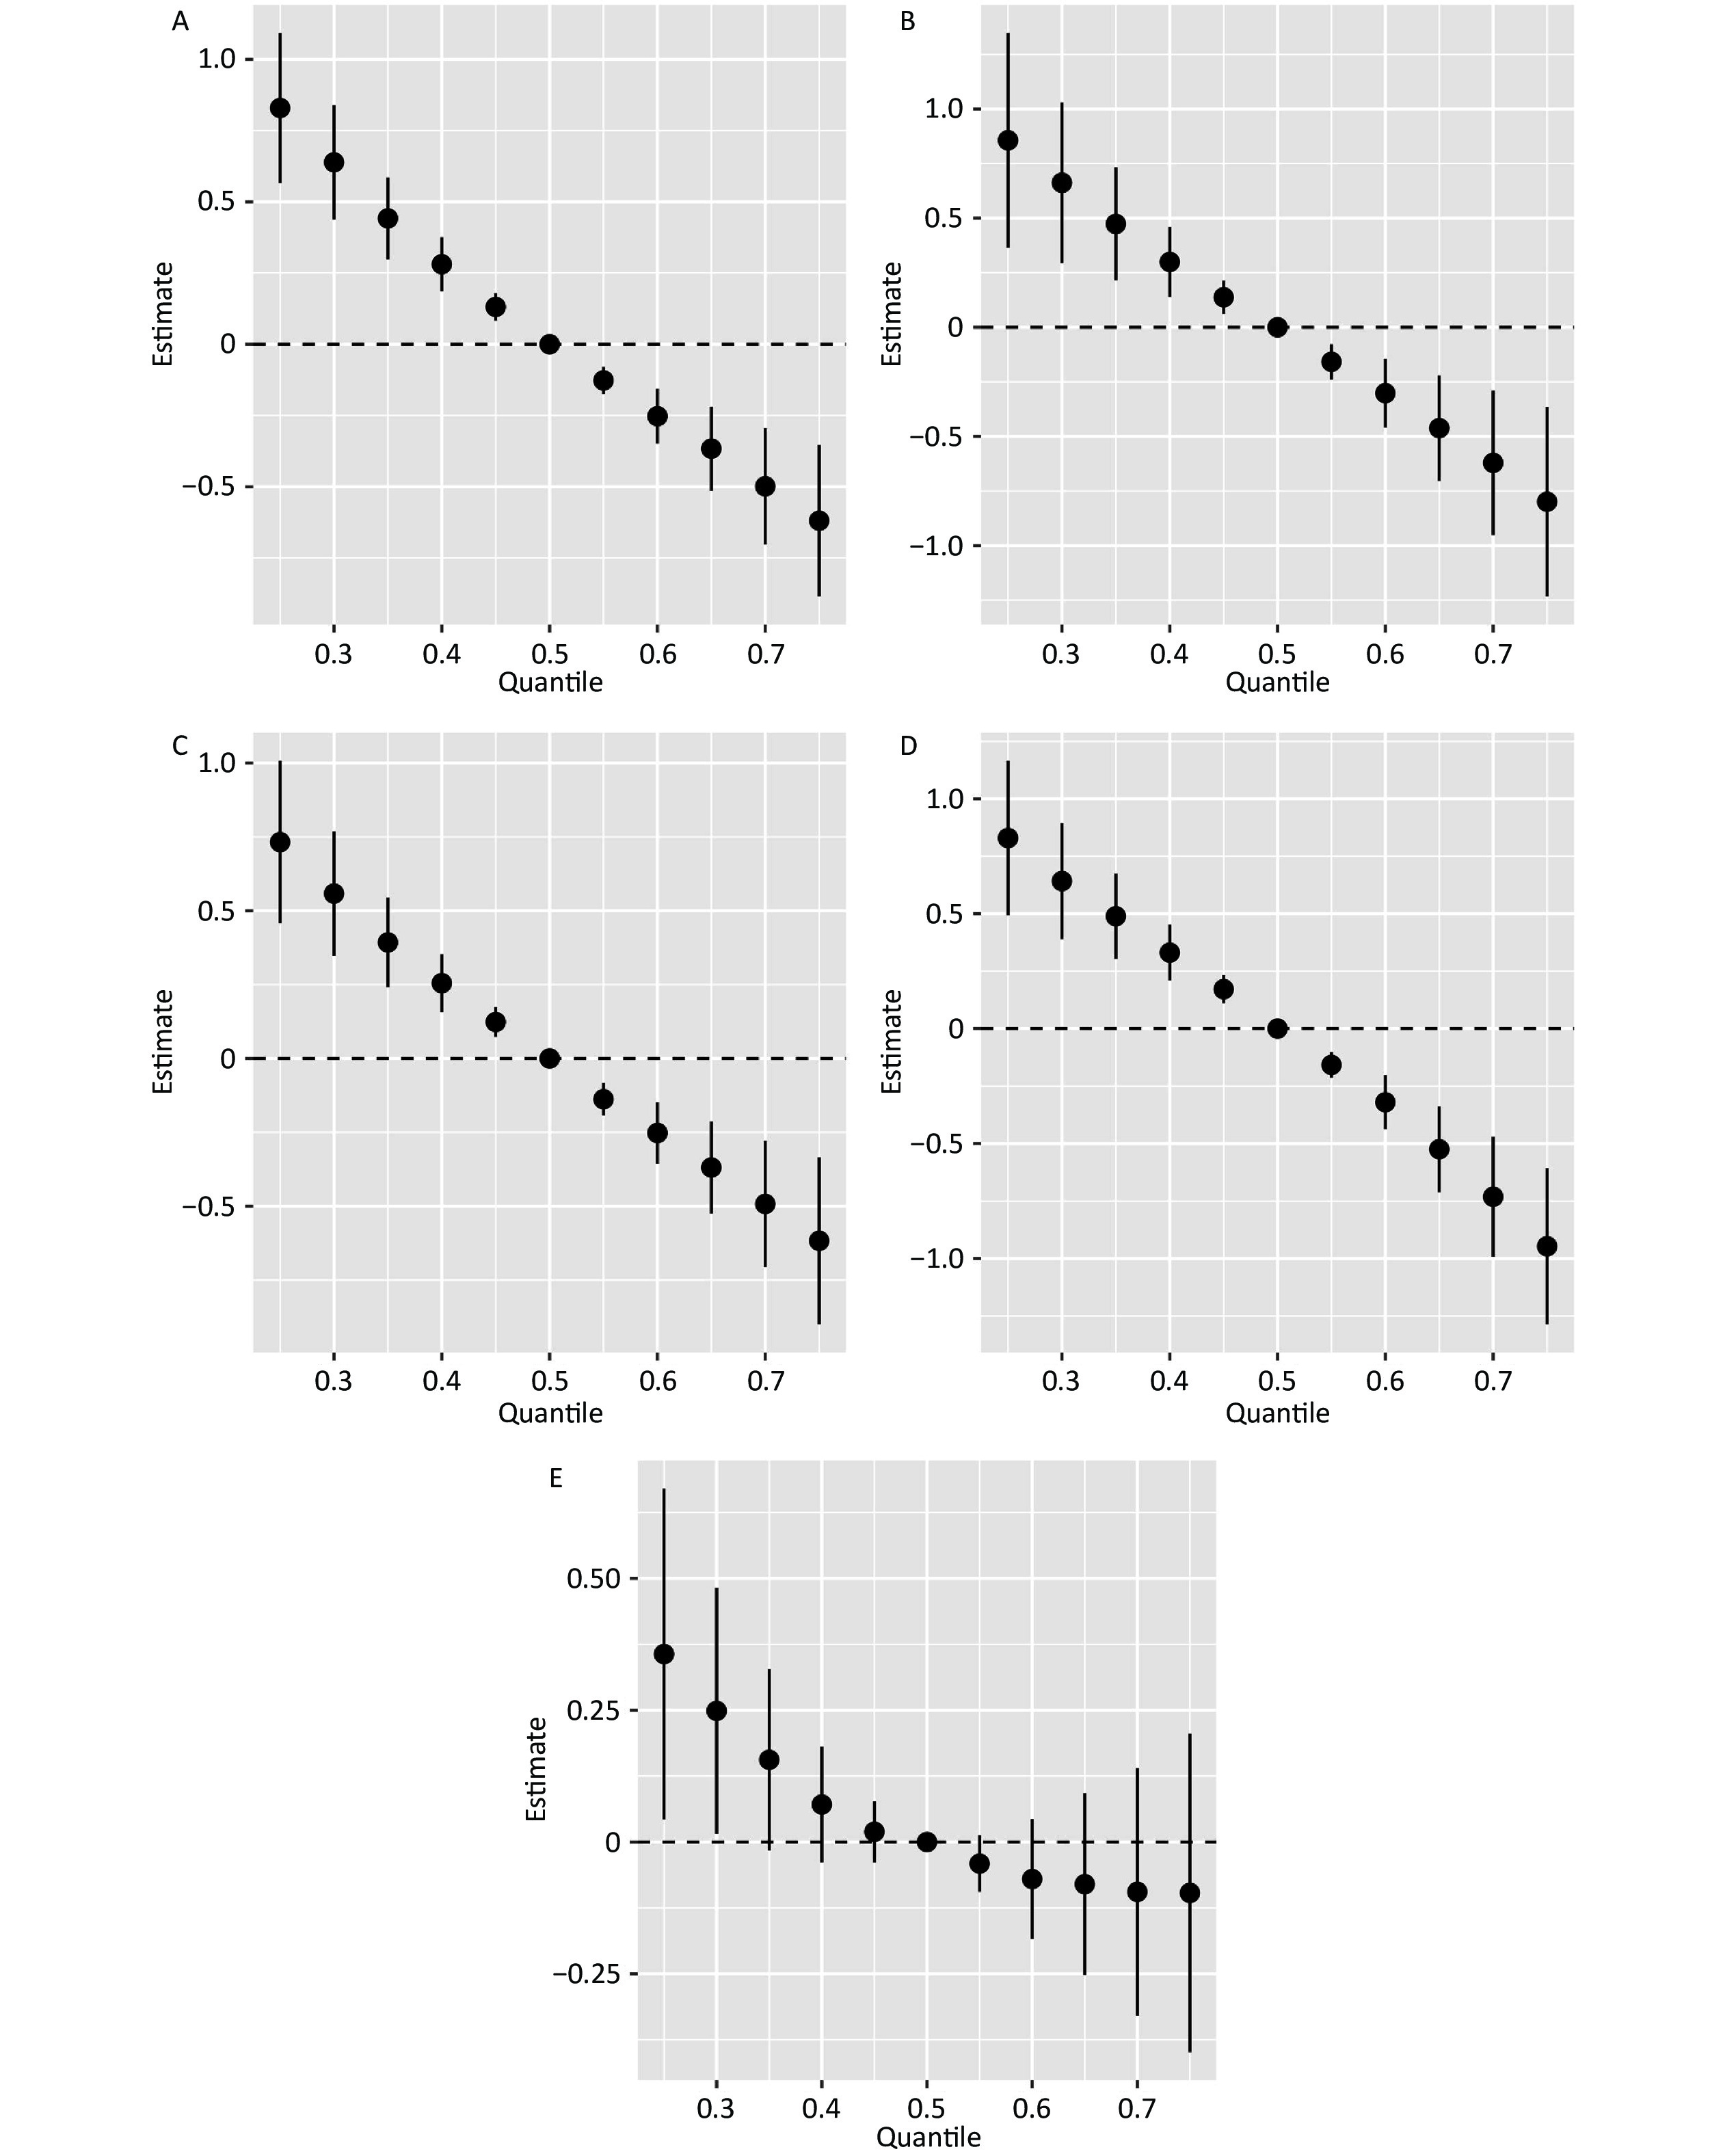
Figure 4 shows the BKMR model that was used to investigate the joint effect of metal mixture exposure on grip strength. The results showed a negative relationship between combined exposure to seven metals and grip strength. The grip strength presented a decreasing trend in the study population as the metal percentile increased when all other metals were at the 50th percentile.
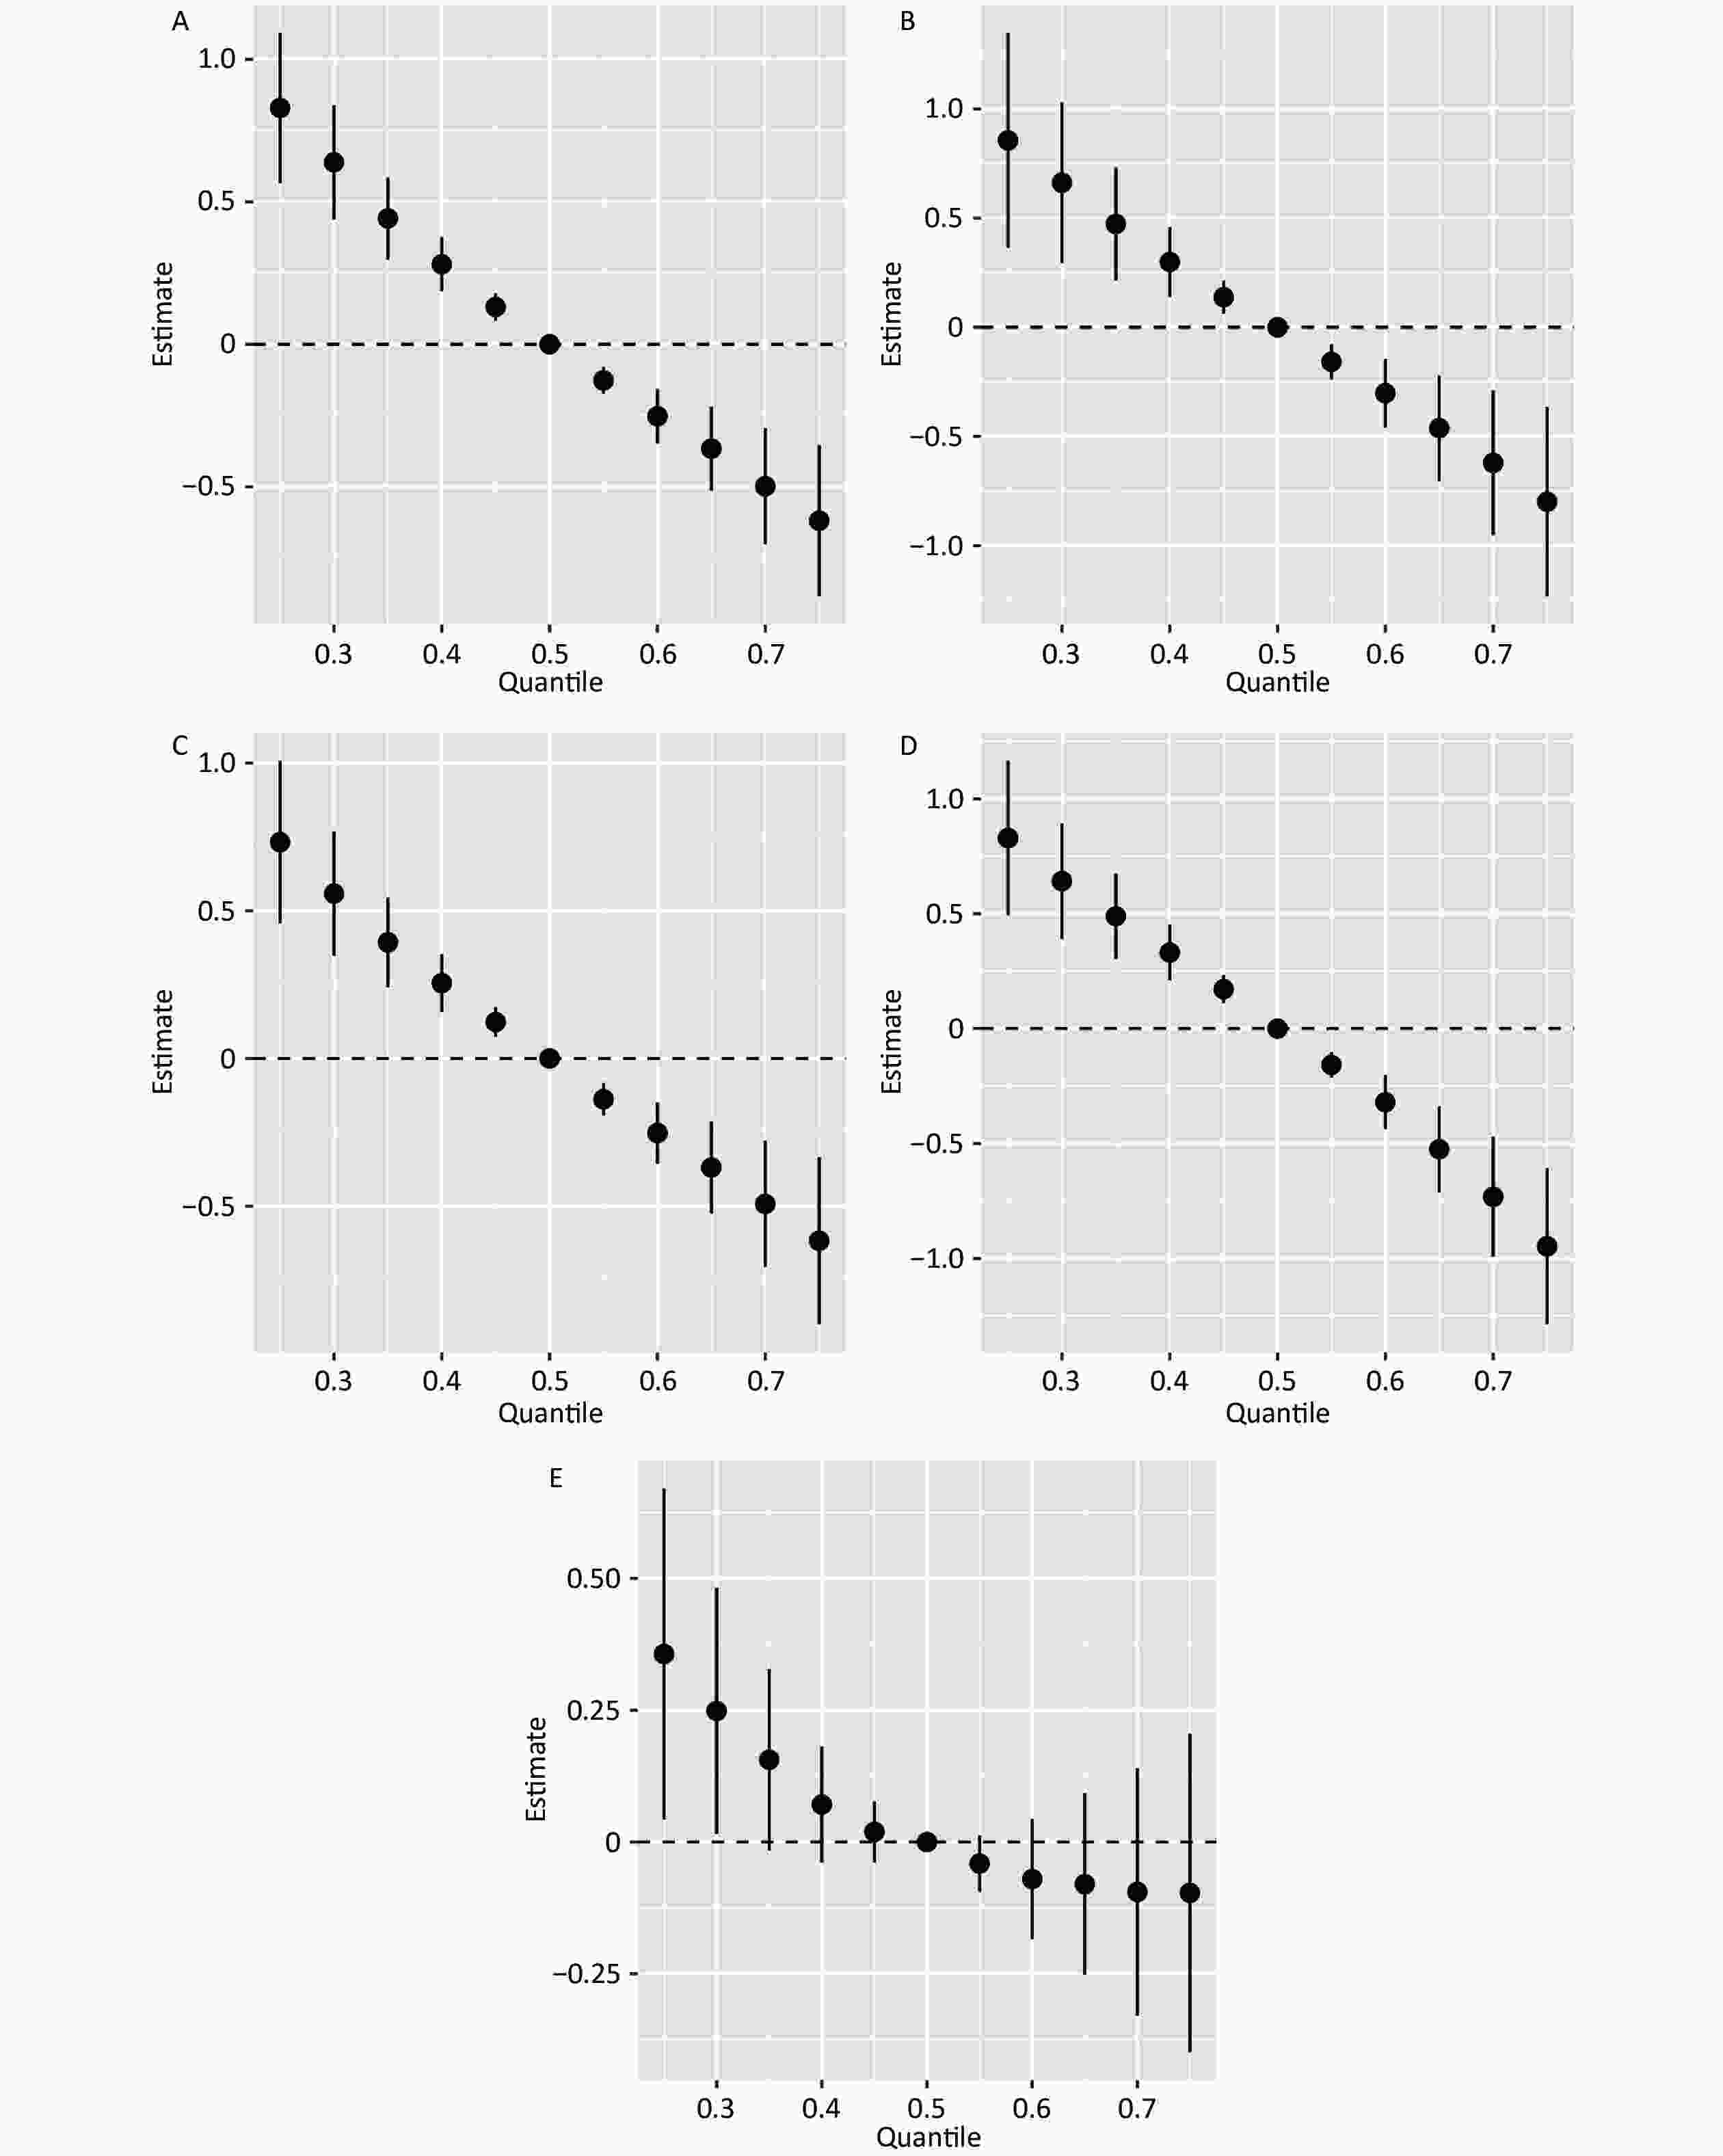
Figure 4. shows the combined effect of exposure and 95% confidence intervals using the BKMR model. (A) Total; (B) Men; (C) Women; (D) 30–59 years old; (E) ≥ 60 years old. Exposures have been log10-transformed and models have been adjusted for and/or sex, and/or age, smoke, alcohol consumption, education, ethnicity, diabetes mellitus and BMI. BMI, Body mass index; Cu, copper; As, arsenic; Sr, strontium; Ba, barium; Fe, iron; Pb, lead; Mn, manganese.
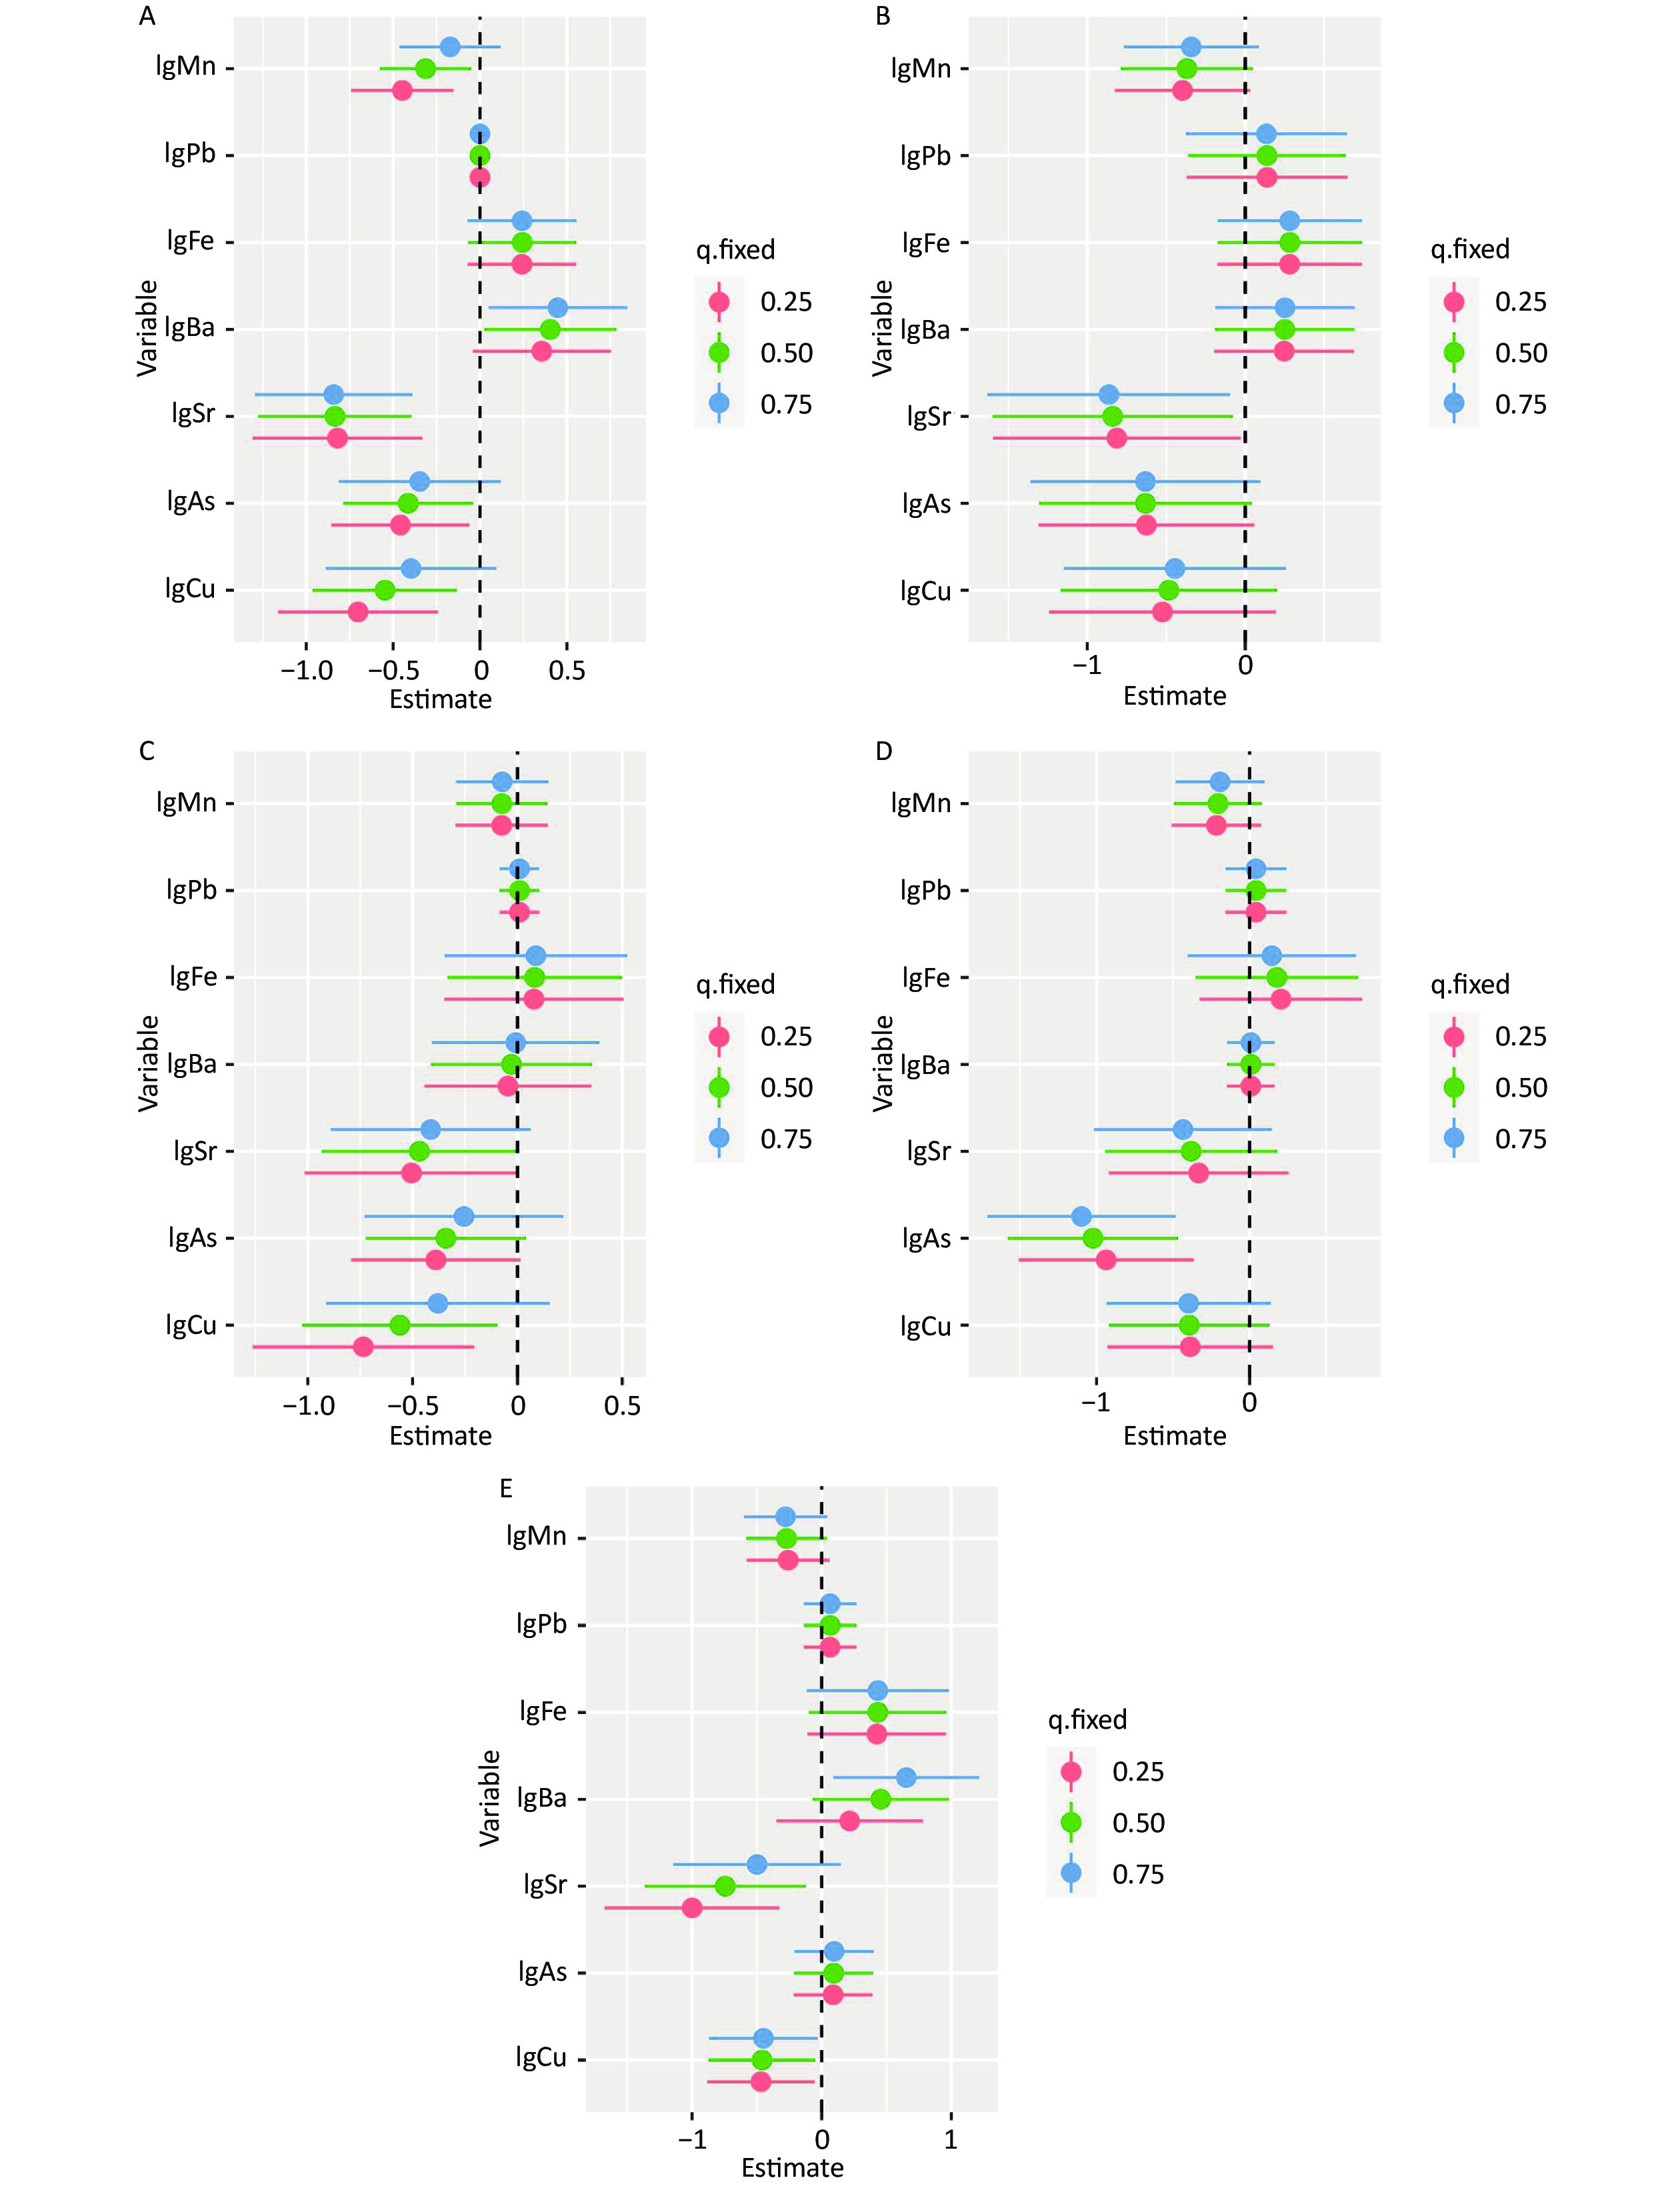
In the separate effects model, the outcome variable changed with each interquartile spacing increase in individual metal concentrations when the metal concentration levels were at the 25th, 50th, and 75th percentiles, respectively (Figure 5). In both the total population (estimate: from −0.820 to −0.842) and male participants (estimate: from −0.813 to −0.864), an increase in Sr exposure from the 25th to the 75th percentile was negatively correlated with grip strength levels when other metal concentrations remained at the 50th percentile. In participants aged 30–59 years, an increase in As exposure from the 25th to the 75th percentile was negatively associated with grip strength when other metal concentrations were held at the 50th percentile. In participants aged ≥ 60 years, an increase in Cu exposure from the 25th to the 75th percentile was negatively associated with grip strength when other metal concentrations remained at the 50th percentile
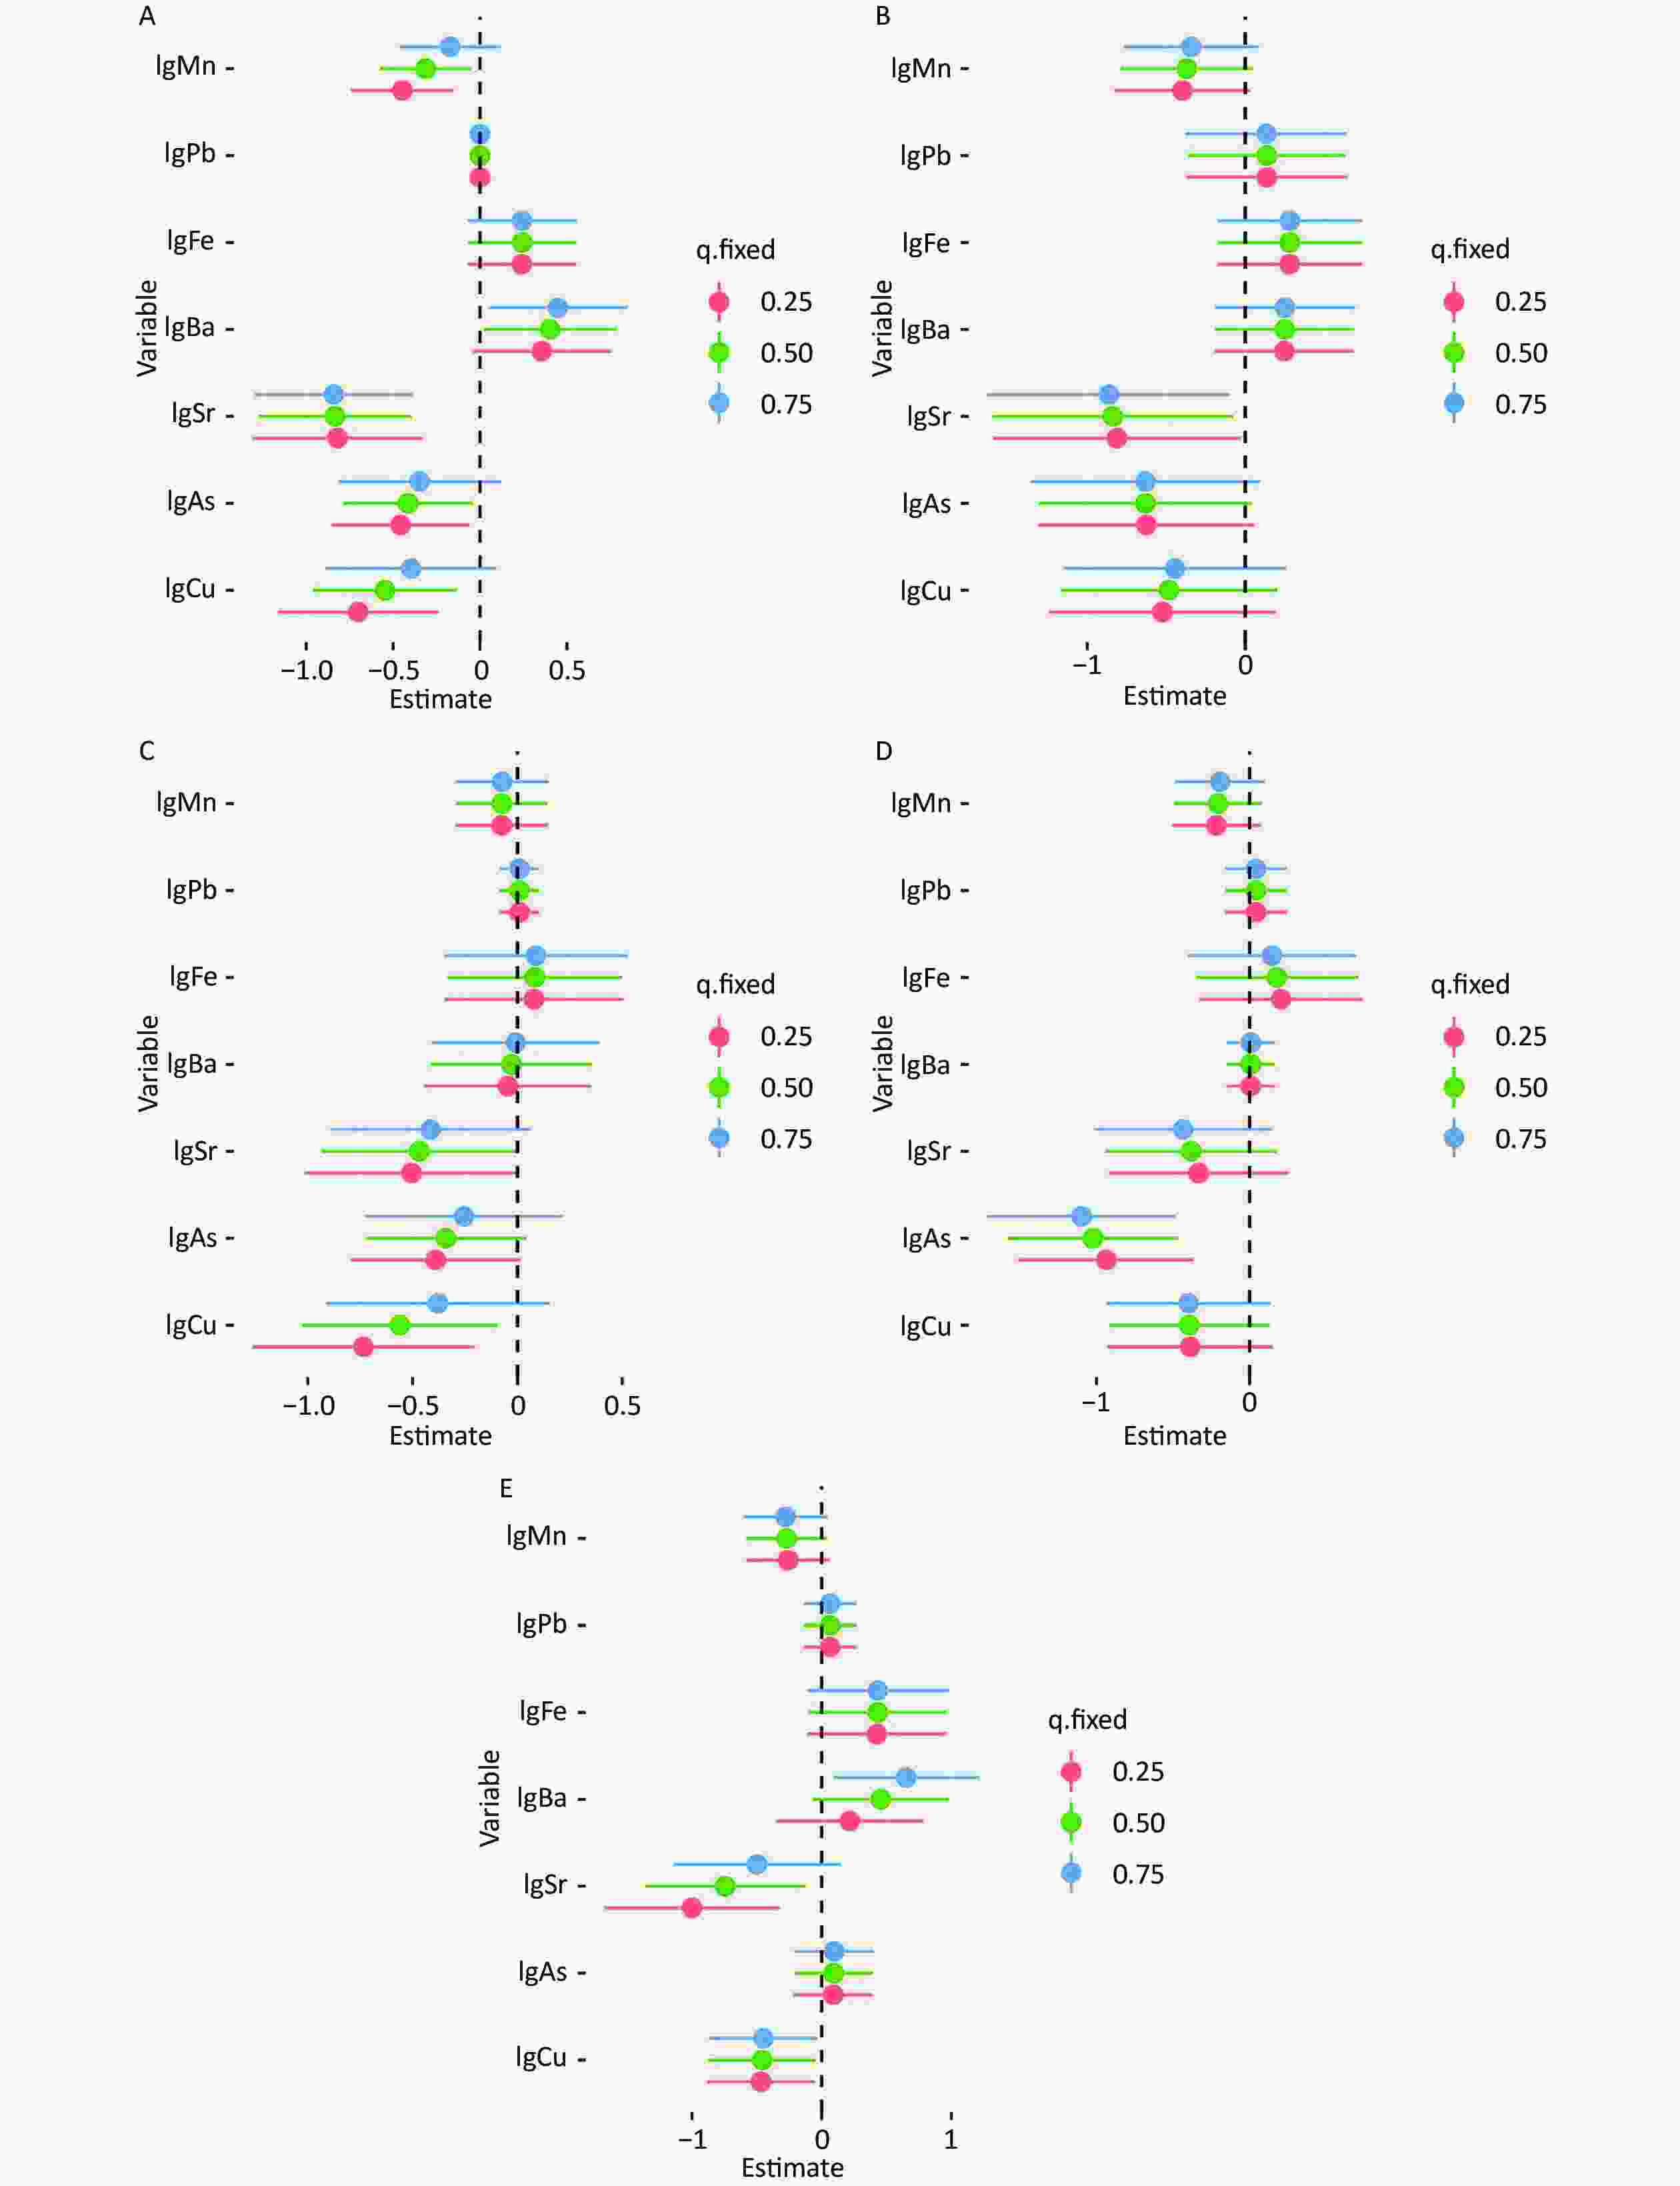
Figure 5. In the separate effects model, the outcome variable changed with each interquartile spacing increase in individual metal concentrations when the metal concentration levels were at the 25th, 50th, and 75th percentiles, respectively. (A) Total; (B) Men; (C) Women; (D) 30–59 years old; (E) ≥ 60 years old. Exposures have been log10-transformed and models have been adjusted for and/or sex, and/or age, smoke, alcohol consumption, education, ethnicity, diabetes mellitus and BMI. BMI, Body mass index; Cu, copper; As, arsenic; Sr, strontium; Ba, barium; Fe, iron; Pb, lead; Mn, manganese.
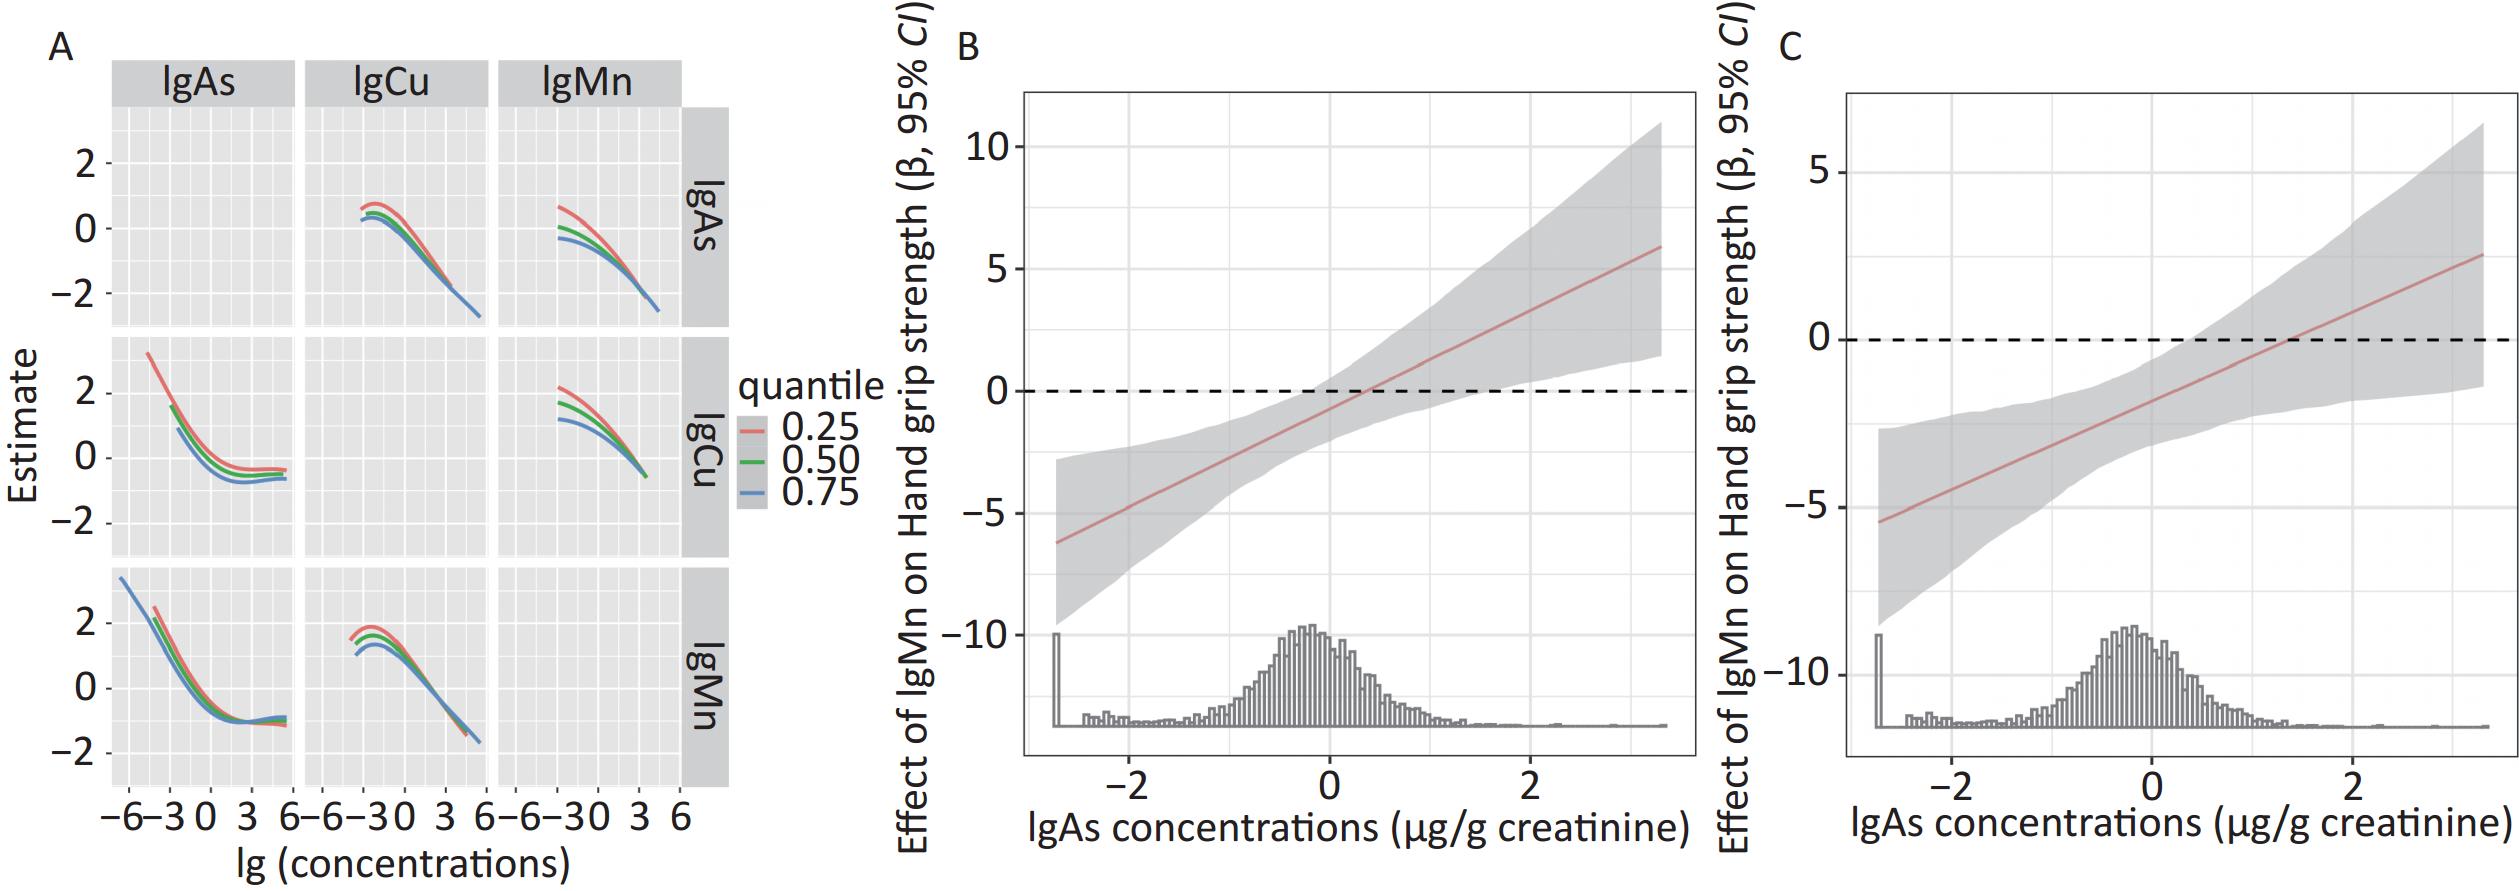
In addition, BKMR results for one metal at different levels of another metal showed smaller interactions between As and Mn and between Cu and Mn in the total population (Figure 6A). As exposure to As or Cu increased, the effect of Mn was associated with an increased grip strength levels. This interaction was confirmed in a linear regression model (Pinteraction = 0.003 and 0.018, respectively; Figures 6B and Figure 6C).
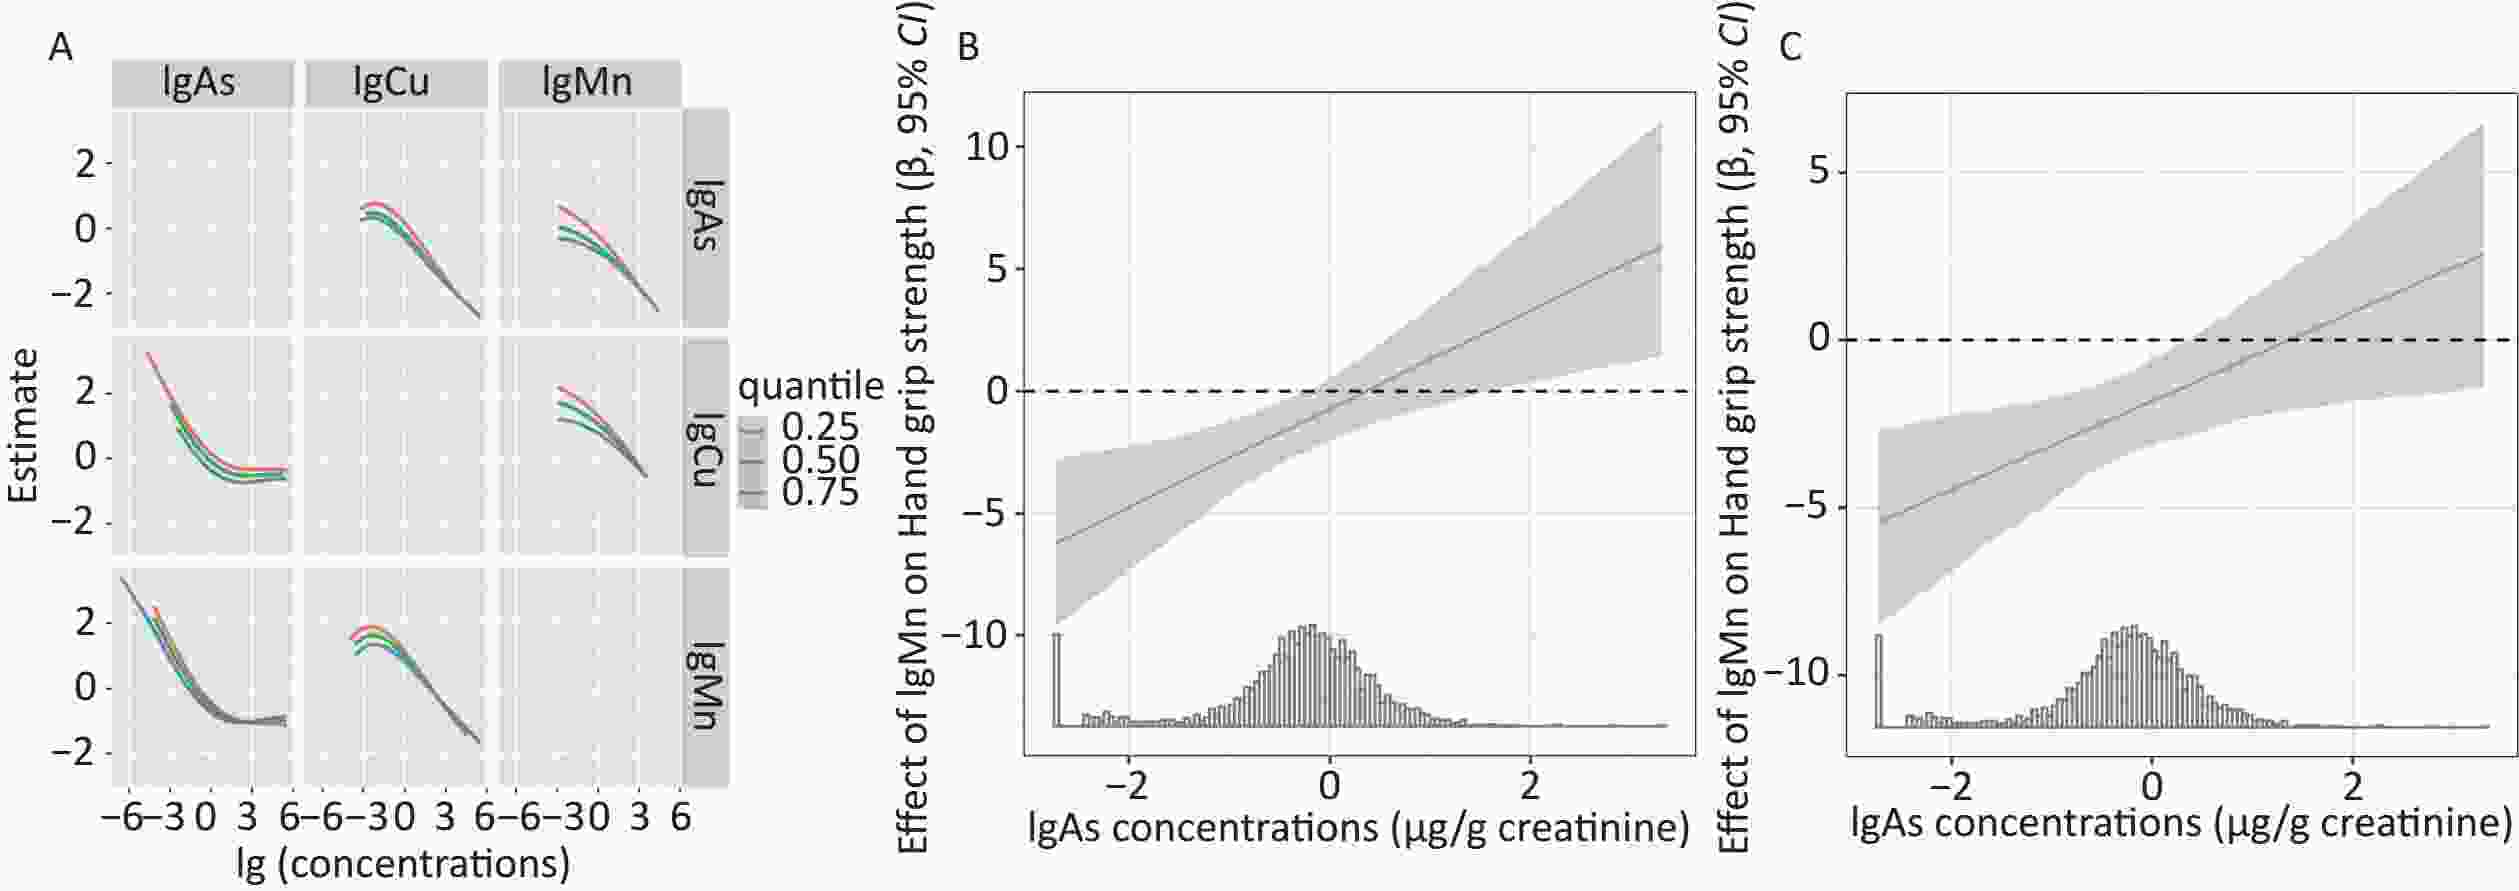
Figure 6. Interaction effect for Cu and Mn at different As and Cu quantiles (lower left panel of A) or As and Cu at different Cu and Mn quantiles (top right panel of A) on handgrip strength levels estimated by Bayesian Kernel Machine Regression (BKMR) model (A) and regression estimates of Mn effects (red line) and the 95% credible interval (shaded area) on handgrip strength levels as a function of As (B) and Cu (C) in Huayuan area. Exposures have been log10-transformed and models have been adjusted for and/or sex, and/or age, smoke, alcohol consumption, education, ethnicity, diabetes mellitus and BMI. BMI, Body mass index; Cu, copper; As, arsenic; Mn, manganese.
-
Incorporating the seven metallic elements and correction factors (smoke, alcohol consumption, age, sex, education, ethnicity, diabetes mellitus, BMI, occupation, physical activity, dietary protein intake and dietary energy intake) into the linear regression model, it was found that Cu (β = −2.318) and Sr (β = −2.385) remained significantly negatively correlated with grip strength levels (Supplementary Table S1 available in
www.besjournal.com ).Total β (95% CI) P value* Cu −2.318 (−3.886, −0.750) 0.004 As −0.600 (−2.119, 0.919) 0.439 Sr −2.385 (−3.769, −1.002) 0.001 Ba 0.836 (−0.023, 1.696) 0.057 Fe 1.041 (−0.318, 2.400) 0.133 Pb 0.167 (−0.581, 0.915) 0.662 Mn −0.304 (−0.717, 0.109) 0.150 Note. *P < 0.05; adjusted for smoke, alcohol consumption, age, sex, education, ethnicity, diabetes mellitus, BMI, occupation, physical activity, dietary protein intake and dietary energy intake. Cu, copper; As, arsenic; Sr, strontium; Ba, barium; Fe, iron; Pb, lead; Mn, manganese. Table S1. Correlation between 7 metals and handgrip strength by linear regression analysis (n = 1,892)
Quantile g-computation results showed that the risk of occurrence of reduced grip strength was −0.800 (95% CI: −1.235, −0.365), P < 0.05, for each quartile increase in the mixture of the seven metals, with the metals Sr and Cu having the greatest weights in the negative associations with grip strength, and the metal Ba having the greatest weights in the positive associations with grip strength Maximum (Supplementary Figure S1, available in www.besjournal.com).
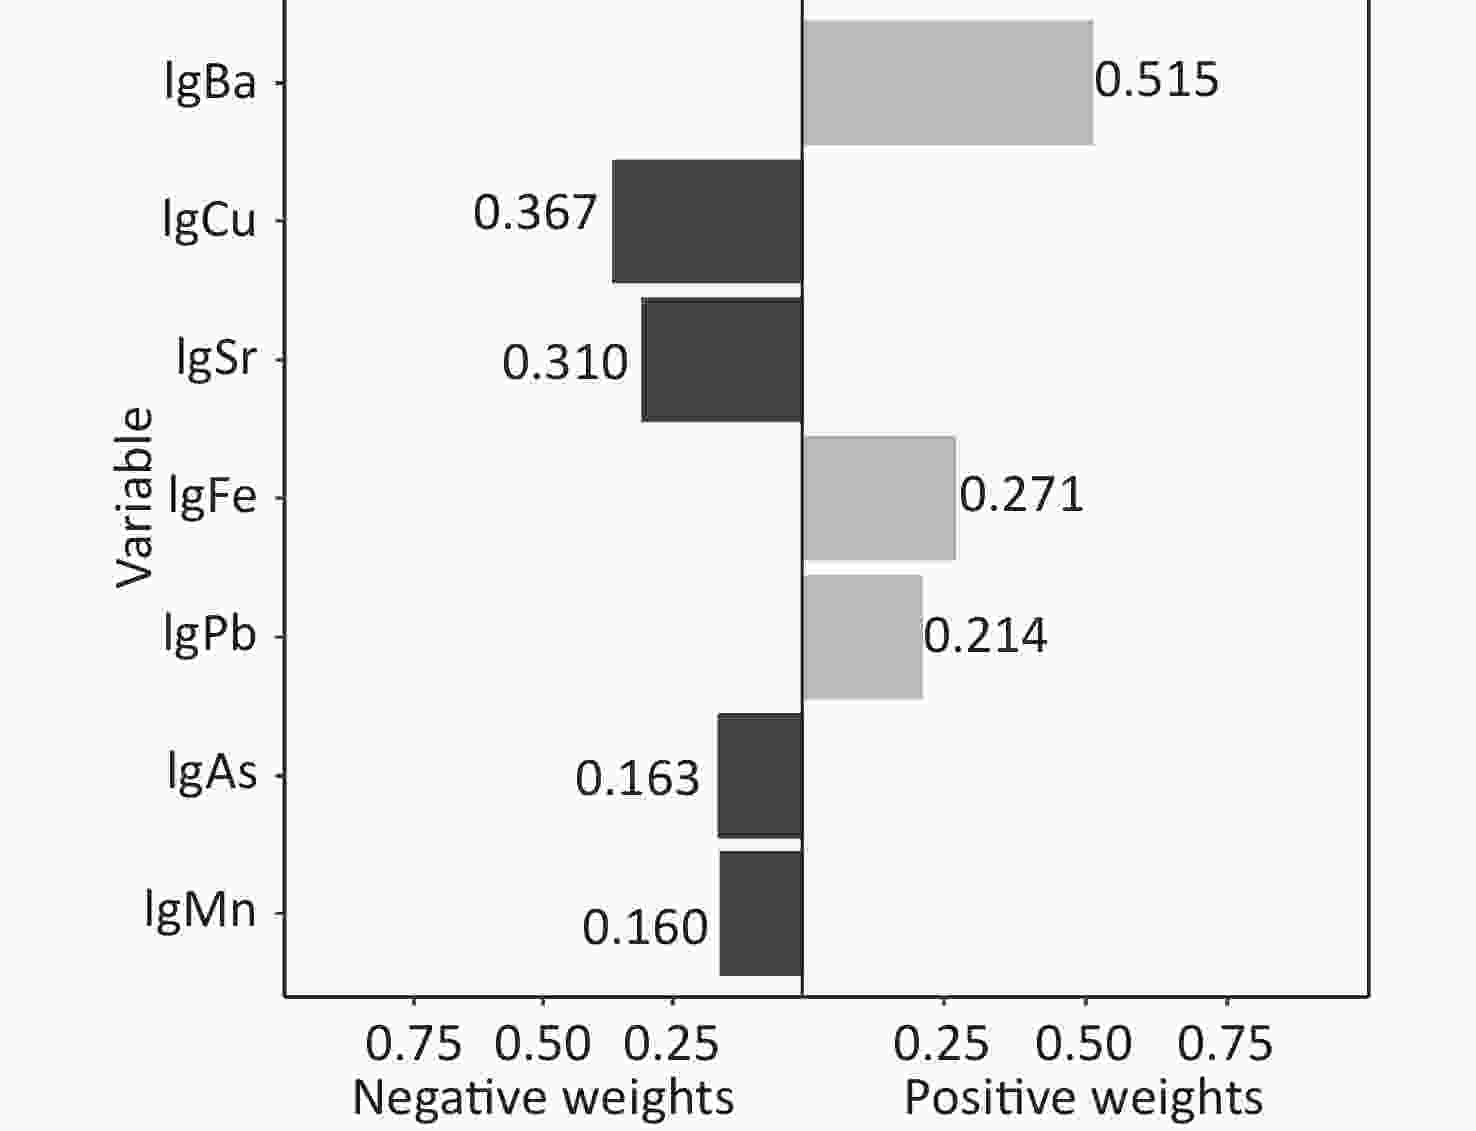
Figure S1. Weight ratio of each metal in the positive-negative association in the Quantile g-computation. Exposures have been log10-transformed and models have been adjusted for smoke, alcohol consumption, age, sex, education, ethnicity, diabetes mellitus, BMI, occupation, physical activity, dietary protein intake and dietary energy intake. BMI, Body mass index; Cu, copper; As, arsenic; Sr, strontium; Ba, barium; Fe, iron; Pb, lead; Mn, manganese.
The BKMR results found that the exposure-response relationship between Cu and Sr was non-linear (Supplementary Figure S2A, available in www.besjournal.com); the BKMR model was used to investigate the combined effect of metal mixture exposure on grip strength, and the results showed that there was a negative correlation between the combined exposure of seven metals and grip strength (Supplementary Figure S2B); when the other seven metals were set to P25, P50, or P75, the Sr (estimate: from -0.904 to -0.770) was significantly negatively correlated with the level of grip strength (Supplementary Figure S2C);In addition there was a smaller interaction between Cu and Mn (Supplementary Figure S2D); when Cu exposure was increased, the effect of Mn was associated with an increase in the level of grip strength. This interaction was confirmed in a linear regression model (Pinteraction = 0.022, Supplementary Figure S2E).
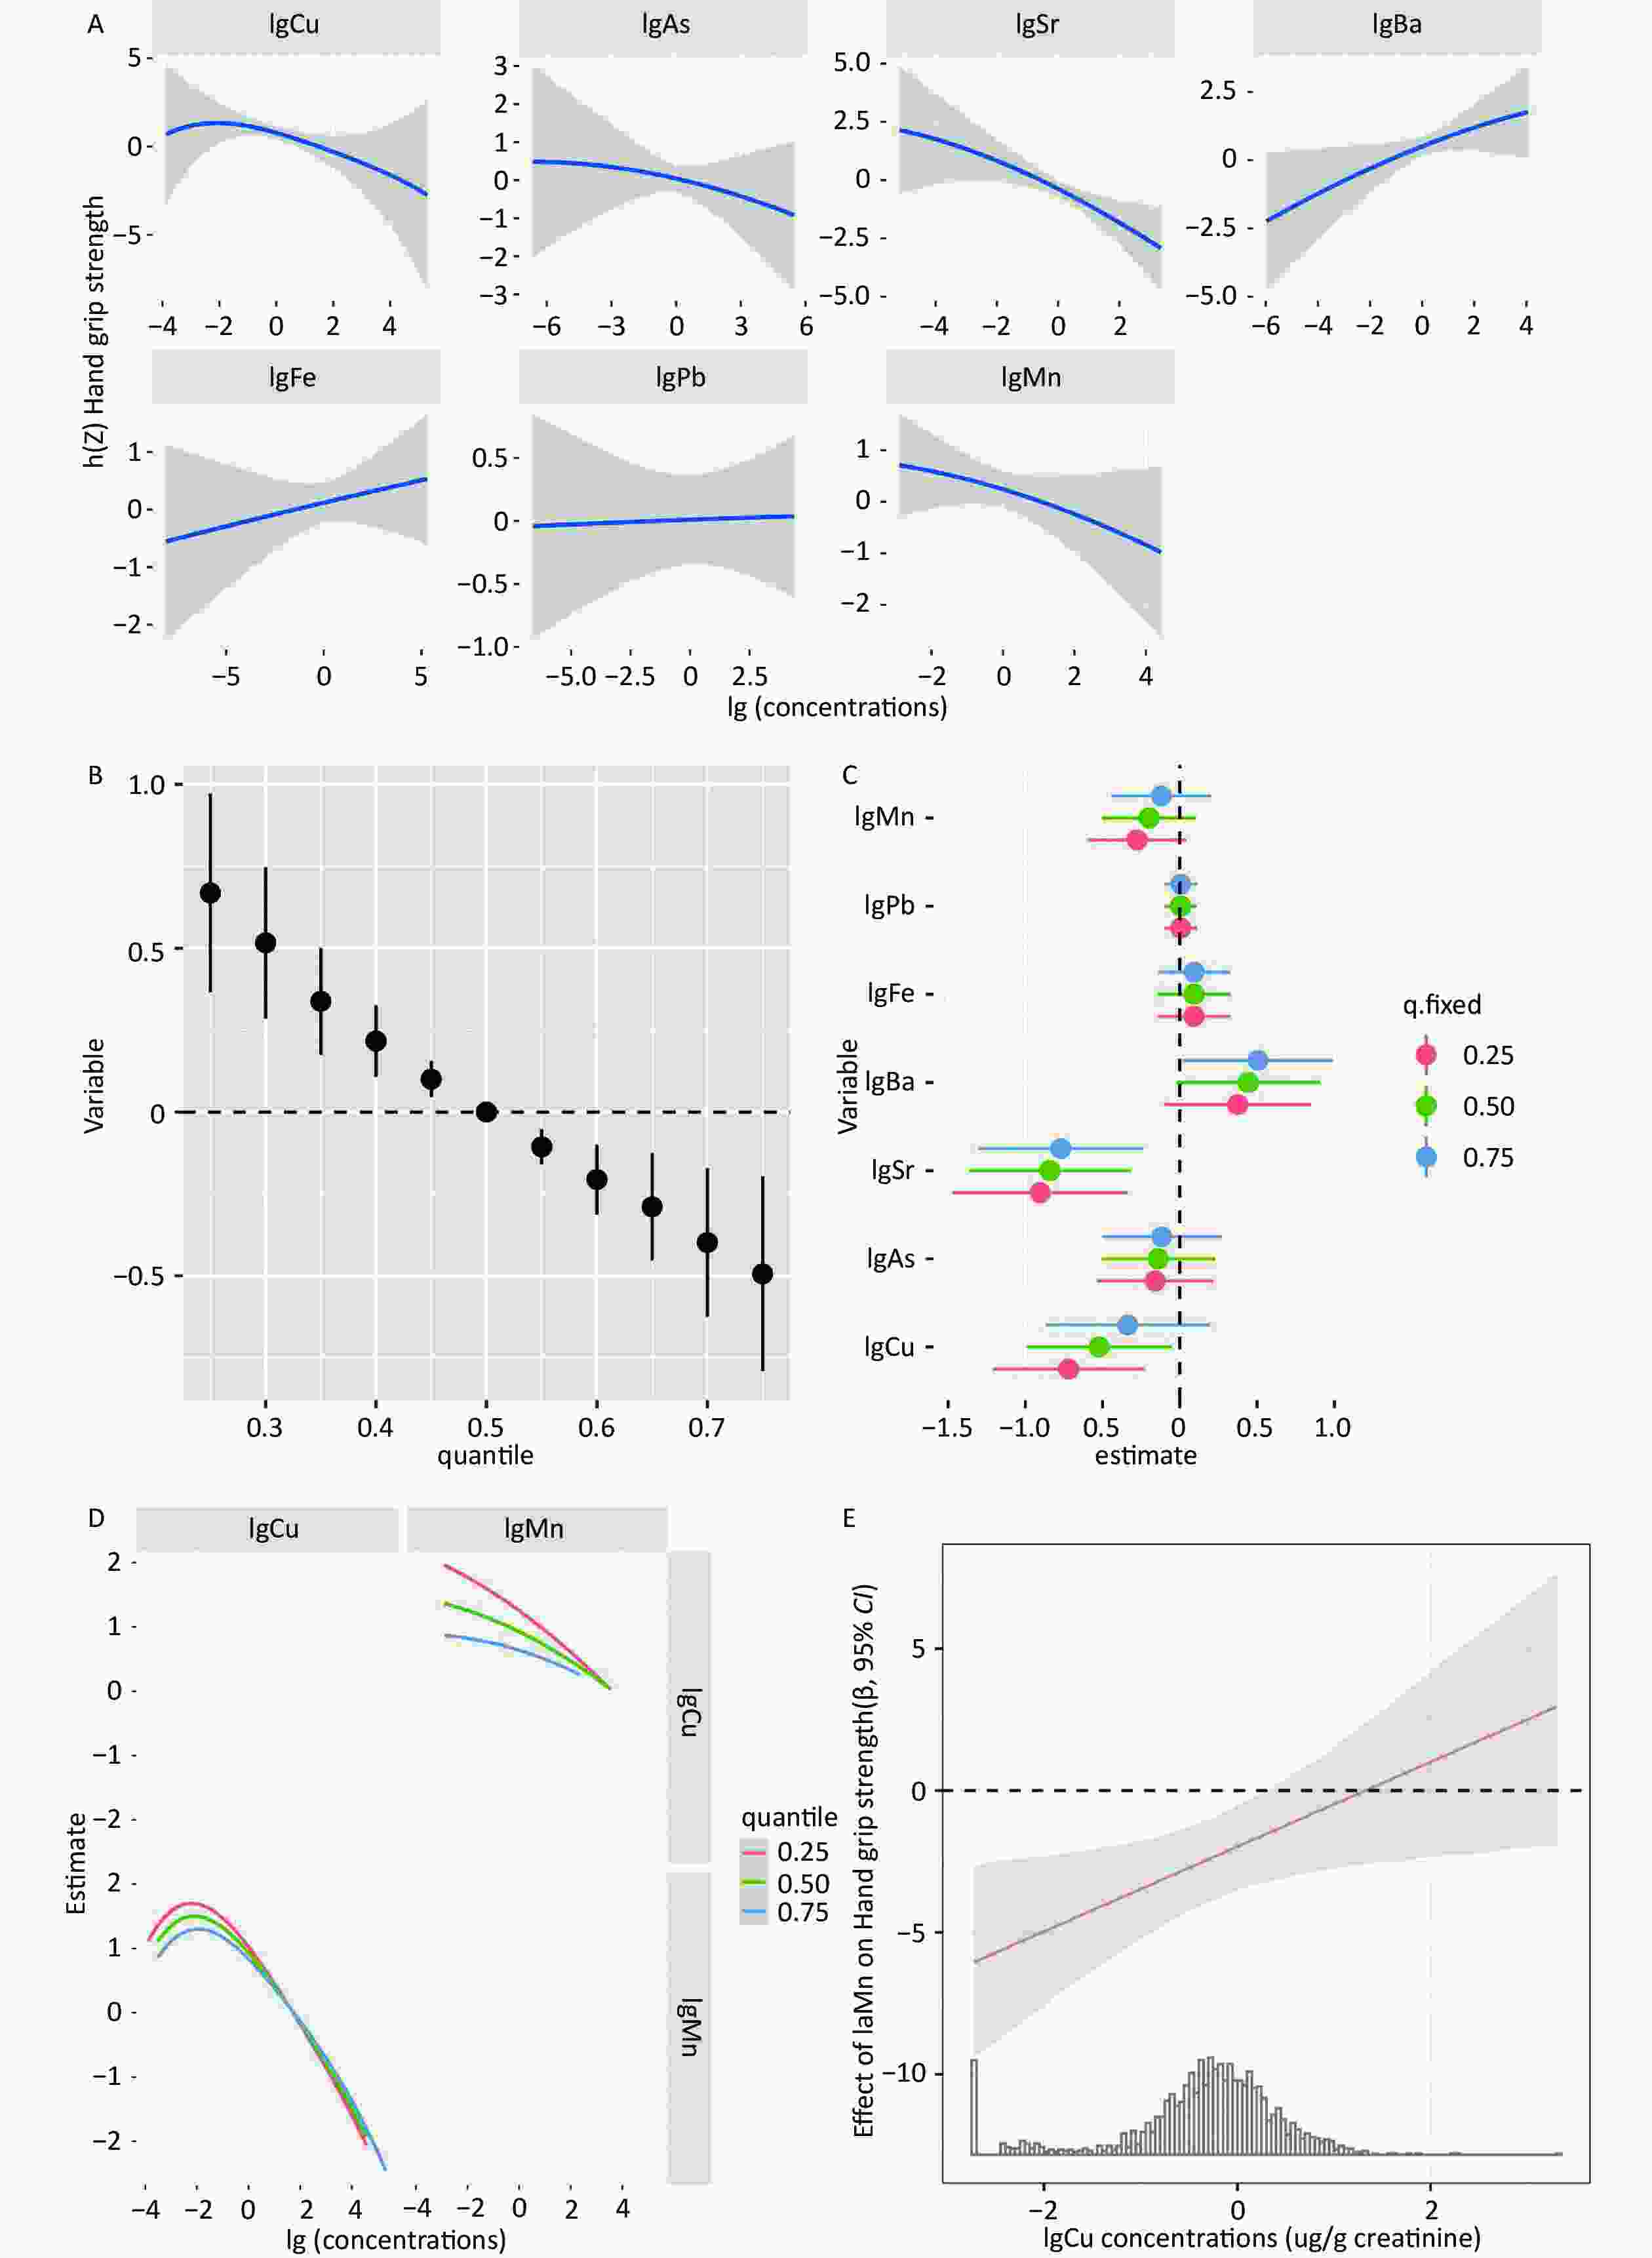
Figure S2. The combined effect of Cu, As, Sr, Ba, Fe, Pb and Mn on grip strength levels. (A) Univariate exposure-response functions and 95% credible intervals (shaded areas) for each metal with the other metals kept at the median. Estimate can be interpreted as the contribution of predictors to the response. (B) The combined effect of exposure and 95% confidence intervals using the BKMR model. (C) Individual risk estimates for each metal element the association of the grip level with each element from the 25th to 75th percentile when the other elements in the mixture were fixed at the 25th, 50th, and 75th percentiles. (D) Interaction effect for Cu at different Mn quantiles (lower left panel of A) or Mn at different Cu quantiles (top right panel of A) on handgrip strength levels estimated by Bayesian Kernel. (E) Machine Regression (BKMR) model (D) and regression estimates of Mn effects (red line) and the 95% credible interval (shaded area) on handgrip strength levels as a function of Cu in Huayuan area. Exposures have been log10-transformed and models have been adjusted for and/or sex, and/or age, smoke, alcohol consumption, education, ethnicity, diabetes mellitus, BMI, occupation, physical activity, dietary protein intake and dietary energy intake. BMI, Body mass index; Cu, copper; As, arsenic; Sr, strontium; Ba, barium; Fe, iron; Pb, lead; Mn, manganese.
-
The aim of this study was to identify the metals in the urine metal mixture that correlate with grip strength levels. We first assessed independent estimates of grip strength produced by Cu, As, Sr, Ba, Fe, Pb and Mn based on a multi-metal linear regression model. Secondly, the Quantile g-computation model was used to estimate the joint effect of the multi-metal mixtures. Finally, the BKMR model was used to estimate the joint effect of the metal mixtures and to overcome limitations, such as the possibility of complex interactions between the metals and the non-linear and non-cumulative relationship between the metals and the grip strength levels. The results of the Quantile g-computation model and the BKMR study confirm our main findings, as follows: a negative correlation was observed between the exposure of the seven metal mixtures and the grip strength level; Cu, Sr and As were negatively correlated with grip strength levels, while Ba levels were positively correlated with grip strength. In general, there were potential interactions between As and Mn and between Cu and Mn.
Currently, a few epidemiological studies on the association between metals and grip strength have been conducted. Luo et al.[7] analysed the association between serum Cu and grip strength in 3,047 adults from the 2011–2014 NHANES and observed that Cu was negatively associated with grip strength; their study was the first to report the correlation between Cu and grip strength, consistent with the results of the current research. Several animal experiments have demonstrated that Cu exposure may mediate oxidative stress and excitotoxicity, which leads to apoptosis and inflammation-mediated cell death in the striatum and mediates cone bundle dysfunction; as a result, reduced grip strength has been observed in the rats[22-24]. In addition, Cu is associated with the levels of the inflammatory factor C-reactive protein[25,26]; inflammatory cytokines promote muscle atrophy to stimulate proteolytic metabolism and inhibit muscle synthesis[27].
Arsenic is a naturally occurring toxic metal, and acute As poisoning can cause symptoms, such as dizziness, delirium, encephalopathy, muscle weakness or seizures[28]. This element is a naturally occurring toxic metal. One of the most important mechanisms involved in the toxicity of As is its capability to cause oxidative stress and mitochondrial dysfunction[12]. Animal studies have shown that As reduced the activity of the mitochondrial complex and increased the level of (ROS) in the rat brain[29]. The accumulation of ROS caused alterations in the electron transport chain and significantly induced oxidative degradation of biomolecules, which resulted in cellular damage in the muscle tissue[2]. In this study, a negative correlation was observed between metallic As and grip strength levels. Several animal studies have shown that As causes neuromotor dysfunction, such as hypokinesia and reduced muscle strength[30,31]. Exposure to excess metallic As resulted in reduced forelimb and hindlimb strength in young and adult rats[32]. In addition, a recent cross-sectional study in Wuhan, China showed a negative association between urinary metallic As and grip strength levels[8]. This result is consistent with that of the present study.
Of the trace metals present in human bone, Sr is the only one associated with the compressive strength of bone[33]. Previous reports on Sr have focused on its potential therapeutic use in skeletal system-related diseases[34]. Sr inhibits osteoclast bone resorption by blocking osteoclast differentiation[35]. In addition, Sr has been used in the treatment of osteomalacia, a form of muscle loss associated with osteoporosis[36]. However, the mechanism of action of Sr on muscle tissue remains controversial, with animal studies showing that in rats treated with Sr, changes in muscle fibre size and capillary ratio were related to body weight; moreover, Sr did not alter muscle histological parameters[37]. By contrast, a cross-sectional study from the USA showed a decrease in grip strength of -2.29 (−4.45, −0.13) kg in participants when comparing the highest and lowest quartiles of Sr after adjustment for potential confounding factors, which suggests that Sr may be involved in muscle tissue development[2]. This result suggests that Sr may be involved in the regulation of muscle tissue, consistent with the current study.
Ba is present as a trace element in food and drinking water, and this element can enter the body through inhalation, oral or dermal contact carriers[38]. In living organisms, Ba accumulates in the teeth, skeletal system, heart, kidneys, lungs and liver[39]. The main physiological effect of Ba is stimulation of the body. It stimulates the smooth muscle of the gastrointestinal tract and the heart muscle[40]. Therefore, Ba is a potential cause of cardiovascular disease and gastrointestinal disorders[41]. However, a few epidemiological studies have reported an association between Ba and grip strength, and a cross-sectional research from the NHANES showed that no association between Ba metal and muscle strength has been found in children and adolescents in the United States[2]. A positive association between urinary Ba metal and grip strength levels was found in this study. which may be due to the different populations and regions studied, which resulted in inconsistent findings.
Fe is an essential micronutrient and a component of ferritin and enzymes that perform important biochemical functions[42]. This element is also essential for skeletal muscle and mitochondrial function, especially for energy metabolism[43]. Fe deficiency affects skeletal muscle function through dysfunctional muscle oxidative capacity[44]. Animal studies have shown that intake of an Fe-rich diet increases the bioavailability of Fe in skeletal muscle, which regulates abnormal mitochondrial morphology and upregulates skeletal muscle mitochondrial function and gene transcription related to energy metabolism[44]. Thus, a high Fe intake may protect against oxidative stress. A study from the Korean NHANES also found that in men, inadequate Fe intake increased the risk of sarcopenia[9]. Similarly, a study from the British Biobank (http://www.ukbiobank.ac.uk) with a sample size of 68,002 participants showed that dietary Fe intake was positively associated with grip strength levels[45], which is consistent with the current study.
Mn is an essential nutrient for human health and involved in the inhibition of oxidative stress, antioxidant defence and protection against DNA damage as a cofactor for antioxidants, such as manganese superoxide dismutase[46]. Mn is an essential nutrient for human health. Mn accumulates in the mitochondria, disrupts the oxidative phosphorylation pathway and causes apoptosis, which lead to toxic effects on brain and muscle cells[47-49]. A study suggested that people with high environmental exposure to Mn, such as those living near metallurgical industries and mines and those drinking Mn-contaminated drinking water, may exhibit neuromotor deficits[50-52]. In this study, urinary metallic Mn was associated with a high risk of neuromotor function. A negative association between urinary Mn metal and grip strength levels was found in this study. However, the research on the relationship between Mn metal and grip strength levels has been controversial to date, with data from the NHANES (2011–2014) indicating no significant association between blood Mn metal and grip strength levels[3]. This issue may due to variations of the biological samples used, different concentrations of Mn by region and inconsistency in the populations and regions studied. Thus, the relationship between Mn and grip strength levels must be validated based on animal and population evidence.
Pb is a toxic metal that is widely distributed in the environment and accumulates in the body, which causes chronic endogenous damage to tissues and cells[53]. Metallic Pb increases oxidative stress and inflammation through the direct formation of ROS, including singlet oxygen, hydrogen peroxide and hydroperoxides, and depletion of antioxidants such as glutathione[54]. Oxidative stress and inflammation, in turn, play an important role in the development of tissue cells and ultimately lead to cellular damage in muscle tissue[2]. A cross-sectional study on older adults in the USA showed that blood Pb concentrations were associated with the frequency of fatigue, weakness and slowness of movement[53]. However, previous research ignored the interaction between multiple metal elements. The present study showed that mixed exposure to seven metal elements, namely, Cu, As, Sr, Ba, Fe, Pb and Mn, was associated with reduced grip strength through three models, including linear regression, Qgcomp and BKMR. Metallic Pb showed no effect of on grip strength after considering mixed exposure to multiple elements.
The BKMR model revealed potential positive interactions between As and Mn and between Cu and Mn. Limited research has been conducted to investigate this interaction, and the mechanism of the correlation is unclear. The oxidation of As to arsenate under aerobic conditions inhibits the oxidation of Mn(II), which leads to an increase in Mn retention[55]. Another study showed that Cu combined with Mn induces hydroxyl radical formation and reduces glutathione levels[49]. These links can explain the relationships between As and Mn and between Cu and Mn. Further prospective studies are needed to elucidate the effects of As–Mn and Cu–Mn interactions on grip strength levels and explore the potential mechanisms and possibilities for public health interventions.
We found gender specificity between metal and grip strength, which may be due to different hormone levels, metabolism, anatomy, neurochemistry and epigenetic influences[48]. In the current study, we observed a negative correlation between Sr and grip strength of male participants. Such effect was not significant in the female population. The protective effect of oestrogen is a possible explanation for this phenomenon. In postmenopausal women, a decline in oestrogen level leads to endocrine and metabolic dysfunction, which results in osteoporosis, metabolic syndrome and a tendency to lose muscle mass and strength[56]. Oestrogen benefits the skeletal and muscular systems by improving muscle mass and strength and increasing the collagen content of connective tissue[57]. Oestrogen supplementation can maintain and improve muscle function in postmenopausal women or prevent musculoskeletal damage caused by aging[58]. Oestrogen also maintains cellular homeostasis in skeletal muscle, regulates mitochondrial function and reduces oxidative damage through mechanisms mediated by oestrogen-related receptors alpha, beta and gamma, which may counteract a portion of the muscle damage caused by heavy metals[59]. Furthermore, we found an age-specific association between metals and grip strength, with a negative association between Cu metal and grip strength of participants ≥ 60 years of age, which was not significant in those aged 30–59 years, possibly due to an age-dependent increase in Cu. Cohort and animal studies confirmed a significant positive correlation between copper and age[60,61]. During the ageing process, the body undergoes progressive muscle degeneration (i.e. a decline in mass and muscle function). This muscle dysfunction is caused by reduced proliferation of muscle satellite cells and increased levels of inflammatory markers, which cause the increased incidence of sarcopenia in the body[62]. Cu is a heavy element that increases in concentration with age[61]. Excessive Cu concentrations can cause oxidative stress through the induction of hydroxyl radicals, which can have adverse health effects on the body[10]. In addition, We also found that the metal As varied between different ages. Arsenic was negatively associated with handgrip strength in participants aged 30–59 years, but not significant in participants aged 60 years. Similarly, a cross-sectional study from northern Mexico showed a negative correlation with age[63], and since the main source of arsenic was drinking water, the concentration of As in urine was positively correlated with the concentration of As in drinking water[64].While water consumption decreases with age[63], it is therefore reasonable to find an inverse association between As and age.
The current study has several strengths. Firstly, the current study controlled for several important confounding factors, including lifestyle and sociodemographic factors. Secondly, in previous epidemiological studies, the assessment of the association of grip strength levels with multiple metals was challenging. Therefore, we applied the advanced statistical models BKMR and Qgcomp, which were developed for mixed exposures to environmental pollutants. The BKMR model allows the assessment of nonlinear and interactive cumulative effects in metal mixtures and determining whether interactions occur between different elements. Qgcomp enables the assessment of the overall effect of metal mixtures. Nevertheless, our study encountered the following limitations. Firstly, this research is a cross-sectional study, and no causal inferences can be made. Secondly, although this study found an association between Ba and Mn and grip strength, the current research is limited, and the exact mechanism remains unclear. Therefore, further animal and prospective epidemiological studies with large samples are needed to verify the association between Ba, Mn and grip strength. Thirdly, considering that our results were obtained only from the excretion of these metals in the urine, we cannot rule out the possibility of false-positive results. Therefore, further studies using other biomarkers, such as blood, are needed to validate the robustness of our results.
-
In conclusion, this study showed that combined exposure to metal mixtures was negatively associated with grip strength. Cu, Sr and As were negatively correlated with grip strength levels, and there were potential interactions between As and Mn and between Cu and Mn.
-
This study was approved by the Medical Ethics Committee of Guilin Medical College (No. 2018 07 02-3).
-
Informed consent was obtained from all subjects involved in the study.
HTML
Study Population
Measurement of Urinary Metal and Urine Creatinine
Measurement of Handgrip Strength
Covariates
Statistical Analyses
Linear Regression Analysis
Quantile g-computation
Bayesian Kernel Machine Regression
General Demographic Characteristics of the Study Population
Urinary Metal Element Levels in the Study Population
Linear Regression Analysis of the Association between Urine Metal and Grip Strength Levels
Quantile g-computation Analysis of the Association between Mixed Urinary Polymetallic Exposure and Grip Strength
BKMR Model
Sensitivity Analysis
 23230+Supplementary Materials.pdf
|

|

 Quick Links
 DownLoad: