


-
Microplastic pollution is considered one of the most serious global environmental problems, alongside ozone depletion, climate change, and ocean acidification[1], with serious pollution levels reported in terrestrial, aquatic, and atmospheric environments. By 2021, the global annual production of plastics was 391 million tons[2], and microplastic pollution of terrestrial and aquatic ecosystems has gradually attracted public attention. Due to their ability to degrade over time, virgin plastics breakdown to smaller sizes, and the definition of microplastics (MPs, particles with a size of < 5 mm) and nanoplastics (NPs, particles with a size of < 100 nm) emerged[3]. Thus, many studies have explored different particle sizes and concentrations to explore the toxicological effects in vivo and in cell lines. It has been revealed that MPs or NPs could induce gut microbiotadysbiosis, metabolic disorder, and oxidative damage[4-6], and disturb the reproductive, respiratory, digestive, urinary, and central systems[4,7,8]. Since 2020, microplastic particles have been detected in human placenta and colon tissue, and have been associated with glass nodules in the lungs[9-12]. The potential human health risks of nano-/microplastics (NMPs) are therefore of great concern.
There have been few studies of the toxicokinetic differences between MPs and NPs, with most focusing on aquatic organisms[13,14] or cell lines[15]. It has been demonstrated that the toxicity of NMPs was positively related to the particle size[13,16]. In aquatic organisms, MPs tend to accumulate in the intestinal tract[17], resulting in toxic effects such as inducing the innate immune response, activating the complement system, and initiating severe gut microbial disorders. In contrast, NPs can penetrate deeply into tissues and organs[18,19], resulting in serious mucosal damage by triggering apoptosis (the mitochondrial pathway)[14]. In human digestive tract cell lines, 50−500 nm particles were found to have more potential to enter cells than 1−5 μm microspheres[20], and therefore the toxicological characteristics of MPs and NPs in mammals are clearly different.
Interestingly, in the few studies regarding the distribution of NMPs in mammals, the conclusions vary. Li et al.[21] and Stock et al.[22] reported that the MPs in the 1−10 μm size range could not be detected in any organs except the intestine after 28 days oral exposure. However, Deng et al.[6] reported that MPs with diameters of 5 and 20 μm could accumulate in the liver and kidney of mice after 28 days gavage. For NPs, Ding et al.[23] found that particles with a diameter of 60 nm could accumulate in the stomach, intestine, and liver of mice, although they were not detected in the heart, lung, and spleen after three days exposure. Nanoparticles with a diameter of 100 nm were proven to accumulate in the spleen, lung, kidney, small intestine, large intestine, testis, and brain of mice after oral exposure for 28 days[24]. These studies suggest that NPs can penetrate deep into the body and MPs might have the same potential. Overall, the extent of penetration is both size and exposure time dependent. However, as a fundamental aspect of toxicokinetics, the distribution of NMPs with different sizes in vivo after a single exposure has not yet been completely determined. Our previous studies[25,26] have shown that NMPs with a particle diameter of < 3 μm easily entered the blood circulation system and penetrated the blood-brain and blood-testis barriers after the receipt of a single dose of 200 mg/(kg∙body weight). The uptake of NMPs with different sizes by other organs/tissues after a single exposure still needs to be investigated.
This study was designed to clarify the peak uptake time of NPs into blood and their subsequent biodistribution in vivo for NMPs in mammals after a single oral exposure. Because fluorescent polystyrene (PS) is currently the only available product to purchase, we first focused on the toxicokinetic properties of PS microspheres. Polystyrene has become one of the predominant plastics used daily in decoration, lighting installations, packaging, and single-use items. Polystyrene microspheres have also been widely added to powder and emulsion cosmetics. We believe that the results of this study supplement our previous reports of the biodistribution of NMPs in different organs/tissues. Single exposures of PS microspheres with fluorescent dyes in different sizes (100 nm, 3 μm, and 10 μm) were given to male Kunming strain mice by oral gavage. Blood and organ/tissue distributions of NMPs were investigated at different time points using the IVIS Spectrum small-animal imaging system over 4 h. A histological examination was conducted to confirm the presence of NMPs in vivo.
-
Fluorescent PS NMPs with diameters of 100 nm (Cat# G100), 3 μm (Cat# G0300B), and 10 μm (Cat# G1000B) were purchased from Thermo Fisher Scientific (Waltham, MA, USA). The basis for the size selection of NMPs was described in our previous study[25,26]. The fluorescent dyes had a green color and were packaged in deionized water with trace amounts of surfactant. The excitation spectrum was 488 nm and the emission spectrum was 508 nm. The concentration of fluorescent PS NMPs was 1% solids by weight, which represented 1.8 × 10¹⁶ particles/L for 100 nm, 7.5 × 10¹¹ particles/L for 3 μm, and 1.9 × 10¹⁰ particles/L for 10 μm, respectively. They were stored at 4 °C in the dark and reversed gently before use. Their characteristics were examined by transmission electron microscopy (TEM, 200kV, JEM-2100F, JEOL, Tokyo, Japan)[25]. The extent of fluorescent dye leaching and impact of the pH value were determined in our previous study[25].
-
Seventy-two male Kunming strain mice (20 ± 1 g) were purchased from Beijing HFK Bioscience Co., Ltd., China (license number: 1103221911010176). All mice were acclimated under specific pathogen-free conditions for at least 1 week prior to starting the experiment. Animals were housed in the Laboratory Animal Center of China Medical University, and kept on a 12-h light/dark cycle at a constant temperature (± 2 °C) and humidity (45%−60%). Food and water were available ad libitum to the animals, but they were fasted for 12 h before the test procedure. The experimental protocol was approved by the Ethical Requirements of Experimental Animals of China Medical University (NO: CMU2019216).
-
Mice were randomly assigned to the control (0.9% normal saline, n = 12), 100 nm (n = 12), 3 μm (n = 12), and 10 μm (n = 12) groups. All mice were given the same volume of NMPs-containing solution (400 μL) in a single high dose [200 mg/(kg∙body weight)], and the observation time points were set as 0.5, 1, 2, and 4 h after exposure. The oral gavage doses of fluorescent PS NMPs were chosen based on our previous study[25,26]. Animals were anesthetized by an intraperitoneal injection of 1% sodium pentobarbital at a dose of 40 mg/kg. After gavage, three mice in each group were sacrificed at the same observation time for fluorescent imaging. Mice were euthanized by cervical dislocation and tissue samples including heart, lung, liver, spleen, kidney, bladder, skeletal muscle, stomach, small intestine, large intestine, and excrement (in the colon) were taken and fluorescence intensity (FI) was measured.
In our previous study[14], we used 100 nm microspheres with a concentration of 200 mg/(kg∙body weight) to explore the distribution of PS microspheres in blood after one oral gavage. Blood samples were collected from eye socket using a sterile curved dressing forceps and then mice were sacrificed. Ten microliters of collected blood was placed on a glass slide, then fluorescence Imaging was performed.
The results revealed that the FI increased significantly at 0.5, 1, and 2 h, with the highest level at 0.5 h after exposure. In contrast, no changes were observed for the 3 and 10 μm groups in blood. To further confirm the peak time of NPs uptake from the gastrointestinal tract into the blood circulation, we designed an additional oral gavage at doses of 250 mg/(kg∙body weight). The observation intervals were set to 5, 15, 30, and 45 min, and three mice were killed at each time point (n = 24).
-
The FI (λEx 505 nm, λEm 515 nm) of different tissues was measured using an IVIS Spectrum small animal imaging system (PerkinElmer, Inc. Waltham, MA, USA). At each observation time point, the same tissues from animals in the NMPs treated and control groups were placed on one piece of black paper and imaged simultaneously. A 100 μL blood sample was taken and the FI was measured using the same method as for the solid tissue. The region of interest was selected from the whole tissue for the fluorescence analysis, and the total radiation efficiency unit of the selected region was used to indicate the FI. In all calculations, the radiation efficiency was corrected for tissue weight (g) and volume (mL)[1]. For blood, even at the same volume, the fluidity of the liquid resulted in the variation of radiant area (cm2). Thus, the radiation area was further corrected when the fold was calculated.
-
After fluorescence imaging, tissue samples were immersed in fixative for at least 24 h, and solid tissues with significant FI were taken for a histological examination. The samples were placed in 75% to 100% alcohol, xylene, and paraffin for an appropriate time for dehydration and paraffin infiltration. Embedding was performed by processing tissue samples in melted paraffin in cassettes. The embedded samples were frozen at −20 °C until the paraffin was completely solidified. The paraffin block was removed and trimmed accordingly. Finally, 4 µm sections were stained with hematoxylin and eosin (H&E) and DAPI dye, respectively.
-
Our previous study found no fluorescence leakage in the NMPs used in our study, and no morphology or diameter changes occurred during the co-incubation of NMPs with an acidic solution of pH 2.16 for 24 h, suggesting that the NMPs microspheres had stable characteristics[15]. All surgical instruments were washed with ultrapure water and thoroughly disinfected before dissection. The tissues were rinsed three times with 0.9% normal saline to avoid cross-contamination from blood and dried with filter paper. The outside and inside of the stomach, large intestine, and small intestine were rinsed to reduce interference from residues. All tubes, filter papers, saline solutions, black paper, and food and drinking water given to animals were analyzed by the IVIS Spectrum to avoid fluorescence contamination. The imaging results showed that there was no fluorescence in the feeding water, but the food contained a strong fluorescence signal.
-
Instead of autofluorescence, we used fold-fluctuation (mean radiant intensity of tissue in the NMPs group/mean radiant intensity of tissue in the control group) to represent changes in FI. To improve the background stability of FI, the FI of the control group at different time points was combined into an overall mean when compared with the NMPs treated groups.
Data were expressed as the mean ± standard deviation (SD). The FI and fold-increase values were analyzed separately. The differences among different time points were analyzed using a one-way analysis of variance (ANOVA) followed by the post hoc analysis (LSD) for multiple comparisons. A P < 0.05 was considered significant. The SPSS 13.0 software (SPSS Co., Ltd., Chicago, IL, USA) was used to perform all data analyses.
-
Oral gavage at a volume of 400 μL normal saline [200 mg/(kg∙body weight)] was given to the mice in the control group. The IVIS Spectrum imaging showed that the FI of different tissues varied greatly (Table 1). Of all the organs collected, the heart had the lowest intensity of autofluorescence. In contrast, the FI of excrement and the large intestine was high, more than 18 and 15 times greater than that of the heart, respectively. In the quality control step, we tested the food and water consumed by the animals in advance and found that the food contained a strong fluorescence signal. Although we previously fasted the animals for at least 12 h, the data for the digestive system may have been elevated due to the food residues. Except for the small intestine (P = 0.043), there was no statistically significant difference in the other tissues at the different time points. This difference could have been caused by food residues.
Organs/tissues Different time points (Mean ± SD) 0.5 h (n = 3) 1 h (n = 3) 2 h (n = 3) 4 h (n = 3) Total Excrement 277.90 ± 114.01 216.66 ± 37.82 289.96 ± 108.78 155.04 ± 42.63 234.89 ± 90.92 Large intestine 235.95 ± 97.01 213.92 ± 64.14 176.70 ± 35.30 149.55 ± 67.29 194.03 ± 68.68 Stomach 136.24 ± 73.77 167.07 ± 60.01 202.77 ± 62.81 135.92 ± 19.57 160.50 ± 57.06 Bladder 109.20 ± 21.35 182.18 ± 143.60 155.57 ± 7.12 127.20 ± 23.96 143.54 ± 69.19 Small intestine 78.67 ± 12.57 180.44 ± 58.70 69.18 ± 1.01 78.38 ± 10.44 101.67 ± 54.29 Lung 34.26 ± 4.08 31.34 ± 4.06 34.45 ± 6.50 42.14 ± 9.84 35.55 ± 6.98 Skeletal muscle 31.19 ± 4.51 29.68 ± 4.46 30.89 ± 5.96 28.55 ± 8.88 30.08 ± 5.41 Liver 26.63 ± 4.68 20.77 ± 2.97 24.38 ± 0.55 29.47 ± 5.50 25.31 ± 4.71 Kidney 23.56 ± 2.01 23.94 ± 5.39 22.99 ± 2.51 24.92 ± 5.81 23.85 ± 3.72 Spleen 22.86 ± 11.13 16.53 ± 1.87 13.34 ± 0.85 9.59 ± 3.23 15.58 ± 7.15 Heart 11.88 ± 0.39 13.38 ± 5.01 12.63 ± 1.52 13.08 ± 0.97 12.74 ± 2.35 Table 1. Tissue fluorescence intensity in the control group at different time points (unit: [(p/sec)/(uW/cm2)]/g, 1.00 × 10⁸)
-
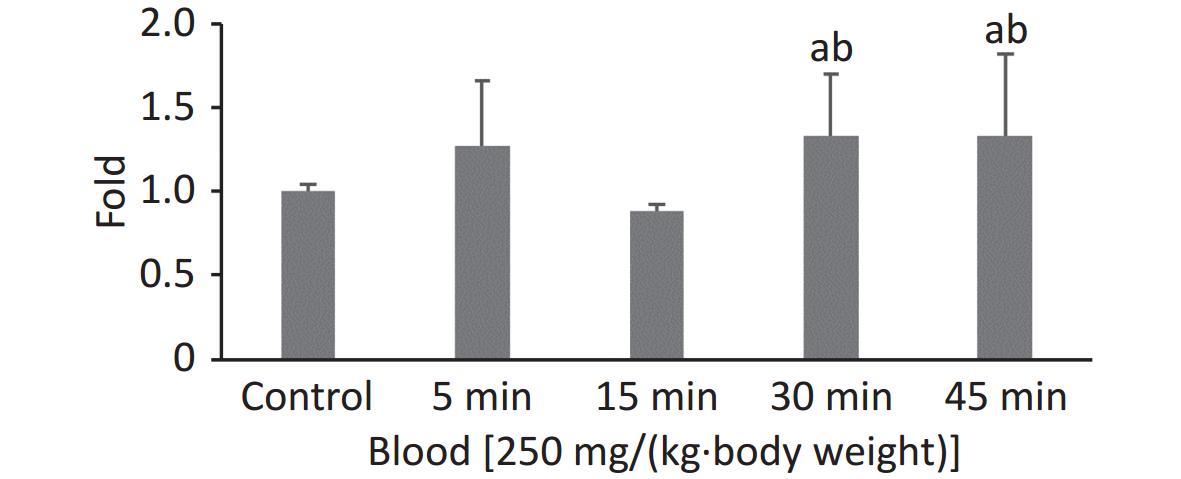
In our previous study, the highest FI in the 100 nm PS group was observed at 0.5 h when the observation intervals were set to 0.5, 1, 2, and 4 h. To explore the exact absorption peak times, additional experiments were carried out using 100 nm fluorescent microspheres at higher doses [250 mg/(kg∙body weight)] and shorter time intervals (t = 5, 15, 30, and 45 min). The results are shown in Figure 1. Even when the exposure dose was increased, the highest FI in blood was still observed at t = 0.5 h (P < 0.05).
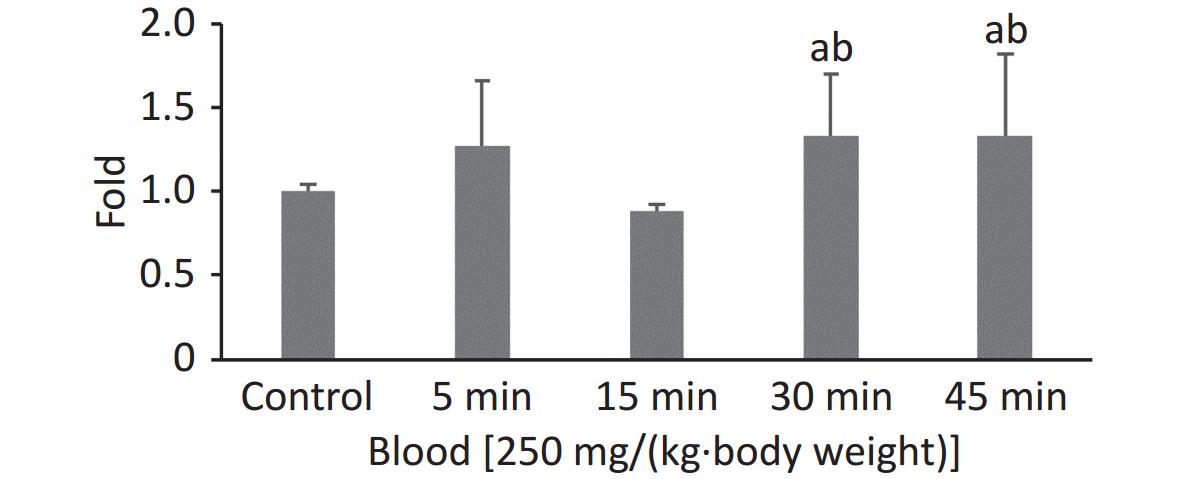
Figure 1. Time course changes of fluorescence intensity in blood after administering 100 nm fluorescent microspheres by gavage at a dose of 250 mg/(kg∙body weight). a: compared with control, P < 0.05; b: compared with 15 min.
-
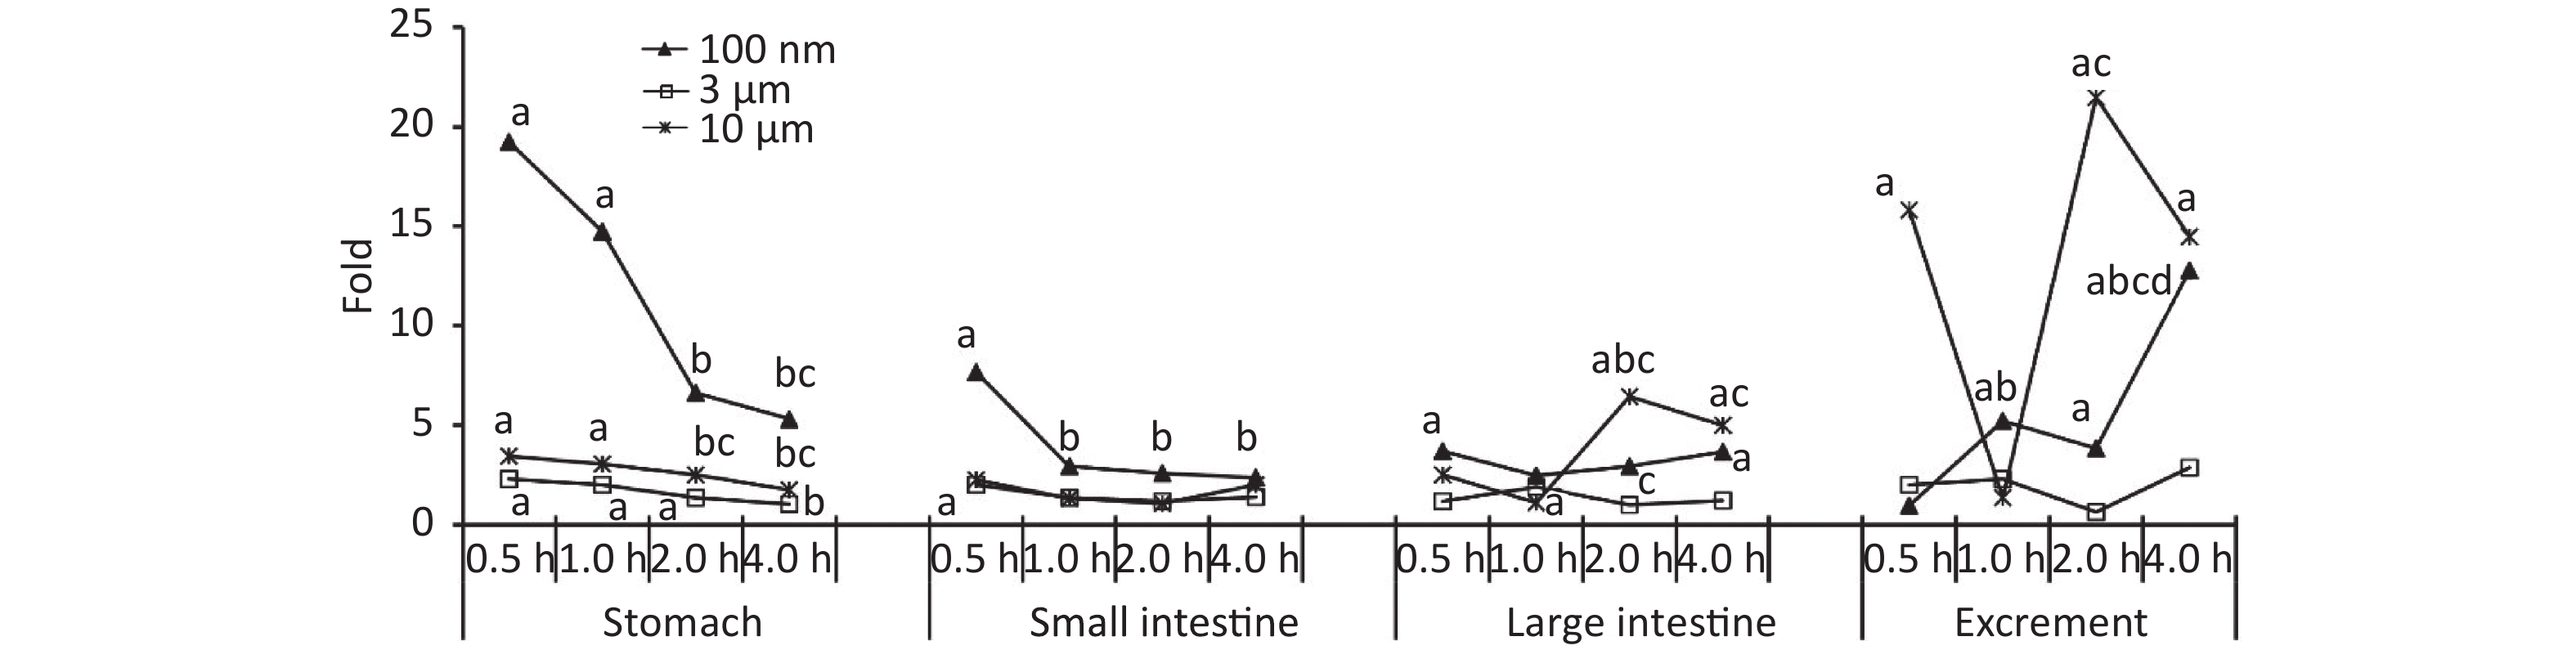
Figure 2 shows the time course of FI in the digestive system. At 0.5 h after the administration of 100 nm NPs, the FI of the stomach, small intestine, and large intestine were 19.24, 7.67, and 3.70 times higher than in the control group, respectively (P < 0.05). For the stomach and small intestine, the highest FI occurred at 0.5 h, and then began to decrease, eventually reaching the same level as the control group. In contrast, there was an increasing trend in excrement. The FI began to increase significantly from 1 h, and the highest level occurred at 4 h after exposure (12.79 times, P < 0.05). Similar trends were detected in the 3 μm group. The FI of the stomach and small intestine peaked at 0.5 h (stomach 2.32 times higher, small intestine 2.03 times higher, P < 0.05), then gradually decreased over time, and declined to the same level as the control group at 4 h. The FI of the large intestine increased at 1 h (1.91 times higher, P < 0.05), and then followed a decreasing trend, and the changes in excrement were not significant. In the 10 μm group, the FI in the stomach increased by approximately 3 times at 0.5, 1, and 2 h (P < 0.05), and displayed a downward trend. No significant change was found in the small intestine. From 2 h, the levels in the large intestine and excrement increased significantly (large intestine 6.43 times, stool 21.46 times, P < 0.05), and still maintained a high level compared with the control group at 4 h (P < 0.05).
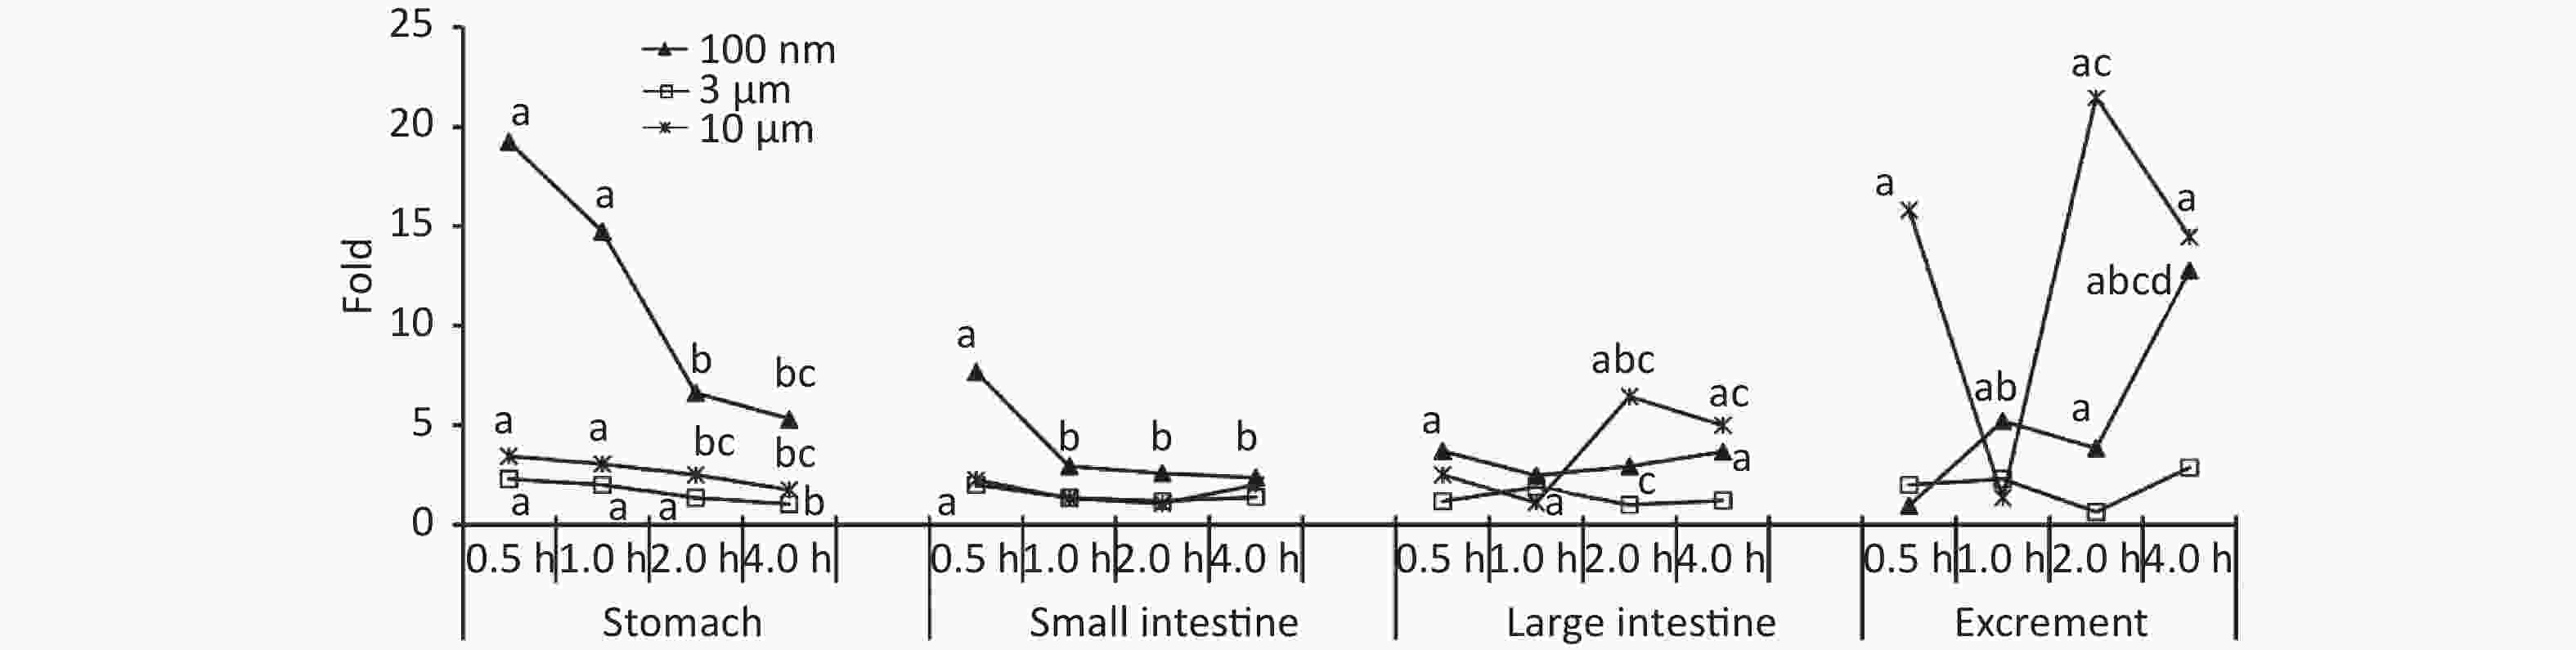
Figure 2. Time course changes of fluorescence intensity in stomach, small intestine, large intestine, and excrement after administering NMPs by gavage at a dose of 200 mg/(kg∙body weight). a: compared with control, P < 0.05; b: compared with 0.5 h, P < 0.05; c: compared with 1 h, P < 0.05; d: compared with 2 h, P < 0.05. NMPs, nano-/microplastics.
-
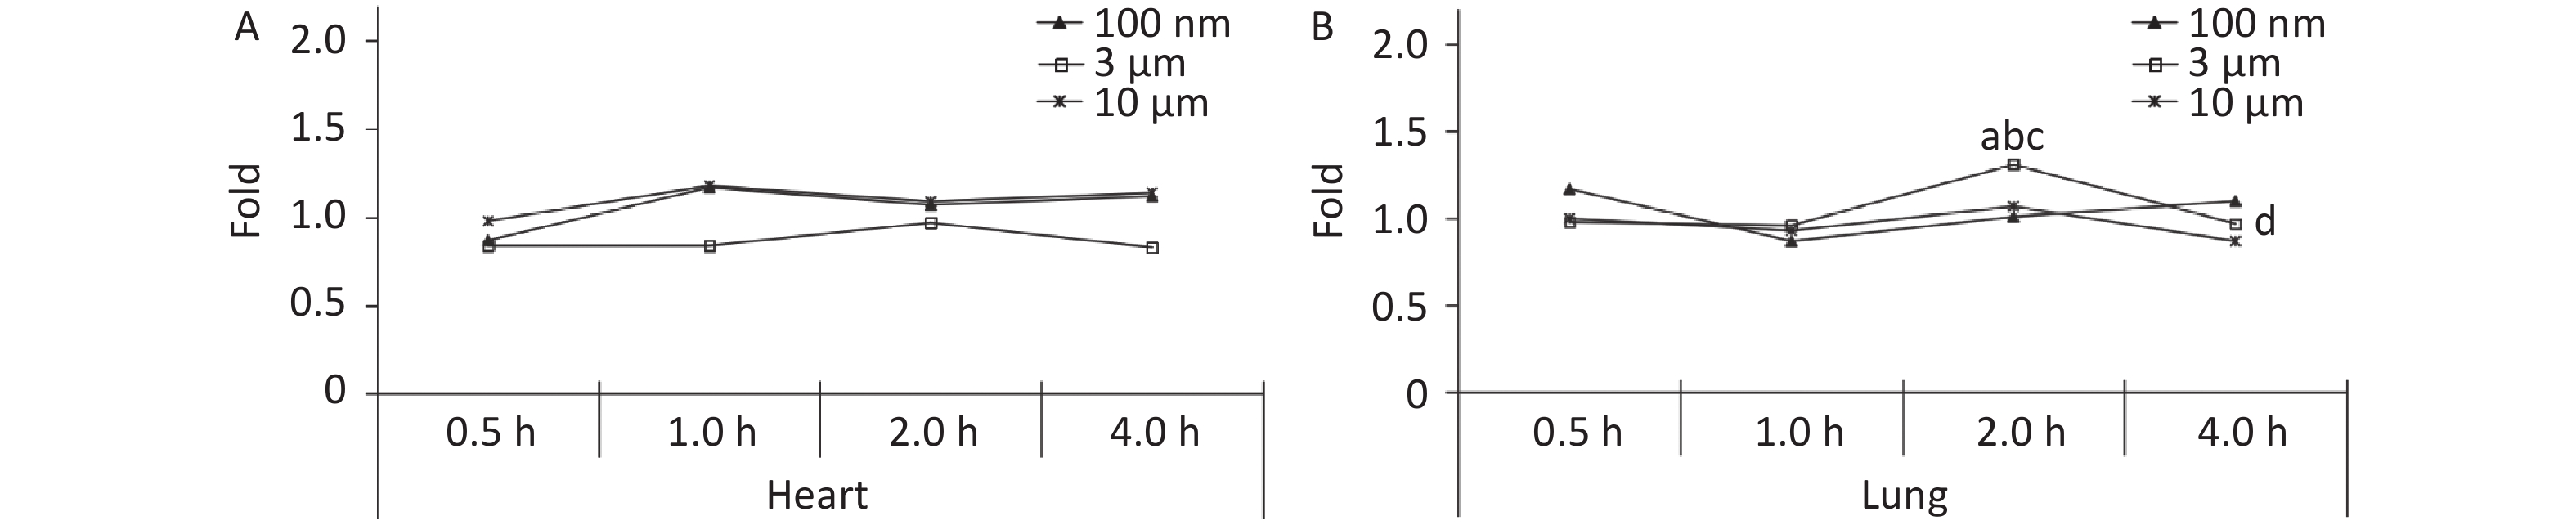
There was no significant difference between the three treatment groups compared with the control group at different observation time points in the heart (P > 0.05, Figure 3A). The FI in the lung peaked at 2 h (1.31 times higher, P < 0.05), and decreased to the control level (0.97 times) at 4 h after exposure in the 3 μm group. There was no significant increase in the 100 nm and 10 μm groups at any time points after the oral gavage (Figure 3B).
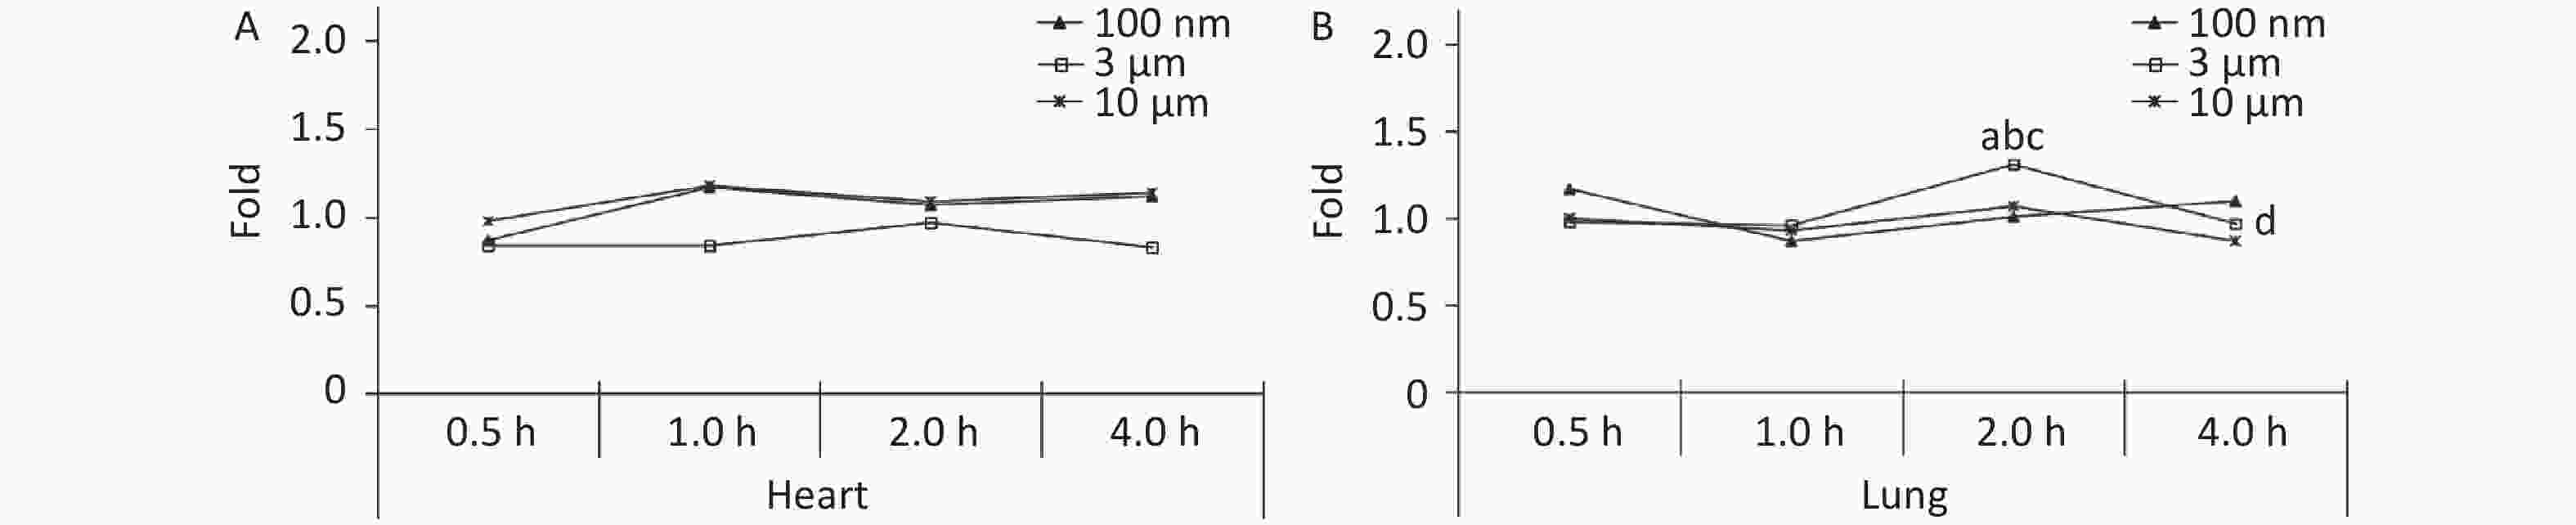
Figure 3. Time course changes of fluorescence intensity in heart (A) and lung (B) after administering NMPs by gavage at a dose of 200 mg/(kg∙body weight). a: compared with control, P < 0.05; b: compared with 0.5 h, P < 0.05; c: compared with 1 h, P < 0.05; d: compared with 2 h, P < 0.05. NMPs, nano-microplastics.
-
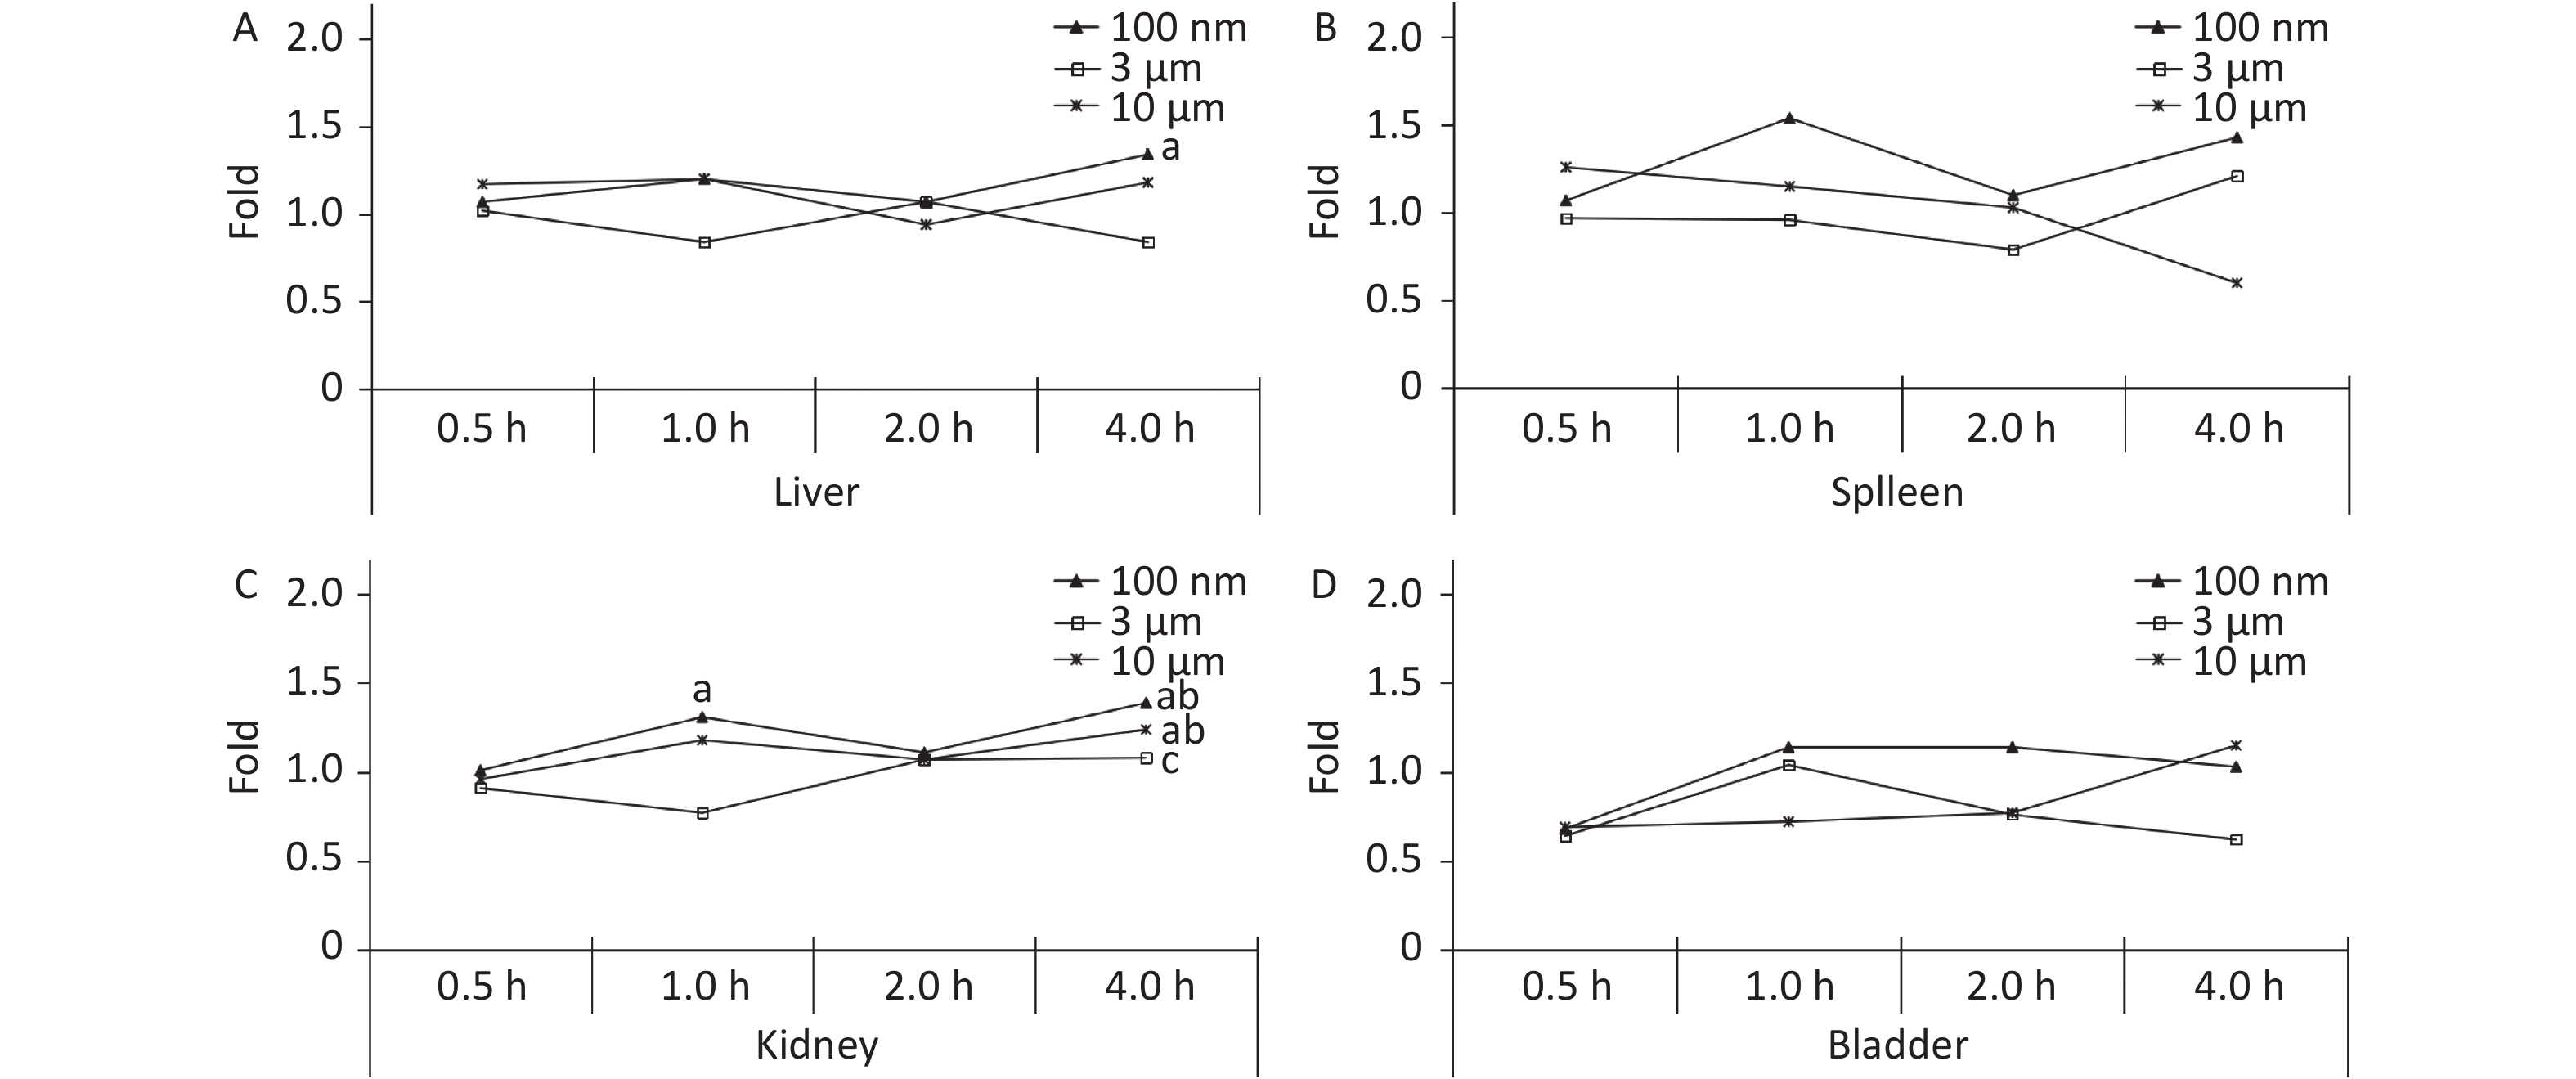
The liver, spleen, kidney, and bladder are abdominal organs, and their anatomical position prevented direct contact with NMPs from oral administration. The only significant increase in FI was found in the liver at 4 h (1.34 times higher, P < 0.05) in the 100 nm group. No significant difference was found in the 3 and 10 μm groups compared with the control group at each observation time point (Figure 4A). In the kidney, the FI began to increase slightly after 1 h, and reached a peak at 4 h in the 100 nm group (1.39 times higher, P < 0.05) compared with the control group. The FI curve of the 10 μm group showed the same fluctuations, and the highest level reached 1.24 times at 4 h (P < 0.05). There was no significant change in the 3 μm group (Figure 4C), and there was no significant change observed in the spleen and bladder (Figure 4B and 4D).
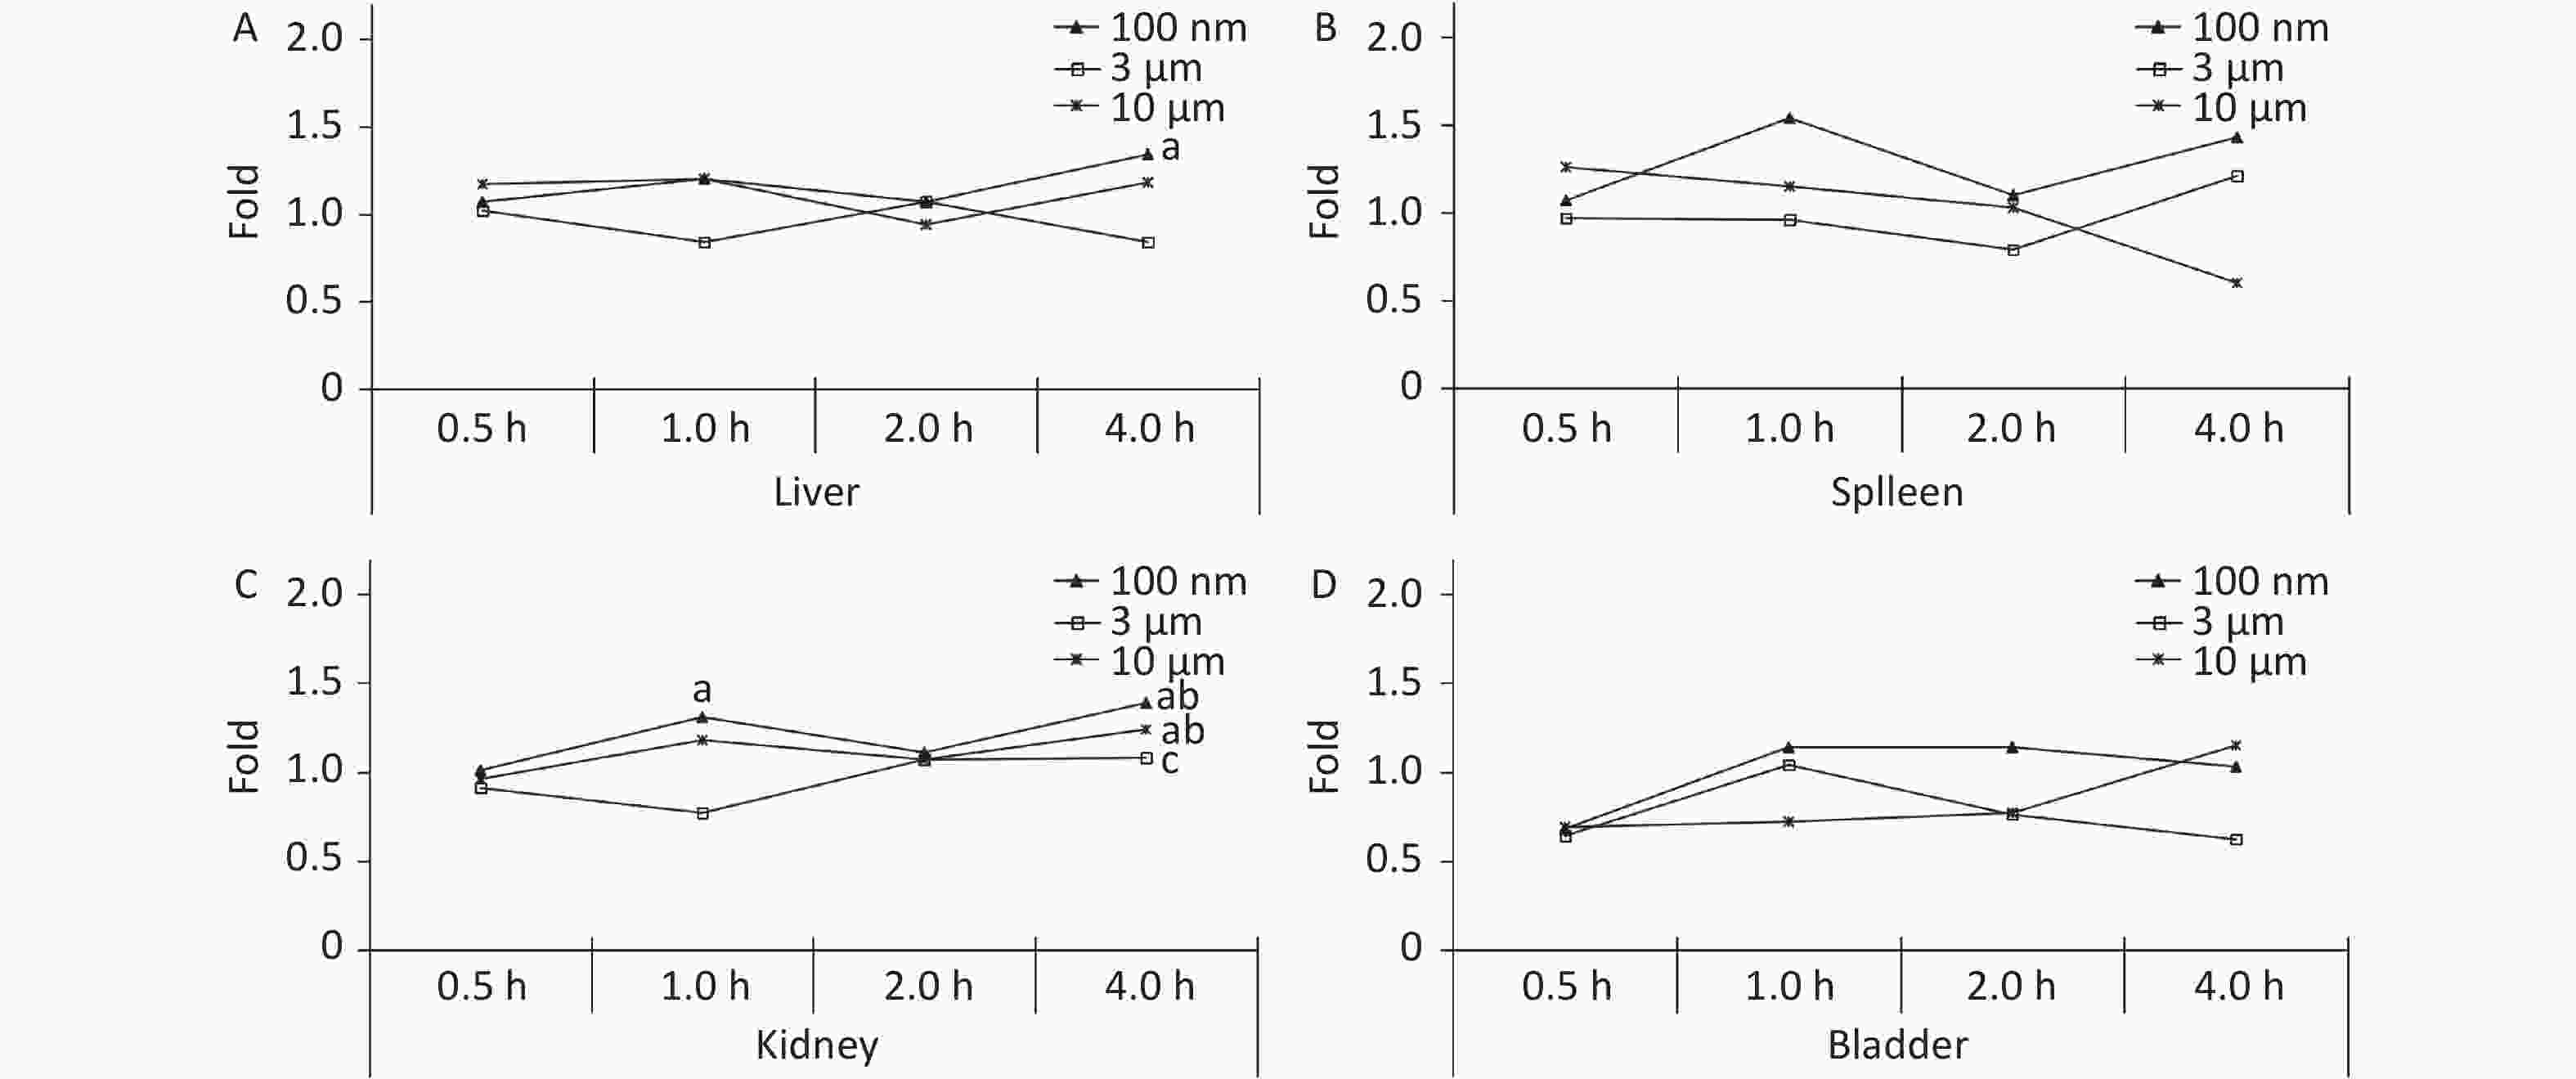
Figure 4. Time course changes of fluorescence intensity in liver (A); spleen (B); kidney (C); bladder (D) after administering NMPs by gavage at a dose of 200 mg/(kg∙body weight). n = 3; a: compared with control, P < 0.05; b: compared with 0.5 h, P < 0.05; c: compared with 1 h, P < 0.05. NMPs, nano-/microplastics.
-
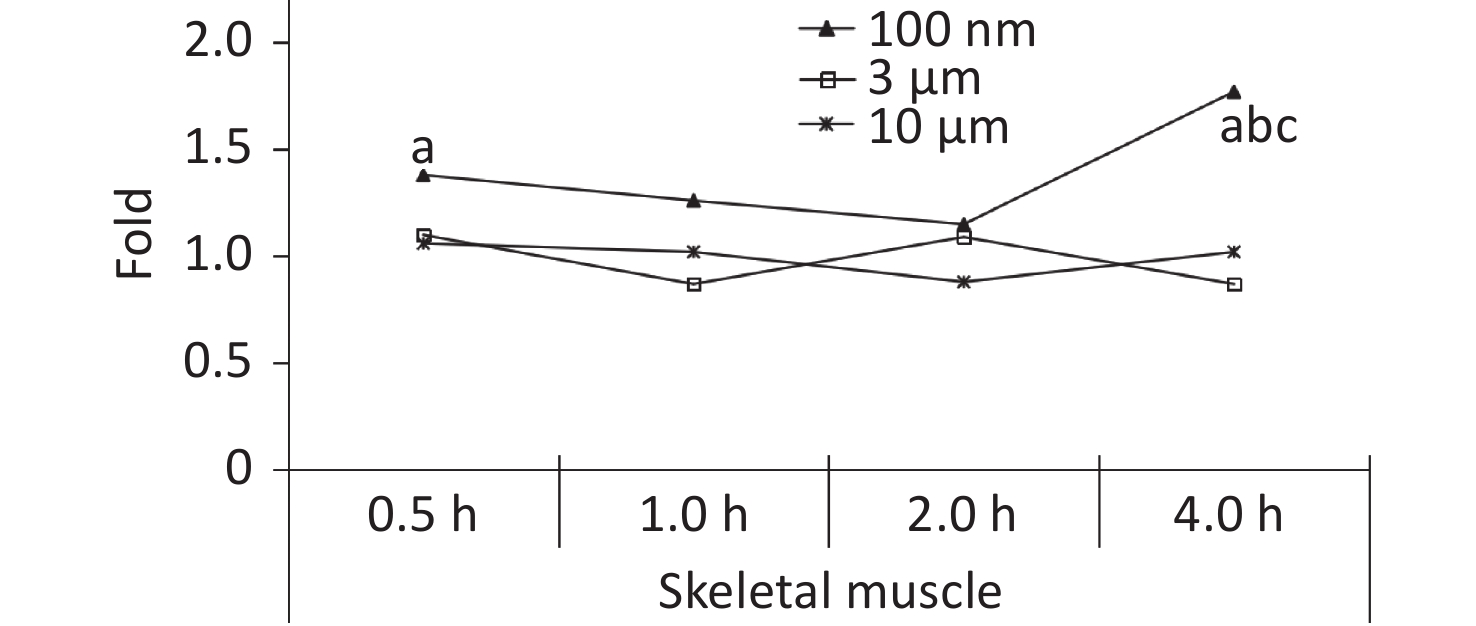
Skeletal muscle accounts for about 30%−40% of mammalian body weight[23], and it receives a large blood supply, especially when the animal undertakes physical activity. In our previous study, the FI increased significantly in the blood at 0.5 h after the oral gavage, and was maintained at a relatively high level at 4 h. It was therefore assumed that NMPs would accumulate in the skeletal muscle through blood circulation. Therefore, the skeletal muscle of the animals was collected for observation in this experiment. The IVIS Spectrum results showed that an increased FI was only observed at 4 h after exposure in the 100 nm group, which was statistically significant compared to the control group (1.77 times, P < 0.05). However, no change in FI was observed in the 3 and 10 μm groups (Figure 5).
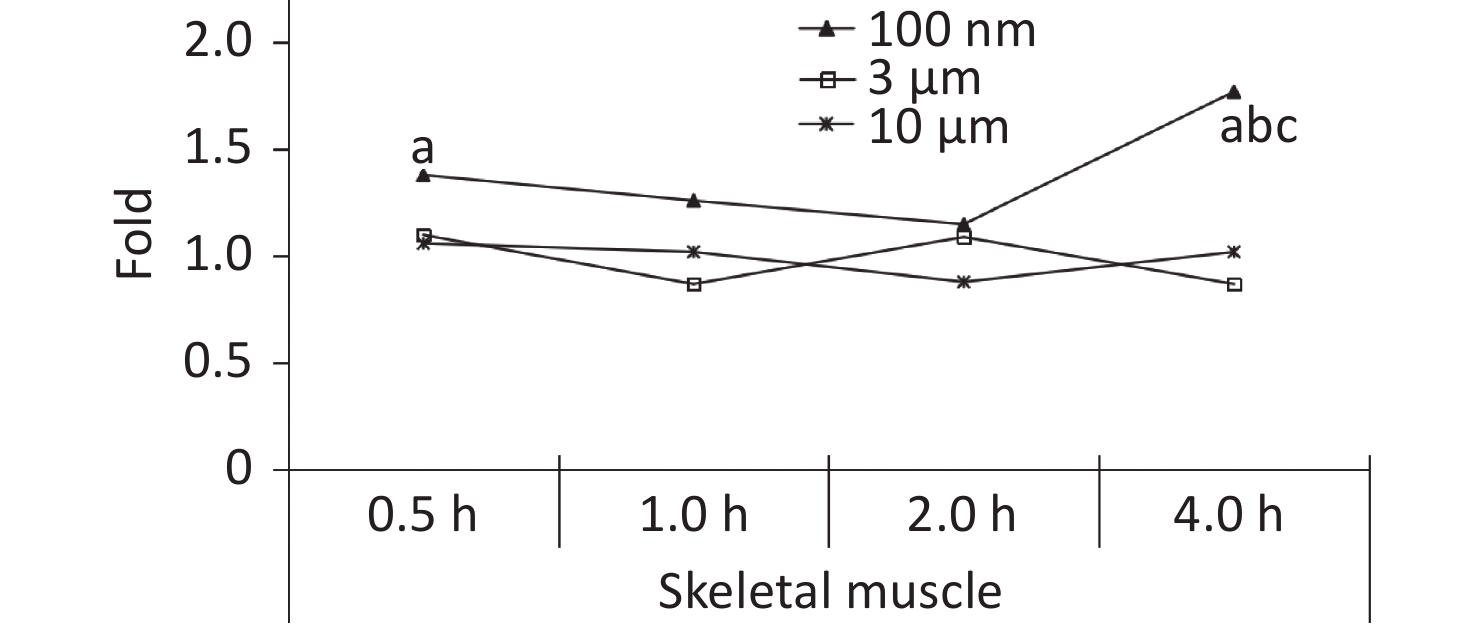
Figure 5. Time course changes of fluorescence intensity in skeletal muscle after administering NMPs by gavage at a dose of 200 mg/(kg∙body weight). n = 3; a: compared with control, P < 0.05; b: compared with 1 h, P < 0.05; c: compared with 2 h, P < 0.05. NMPs, nano-/microplastics.
-
To confirm the results obtained from the IVIS Spectrum, we further performed H&E staining to verify the changes in fluorescence signals. The mice with the strongest FI at any observational timepoint compared with its control group were selected to perform H&E staining. Samples of stomach at 0.5 h in all NMPs treated groups; small intestine at 0.5 h in the 100 nm and 3 μm treated group; large intestine at 0.5 h in the 100 nm treated group, 1 h in the 3 μm treated group and 2 h in the 10 μm treated group; lung at 2 h in the 3 μm treated group, liver at 4 h in the 100 nm treated group, kidney at 4 h in the 100 nm and 10 μm treated groups, and skeletal muscle at 4 h in the 100 nm treated group, were therefore examined. The H&E staining results are shown in Figures 6−7.
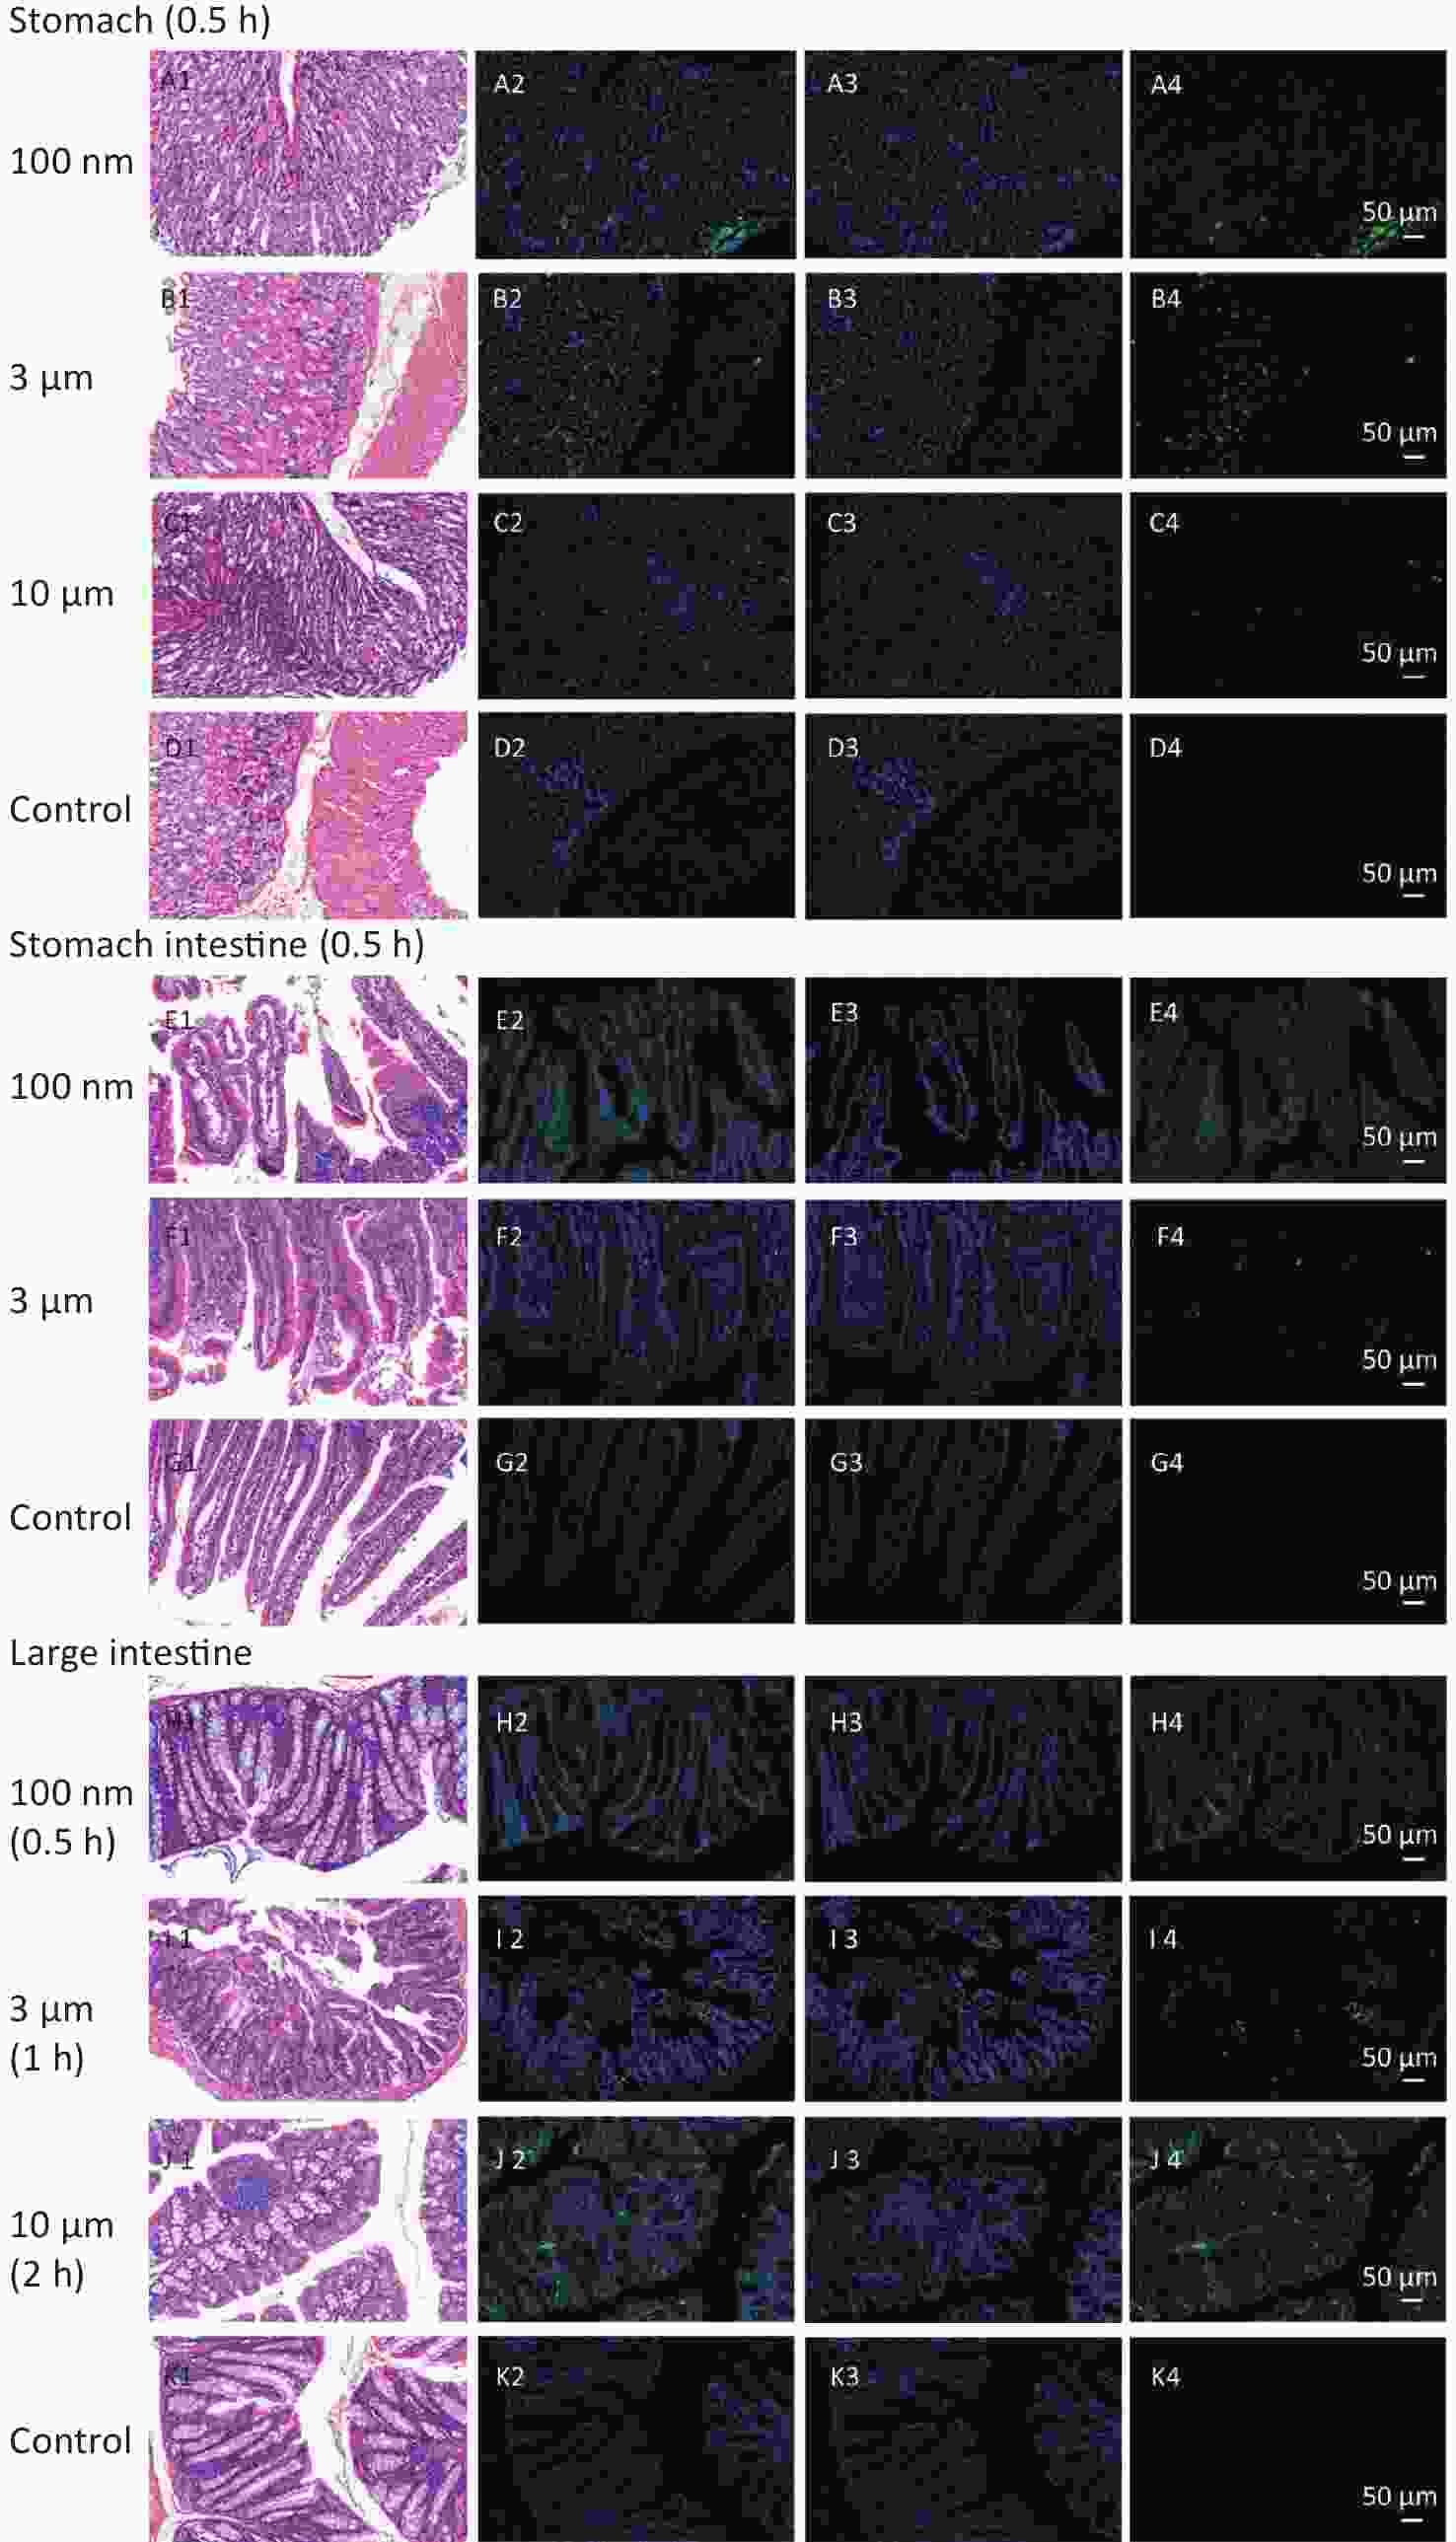
Figure 6. Histological examination of the digestive system (200×). The first column is the image of H&E staining. The second is the merge of both fluorescence microspheres and DAPI dye. The third is the fluorescence image of DAPI dye. The fourth is the fluorescence image of fluorescence microspheres (green). DAPI, 4',6-diaminidine-2-phenylindole.
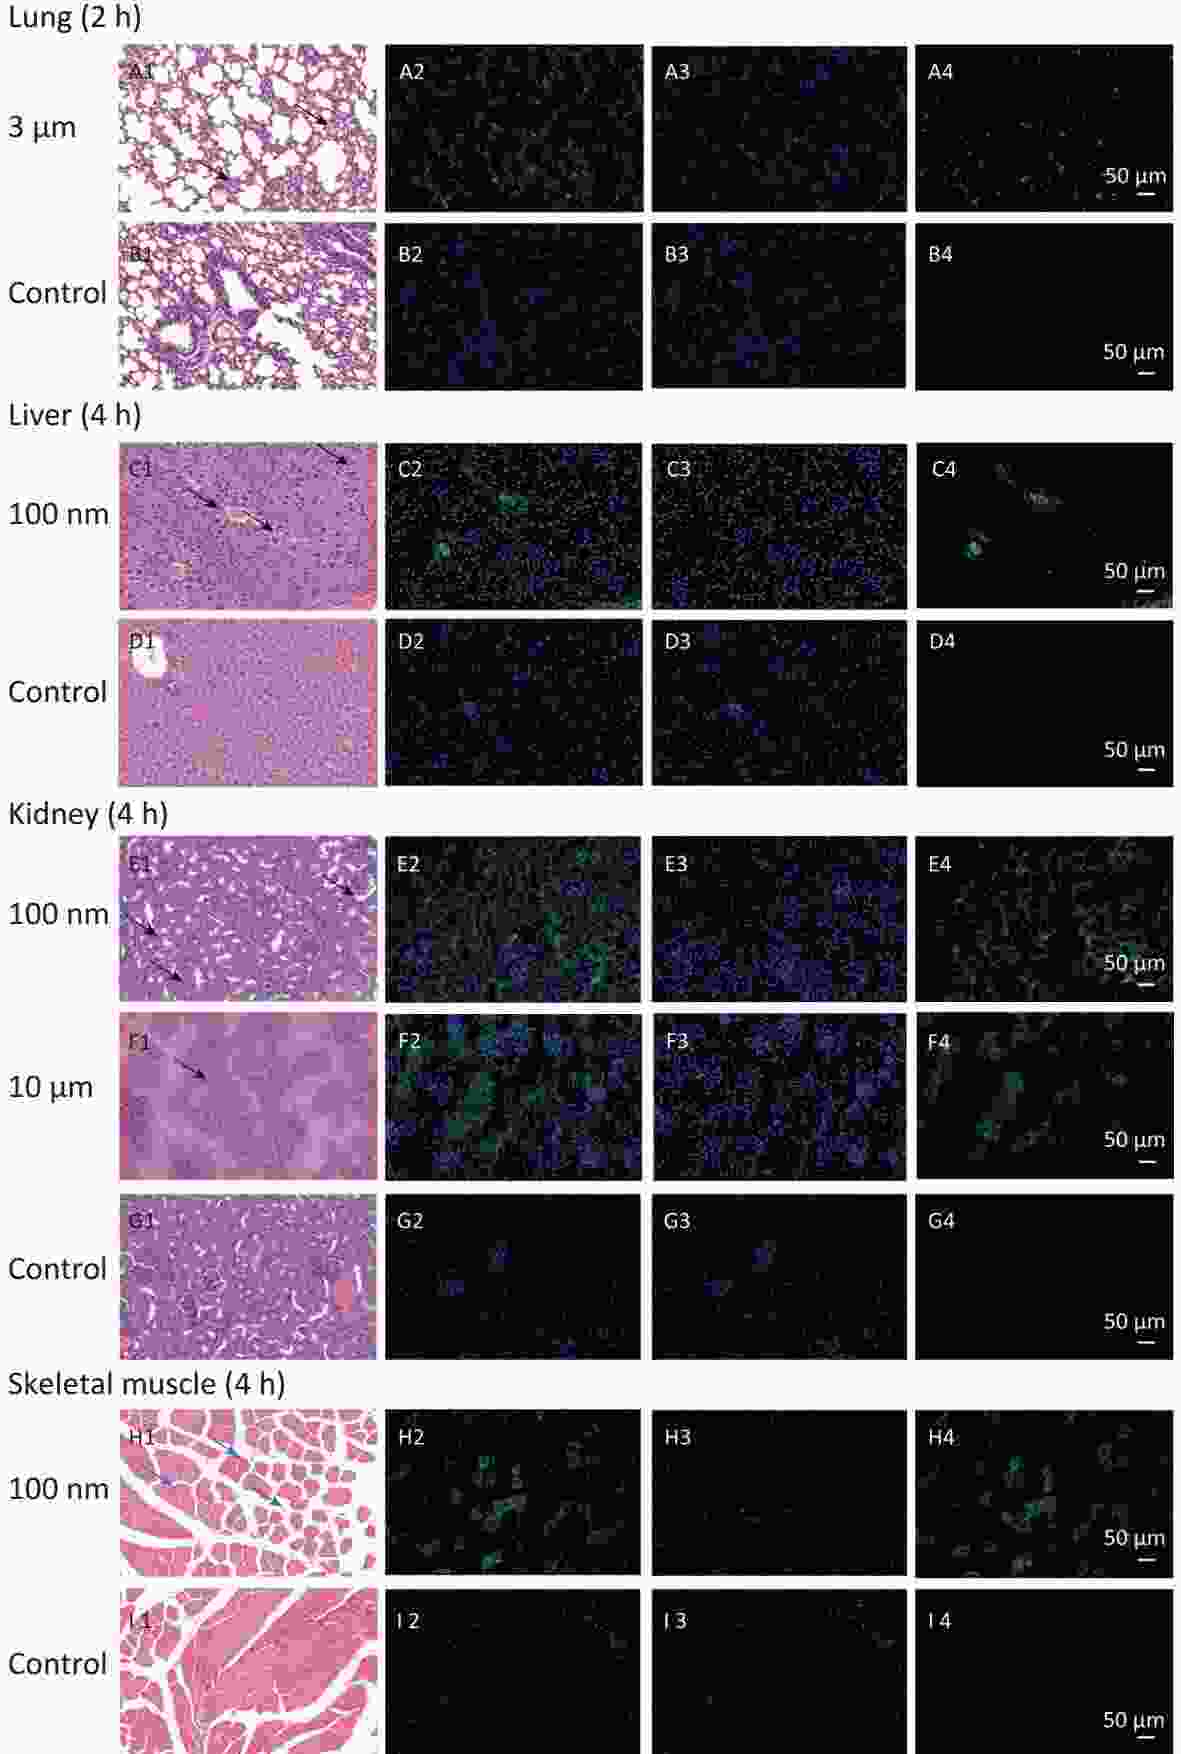
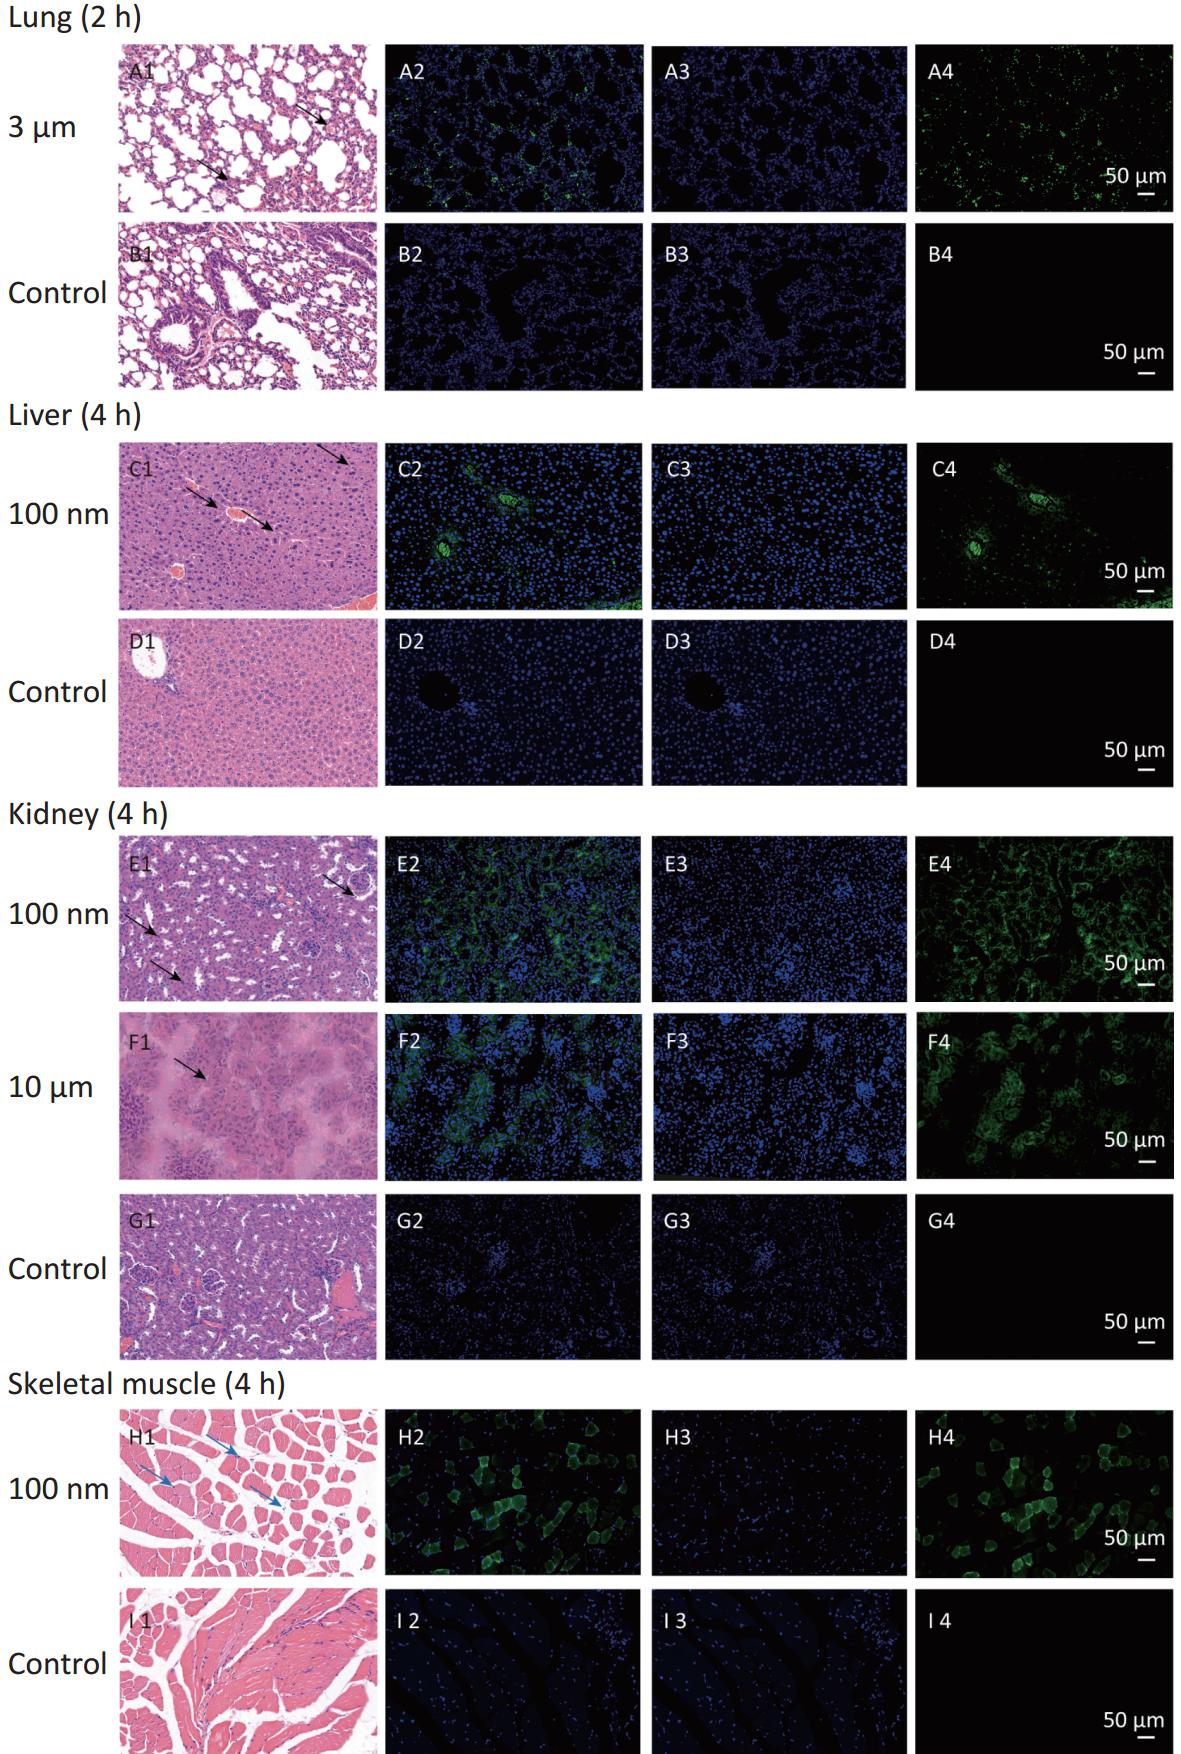
Figure 7. Histological examination of lung, liver, kidney and skeletal muscle (200×). The first column is the image of H&E staining. The second is the merge of both fluorescence microspheres and DAPI dye. The third is the fluorescence image of DAPI dye. The fourth is the fluorescence image of fluorescence microspheres (green). DAPI, 4',6-diaminidine-2-phenylindole. Black arrows indicate inflammation.
In the digestive system, the largest FI was found in the stomach and small intestine in the 100 nm group. By contrast, in the large intestine, a stronger FI was detected in the 10 μm group than in the 100 nm and 3 μm groups (Figure 6). Most fluorescence signals were found in the mucosal layer in the large intestine, and the magnitude of the fluorescence signals gradually decreased from the muscular layer to the serosa membrane (Figure 6H–J). The histological analysis of small intestine showed that mucosal injury, epithelial damage, disintegration of the lamina propria, hemorrhage, accompanied by slight infiltration of inflammatory cells were detected in the 100 nm group, whereas, swelling and congestion of the intestinal villi and exfoliation of epithelial cells were shown in the 3 μm group (Figure 6E2–J2). By contrast, there was no hyperemia or significant infiltration of inflammatory cells in the 10 μm group.
In observed organ/tissues, no evidence of changes in cellular structure was shown in 3 and 10 μm groups. In 100 nm group, only mild congestion and small amounts of inflammatory cells were shown in lung. Slight congestion and vacuolation in the cytoplasm of the hepatocytes were found in liver. Stronger fluorescence signals were also found in the central vein of the liver and lung (Figure 7 and Supplementary Figure S1, available in www.besjournal.com). In the kidney, the glomerulus was swollen and neutrophilia was infiltrated slightly. In the skeletal muscle, the inward migration appeared in muscle fiber cell nucleus and the distance between muscle cells increased, accompanied by an uneven size and shape (Figure 7).
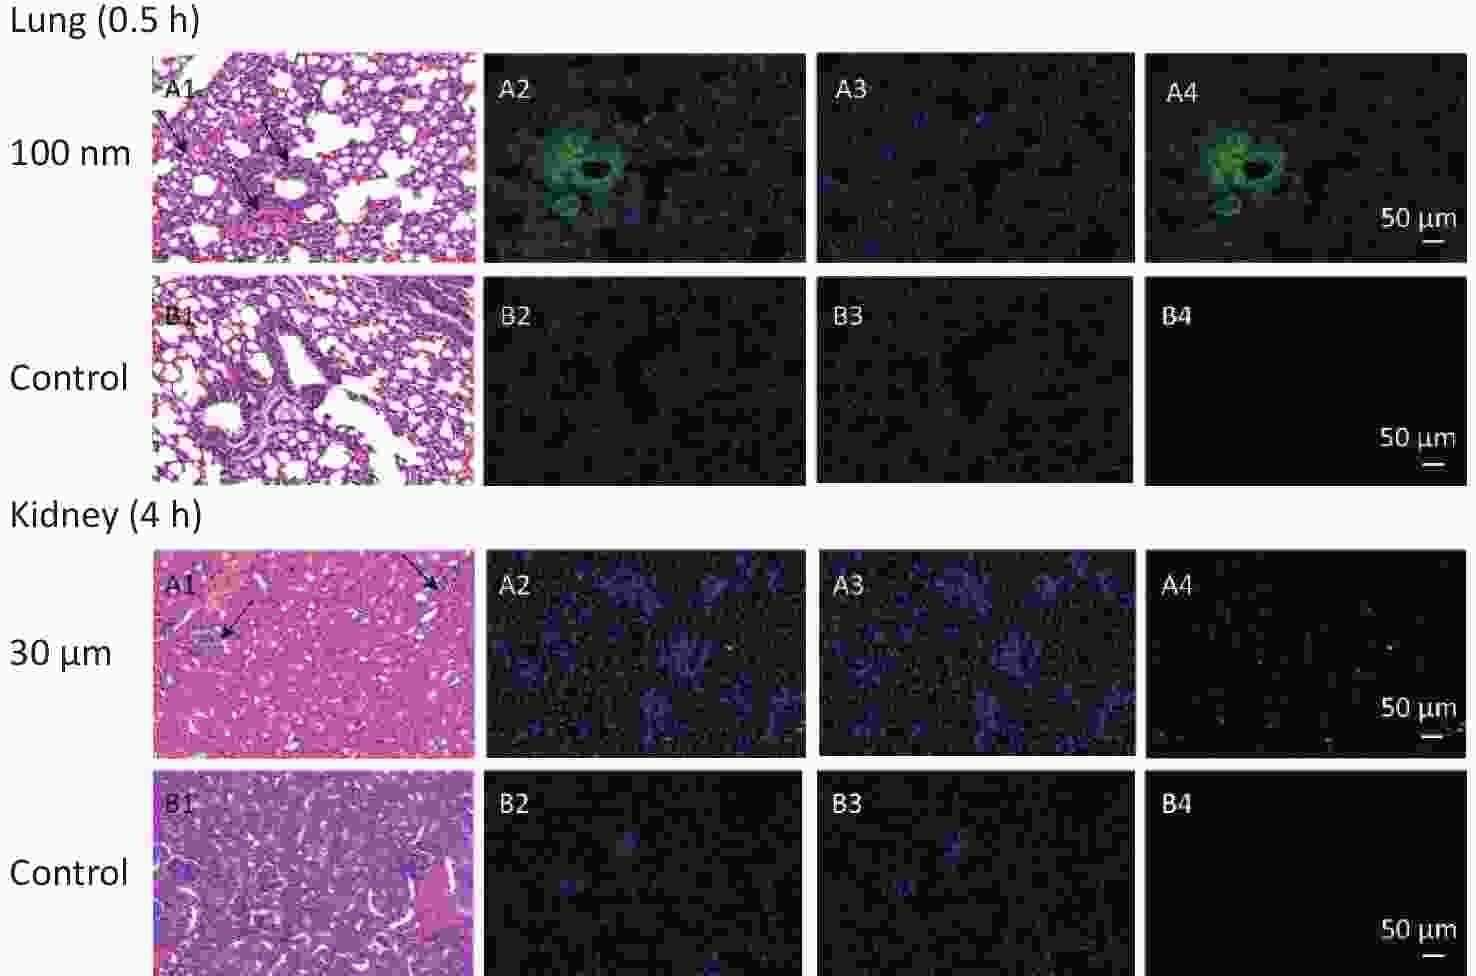
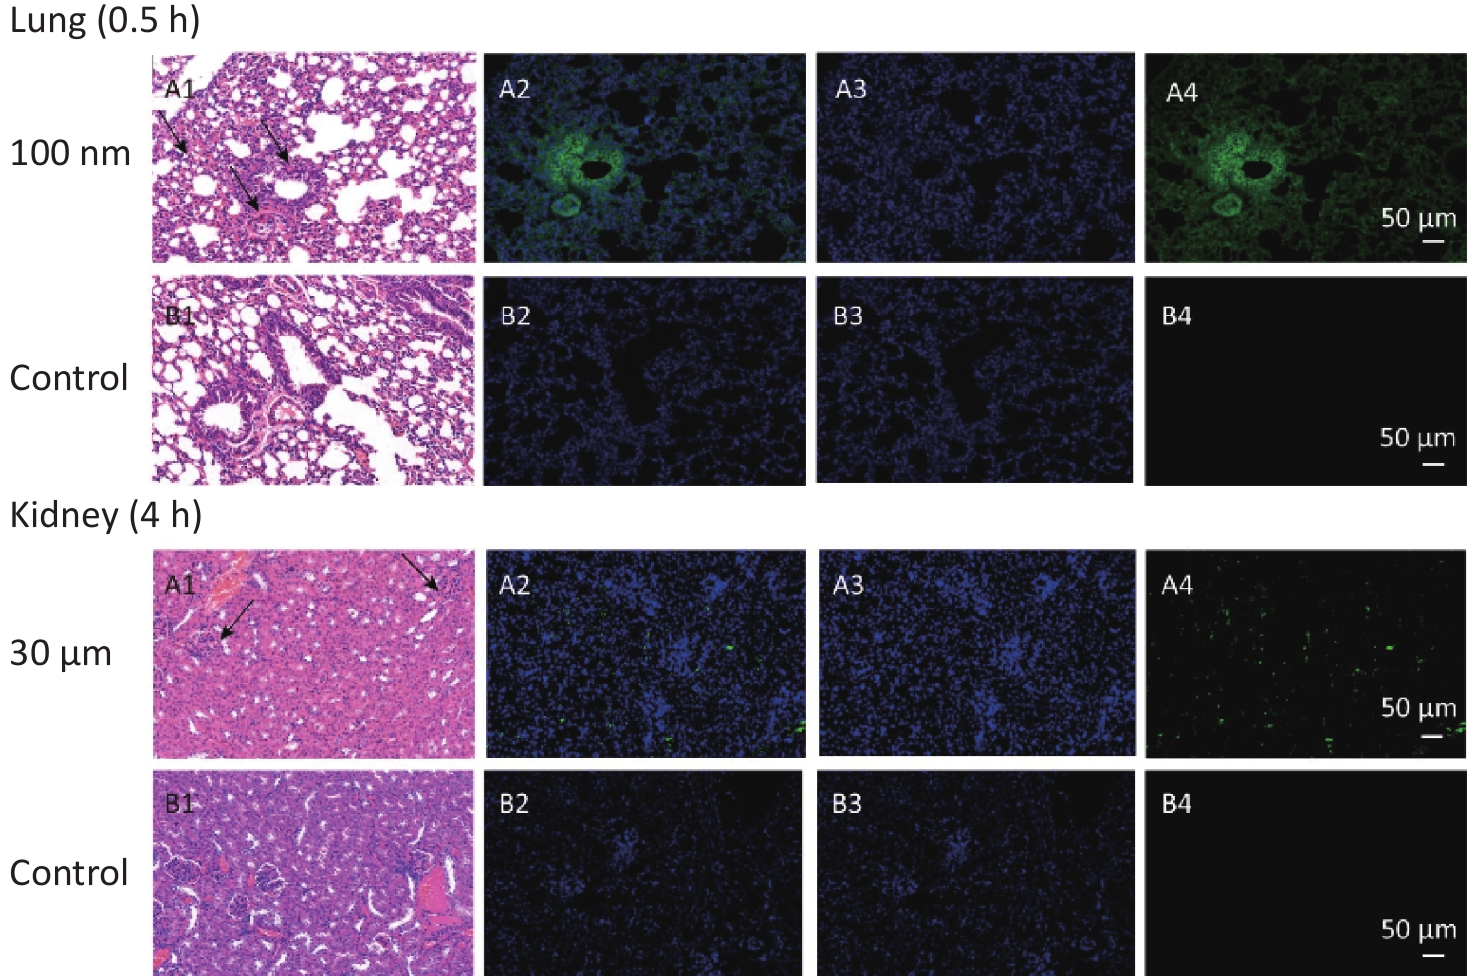
Figure S1. Histological examination of lung and kidney in other sizes of NMPs (200×). The first column is the image of H&E staining. The second is the merge of both fluorescence microspheres and DAPI dye. The third is the fluorescence image of DAPI dye. The fourth is the fluorescence image of fluorescence microspheres (green). DAPI, 4',6-diaminidine-2-phenylindole. Black arrows indicate inflammation.
-
After confirming the results of the fluorescence leakage test and the co-incubation of fluorescent microspheres with acid-solution[25], we confirmed that the NMPs microspheres used in our study had sufficient stability to ensure the accuracy of the subsequent toxicokinetic study. According to the IVIS Spectrum and H&E staining, we traced the biodistribution of NMPs with different sizes (100 nm, 3 μm, and 10 μm) in the digestive system, thoracic and abdominal organs, and skeletal muscle of mice. Collectively, the data supported the hypothesis that NPs were not only aggregated in the digestive system but were transported rapidly to other tissues that were indirectly exposed to NMPs after exposure. The 3 μm MPs could enter the digestive system, and had the ability to translocate to the lung and kidney. The 10 μm MPs were less able to invade an organism’s body, even by oral gavage, and were excreted mainly through excrement.
We used a high dose of 250 mg/(kg∙body weight) to confirm the timepoint of the absorption peak for 100 nm microspheres after a single oral exposure. Although we shortened the observation time period, the results showed that the FI was still highest at 30 min, and was maintained at the same level at 45 min (fold-increase: 1.33 vs. 1.33). The peak time for blood absorption was 30 min. The NPs were then rapidly distributed to organs/tissues and were no longer present in blood at 2 h. These results agreed with those of previous studies[27,28].
In the digestive system, NPs were detected in the stomach and small intestine in the early stage after the oral gavage, and the fold increases were much higher than in the MPs treated groups, indicating that the stomach and small intestine were more likely to absorb NPs than MPs. Because mucosal and epithelial damage were only detected in the stomach and small intestine, we proposed that NPs were mainly absorbed from the stomach and small intestine into circulation, and then translocated to the adipose tissue[26]. In the 10 μm group, a significantly higher fold occurred in the large intestine and excrement at 0.5 h, which may be due to the excrement in the colon or contact with food debris by eating bedding material, although the mice were fasted for 12 h before the study. Another peak absorption in the 10 μm group happened at 2 h after exposure. As reported[29], there are few enzymes involved in the digestion of plastics in organisms, thus NMPs ingested by mammals are difficult to digest. Some proportion of the smaller NMPs could pass through the intestinal barrier; however, the remaining NMPs might accumulate and adhere to the intestinal mucosa for a long time, thus causing more severe intestinal dysfunction, such as epithelial damage, mucosal injury, inflammation, and gut microbiota dysfunction[4-5,14,30].
With the NMPs distributing in the chest and abdominal organs, strong fluorescent signals were detected in the vein of the liver and lung, while scattered fluorescent signals were observed in the perivascular tissue. This suggested that NMPs had the ability to invade organs through circulation. Recently, 20 μm diameter NMPs were observed in mice liver and kidney[6]. In our study, we detected a fold increase in lung, liver, and kidney for particle sizes of 3 μm, 100 nm, and 10 μm respectively. we additionally performed H&E staining of the 100 nm group in lung and 3 μm group in kidney to confirm the existence of NMPs (Supplementary Figure S1). As expected, the fluorescence signals in the 100 nm group were much higher than in the 3 and 10 μm groups in the observed organs. This further proved that the ability of NMPs to cross tissue barriers was strongly correlated with the diameter of the NMPs.
Previous studies have shown that the gut microbiome was altered after oral exposure to NMPs, which led to changes in amino acid metabolism, lipid metabolism, and energy metabolism, followed by liver inflammation[6,31]. However, in our study, we found that fluorescence signals were detected in most substantial organs/tissues immediately after a 2−4 h NMPs exposure. This suggested that particles with sizes of < 3.5 μm had the ability to cross to the membrane barrier directly[32,33], and then caused changes in cytokines and pathology. In contrast, micron-scale MPs could accumulate in organ tissue and induce damage including physical abrasion and an immune response[6]. It is therefore necessary to further explore the interactions between different treatment methods (acute, subacute, subchronic, and chronic) and different sizes of NMPs, and we believe that their mechanisms may vary significantly.
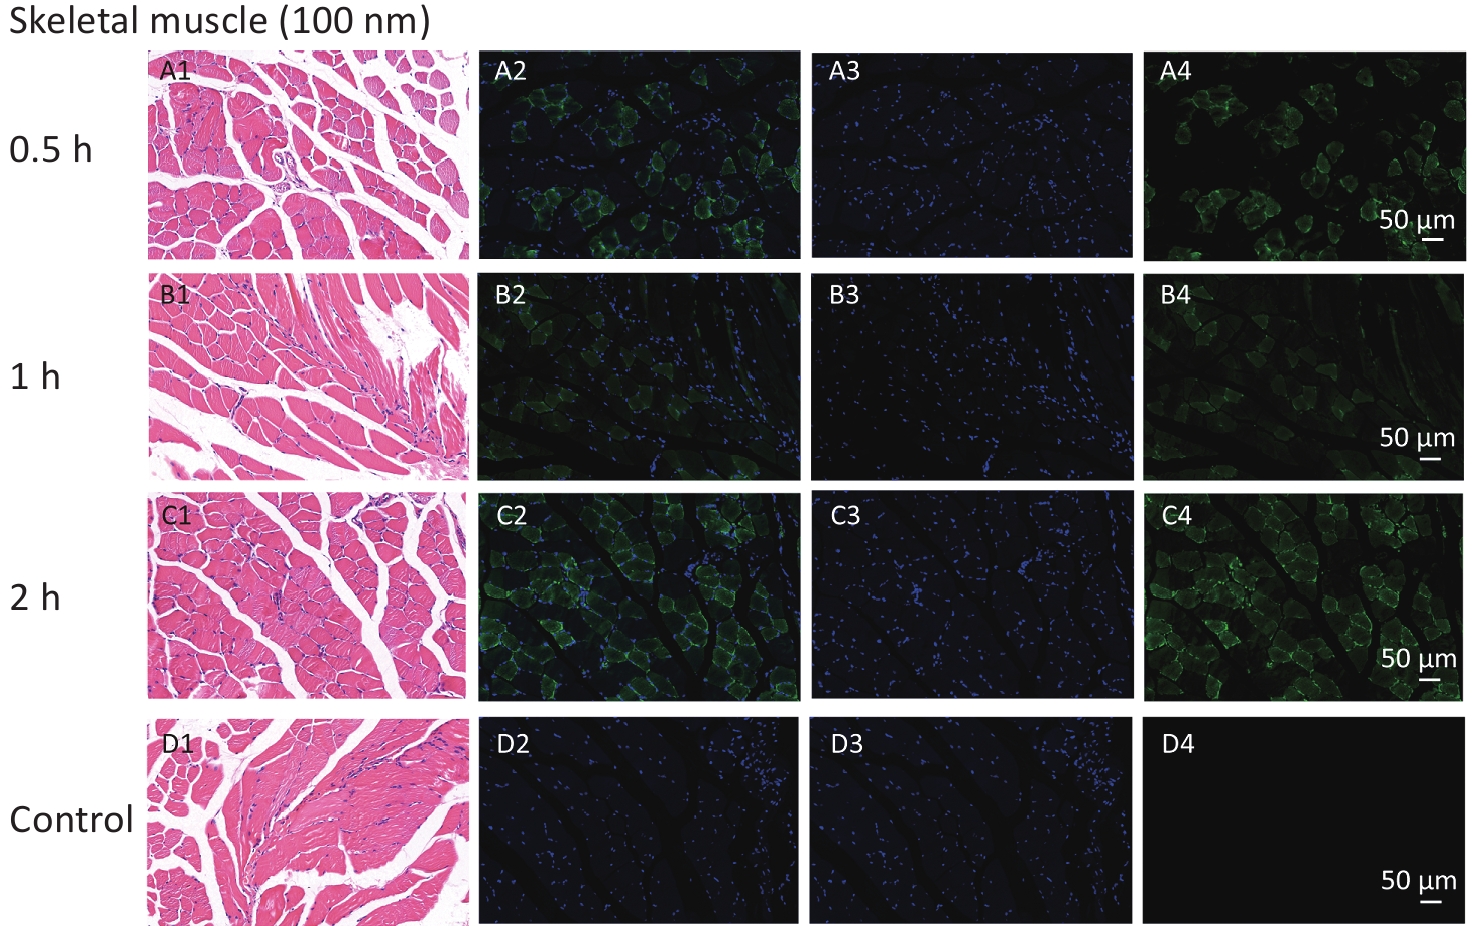
With respect to accumulation in skeletal muscles, our study revealed the FI changes in all NMPs treated groups, but only for NPs and not for MPs. The histological examination further corroborated those findings. To explore the specific timepoint of NP accumulation in skeletal muscle, we performed a histological examination at different observational points. The results showed that fluorescent signals were found from 0.5 to 4 h after intestinal exposure (Supplementary Figure S2, available in www.besjournal.com), indicating that NPs were immediately absorbed into skeletal muscles from circulation. This further indicated that skeletal muscles could be another target/storage organ accumulating NPs after a single oral exposure.
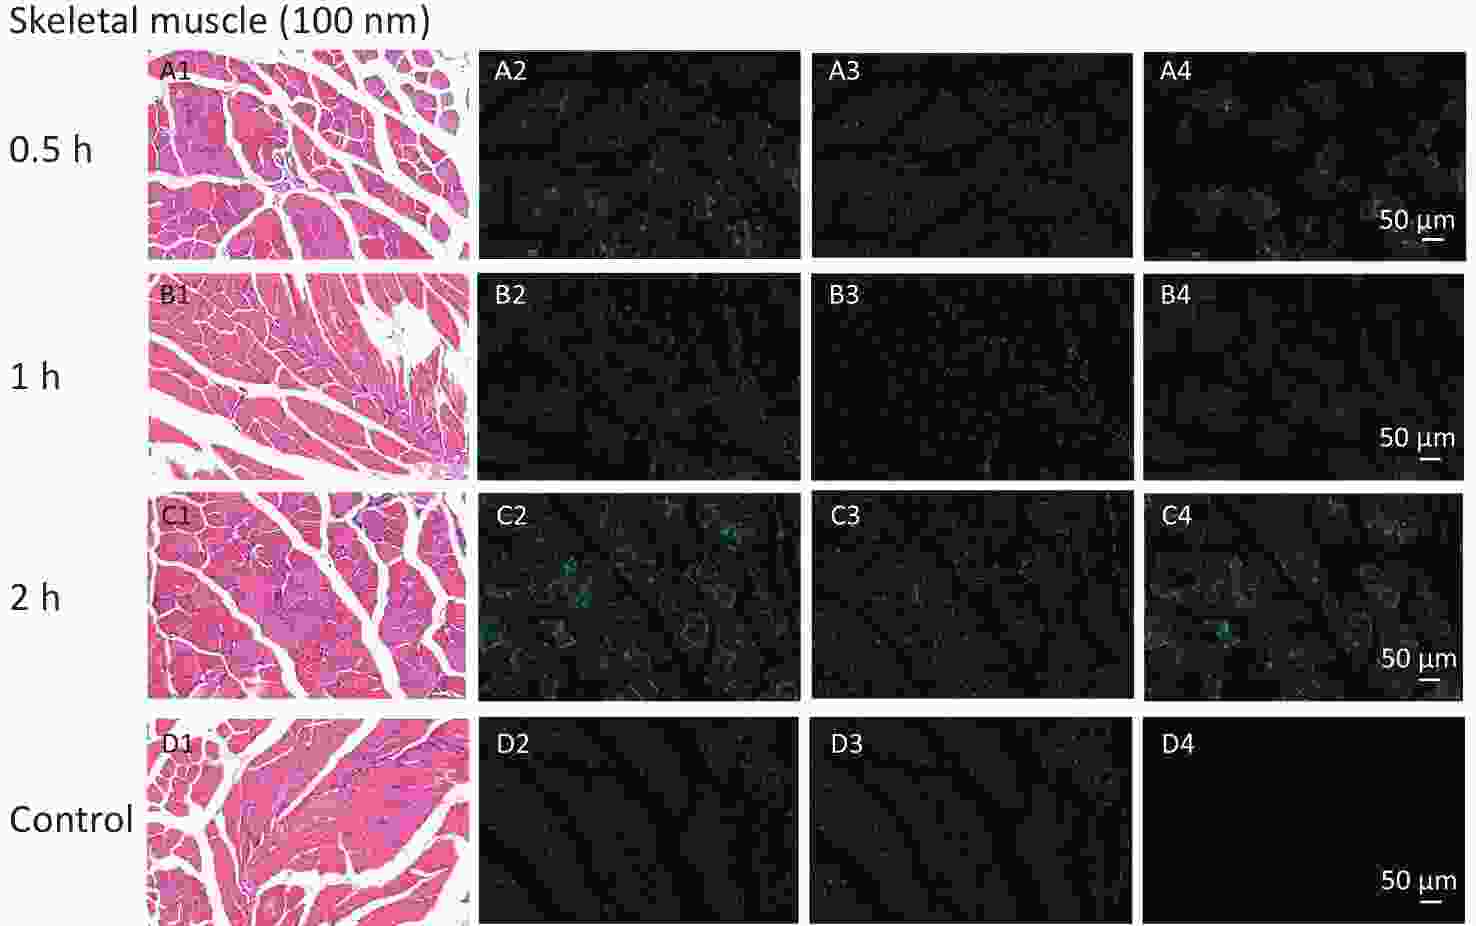
Figure S2. Histological examination of skeletal muscles with the size of 100 nm group for observation time of 0.5 h to 2 h (200×). The first column is the image of H&E staining. The second is the merge of both fluorescence microspheres and DAPI dye. The third is the fluorescence image of DAPI dye. The fourth is the fluorescence image of fluorescence microspheres (green). DAPI, 4',6-diaminidine-2-phenylindole.
With respect to the excretion, we attempted to use individual metabolic cages to collect urine and feces. Unfortunately, cross-contamination between urine and feces was inevitable. We then tried to collect urine samples while conducting the eyeball extraction. As a result, the collection was not as satisfactory as expected. Sometimes, the collecting volume was too little to measure, which weakened the representativeness and stability of conclusions. However, due to the presence of NPs in kidney at 4 h after administration, a longer observing period was necessary to provide convincing evidence. In addition to urine, an enormous increase in excrement was found, which suggested that NMPs were mainly excreted through excrement following a single oral exposure.
There were some limitations to the present study. First, the observation period was short because this was a toxicokinetic pilot study. Further studies with longer time courses are needed to confirm the conclusions reached in this study. Second, the collection of urine samples needs to be improved from a toxicokinetic perspective. Additionally, in the real world, the most common shape of NMPs is fiber. There are likely to be significant differences in the toxicokinetic effects between fibrous and spherical NMPs. Our research team has prepared microplastic fibers by the cryotome method, and animal tests will be conducted in the future.
-
In this study, we investigated the distribution of fluorescent NMPs at a single high dose by oral gavage. We found that 100 nm PS microspheres aggregated in the digestive system, rapidly entered the blood circulatory system, and penetrated most observed organs. Micron sized particles were mainly found in the digestive system, with a few fluorescence signals detected in the lung and kidney. Skeletal muscles could be another storage organ, although the results need further corroboration. In summary, this study demonstrated that the distribution of MPs and NPs was quite different, and may lead to different toxic effects in in vivo.
HTML
Fluorescent NMPs Microspheres
Animals
Experimental Design
Fluorescence Imaging
Histological Examination
Quality Control
Statistical Analysis
Tissue Autofluorescence Intensity for the Control Group at Different Time Points
The Absorption Peak of 100 nm Fluorescent Microspheres in Blood by IVIS Spectrum
The Absorption of 100 nm, 3 μm, and 10 μm Fluorescent Microspheres in the Digestive System by IVIS Spectrum
The Absorption of 100 nm, 3 μm, and 10 μm Fluorescent Microspheres in Thoracic Organs by IVIS Spectrum
The Absorption of 100 nm, 3 μm, and 10 μm Fluorescent Microspheres in Abdominal Organs by IVIS Spectrum
The Absorption of 100 nm, 3 μm, and 10 μm Fluorescent Microspheres in Skeletal Muscles by IVIS Spectrum
Histological Confirmation
 23219+Supplementary Materials.pdf
|

|

 Quick Links
 DownLoad: