


-
Anemia is a condition in which the number of red blood cells (RBC) decreases, leading to a decrease in oxygen-carrying capacity[1]. This significantly impacts human health, economic conditions, and social well-being[2]. It is a common public health issue that affects most countries[3]. Approximately 1.62 billion people (24.8% of the world's population) currently suffer from anemia[4].
The International Diabetes Federation (IDF) estimates that more than 463 million people worldwide suffer from diabetes mellitus[5]. Diabetes Mellitus is a metabolic disorder classified into types 1 and 2, with type 2 diabetes being the most common type, affecting approximately 422 million adults globally[6]. The burden of type 2 diabetes has increased in the Eastern Mediterranean and North African countries, including Iran[6]. According to previous studies, the prevalence of type 2 diabetes in Iran will be around 6.8% until 2025[7]. In Africa, studies have shown that 3.9% (19.4 million adults) have undiagnosed diabetes[5]. A meta-analysis conducted in African countries in 2021 reported a prevalence of anemia of approximately 35% in individuals with diabetes mellitus and 56% in a population with diabetic foot syndrome[8].
Anemia in patients with diabetes may be caused by various factors, including chronic inflammation, drug use (including metformin), nutritional deficiencies, kidney diseases, high blood pressure, hormonal changes[9,10], and autoimmune diseases (especially in patients with type 1 diabetes)[11,12]. These factors accelerate diabetes-related complications and increase the risk of anemia in diabetic patients[9,13].
The increase in anemia in patients with diabetes is associated with a significant financial burden for treatment and hospitalization, increasing the risk of retinopathy, neuropathy, vascular diseases, heart diseases, and ultimately dementia[14-18]. Studies have shown that the prevalence of anemia in diabetic patients with nephropathy or renal disorder is 2–3 times higher than those without diabetes[19-22]. Anemia negatively affects patients’ quality of life[21,23-25] and contributes to the increase in diabetes cases worldwide[17,26].
Diabetes reduces patients’ quality of life, and its complications often lead to physical problems. The occurrence of anemia in patients with diabetes can accelerate the progression of complications, including cardiovascular diseases, which are common in this group[18]. Therefore, early diagnosis and treatment of anemia in patients with diabetes can reduce morbidity and mortality and improve their quality of life[18]. The prevalence of anemia in patients with diabetes mellitus varies in different studies. In 2021, a meta-analysis conducted in Lebanon reported that the prevalence of severe anemia in patients with diabetes with diabetic foot ulcers was 73%[17]. Approximately 1.6 billion people suffer from anemia worldwide, with women being the most affected[27]. In Iran, approximately 2% of the general population and 7.3% of the population aged > 30 years have diabetes. Lifestyle behaviors, such as nutrition, physical activity, job type, stress level, and obesity/overweight status, could play an essential role in preventing increases in the blood sugar index and better control of diabetes[28].
There have been reports on the global prevalence of anemia in patients with diabetes mellitus globally[8]. However, no comprehensive studies have been conducted in this regard. Only a few studies conducted over shorter periods have reported varying outcomes or similar risks, and no consensus has been reached. Furthermore, different studies have reported various estimates of the prevalence of anemia in patients with diabetes mellitus, ranging from 4.7% to 32.1%[8]. Therefore, the current study aimed to investigate the prevalence of anemia in patients with diabetes mellitus worldwide using data obtained from published studies.
-
The systematic review has been registered on PROSPERO under ID number CRD42023388047, and this article is the result of a research project approved by the ethics committee of the Iran University of Medical Sciences (ID number IR. IUMS. REC.1401.827).
-
To diagnose anemia, your healthcare provider is likely to ask you about your medical and family histories, perform physical exams, and order blood tests. Tests might include: 1) Complete blood count (CBC). CBC is used to count the number of blood cells in a blood sample. For anemia, the test measures the number of red blood cells in the blood, called hematocrit, and the hemoglobin level in the blood. Typical adult hemoglobin values are 14–18 g/dL for men and 12–16 g/dL for women. Typical adult hematocrit values vary among different medical practices. However, they are generally between 40% and 52% for men and 35% and 47% for women. 2) A test to show the size and shape of red blood cells. It considers the size, shape, and color of the red blood cells.
-
This meta-analysis included studies conducted from 2010 to 2021. The study population included all studies that analyzed samples from patients with diabetes mellitus and anemia. Authentic English and Farsi electronic resources were used to extract information. Reliable English and Persian databases such as PubMed, Scopus, Web of Sciences, Google Scholar, Magiran, and SID were searched. The following search strategy was used to search national and international data banks: (“Anemia”) and (“Diabetes Mellitus”) using the OR operator to connect synonyms, and the AND operator was used to combine the results obtained from the OR operator. The search strategy for each database was consistent with the database’s search strategy (Supplementary Table S1, available in www.besjournal.com).
Search strategy Keywords Anemia*[Title/Abstract] OR “Anemia”[Title/Abstract] OR iron deficiency,Anemia[MeSH] OR “iron deficiency”[Title/Abstract] OR iron deficiency* [Title/Abstract] OR Anamia [Title/Abstract] OR Anaemia [Title/Abstract] OR Anamia* [Title/Abstract] OR Anaemia*[ Title/Abstract] OR anemi*[tw] Anemia Diabetes Mellitus[MeSH Terms] OR Diabetes Mellitus,Type 2[MeSH] OR Diabetes Mellitus,Type 1[MeSH] OR Diabetes Mellitus,Type 2 OR [Title/Abstract] OR Diabetic[MeSH Terms] OR Diabet*[tw] OR Diabetes Mellitus,Type 2[Title/Abstract] Diabetes Mellitus Prevalence[MeSH] OR Epidemiology[MeSH] OR Survey[MeSH] Prevalence 1 AND 2 AND 3 AND Search Table S1. Search keywords
After completing the search and removing duplicates, the articles were imported into EndNote. All articles were first evaluated based on their titles, then based on their abstracts, and finally, the full texts of the relevant studies were evaluated and entered into the quality review stage. The study was conducted in a transparent and unbiased manner, and all articles were carefully evaluated and presented without bias. We made every effort to obtain the full texts of the relevant articles and carefully evaluated them. All articles used in this study were appropriately referenced to ensure the credibility of the scientific materials.
-
This review included observational and primary studies that examined the prevalence of anemia in patients with diabetes. Studies that followed the World Health Organization’s (WHO) definition of anemia to determine its prevalence were also included. Primary studies written in Farsi or English were eligible for inclusion. Additionally, the reference lists of related primary and review articles were scanned to identify relevant studies. Studies that did not report anemia prevalence according to the World Health Organization cutoff for anemia were excluded. In this study, anemia was defined using the WHO definition of hemoglobin levels < 11 g/dL.
-
In the next step, researchers used the Newcastle-Ottawa Scale (NOS) tool, a standard checklist to evaluate the quality of the observational studies, including cross-sectional, case-control, and cohort studies. The criteria used to measure bias included sample size calculations, information bias, and selection bias. Information from studies that met the necessary quality criteria was extracted and entered into a prepared electronic form. The extracted information generally included the name of the article’s main author, year of publication, study location, quality assessment score, type of study, sample size, and main findings of the article.
To prepare the data and information for the meta-analysis, all steps (search, selection, quality assessment, extraction, and homogenization of results) were carried out independently by two researchers. In case of any disagreement between the two researchers, a third researcher was involved in resolving the issue through discussions.
To ensure the correct selection of articles related to the prevalence of anemia in patients with diabetes mellitus worldwide in accordance with the inclusion criteria, two researchers (MFG and NA) were independently responsible for the article selection process. Initially, all articles related to the prevalence of anemia in patients with diabetes worldwide were collected, and articles that contained relevant keywords in their titles or abstracts were included in the initial list, whereas unrelated articles were removed. Finally, only articles that investigated the prevalence of anemia in individuals with diabetes mellitus worldwide were included in this study. After selecting the studies, the required variables, such as the study type, sample size, number of patients with diabetes with anemia, demographic characteristics of the study participants, and the time and place of the study were extracted.
Implementation limitations of the plan and their reduction methods were: 1) Abstracts and summaries of articles presented at international conferences and meetings were excluded; 2) Interventional studies or those focused solely on clinical status were excluded; 3) Only primary research studies were included; review articles and secondary studies were excluded. 4) If the required information was not available in the selected article, the study was excluded.
-
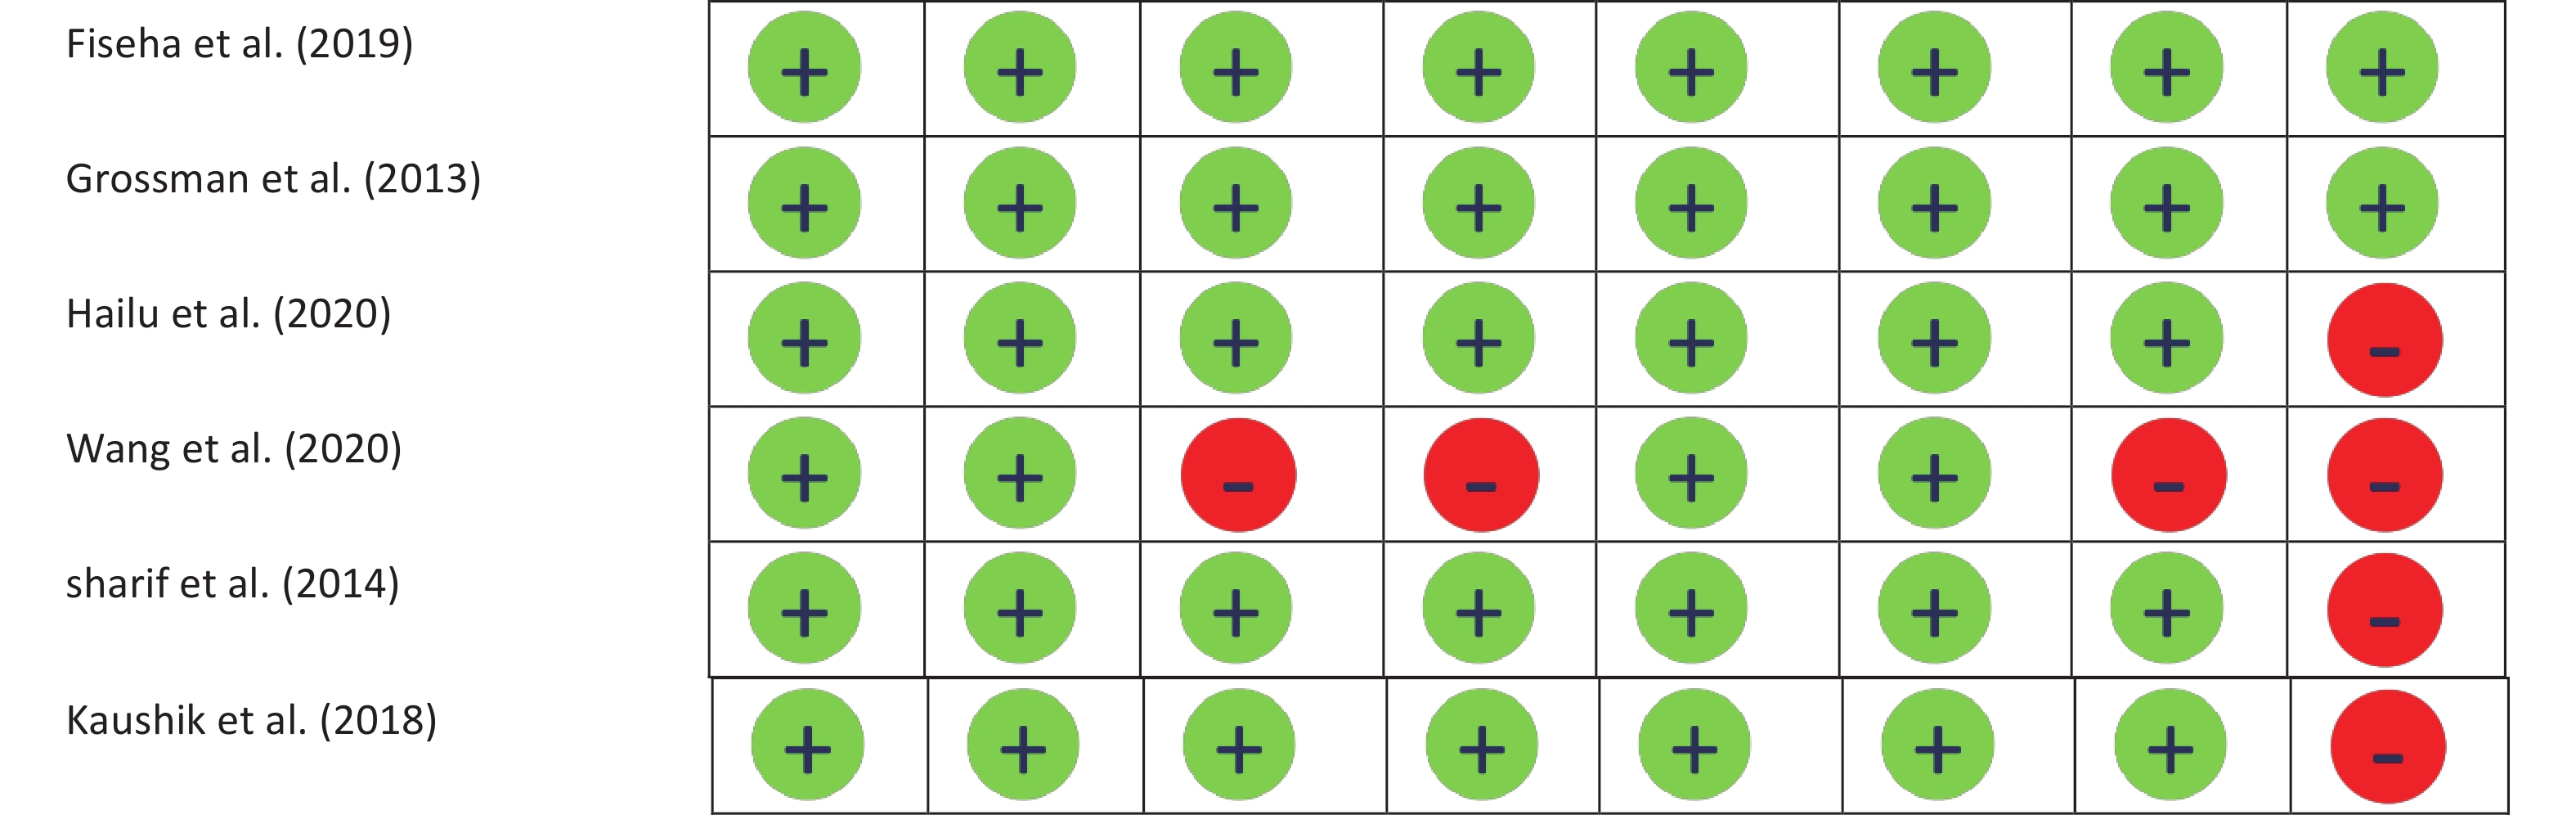
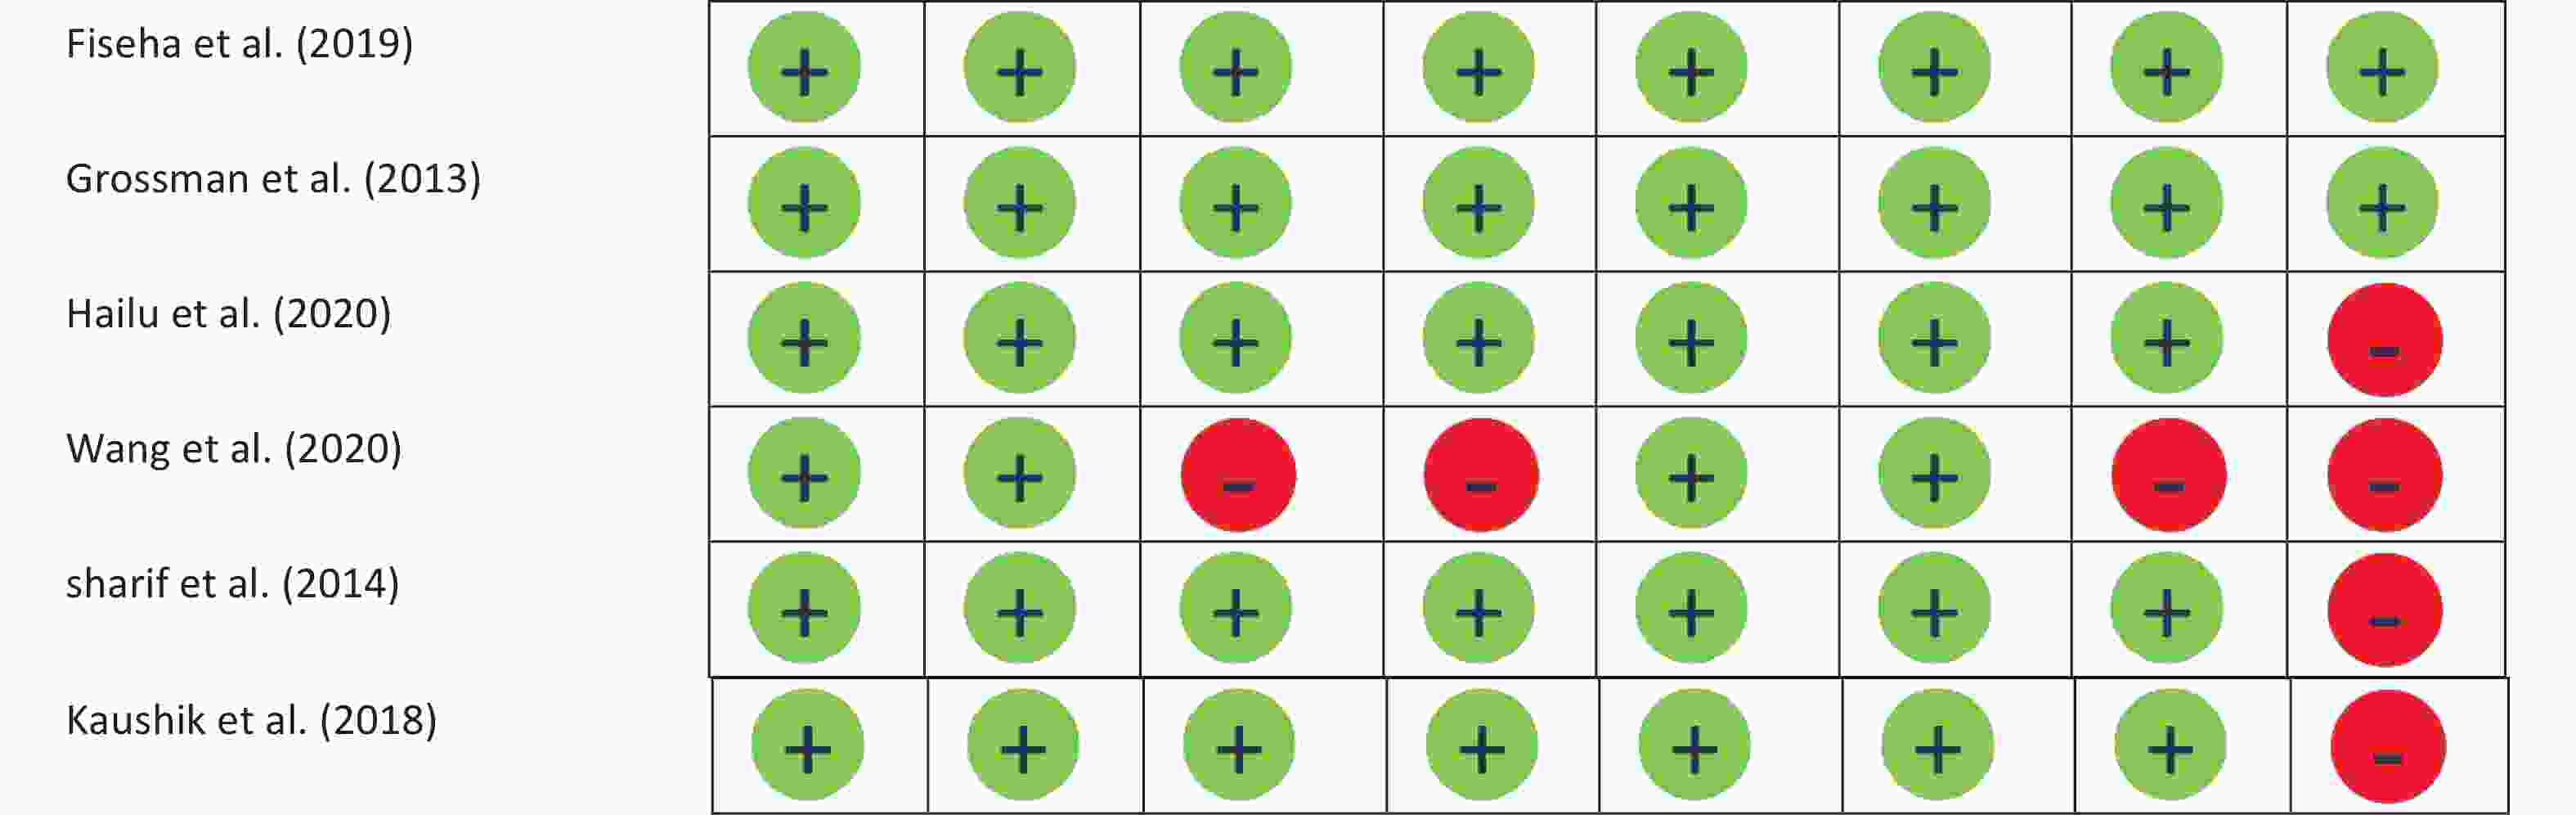
To assess possible biases in the studies, the NOS checklist[29] was used to evaluate quality. Two researchers (MFG and NA) independently conducted the evaluations. Any disagreements between the researchers were resolved through discussion or with the guidance of respected professors and research teams. If the information necessary to assess possible bias in the study was not available, the author of the article was contacted. Finally, the studies were scored according to the table provided in Supplementary Figure S1, available in www.besjournal.com.
-
The WHO defines anemia as a blood hemoglobin level of < 7.7 mmol/L (13 g/dL) in men and 7.4 mmol/L (12 g/dL) in women. Typically, the evaluation of the cause of anemia includes CBC, peripheral smear, reticulocyte count, and serum iron indices.
-
All meta-analyses were conducted using random models. Heterogeneity between studies was reported in the meta-analysis using the chi-square, I2, and Tau2 tests. Subgroup analyses were also performed based on publication year, continent, age group, medications, disease control status, and disease duration. Publication bias was calculated using Egger’s and Begg’s tests. The meta-analysis was performed using STATA 17 software at a significance level of 05.
-
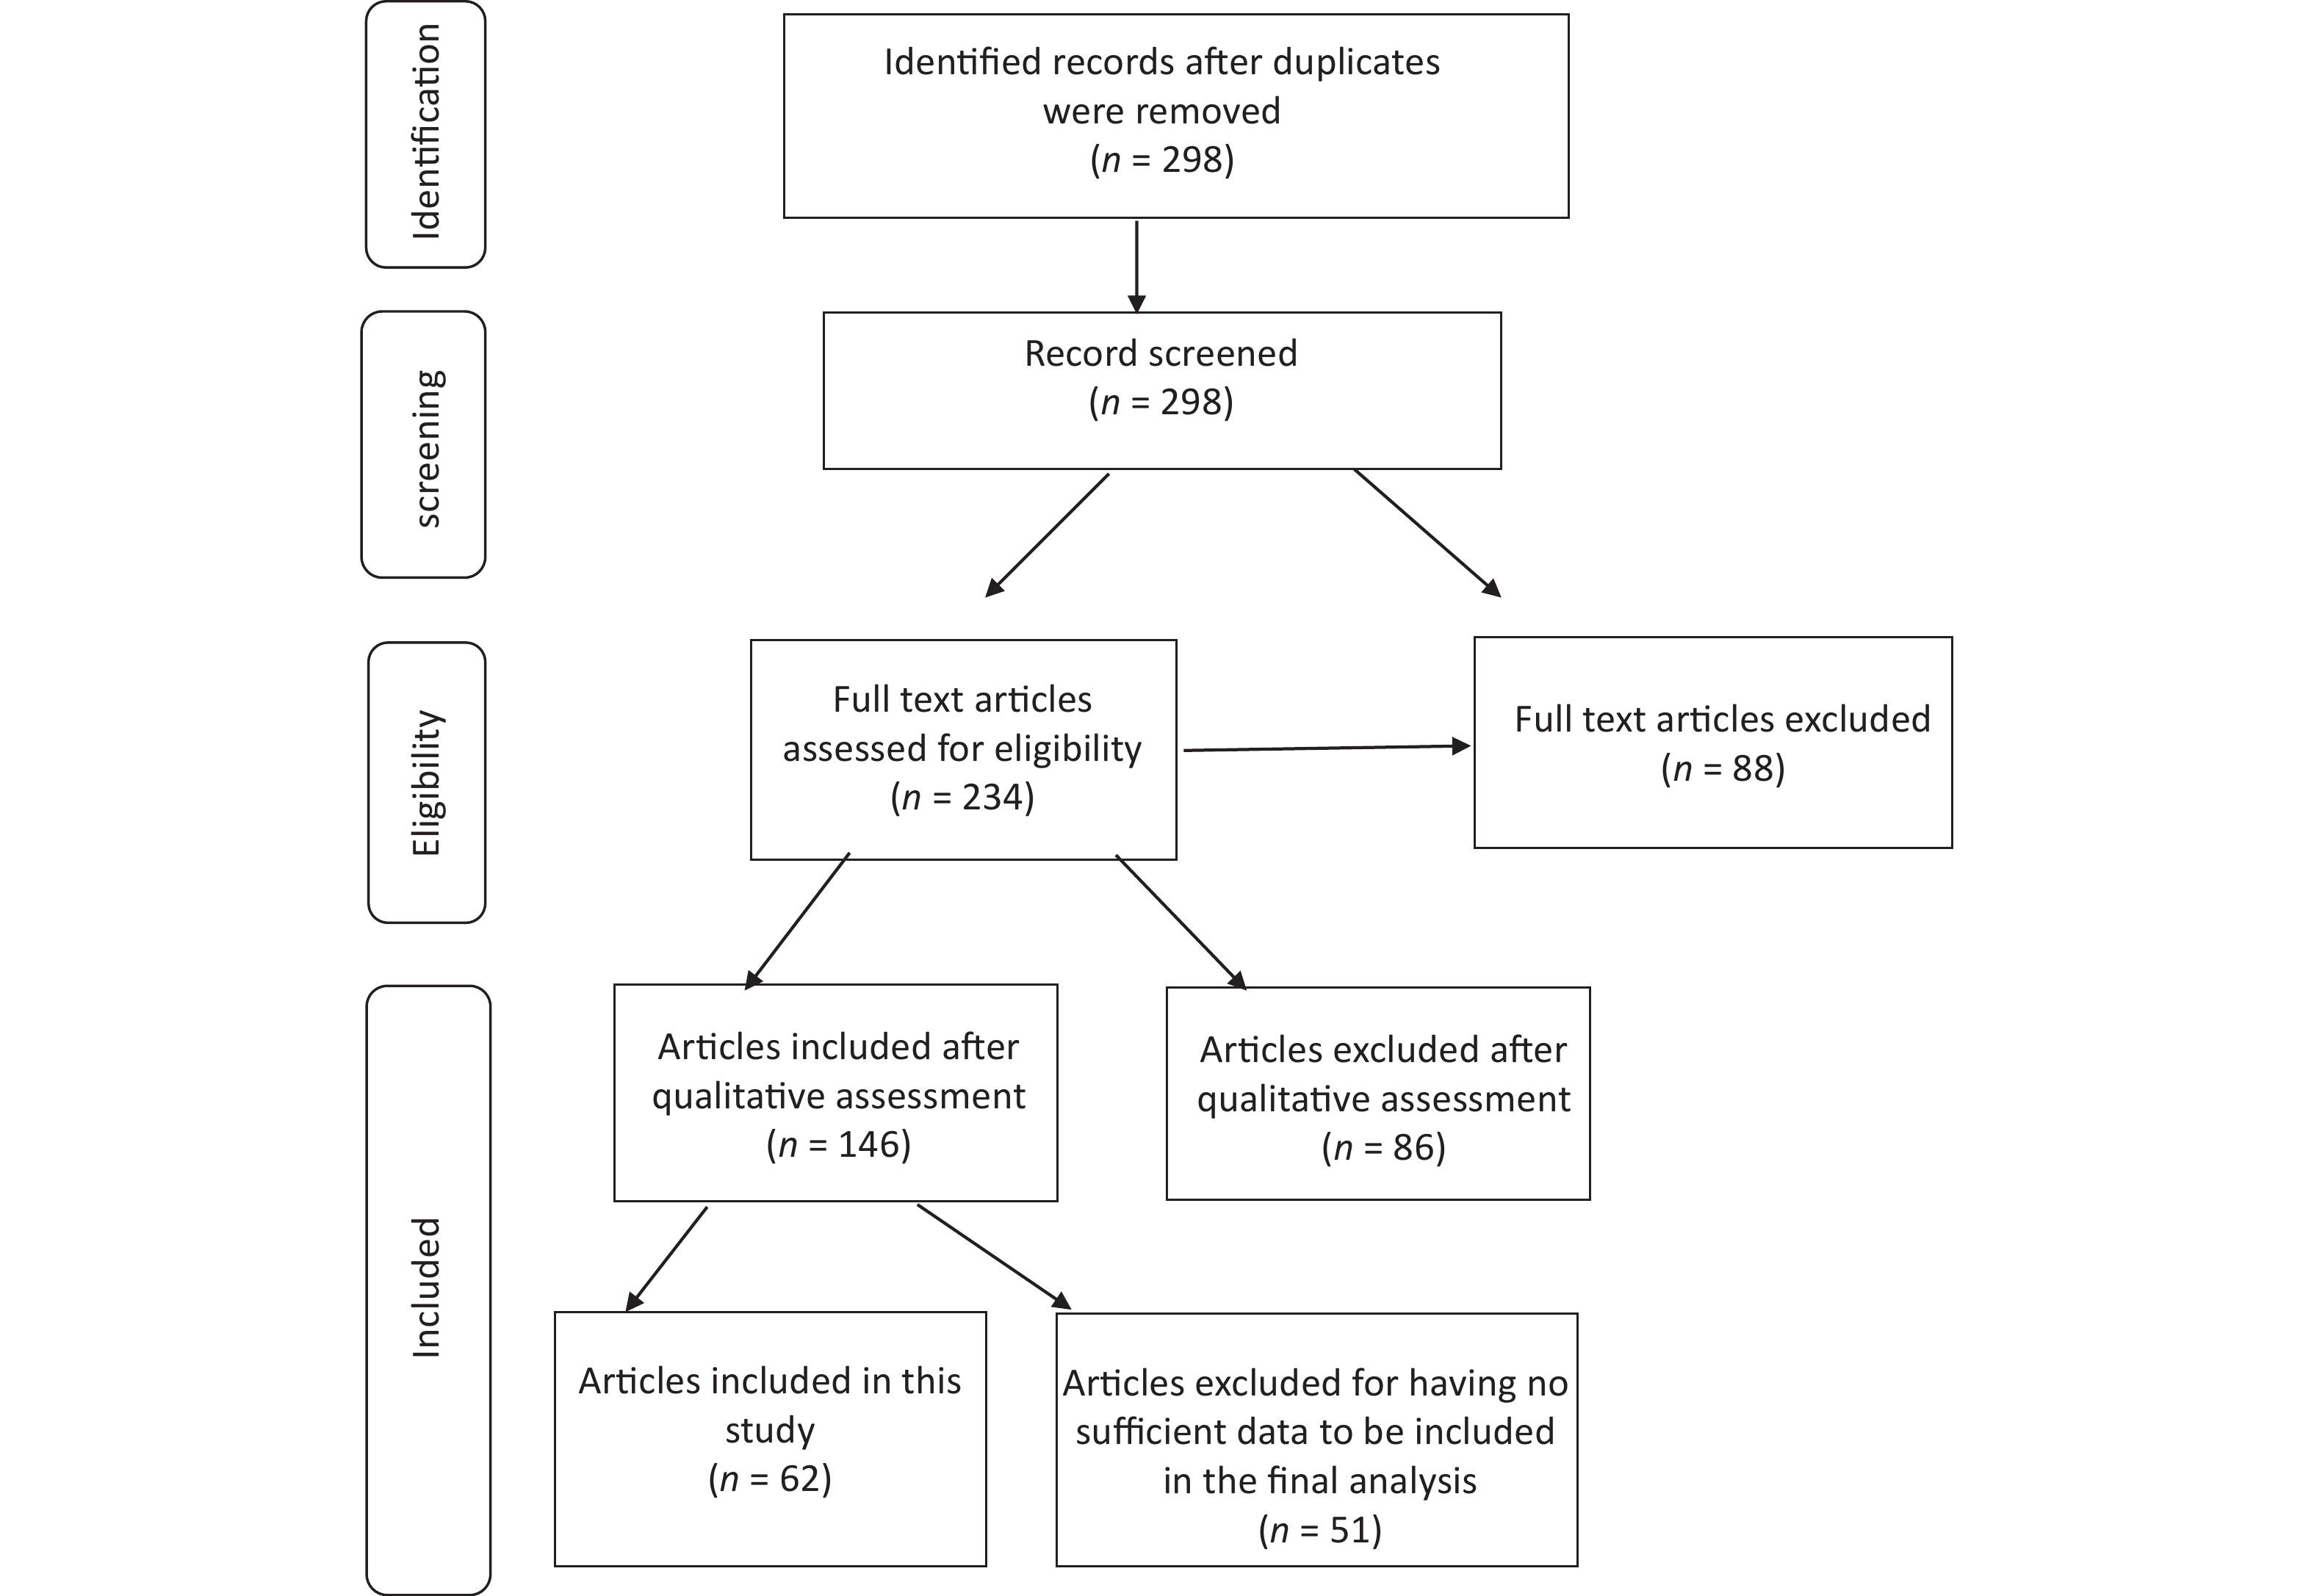
After conducting an initial search of the relevant databases, 27,283 articles were retrieved. Of these, 606 were selected for further screening based on their titles. The abstracts of these articles were reviewed, and 88 that did not contain the desired information were excluded. The remaining 234 articles underwent a full-text assessment for eligibility. Of these, 146 were subjected to qualitative evaluation using the NOS checklist. After this critical evaluation, 51 articles, including 26,485 patients with diabetes, were included. A flowchart of the study selection is shown in Figure 1.
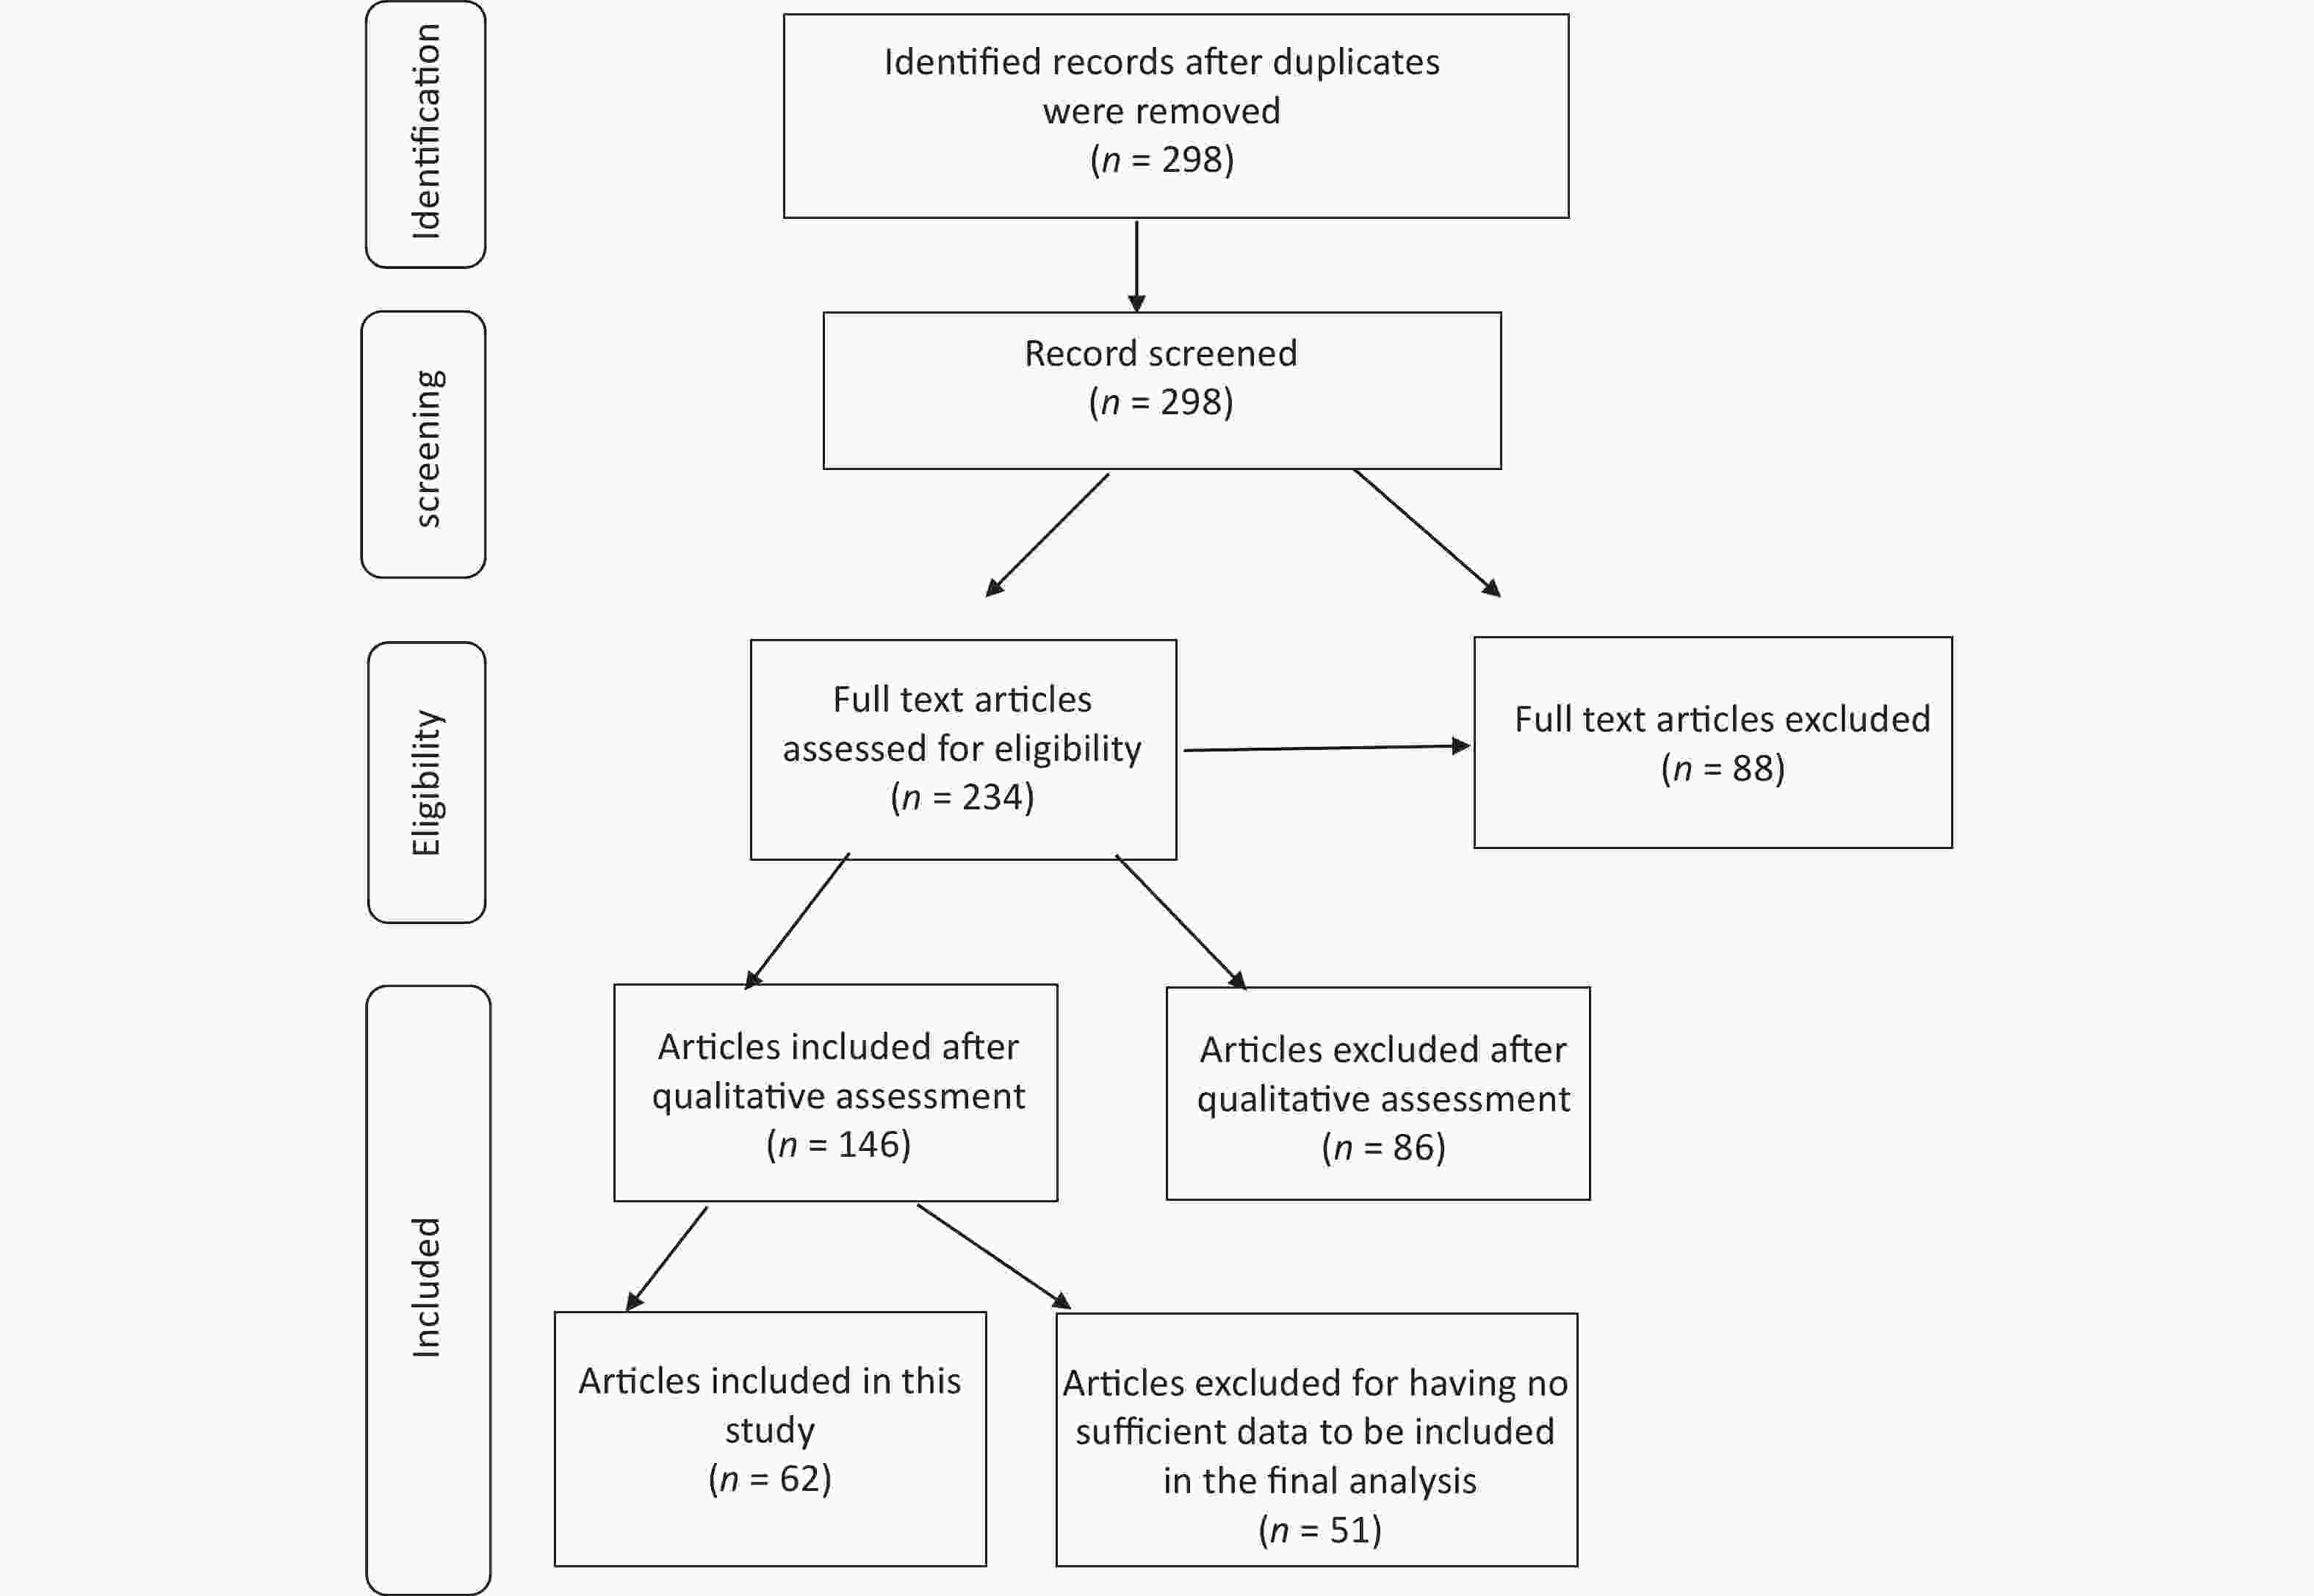
Figure 1. PRISMA flow diagram of the included studies.
-
Baseline characteristics of the included studies we identified 51 articles related to the study objectives (Figure 1), of which 31 (59%) were conducted in Asia, 17 (35%) in Africa, two (4%) in America, and one (2%) in Europe. Ethiopia, India, and Pakistan had the highest number of studies among the countries analyzed (Supplementary Table S2, available in www.besjournal.com).
NO. First author Publication years Country Average age Sample size
N−DiabeticType DM N. treatment−type N. Duration of DM (year) N. Poor Glycemic
control (HBA1C > 7)Prevalence anemia (%) Quality score 1 Abat et al.[1] 2013 Africa 40/9 (16/8) 193
191DM1
DM2Metformin (160)
Insulin (224)< 5 (206)
6–10 (124)
> 11 (54)4/2
78/17 2 adejumo et al.[2] 2012 Africa 48/8 (9/09) 144 DM2 80 15/3 6 3 Al−ghazaly et al.[3] 2019 Asia 53 (12) 324 DM2 Metformin (123) < 5 (228)
6–10 (51)
> 11 (45)23/8 5 4 AL−Salman et al.[4] 2015 Asia 52/3 (14/1) 227 DM2 55/5 8 5 Argoon et al.[5] 2014 Africa 43/08 (9/3) 100 DM2 34 5 6 Arkew et al.[6] 2021 Africa 50 (16) 134 DM2 Metformin (24) < 7 (24)
> 7 (24)78 17/9 7 7 Barbieri et al.[7] 2015 Africa 60/9 (8/9) 146 DM2 34/2 7 8 Awofisoy et al.[8] 2021 American 56/3 (11/5) 150 DM2 Metformin (133)
Insulin (36)45/5 7 9 Bekel et al.[9] 2019 Africa 62/3 (0/98) 410 DM2 < 5 (195)
> 5 (177)231 34/8 7 10 Bin−Bin He et al.[10] 2015 Asia > 60 1 997 DM2 22 7 11 Chung et al.[11] 2017 Asia 57/8 (13/5) 2 230 DM2 Insulin (382) 31 7 12 Conway et al.[12] 2018 American 51/3 (9/1) 5 210 DM2 13 Shaheen et al.[13] 2021 Africa 48/6 (15/9) 100 DM2 14 Engidaw et al.[14] 2020 Africa 57 (11/5) 297 DM2 15 Rathod et al.[15] 2018 Asia 24−72 100 DM2 16 Gunvanti. Rathod et al.[16] 2016 Asia 58 (14) 200 DM2 17 Hodel et al.[17] 2020 Africa 54 (19−91) 64 DM2 18 Hosseini et al.[18] 2014 Asia 53/9 (1) 305 DM2 Insulin (29) 19 Mirghani et al.[19] 2018 Asia 59/6 (9/9) 170 DM2 20 Kebede et al.[20] 2021 Africa > 60 372 DM2 < 5 (65)
6−10 (193)
> 10 (114)21 Kim et al.[21] 2021 Asia 60/09 (0/31) 2 903 DM2 22 Manglunia et al.[22] 2018 Asia 55/5 (13/7) 120 DM2 23 Jin Ook Chung et al.[11] 2018 Asia 56/8 (9/5) 1 300 DM2 24 Pehlivanoglu et al.[23] 2020 Asia 54/6 (11/8) 229 DM2 25 Danish Qureshi et al.[24] 2020 Asia 56/9 (7/2) 117 DM2 56/4 26 Panda et al.[25] 2018 Asia 51/3 (8/8) 54 DM2 63 27 Shabeeb et al.[26] 2021 Asia 30−79 150 DM2 65/3 28 Arshad et al.[27] 2021 Asia 54 227 DM2 < 5 (86)
6−10 (82)
> 10 (83)80 29 Taderegew et al.[28] 2020 Africa 53/7 (10/4) 249 DM2 < 5 (102)
6−10 (84)
> 10 (63)30 Tujuba et al.[29] 2021 Africa 40 (IQR:20) 325 DM2 < 5 (91)
6−10 (111)
> 10 (123)31 Yorke et al.[30] 2021 Africa 54/8 (10/8) 195 DM2 < 5 (57)
6−10 (60)
> 10 (75)32 Umeshchandara G et al.[31] 2021 Asia 54/1 (12/1) 230 DM2 < 5 (88)
6−10 (52)
> 10 (25)33 Chio et al.[32] 2015 Asia 63 (11) 1 142 DM2 34 Rathore et al.[33] 2018 Asia < 50
> 60200 DM2 Metformin (126) 35 Wang et al.[34] 2020 Asia 59/8 (12/9) 901 DM2 36 Shams et al.[35] 2015 Asia 51 (12/4) 130 DM2 Insulin (32) 98 37 Ahmed et al.[36] 2017 Asia 56/5 (10/5) 640 DM2 Metformin (98)
Insulin (32)38 Trevest et al.[37] 2014 European 83/6 (5/2) 115 DM2 Insulin (57) 39 sarosh et al.[38] 2022 Asia 49/6 (13) 200 DM2 40 Mulavu et al.[39] 2020 Asia 54/4 (14) 101 DM2 Metformin (7)
Insulin (63)41 Aynalem et al.[40] 2022 Africa 54 (12) 357 DM2 42 Idris et al.[41] 2018 Asia 60/5 (9/5) 808 DM2 < 5 (231)
6−10 (310)
> 10 (266)43 Wali et al.[42] 2022 Asia 48/5 (7/5) 215 DM2 44 Arani et al.[43] 2022 Asia 57/7 (8/6) 415 DM2 45 Feteh et al.[44] 2016 Africa 56/5 (10/6) 636 DM2 Metformin (512)
Insulin (68)46 Fiseha et al.[45] 2019 Africa 45 (14/6) 123
289DM1
DM2< 5 (253)
6−10 (107)
> 10 (52)47 Grossman et al.[46] 2013 Asia 63 (9/6) 445 DM2 Metformin (335)
Insulin (52)48 Hailu et al.[47] 2020 Africa 18−80 54
204DM1
DM249 Wang et al.[34] 2020 Asia 60/6 (11/4) 367 DM2 50 sharif et al.[48] 2014 Asia 54/4 (9/5) 200 DM2 143 51 Kaushik et al.[49] 2018 Asia 51−60 100 DM2 Table S2. Characteristics of the included studies in Meta-analysis
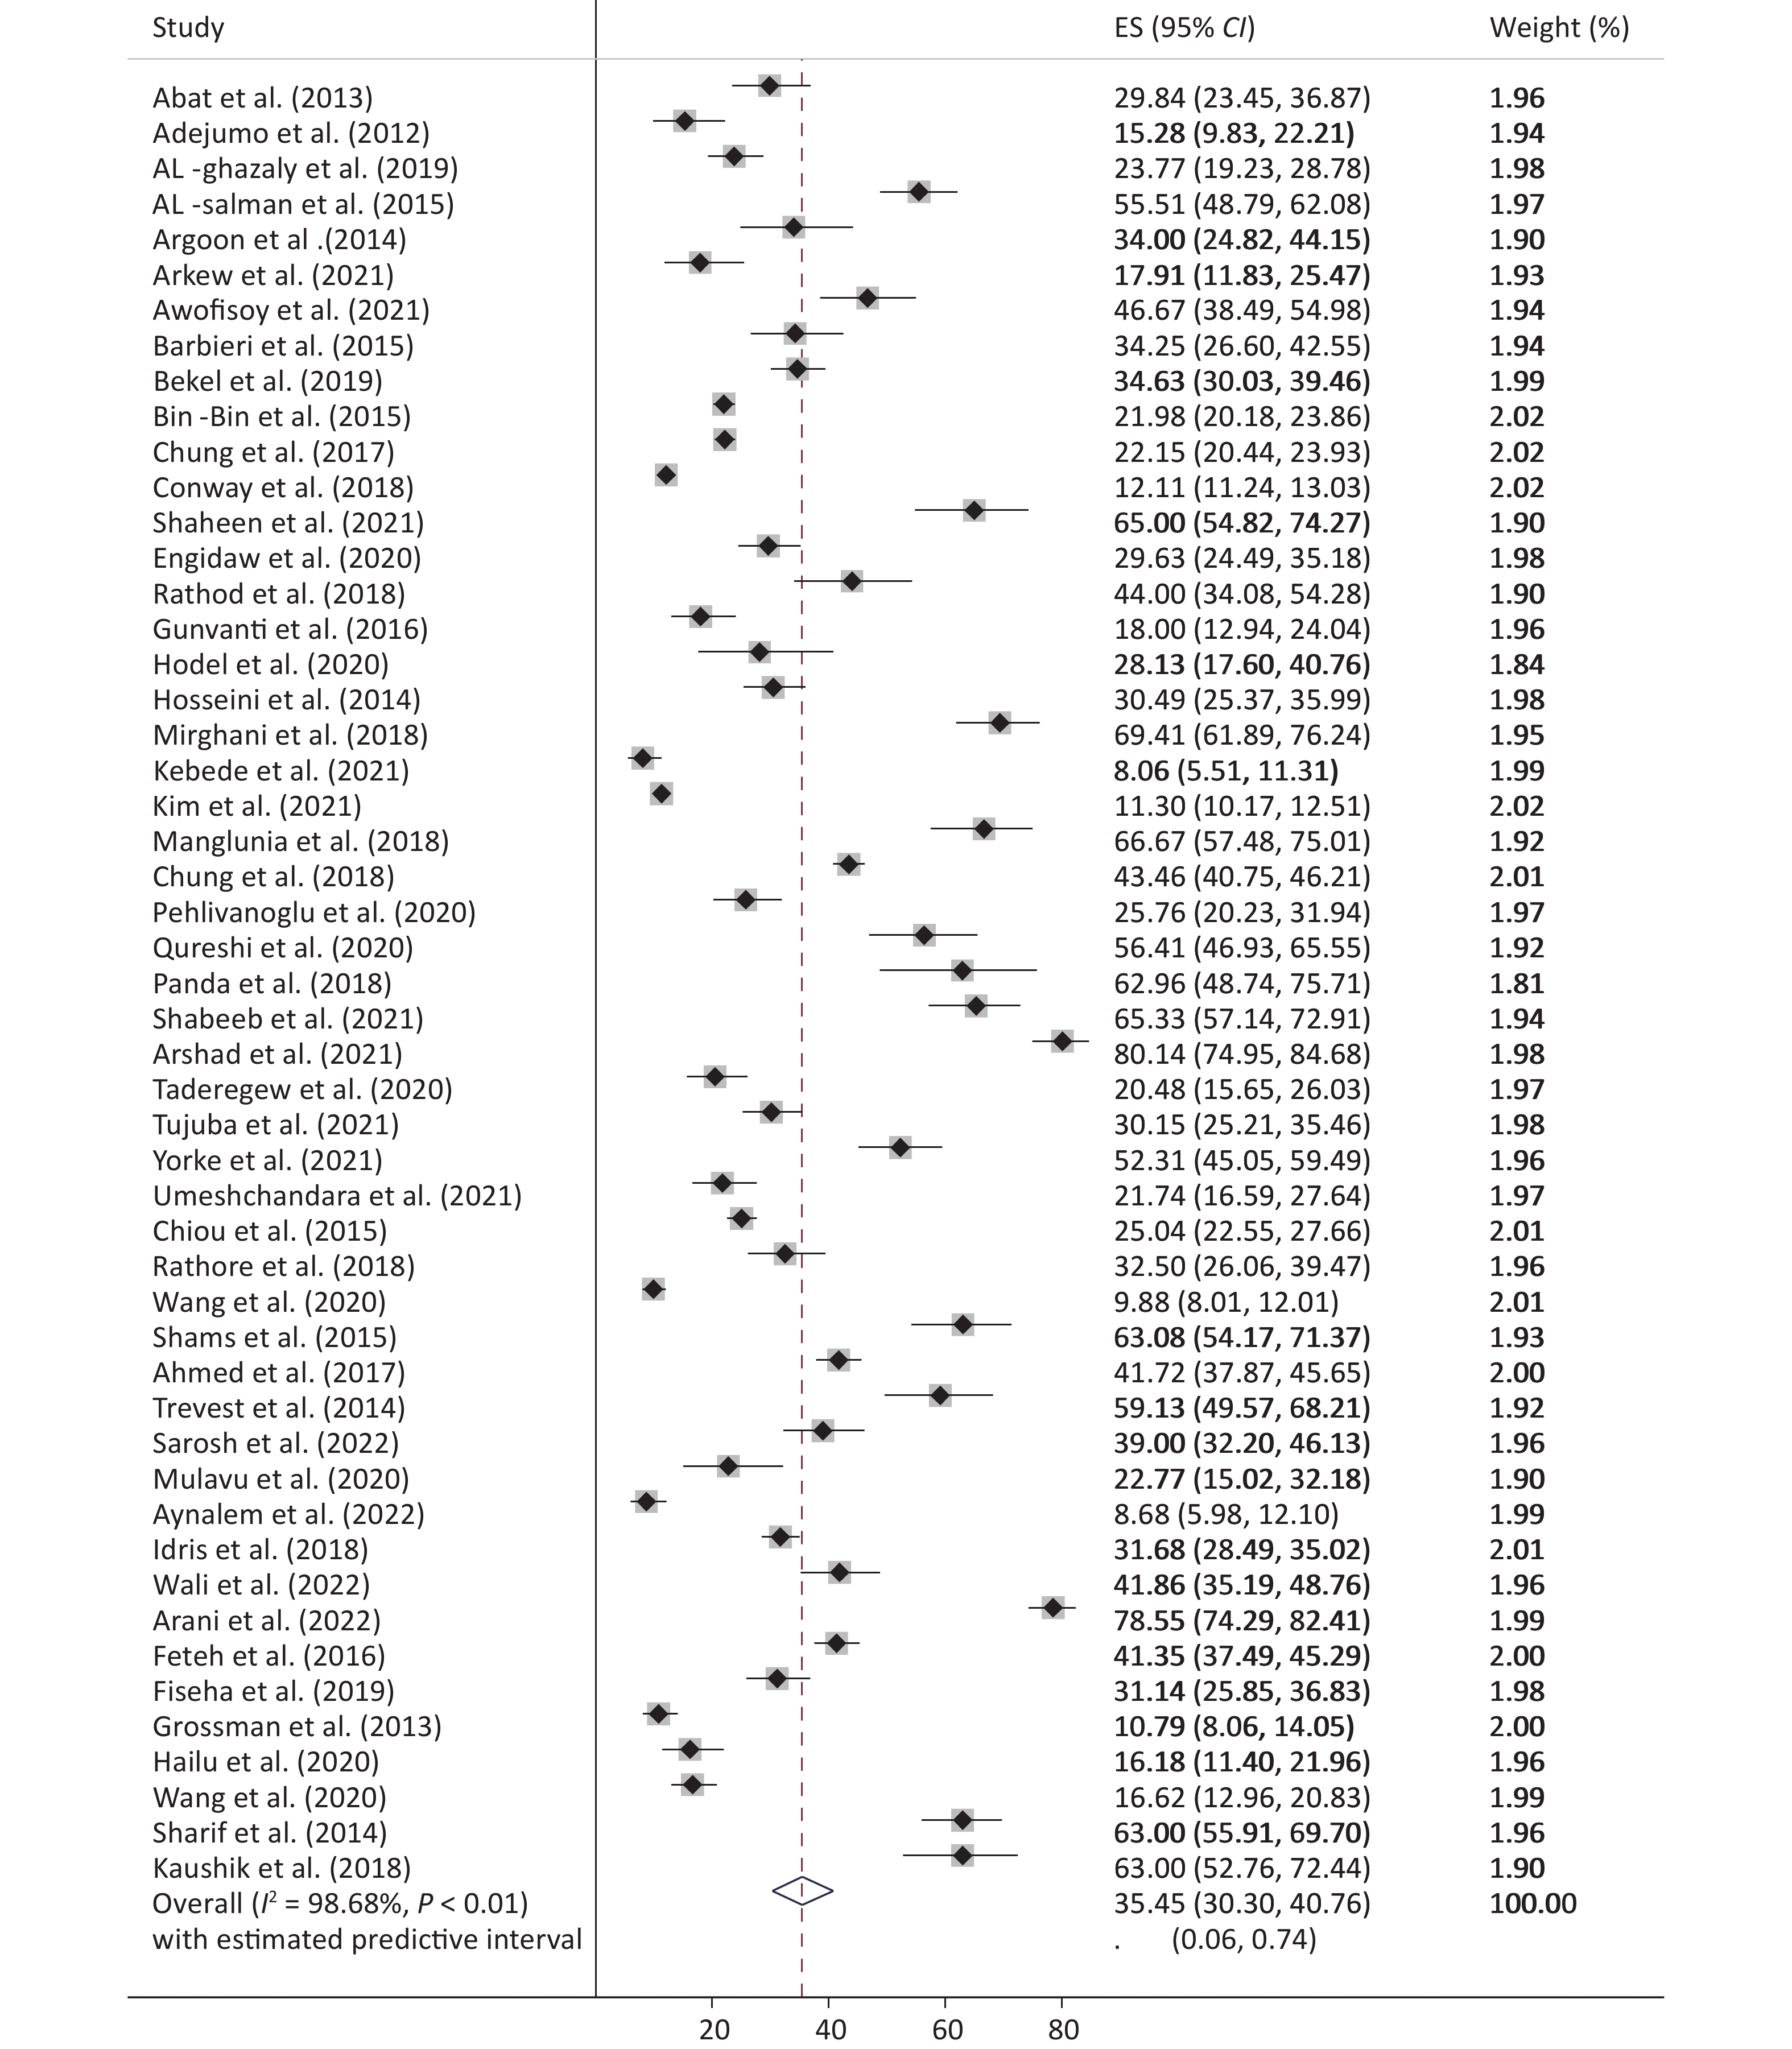
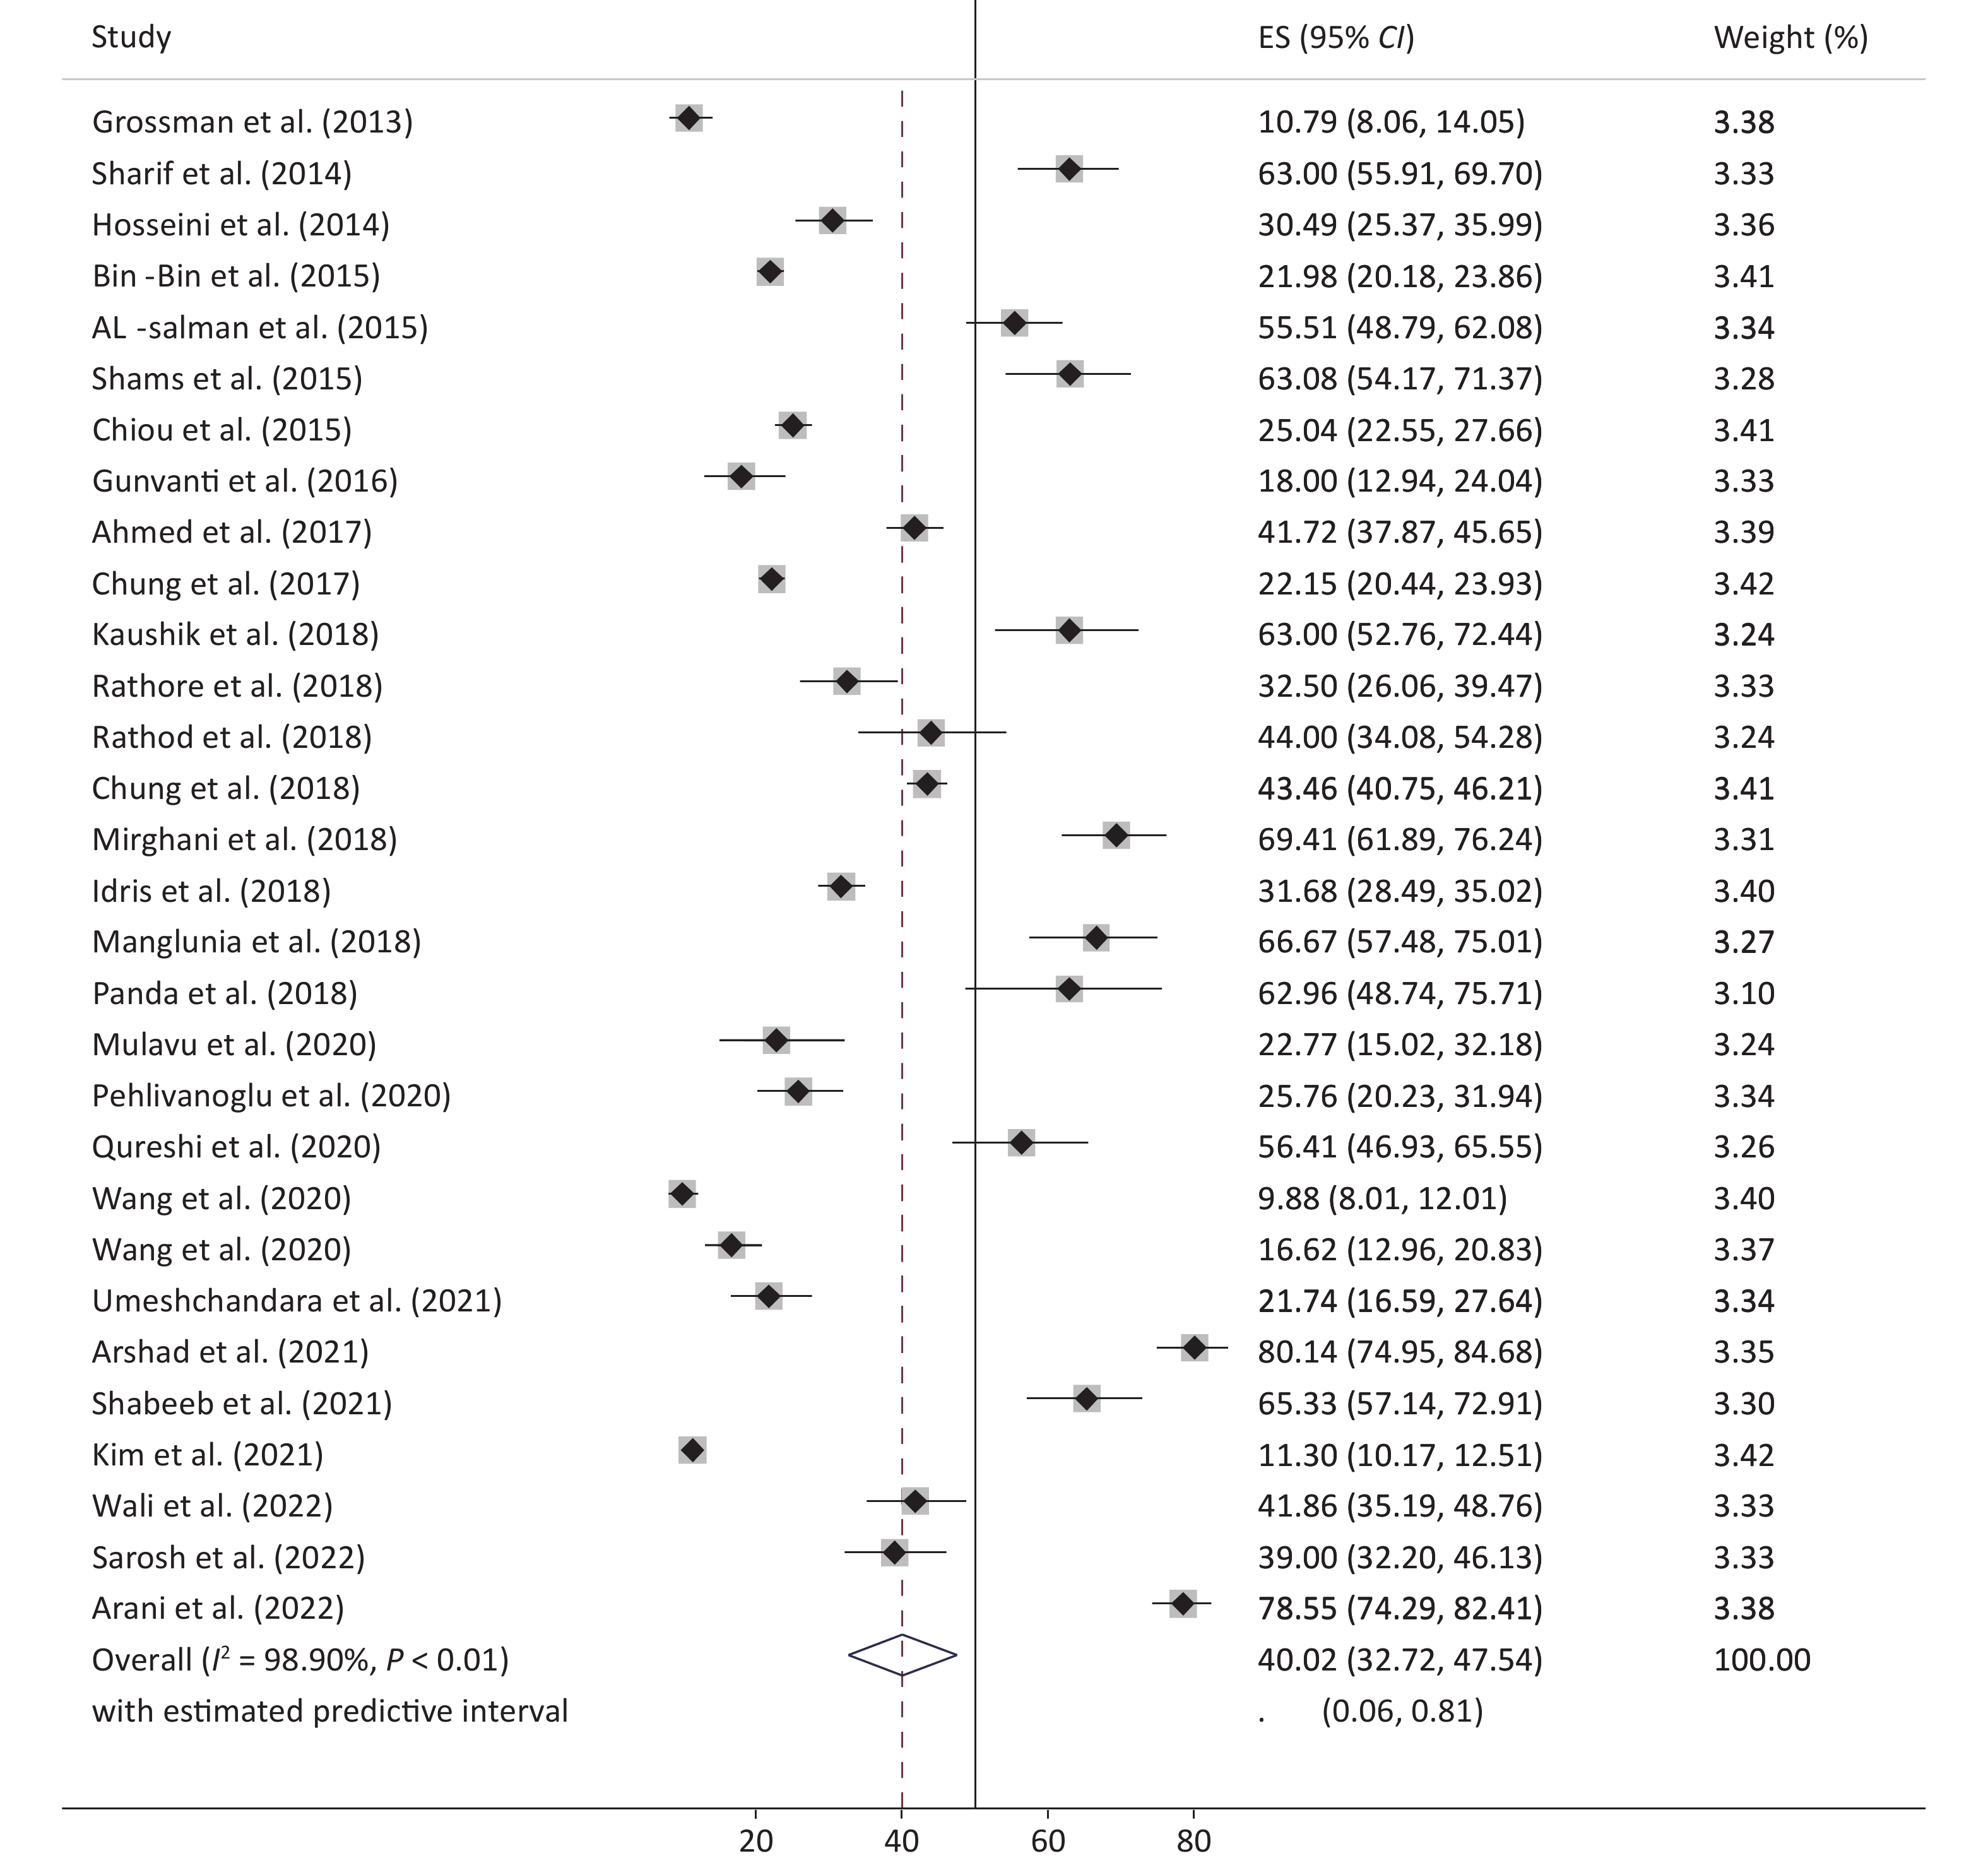
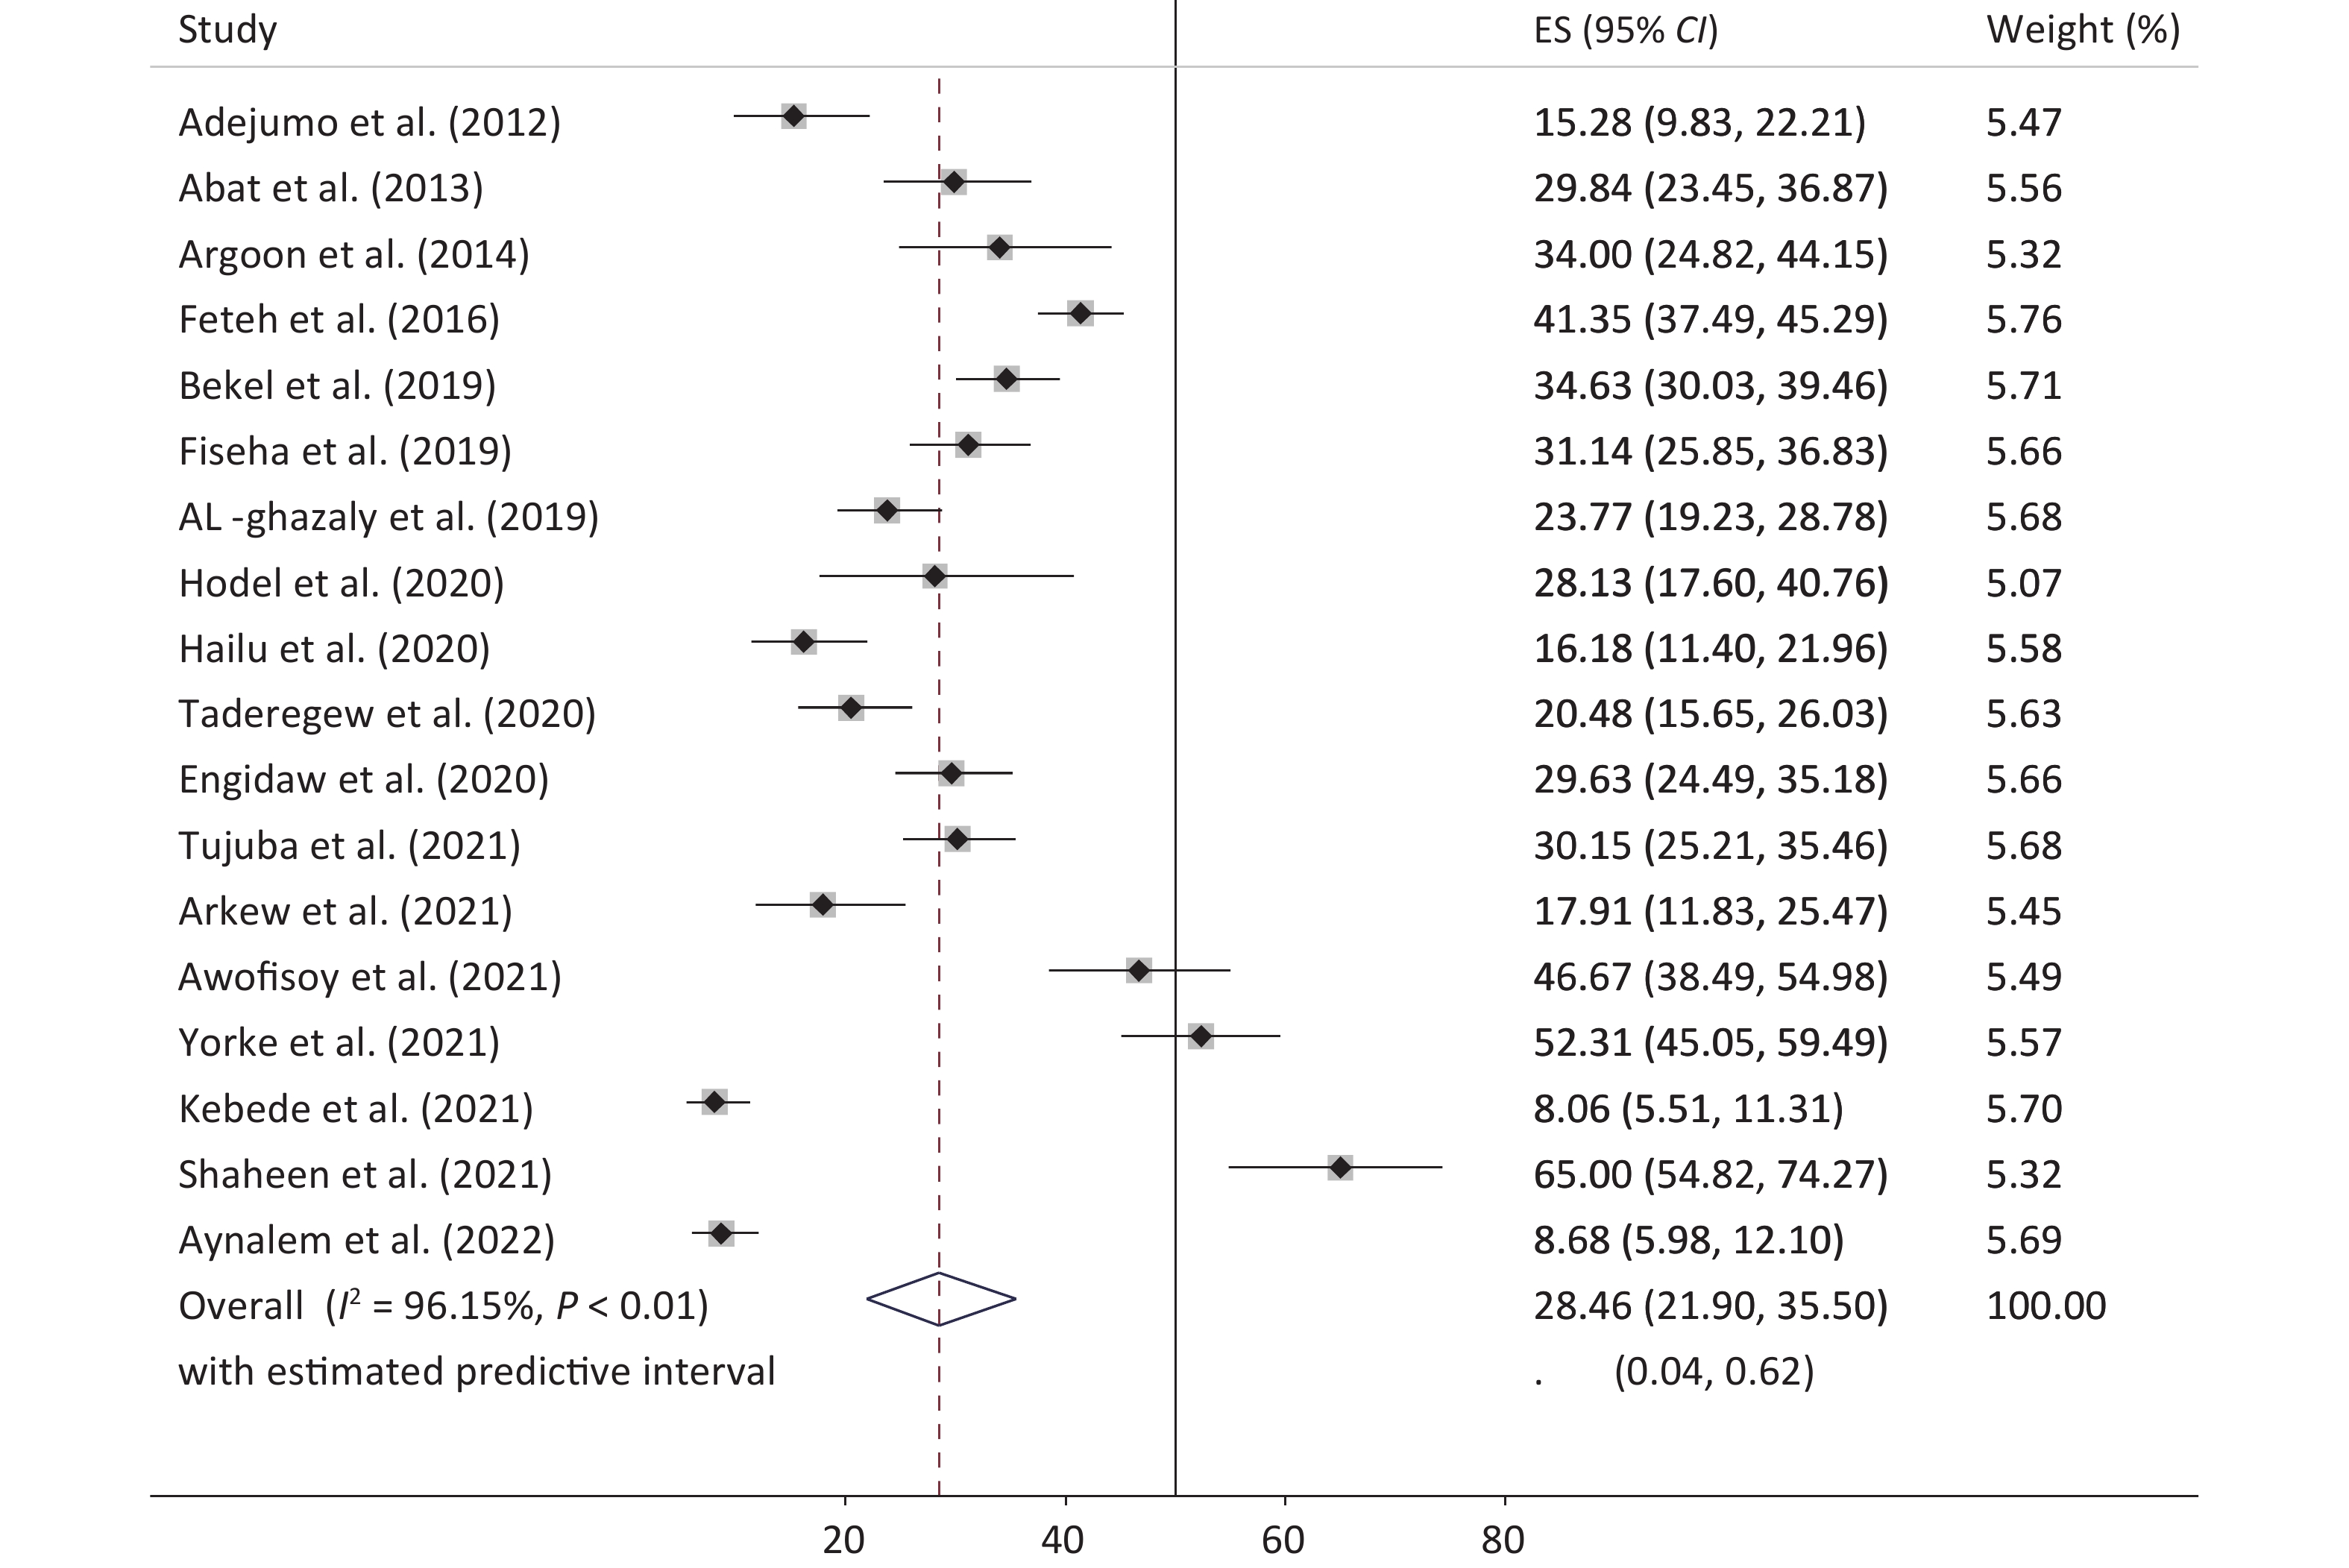
Table 1 presents the meta-analysis results of the pooled prevalence of anemia in patients with diabetes and its subgroups by year, continent, age, and sex. The pooled prevalence of anemia across all samples was 35.45 (95% CI: 30.30–40.76) (Figure 2), with an effect size of 35.0 (95% CI: 29.85–40.32) excluding the study by Trevest et al.[24], with approximately similar estimates of 36.18 (95% CI: 29.77–42.83) for men and 36.52 (95% CI: 29.31–44.04) for women. Owing to the limited number of studies conducted in Europe and the US, it was not possible to estimate their effect size accurately. However, in Asia and Africa (Figures 3 and 4), the prevalence of anemia in patients with diabetes was significantly higher in Asia (40.02, 95% CI: 32.72–47.54) than in Africa (28.46; 95% CI: 21.90–35.50) (P for heterogeneity = 0.029). This difference was more pronounced in Asian men and women than in their African counterparts, with Asian women showing a larger effect size than Asian men (44.54, 95% CI: 39.43–49.44 vs. 29.85, 95% CI: 23.17–37.35). The trend of reporting the prevalence of anemia in patients with diabetes has increased over time in recent years. However, many factors may have influenced these changes and their distribution.
Group Number of studies Pooled ES (95% CI) Heterogeneity Publication bias (P-value) I2 (%) P-value Begg’s Egger’s Total Total 51 35.45 (30.30–40.76) 98.68 0.001 without (Trevest) 50 35.0 (29.85–40.32) 98.69 0.001 Subgroup analysis Year of publication 0.01 0.001 2012 1 15.28 (9.83–22.21) − − 2013 2 15.70 (12.96–18.64) − − 2014 4 46.48 (29.02–64.39) 95.57 0.001 2015 5 38.97 (26.85–51.83) 97.81 0.001 2016 2 35.30 (32.09–38.58) − − 2017 2 26.19 (24.60–27.82) − − 2018 9 46.43 (30.34–62.90) 99.27 0.001 2019 3 29.80 (23.53–36.48) − − 2020 9 23.97 (16.36–32.52) 95.22 0.001 2021 10 38.28 (21.41–56.73) 99.15 0.001 2022 4 40.70 (10.21–75.93) 99.37 0.001 Continent Africa 18 28.46 (21.90–35.50) 96.15 0.001 Asia 30 40.02 (32.72–47.54) 98.90 0.001 America 2 12.47 (11.60–13.38) − − Europe 1 59.13 (49.57–68.21) − − Age category, years < 56 28 39.43 (31.92–47.19) 97.13 0.001 ≥ 56 23 30.82 (24.22–37.83) 99.07 0.001 Male Total 34 36.18 (29.77–42.83) 96.37 0.001 0.005 0.001 Year of publication 2014 4 43.32 (27.49–59.87) 89.78 0.001 2015 3 37.58 (14.87–63.54) − − 2018 5 52.42 (34.44–70.08) 94.09 0.001 2019 3 33.11 (22.96–44.10) − − 2020 4 26.57 (11.41–45.21) 93.95 0.001 2021 10 39.13 (21.95–57.79) 98.06 0.001 Continent Africa 14 29.83 (21.9–38.40) 93.27 0.001 Asia 18 39.43 (29.85–49.44) 97.45 0.001 Female Total 32 36.52 (29.31−44.04) 97.17 0.001 0.02 0.003 Year of publication 2015 3 48.17 (19.89−77.09) − − 2018 5 56.33 (33.44−77.93) 95.32 0.001 2019 3 24.15 (19.01−29.68) − − 2020 4 34.56 (24.73−45.09) 79.54 0.001 2021 10 37.58 (20.05−56.95) 98.61 0.001 Continent Africa 14 26.21 (18.25−35.01) 94.23 < 0.001 Asia 17 44.54 (33.28−56.08) 98.08 0.002 Note. ES, effect size. Table 1. The overall and subgroup prevalence of anemia in diabetes mellitus
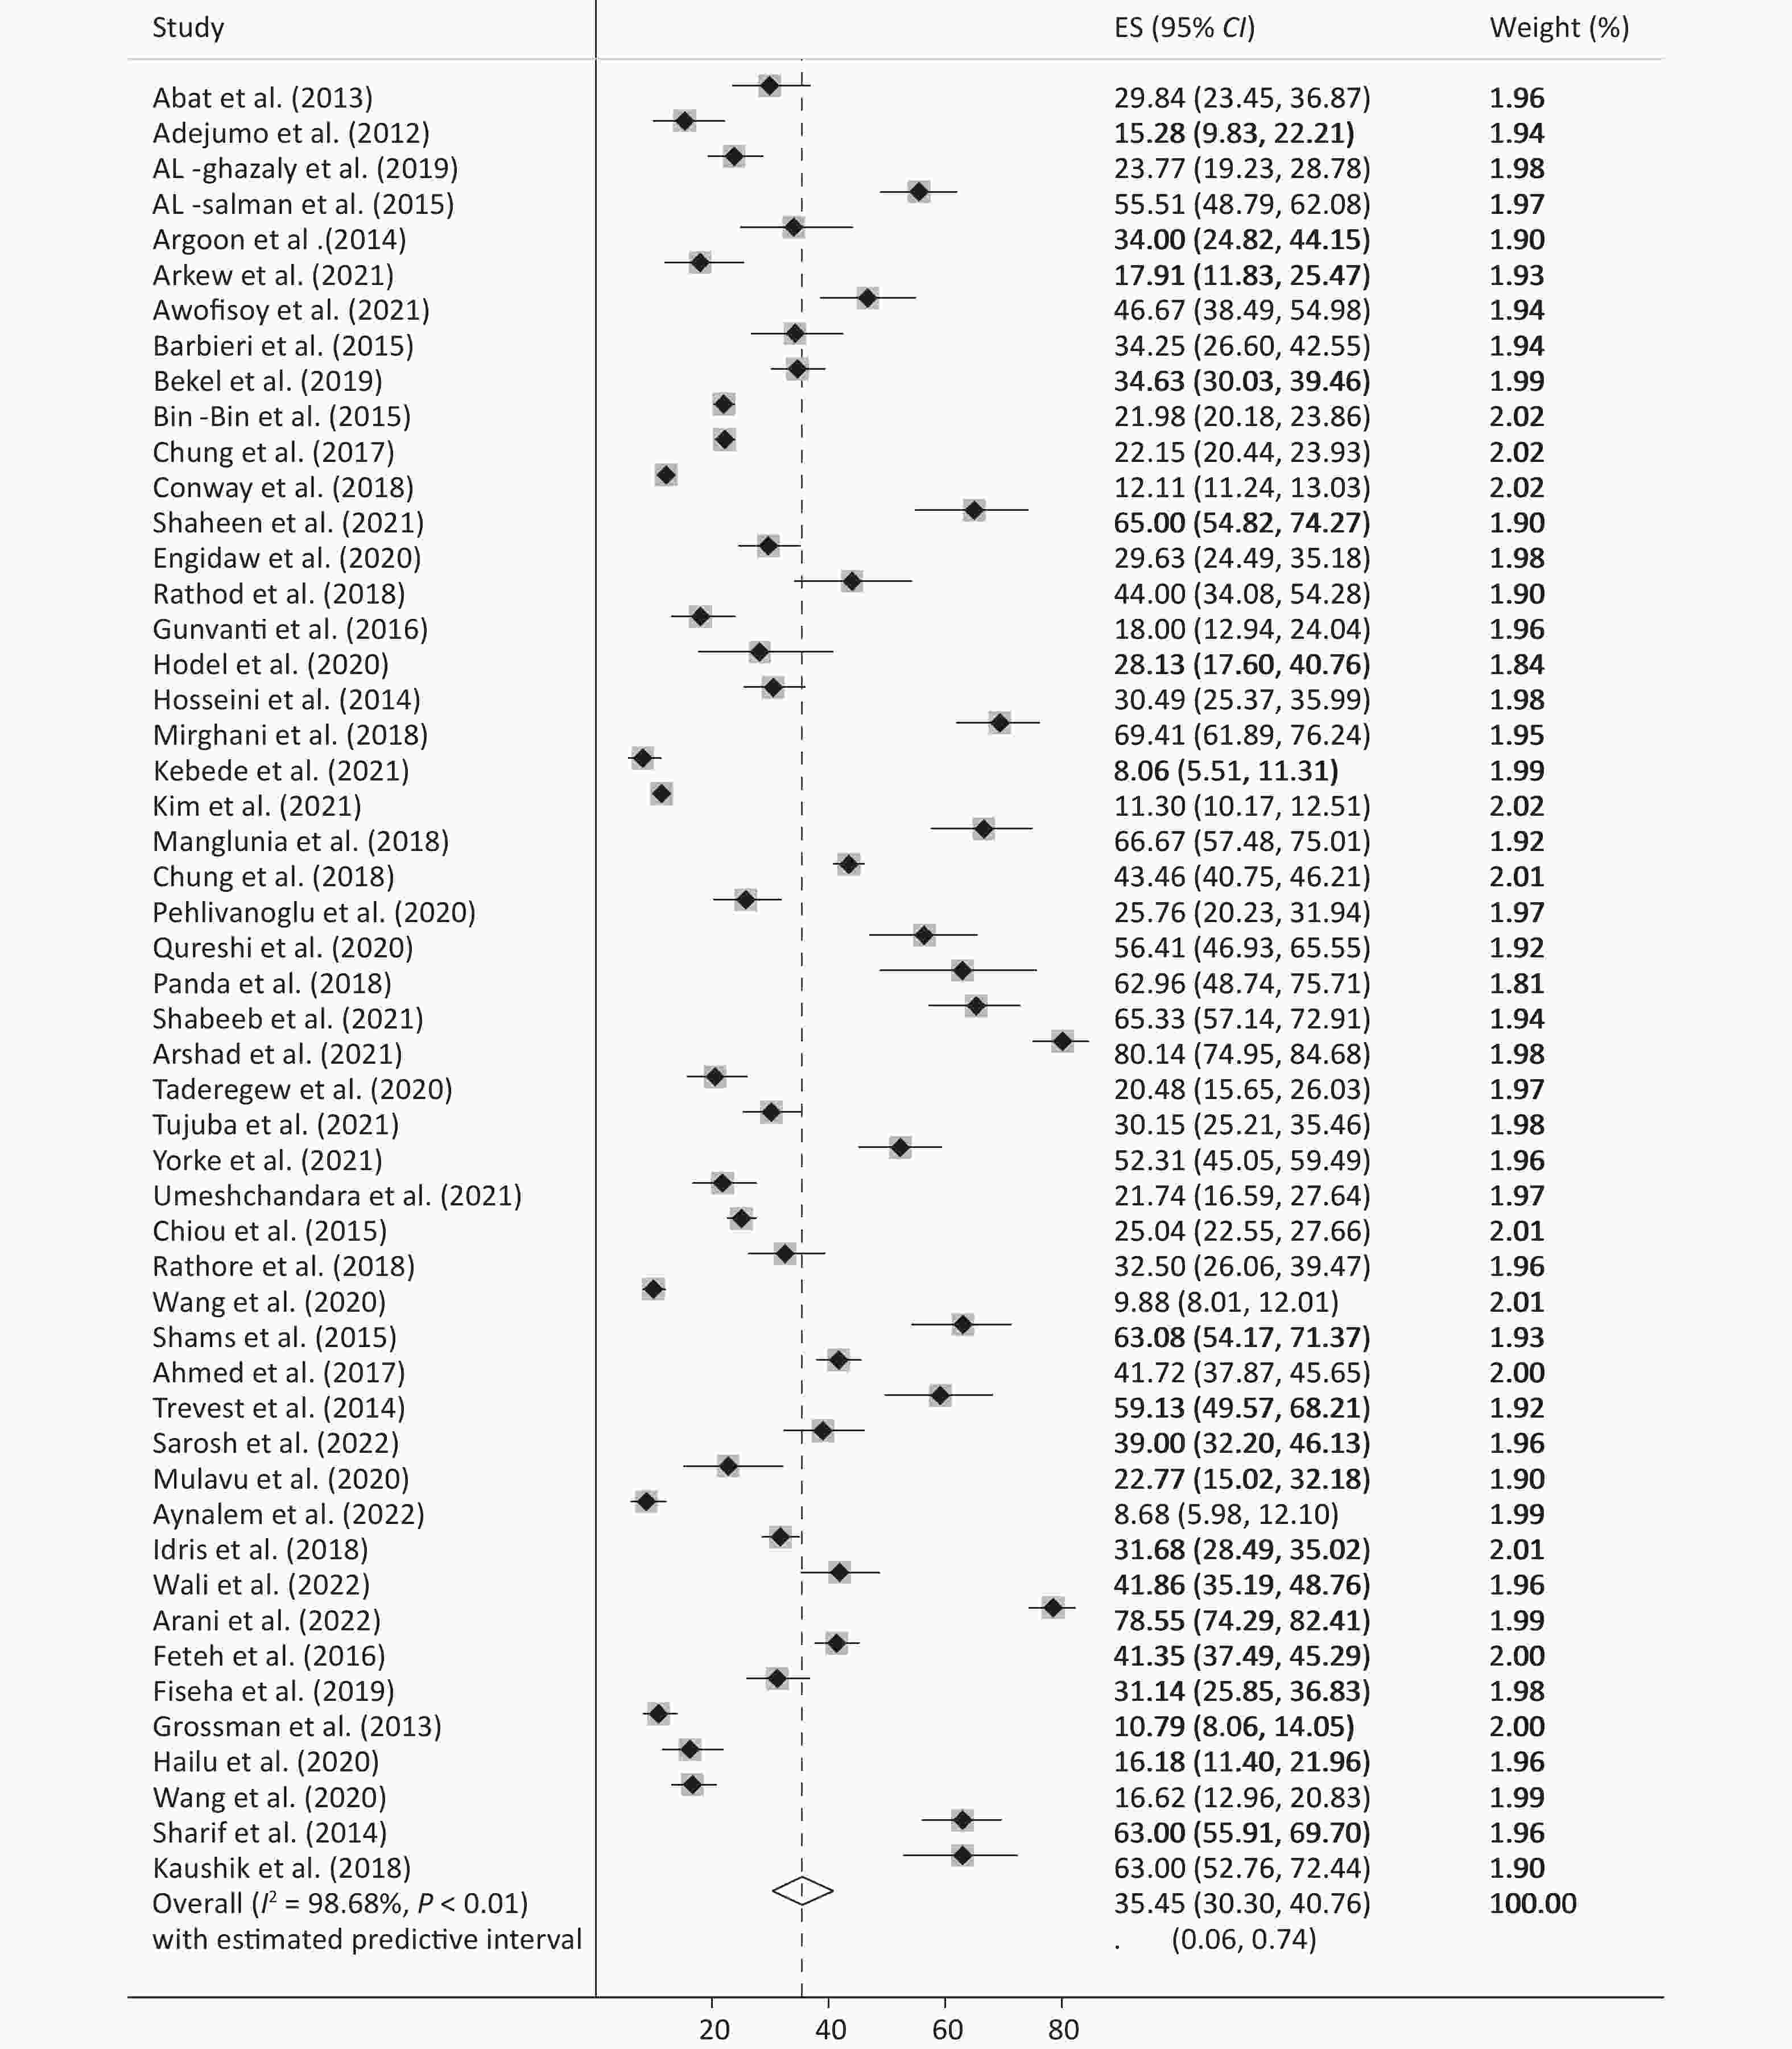
Figure 2. Pooled prevalence anemia in patients with diabetes.
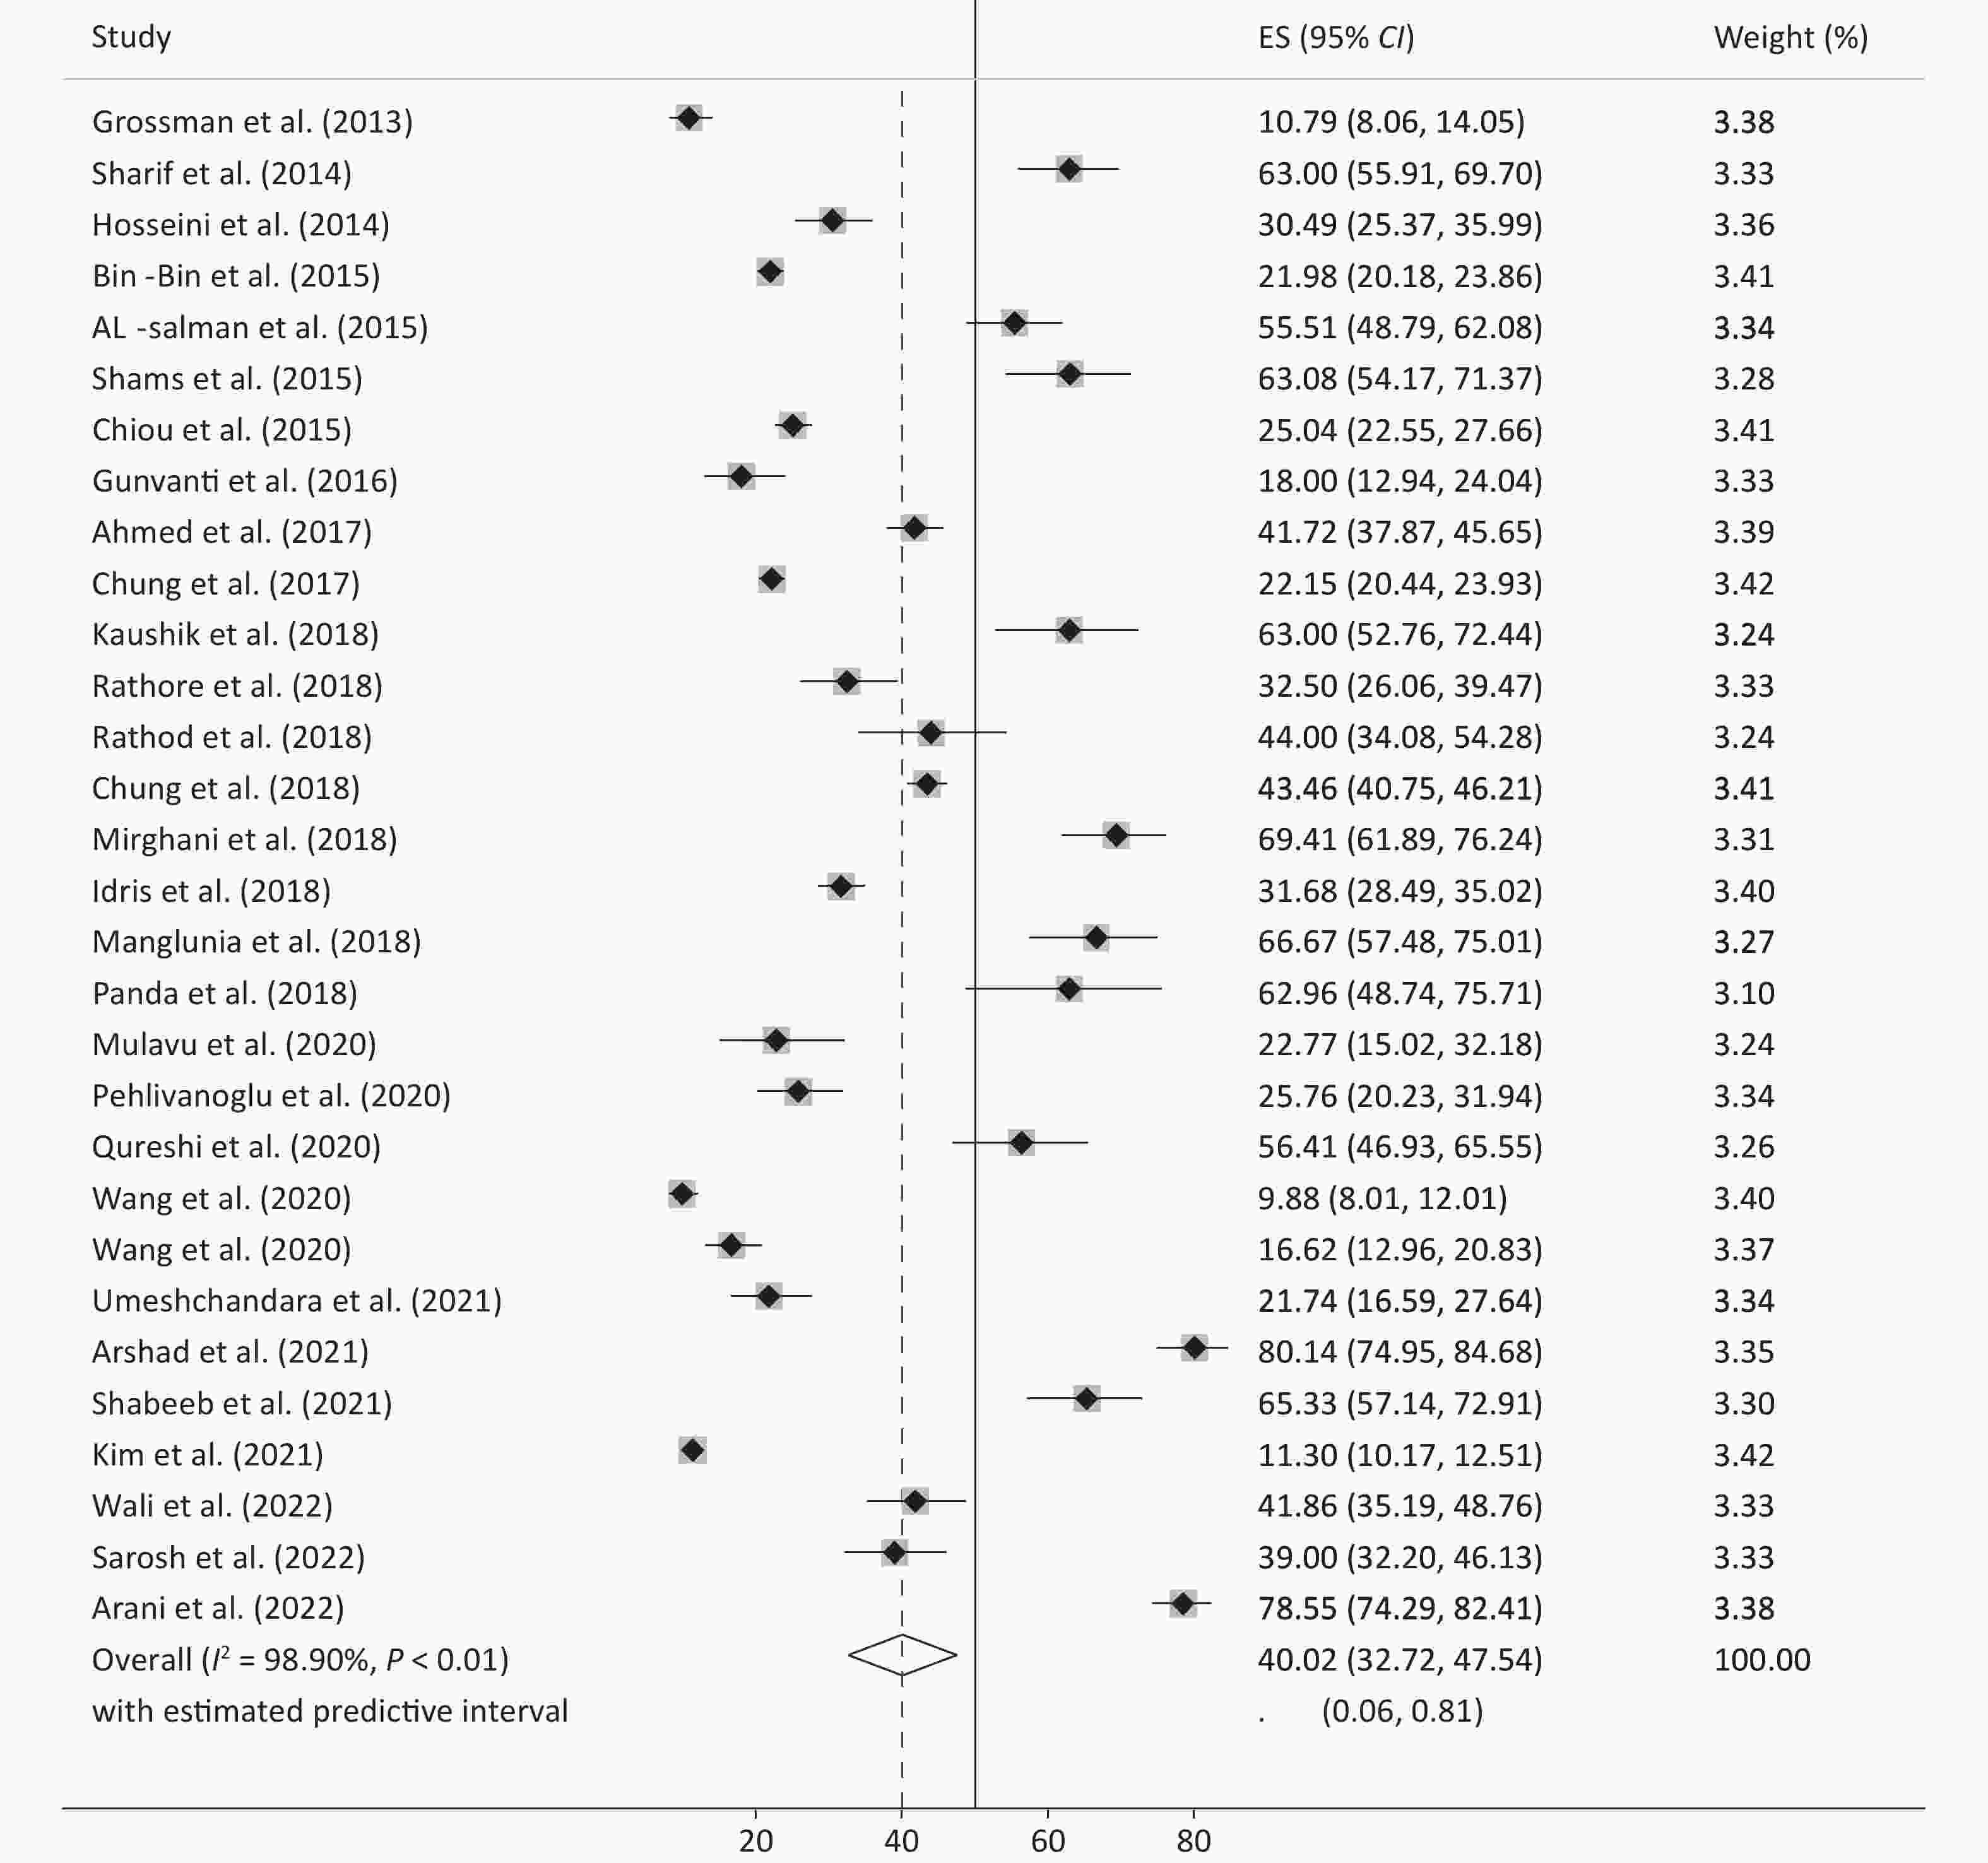
Figure 3. Pooled prevalence anemia in patients with diabetes in Asia.
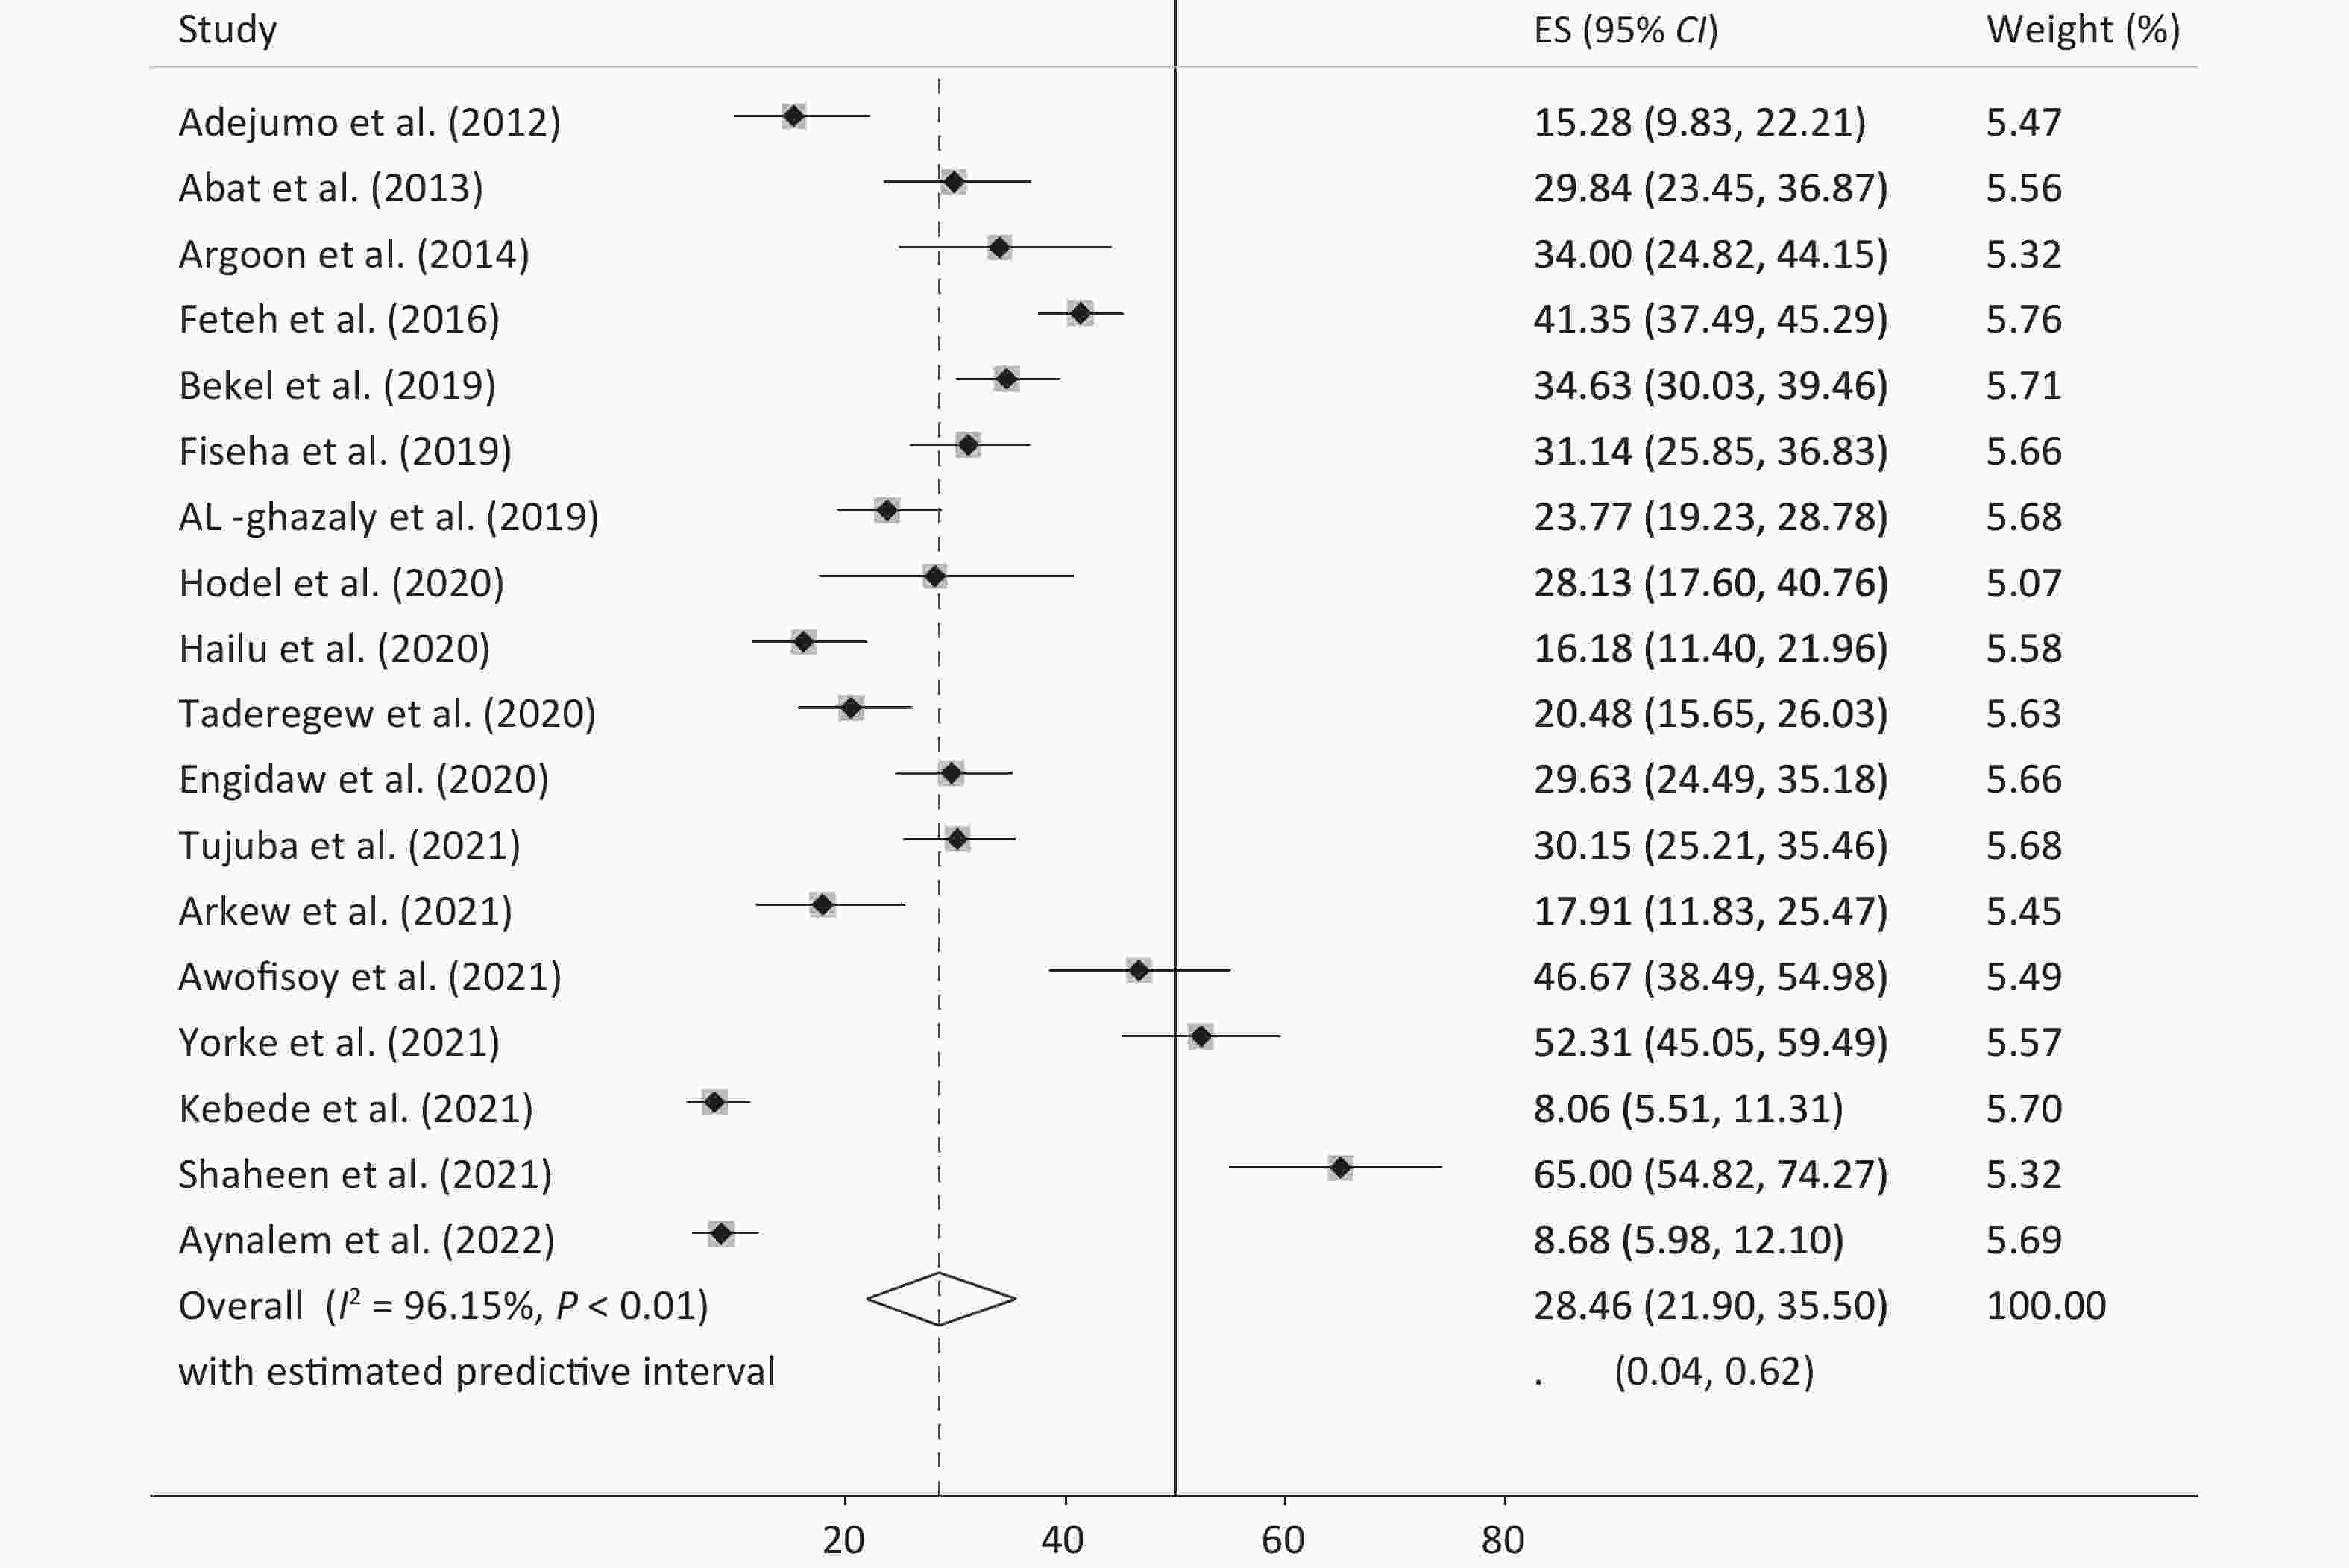
Figure 4. Pooled prevalence anemia in patients with diabetes in Africa.
Table 2 shows the indicators related to patients with diabetes. The prevalence of anemia was higher in insulin recipients than in metformin recipients (46.97% vs. 43.59%). Patients with diabetes and poor diabetes control had a higher prevalence of anemia (31.96%, 95% CI: 20.82%–44.24%). The pooled prevalence of anemia was also higher in patients with longer disease duration. The effect size was estimated to be 46.93% in patients with > 10 years of illness, 36.71% in those with 5–10 years of illness, and 21.62% in those with < 5 years of illness.
Variables Number of studies Pooled ES (95% CI) Heterogeneity Publication bias (P-value) I2 (%) Tau2 Begg’s Egger’s Metformin 4 43.59 (28.75–59.03) 89.50 0.08 0.497 0.183 Insulin 6 46.97 (25.54–68.98) 96.59 0.28 0.091 0.033 Poor control 10 31.96 (20.82–44.24) 96.64 0.16 0.421 0.179 Good control 10 23.84 (17.03–31.36) 84.20 0.06 0.421 0.919 Duration < 5 (years) 13 21.62 (13.76–30.65) 94.56 0.13 0.100 0.239 Duration 5–10 (years) 13 36.71 (25.16–49.07) 95.94 0.19 0.393 0.321 Duration > 10 (years) 10 46.93 (30.35–63.85) 95.98 0.28 0.835 0.585 Note. ES, effect size. Table 2. Summary of the analysis of the indicators related to patients with diabetes
In Table 1, although the values of some subgroups are reported despite the limited number of studies, only subgroups with at least three pooled studies reported the prevalence of anemia in other strata to determine the size of their effect.
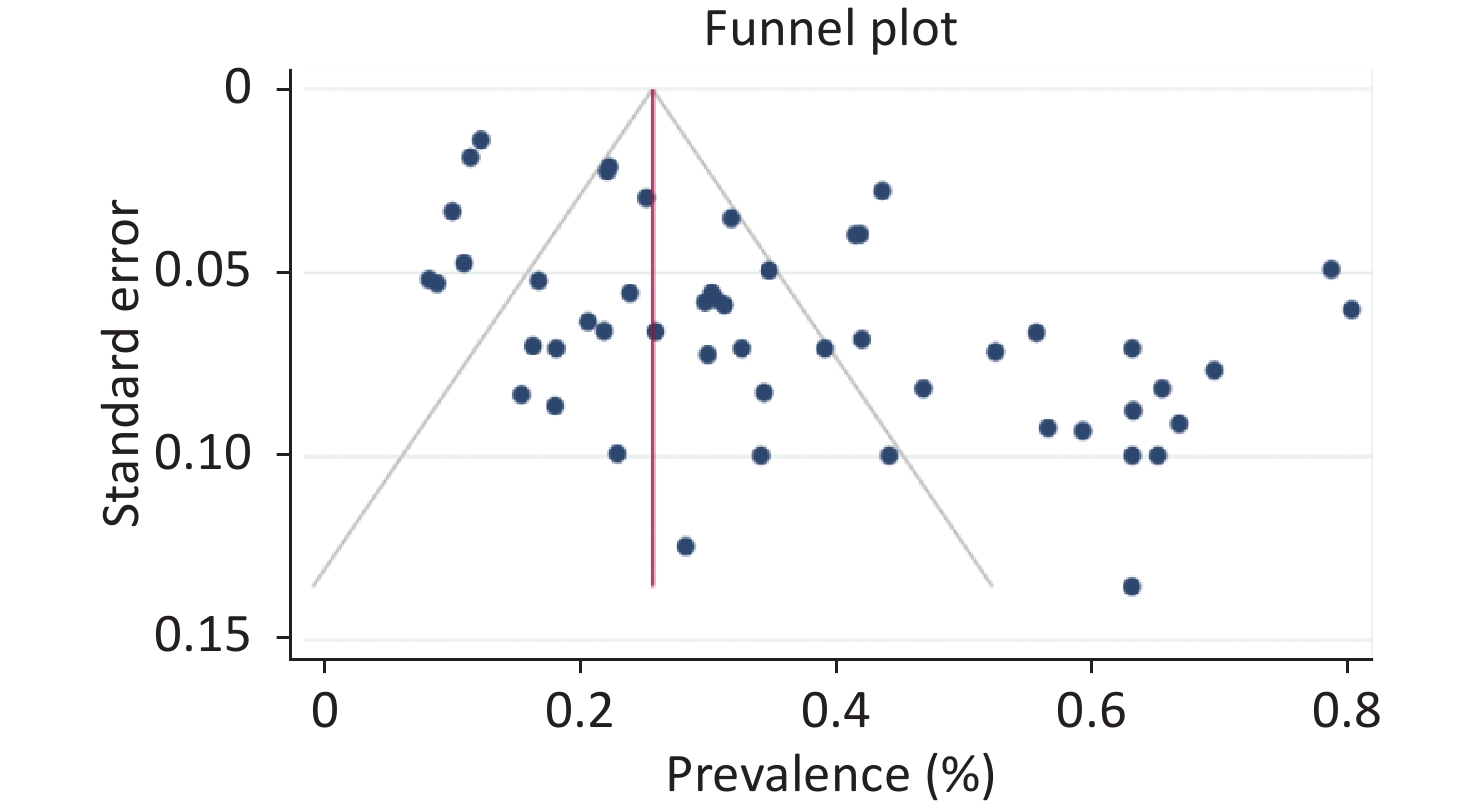
Publication bias and sensitivity analysis were performed using Begg's and Egger's tests. Publication bias was not observed for indicators related to diabetes (metformin, insulin, poor and good control, and duration; P > 0.05) but was observed in the sex subgroup (P < 0.05). The small number of studies in some subgroups and the context of the present review affected the publication bias. In any case, the prevalence is positive, and the lack of studies with negative prevalence can cause errors in estimating prevalence. Furthermore, the single group used in this review affected the values. Sensitivity analysis indicated that the results were not influenced by a single study and did not alter the direction of estimation (Figure 5, Table 1). Figure 6 shows the prevalence of the pooled effect size according to year.
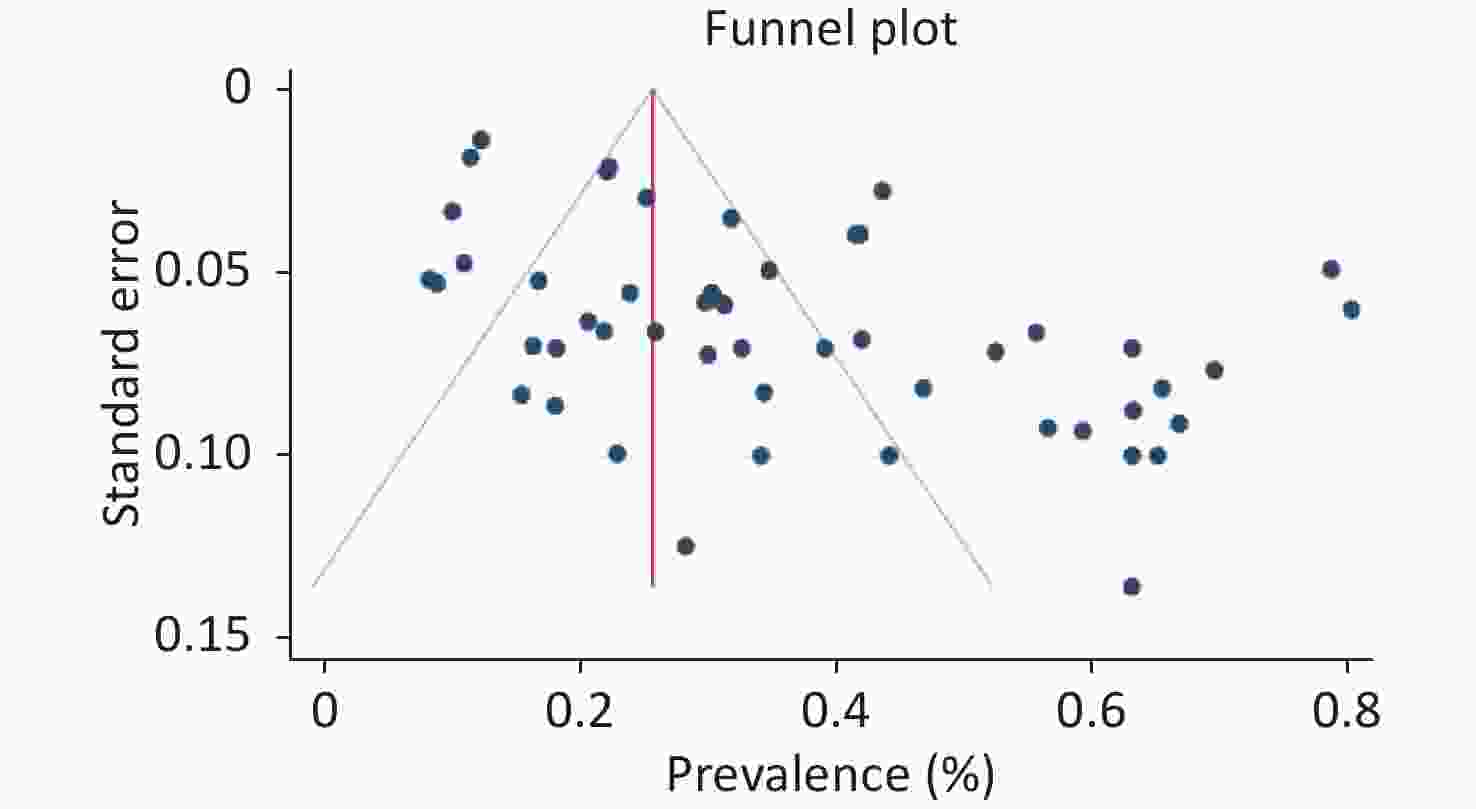
Figure 5. Funnel plot for prevalence anemia in patients with diabetes.
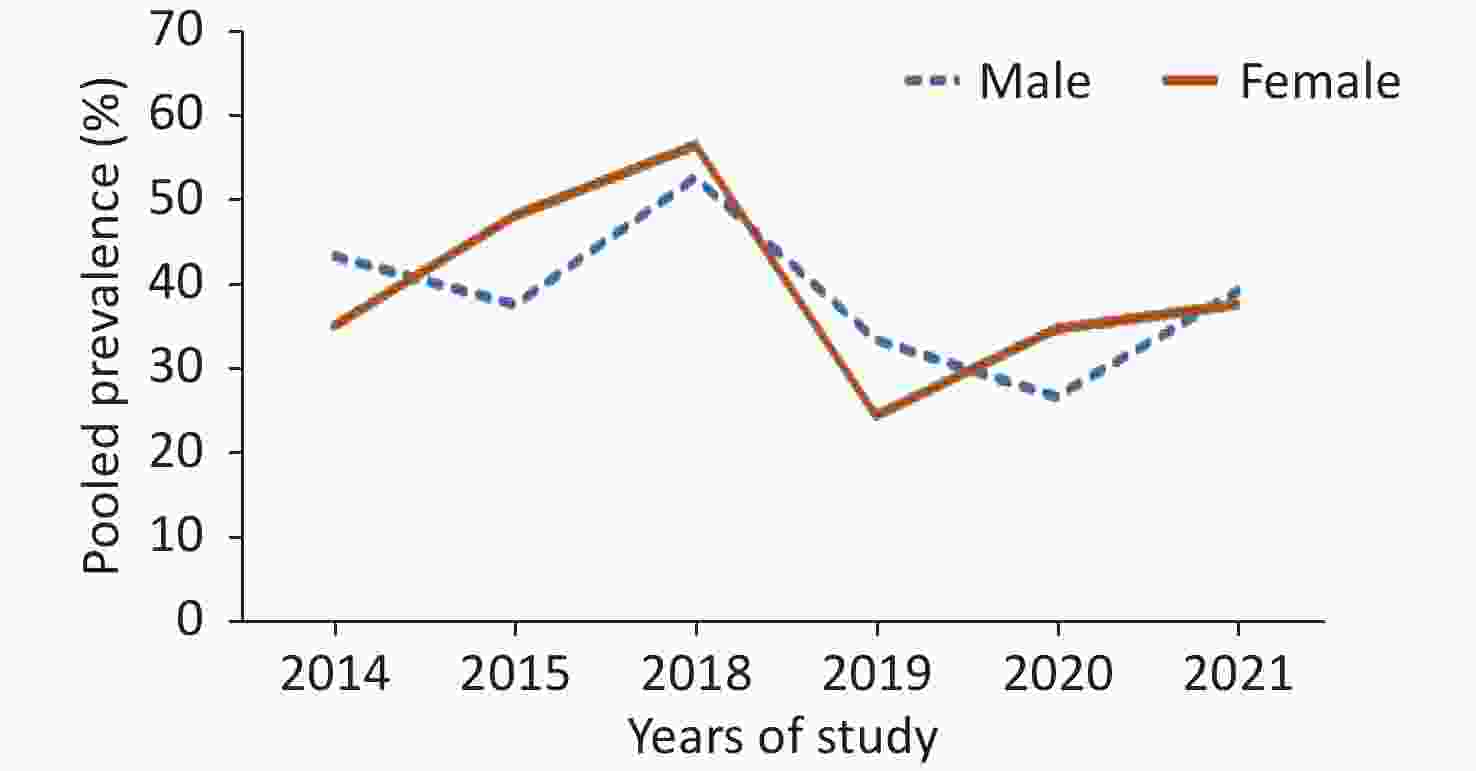
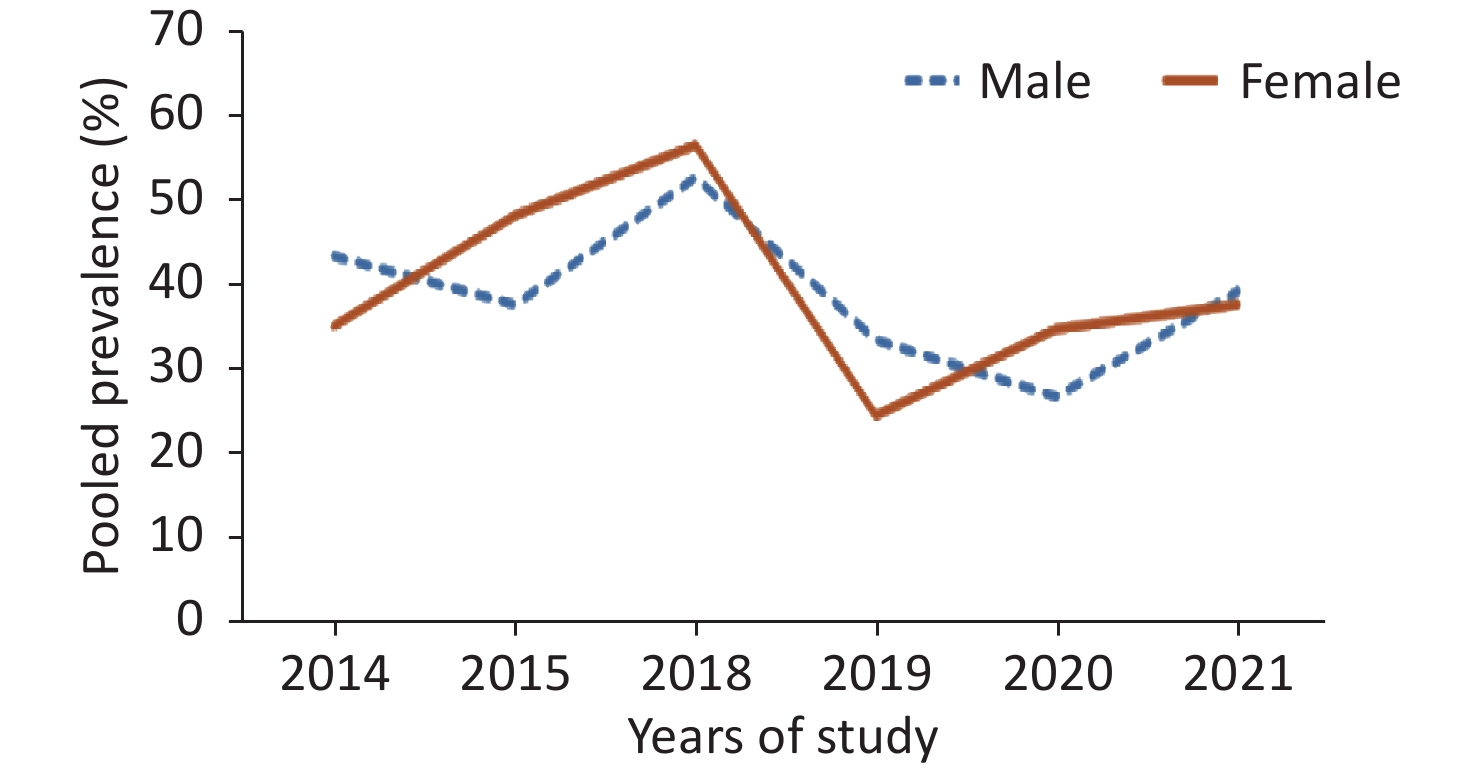
Figure 6. Prevalence of pooled effect size according to year.
-
Anemia negatively impacts the quality of life of individuals, particularly adults with diabetes, and is associated with all-cause mortality[30]. In this systematic review and meta-analysis, we analyzed 51 eligible studies published between 2010 and 2021 involving 26,485 participants worldwide to determine the prevalence of anemia in adults with diabetes worldwide. According to previous reports, the prevalence of anemia in adults with diabetes is 36%[8]. Our study found that the pooled estimate for the prevalence of anemia in adults with diabetes was 35.45% [95% CI: 30.30–40.76], comparable to recent research[8,31]. Our results indicated that the prevalence of anemia in patients with diabetes was similar in males and females. Overall, our study highlights the significant prevalence of anemia in adults with diabetes and underscores the need for effective screening and management strategies to improve their quality of life and reduce the risk of all-cause mortality.
In our study, the prevalence of anemia in men was 36.52%, consistent with other studies[32-34]. Similarly, the prevalence of anemia in women was 36.18%, also consistent with various studies[35-37]. The prevalence of anemia in individuals with diabetes was 34.2% in our study, while it was reported to be 21.9% in Brazil and 59.2% in England[24,38,39]. Subgroup analysis revealed a higher prevalence of anemia in Asian women with type 2 diabetes than in Asian men and in Asia compared to Africa. These findings are supported by previous studies[35], although some studies have reported a higher prevalence of anemia in diabetic men[40,41]. The higher prevalence of anemia in women could be attributed to physiological factors such as menstrual cycles and childbirth, as well as nutritional and sex inequalities, particularly in low- and middle-income countries.
Our study also identified several risk factors associated with anemia in type 2 diabetes patients, including the type of treatment received (metformin or insulin injection), duration of diabetes, and hemoglobin A1c (HbA1c) levels. In line with our findings, other studies have also identified the type of treatment as a determining factor in anemia development in diabetic individuals[15,42]. Our study further revealed that the duration of diabetes is also an effective factor in anemia prevalence, with type 2 diabetes lasting for more than five years. Age, medication use, and control of blood sugar levels also play significant roles in the development of anemia[40,43,44].
The results of our study indicated a higher prevalence of anemia among patients with a longer duration of diabetes. Specifically, the prevalence of anemia was 46.93% in patients with diabetes for more than 10 years, 36.71% in those with diabetes for 5–10 years, and 21.62% in those with diabetes for less than 5 years. These findings are consistent with those of a study conducted by Fiseha and Kebede[33,45], who reported a similar association between diabetes duration and anemia prevalence. However, our results were not consistent with those of Al-Ghazaly and Yorke[16,46]. The observed discrepancy in the results could be attributed to several factors, including differences in sample sizes, racial and ethnic variations among the study populations, and the presence of confounding variables.
The results of our study showed that the prevalence of anemia was higher in insulin users than in metformin users (46.97% vs. 43.59%). However, other studies reported contrasting findings, indicating a higher prevalence of anemia in metformin users than in insulin users[47,48]. These discrepancies in results may be attributed to factors such as the presence of co-morbidities, differences in nutritional habits, and variations in socioeconomic status among the populations studied[47-49].
Additionally, our study found that patients with diabetes with poor diabetes control had a higher prevalence of anemia (31.96%) than those with better control. This finding is consistent with those of previous research highlighting the association between poor diabetes control and anemia[47,48]. Furthermore, we found that the prevalence of anemia was higher in diabetic patients with poor diabetes control (31.96%) than in those with better diabetes control.
Anemia in patients with diabetes has several clinical implications. For example, anemia can influence glycemic control indicators, such as glycated hemoglobin (HbA1c)[49,50]. This causes falsely low levels of glycosylated hemoglobin in diabetic patients, which may lead to complications of diabetes[51,52]. Additionally, iron, vitamin B12, or folate deficiency anemia can increase HbA1c levels, irrespective of blood glucose levels[53,54]. Furthermore, anemia may worsen diabetic complications, particularly heart failure[53,55]. Patients with diabetes and anemia tend to have more comorbidities, are hospitalized more frequently, and have a higher risk of death[56]. These findings highlight the importance of addressing anemia in the management of diabetes to improve patient outcomes.
Our findings were consistent with an African meta-analysis study[8], but contradicted those of Taderegew and Fiseha[33,57]. We also observed that the prevalence of anemia in patients with diabetes varied over time (2010–2021) and has increased significantly in recent years. Many factors may contribute to these changes, such as lifestyle changes, increased consumption of fast and prepared foods, and a decline in socioeconomic status, particularly in low- and middle-income countries. We also found that the prevalence of anemia in patients with diabetes was significantly higher in Asia than in other regions of the world, which may be related to the lifestyle and dietary habits of the population, particularly the excessive consumption of carbohydrates[54]. Our findings are consistent with those of other studies showing a correlation between anemia and cultural, socioeconomic, and income-related factors[15,58,59].
One of the limitations of our study was the inability to distinguish the relationship between variables related to anemia, such as medication use, good and poor diabetes control, and diabetes duration, specifically in men. Additionally, we did not explore the impact of nutrition type and diet quality in patients with diabetes, which are important factors that can contribute to the development of anemia. Furthermore, we acknowledge that blood sugar control, as indicated by HbA1C levels, is a critical factor in the management of diabetes and its complications. However, we did not specifically investigate the relationship between HbA1C levels, medication adherence, dietary quality, and the occurrence of anemia in our study. We appreciate your insightful comment that highlights these important factors. In future research, it would be valuable to explore the individual contributions of medication use, diabetes control, diabetes duration, nutritional type, and dietary quality to the development of anemia in both men and women. Additionally, investigating the relationship between HbA1C levels, medication adherence, dietary quality, and anemia occurrence could provide further insights into the complexities of managing diabetes and its associated complications.
-
This study provides a reliable estimate of the prevalence of anemia in patients with diabetes mellitus worldwide. The results showed that the overall prevalence of anemia in patients with type 2 diabetes was approximately 36% based on the WHO classification, which places it at a medium level of public health importance. The prevalence of anemia was almost the same for men and women; however, it was higher in Asia than in Africa. The risk factors associated with anemia in patients with diabetes include the type of treatment received (metformin and insulin injection), diabetes duration (> 5 years), use of multiple medications, nutritional status, stress level, and age.
The prevalence of anemia was higher in patients with diabetes who took insulin than in those who took metformin. Therefore, routine screening for anemia in patients with type 2 diabetes is recommended at least once every 3 months to enable early diagnosis and prompt action to improve the quality of life of patients.
Furthermore, a cohort study with an appropriate sample size of patients with type 2 diabetes should be conducted to determine the effects of anemia on patients with diabetes and its determinant factors.
HTML
Diagnosis
Searching Strategy
Inclusion/Exclusion Criteria
Data Extraction
Quality Assessment
The WHO Diagnostic Criteria for Anemia
Heterogeneity Assessment and Statistical Analysis
Search and Selection
Study Characteristics
 bes23105+Supplementary Materials.pdf
|

|

 Quick Links
 DownLoad: