


-
Coal is one of the world’s main energy resources, accounting for approximately 68% of China’s current total power generation. However, several studies have demonstrated that dust, exhaust fumes, and other harmful factors in coal mines increase the risk of cardiovascular disease (CVD) among miners[1]. Arterial stiffness (AS) is an independent risk factor of CVD, and epidemiological studies have shown that AS plays a vital role in assessing the risk of CVD[2]. Currently, Pulse Wave Velocity (PWV) serves as the gold standard for assessing AS, and it is widely utilized in CVD screening for diagnosis[3]. Machine learning is an artificial intelligence technique that is widely used in disease diagnosis and prediction because it offers quick and accurate identification of risk factors and condition likelihoods[4]. Studies have shown that AS is associated with traditional CVD-related factors, such as blood pressure and lipids, as well as with coal dust and other harmful factors in coal mines[5]. Therefore, this study aimed to use these potential predictors to predict AS risk in coal miners using machine learning.
This study collected data from 1,535 coal miners employed by a major coal mining company in Shaanxi Province, China. After excluding individuals who did not meet the criteria or whose relevant information was incomplete, data on 1,443 coal miners were collected for inclusion in our study. The investigators used a unified standard questionnaire to collect respondents’ information. Data on height, weight, body mass index (BMI), blood pressure, and blood lipids were collected using standard conventional methods. PWV was measured using the Vascular Profiler BP-203RPEIII system (Omron, Japan).
R software version 4.2.2 was used for statistical analysis of the data and machine learning classification modeling. Count data were expressed as frequencies and percentages (%), and the χ2 test was used for comparison between groups; measurement data conforming to a normal distribution were expressed as (x ± s) and compared by T-test, while data not conforming to a normal distribution were expressed as M (P25, P75) and compared by the rank sum test. P < 0.05 was considered a statistically significant difference.
To ensure the quality of the data, before data analysis, the data were pre-processed by deleting duplicates and outliers, and the Synthetic Minority Oversampling Technique (SMOTE) method was used to balance the data. We included factors with significant differences or thought to be associated with AS in a LASSO regression analysis. The variables that were finally included in the prediction model were determined according to the optimal λ value obtained. The dataset was randomly divided into training (70%) and test (30%) datasets. Five different ML models were used to analyze the data: Random Forest (RF), Extreme Gradient Augmentation (XG-Boost), Logistic Classification (LR), Back Propagation (BP), and Classification and Regression Tree (CART). The predictive performances of the five ML models were evaluated by comparing their accuracy, sensitivity, specificity, positive predictive value, negative predictive value, F1 value, and area under the subject operating characteristic curve (AUC) on the dataset.
A total of 1,443 eligible coal miners were included in this study. There were 651 cases (45.11%) in the non-AS group and 792 cases (54.89%) in the AS group. There were significant differences in age, BMI, pulse, systolic blood pressure (SBP), diastolic blood pressure (DBP), and other factors between the two groups (Supplementary Table S1, available in www.besjournal.com), all at P < 0.05.
Variables Non-arterial stiffness (n = 651) Arterial stiffness (n = 792) t-value (F/Z) P-value Age, year, M (P25, P75) 33 (29, 36) 36 (32, 44) −10.784 < 0.001 Work age, year, M (P25, P75) 11.5 (7, 14) 13 (10, 21) −8.963 < 0.001 BMI, kg/m2, M (P25, P75) 23.88 (21.67, 25.95) 24.16 (22.04, 26.57) −2.561 0.01 Pulse, time/min, M (P25, P75) 72 (67, 80) 75 (68, 82) −3.352 0.001 SBP, mmHg, M (P25, P75) 117 (109, 124) 124 (115, 133) −10.738 < 0.001 DBP, mmHg, M (P25, P75) 84 (76, 89) 84 (76, 89) −11.07 < 0.001 HbA1c, %, M (P25, P75) 4.58 (4.30, 4.99) 4.58 (4.28, 5.00) −0.121 0.903 AMS, u/L, M (P25, P75) 51.00 (39.00, 66.00) 50.04 (39.00, 65.00) −1.26 0.208 HCY, μmol/L, M (P25, P75) 6.32 (4.13, 8.25) 5.57 (3.62, 7.88) −2.284 0.022 ηb 1, mPa.S, M (P25, P75) 23.24 (22.10, 24.31) 23.50 (22.31, 24.70) −2.959 0.003 ηb5, mPa.S, M (P25, P75) 10.41 (10.12, 10.75) 10.46 (10.16, 10.83) −2.026 0.043 ηb30, mPa.S, M (P25, P75) 5.79 (5.44, 6.12) 5.80 (5.48, 6.20) −1.757 0.079 ηb200, mPa.S, M (P25, P75) 4.53 (4.25, 4.90) 4.60 (4.28, 501) −2.689 0.007 PV, mPa.S, M (P25, P75) 1.43 (1.36, 1.52) 1.43 (1.36, 1.53) −0.65 0.516 ESR, mm/h, M (P25, P75) 6.00 (5.00, 8.00) 6.00 (5.00, 8.00) −0.288 0.773 HCT, L/L, M (P25, P75) 0.48 (0.46, 0.50) 0.49 (0.46, 0.51) −0.736 0.462 HS, M (P25, P75) 3.26 (2.98, 3.50) 3.25 (2.96, 3.50) −1.204 0.229 LS, M (P25, P75) 15.20 (13.40, 16.20) 14.72 (13.40, 16.20) −0.212 0.832 ESR-K, M (P25, P75) 62.40 (56.10, 65.10) 62.30 (54.70, 65.10) −0.39 0.696 AI, M (P25, P75) 5.24 (4.93, 5.62) 5.28 (5.01, 5.70) −2.088 0.037 IR, M (P25, P75) 3.60 (3.40, 5.30) 3.55 (3.40, 5.30) −0.913 0.361 TK, M (P25, P75) 0.85 (0.75, 1.02) 0.85 (0.73, 1.02) −0.311 0.311 FPG, mmol/L, M (P25, P75) 5.13 (4.83, 5.47) 5.25 (4.92, 5.63) −4.657 < 0.001 CO2CP, M (P25, P75) 24.00 (23.00, 25.10) 24.00 (23.00, 25.00) −2.001 0.045 TCHO, mmol/L, M (P25, P75) 4.61 (4.04, 5.20) 4.80 (4.21, 5.32) −3.982 < 0.001 TG, mmol/L, M (P25, P75) 1.14 (0.77, 1.67) 1.32 (0.88, 2.04) −4.405 < 0.001 HDL, mmol/L, M (P25, P75) 1.54 (1.45, 1.58) 1.54 (1.43, 1.58) −0.366 0.714 LDL, mmol/L, M (P25, P75) 2.59 (2.07, 3.11) 2.75 (2.21, 3.20) −3.173 0.002 ApoA1, g/L, M (P25, P75) 1.25 (1.20, 1.40) 1.25 (1.20, 1.40) −1.241 0.215 ApoB1, g/L, M (P25, P75) 1.00 (0.98, 1.02) 1.02 (0.99, 1.02) −2.402 0.016 K, mmol/L, M (P25, P75) 4.30 (4.20, 4.80) 4.30 (4.20, 4.69) −0.378 0.706 Na, mmol/L, M (P25, P75) 139.70 (139.20, 142.30) 139.50 (139.25, 142.15) −1.375 0.169 Cl, mmol/L, M (P25, P75) 100.54 (98.40, 102.50) 100.25 (98.30, 102.40) −3.473 < 0.001 Ca, mmol/L, M (P25, P75) 1.25 (1.24, 1.26) 1.25 (1.24, 1.26) −0.491 0.624 Ca-free, mmol/L, M (P25, P75) 2.41 (2.30, 2.55) 2.45 (2.30, 2.54) −0.255 0.799 CK, U/L, M (P25, P75) 137.00 (116.00, 162.00) 134.00 (112.00, 161.05) −1.216 0.224 CKISO, U/L, M (P25, P75) 16.00 (12.40, 21.00) 16.00 (12.30, 21.00) −0.637 0.524 α-HBDH, U/L, M (P25, P75) 159.00 (132.00, 185.00) 157.00 (132.00, 184.20) −0.811 0.417 AST, U/L, M (P25, P75) 29.00 (24.00, 35.00) 31.00 (26.00, 36.00) −3.711 < 0.001 LDH, U/L, M (P25, P75) 163.00 (144.60, 180.00) 163.60 (145.45, 184.10) −0.791 0.429 APTT, s, M (P25, P75) 28.00 (25.00, 29.45) 27.90 (26.00, 29.60) −0.905 0.366 Fibrinogen, g/L, M (P25, P75) 3.25 (3.14, 3.51) 3.25 (3.12, 3.52) −0.187 0.852 TT, s, M (P25, P75) 14.15 (12.80, 15.05) 13.80 (12.70, 14.70) −1.158 0.247 FVC/per, %, mean ± SD 80.76 ± 11.35 79.98 ± 11.65 1.265 0.206 FEV1/per, %, mean ± SD 80.52 ± 10.39 81.18 ± 10.84 −1.17 0.242 FEV1/FVC, %, mean ± SD 93.30 ± 6.27 93.01 ± 6.26 868 0.385 coal dust, mg/m3-years, M (P25, P75) 18.99 (8.61, 29.05) 25.90 (14.54, 40.21) −5.982 < 0.001 CO, mg/m3-years, M (P25, P75) 17.96 (10.27, 28.56) 25.09 (14.53, 40.14) −6.132 < 0.001 CO2, mg/m3-years, M (P25, P75) 11775.32 (6559.46, 16705.80) 14698.84 (9028.04, 22981.75) −6.173 < 0.001 NO, mg/m3-years, M (P25, P75) 0.12 (0.06, 0.18) 0.16 (0.10, 0.29) −6.565 < 0.001 NO2, mg/m3-years, M (P25, P75) 0.22 (0.11, 0.38) 0.29 (0.17, 0.59) −5.579 < 0.001 PAH, mg/m3-years, M (P25, P75) 0.67 (0.33, 1.08) 0.90 (0.50, 1.54) −5.516 < 0.001 Note. HbA1c, glycosylated hemoglobin; AMS, serum amylase; HCY, homocysteine; ηb1, whole blood viscosity 1; ηb5, whole blood viscosity 5; ηb30, whole blood viscosity 30; ηb200, whole blood viscosity 200; PV, plasma specific viscosity; ESR, erythrocyte sedimentation rate; HCT, hematocrit; HS, whole blood high shear rate; LS, whole blood low shear rate; ESR-K, equation K value of erythrocyte sedimentation rate; AI, red blood cell aggregation index; IR, the index of rigidity of erythrocyte; TK, thymidine kinase; FPG, fasting plasma glucose; CO2CP, carbon dioxide-combining power; TCHO, total cholesterol; TG, triglycerides; HDL, high density lipoprotein; LDL, low density lipoprotein; ApoA1, apolipoprotein A1; ApoB1, apolipoprotein B1; Ca-free, free calcium; CK, creatine kinase; CKISO, creatine kinase isoenzyme; α-HBDH, alpha-hydroxybutyric dehydrogenase; AST, aspartate amino transferase; LDH, lactic dehydrogenase; APTT, activated partial thromboplastin time; TT, thrombin time; FVC/per, predicted percentage of forced vital capacity; FEV1/per, percentage of predicted forced expiratory volume in the first second; FEV1/FVC, ratio of forced expiratory volume in the first second to forced vital capacity; PAH, polycyclic aromatic hydrocarbons. Table S1. Baseline clinical characteristics of the two groups of coal miners
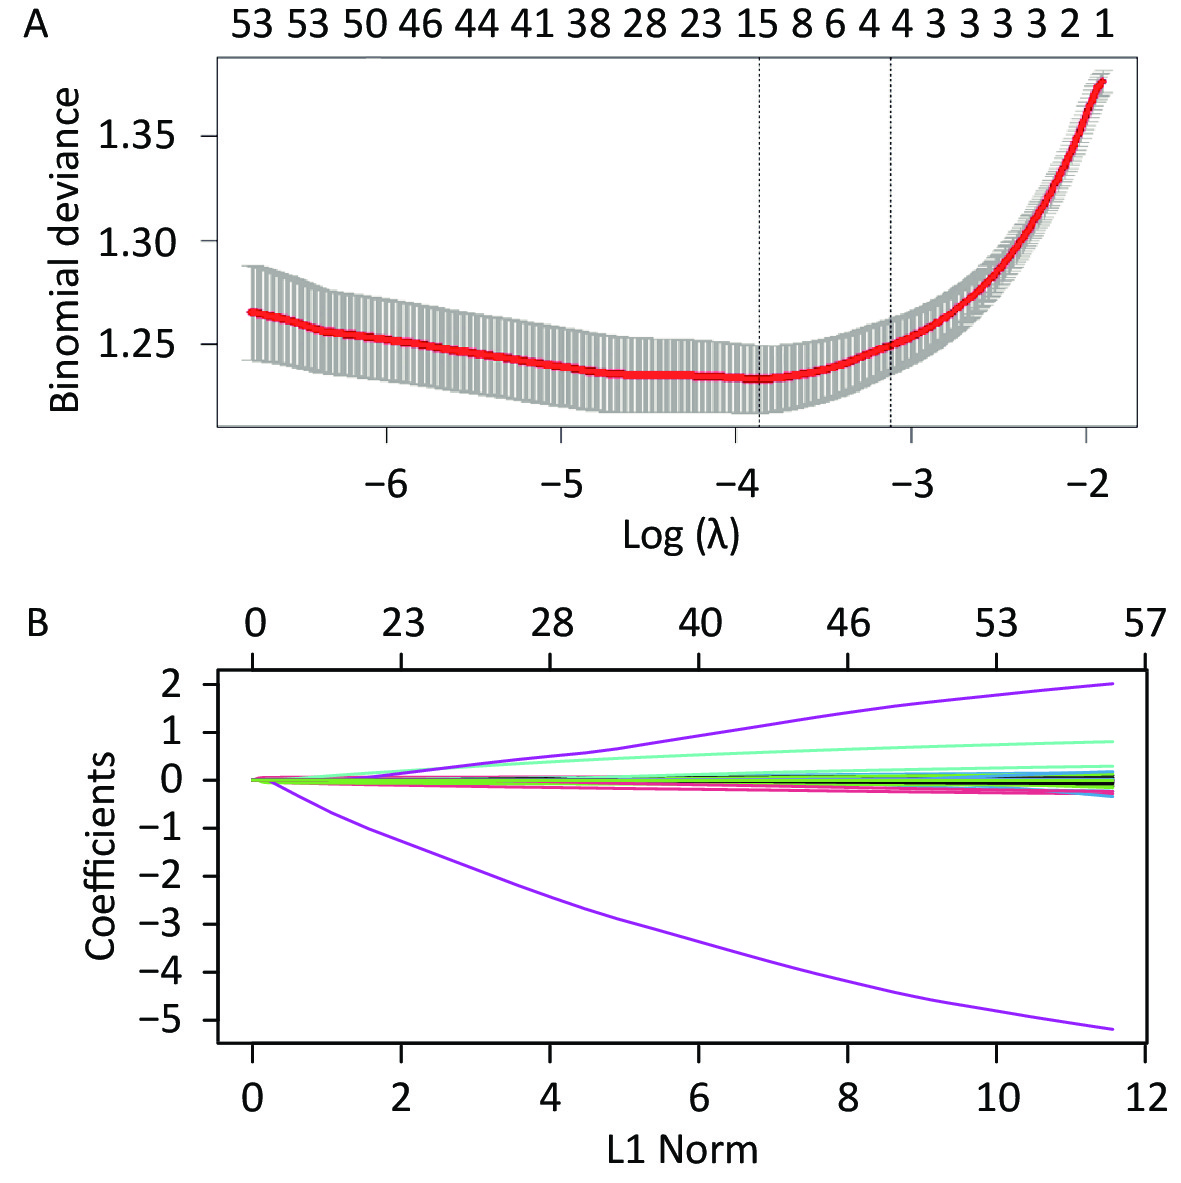
To identify suitable predictive variables, we employed Lasso regression with cross-validated noose fitting binomial deviance plots (Figure 1A) and noose fitting coefficient locus plots (Figure 1B). The optimal λ value, corresponding to the lowest point on the loss function, was determined from Figure 1A. The variables intersecting with the optimal λ value in Figure 1B were ultimately included as model variables. Consequently, the model’s predictive variables corresponding to the optimal λ value were determined to be age, pulse, SBP, whole blood high shear rate (HS), carbon dioxide-combining power (CO2CP), Cl, and TG.
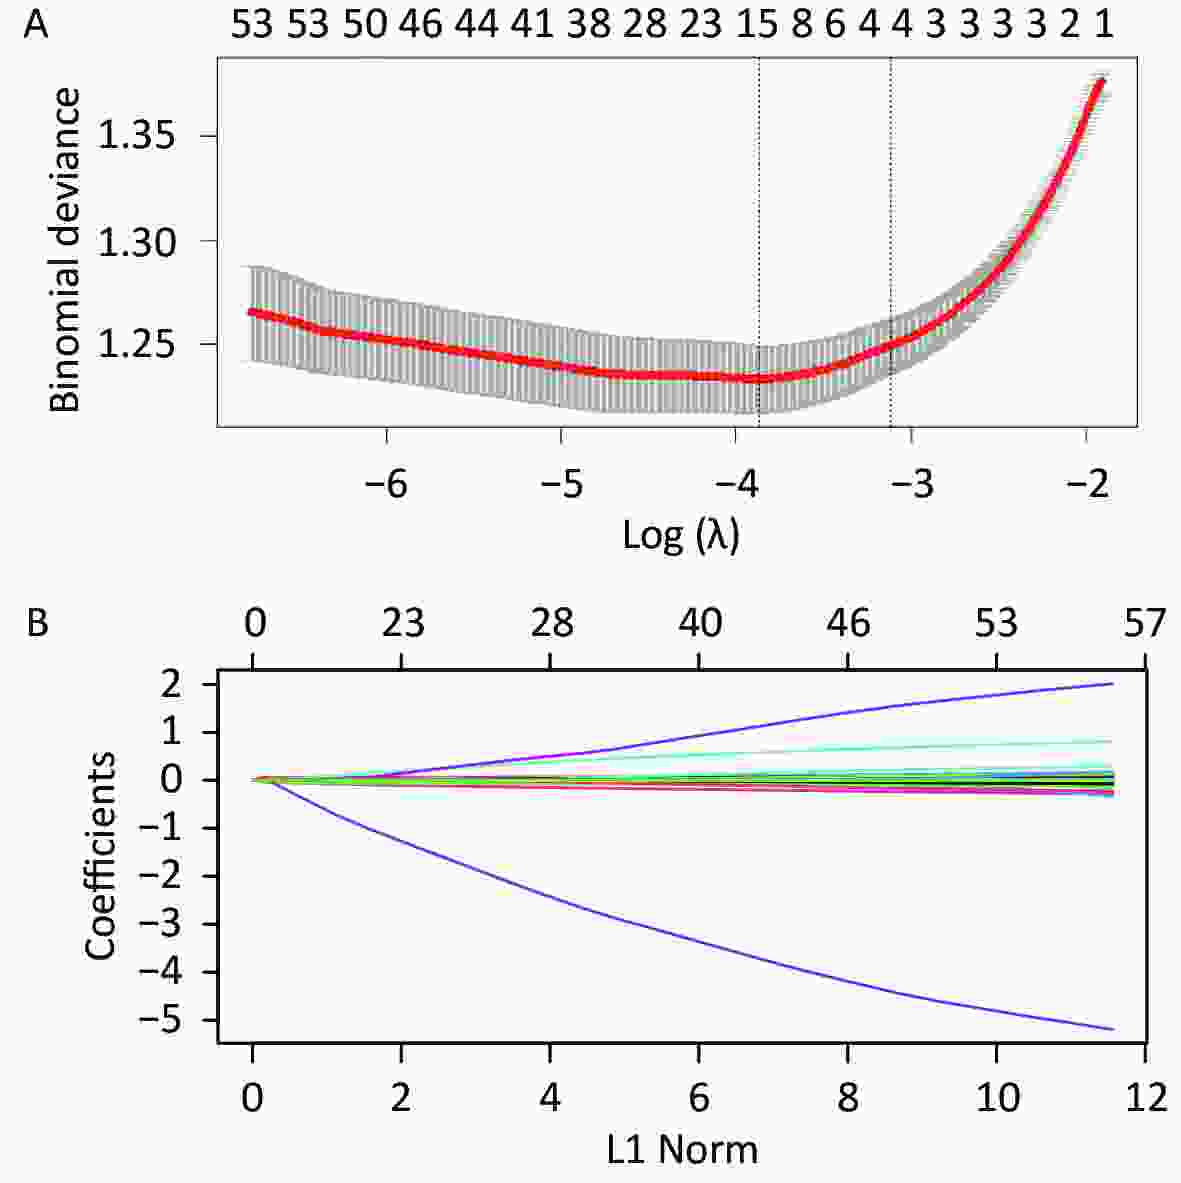
Figure 1. LASSO regression screening of machine learning model predictors: (A) The process of selecting the most suitable λ in the LASSO model. (B) LASSO coefficient curve of the variable.
Numerous studies have established an association between these factors and CVD occurrence. The academic community has reached a consensus regarding the close relationship between age, hyperlipidemia, and CVD incidence, which is potentially attributed to vascular aging and AS[6]. The link between hypertension and CVD is well-documented. For example, Webb’s study demonstrated a relationship between blood pressure and AS, where higher DBP and SBP corresponded to a greater likelihood of AS occurrence[5]. Pulse has also been connected to CVD, with some researchers proposing its use as a predictor of such conditions[7]. Studies have also found associations between CO2CP and the occurrence and prognosis of CVD[8]. Moreover, HS serves as an important indicator of blood viscosity, and numerous studies have revealed that higher blood viscosity is associated with more severe AS and an increased likelihood of CVD[9]. Unfortunately, although we collected data on the exposure of coal miners to occupational hazards and tried to include them in our study, we excluded all variables of occupational hazards when we used LASSO regression to screen predictor variables; therefore, the variables of the final predictive model were all composed of physiological indicators. We speculate that there may be some mediating factors between occupational hazards and AS or CVD. We will attempt such an analysis in future studies to improve our research.
The five machine learning models were compared using various indicators to assess their predictive performance for the occurrence of AS in coal miners (Table 1). The results demonstrated that the RF model achieved the highest accuracy (83.6%), sensitivity (80.2%), specificity (86.3%), positive predictive value (82.2%), negative predictive value (84.7%), F1 value (0.812), and AUC (0.893) on both the training and test datasets.
Evaluation indicators Training dataset (70%) Test dataset (30%) RF XGboost LR BP CART RF XGboost LR BP CART Accuracy (%) 80.4 74.4 66.1 69.1 68.8 83.6 69.4 66.7 67.3 70.3 Sensitivity (%) 77.4 71.4 60.7 64.6 68.0 80.2 66.5 63.6 63.6 71.0 Specificity (%) 82.9 76.8 70.6 72.8 69.5 86.3 71.7 69.2 70.2 69.9 Positive predictive value (%) 79.1 72.1 63.3 66.6 65.1 82.2 65.0 62.0 62.8 65.0 Negative predictive value (%) 81.4 76.3 68.2 71.1 72.2 84.7 73.0 70.6 71.0 75.3 F1 value 0.783 0.718 0.620 0.656 0.665 0.812 0.657 0.628 0.632 0.678 AUC (95% CI) 0.888 (0.874, 0.902) 0.828 (0.813, 0.842) 0.723 (0.701, 0.744) 0.761 (0.741, 0.781) 0.714 (0.692, 0.736 0.893 (0.872, 0.914 0.770 (0.740, 0.801 0.736 (0.703, 0.768) 0.733 (0.600, 0.765) 0.723 (0.690, 0.756) Note. RF, Random Forest; XG-Boos, Extreme Gradient Augmentation; LR, Logistic Classification; BP, Back Propagation; CART, Classification and Regression Tree Table 1. Efficacy results for the five ML models
An AUC closer to 1 indicates a better predictive performance of the machine learning model. The AUCs of the five machine learning models on the dataset are shown in Figure 2. On the training dataset, the AUC of the RF model was significantly higher than those of the other models (Figure 2A). On the test dataset, the AUC value of the RF model was also the highest (0.893), which proves that the RF model has good prediction performance for AS (Figure 2B).
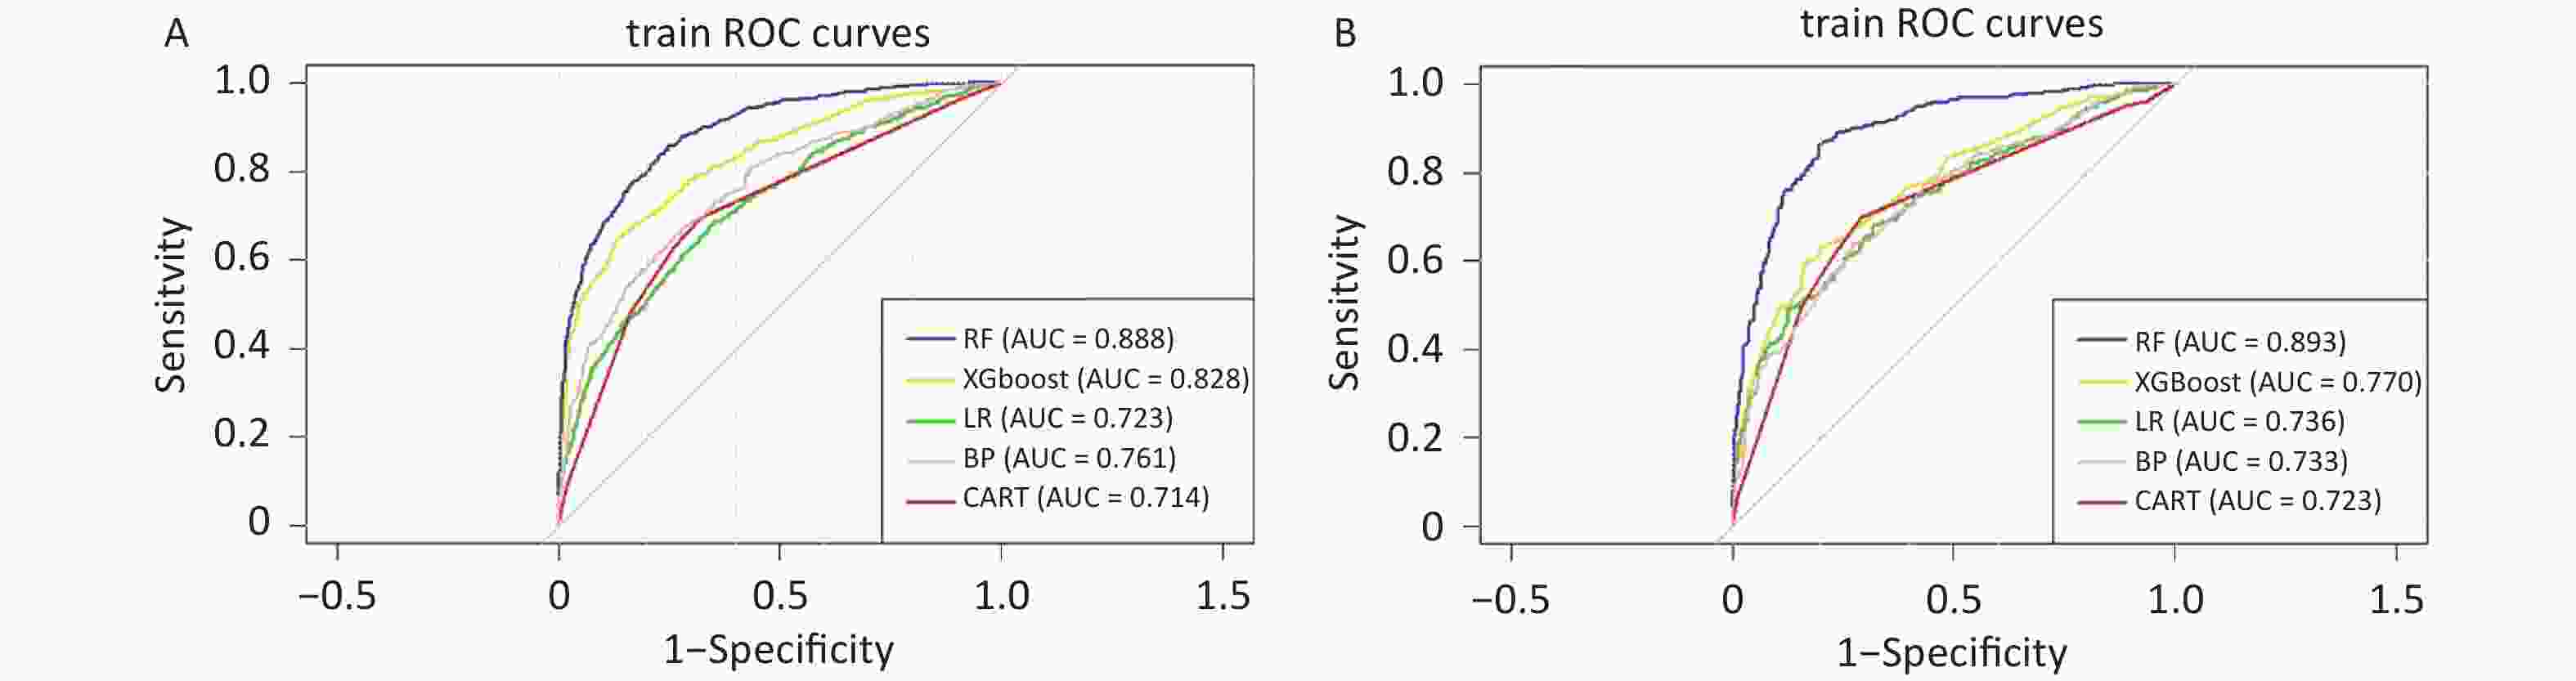
Figure 2. AUCs of the five machine learning models: (A) training and (B) test dataset ROC curves.
The RF model is a classifier model based on decision trees that has been widely applied in the medical field. The bagging method it employs significantly enhances the accuracy of the model predictions. In our study, the RF model outperformed other machine learning models on the training dataset, exhibiting higher evaluation scores and superior performance on the test set. Therefore, based on our evaluation index analysis, we considered the RF model to be the most suitable machine learning model for predicting the risk of AS among coal miners.
The RF model has demonstrated exceptional performance in predicting various diseases or symptoms, likely owing to the following advantages: 1) ability to generate highly accurate classifiers, 2) capability to evaluate variable importance and build models accordingly, and 3) potential to estimate missing data and balance errors within a dataset[10].
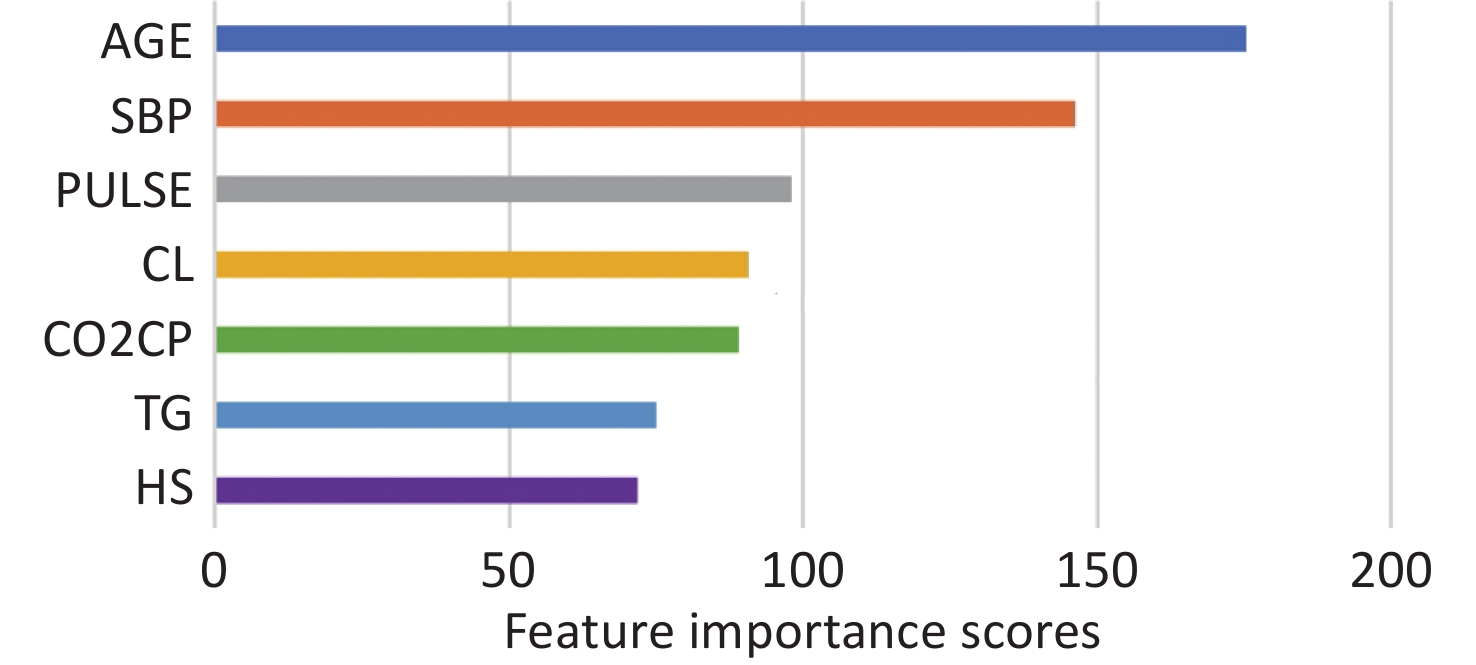
In our study, we used simple physical examination data, such as age, pulse, blood pressure, and HS, to accurately predict the risk of AS among coal miners. Consequently, we were able to predict the risk of CVD among coal miners by asking a few questions and collecting a small number of blood samples, without relying on professional PWV detection equipment. To facilitate better use of our model, we provide the variable importance scores of the RF model in Supplementary Figure S1 (available in www.besjournal.com). For a decision tree model, the variable importance score can help readers better understand the value of these variables in predicting AS outcomes.

Figure S1. Feature importance scores.
Nevertheless, our study had certain limitations. First, the outcome of our study was AS, which predicts CVD but does not directly indicate it. Second, the data used were obtained exclusively from a large coal mine in Shaanxi Province, which may affect the generalizability of our findings. Third, although we selected five machine learning models, there are numerous other widely used models, including Gaussian Parsimonious Bayesian Classification (GNB), Neural Network Classification (MLP), and Complementary Parsimonious Bayesian Classification (CNB), which could be included in future studies.
This study represents the first attempt to employ various machine learning models to predict the risk of AS in coal miners. Among the five machine learning models examined, the RF model demonstrated the best predictive performance for AS in this population. Clinicians and public health practitioners can effectively utilize the RF model to assess the early-stage risk of AS among coal miners, enabling the implementation of appropriate preventive interventions. If readers are interested in our model, they can contact us via email, and we will provide the model and code.
There are no potential conflicts of interest to disclose.
MU Ming and DING Yu conceived of and designed this study. ZHU Feng Ren contributed to the writing of the manuscript. DING Yu, WANG Jia, ZOU Yuan Jie, and DU Yuan Zhen contributed to the data retrieval and manuscript review. ZHU Feng Lin, ZHANG Ya Jun, and HUI Zi Wen contributed to data collection and collation. All authors made significant contributions to the research process of this manuscript and have read and approved the submitted manuscript.
HTML
 23217+Supplementary Materials.pdf
|

|

 Quick Links
 DownLoad: