

-
Population aging has become a universal phenomenon. By the end of this decade, the worldwide elderly population will exceed 20%[1], and age has been identified as a principal risk factor for many diseases[2,3]. Vascular senescence (VS) is the premature development of atherosclerosis and a common pathological process in geriatric diseases[4,5]. Thus, research on vascular aging is essential for further understanding the early progression of vascular diseases, providing theoretical support for detection and intervention.
VS is the age-related structural and functional degradation of blood vessels. Impairment of the arteries and veins is characterized by contractive and dilative dysfunction, stiffness and adherence augmentation, and elasticity reduction[6,7], which are consequences of morphological assessments, including enlarged lumens and intima-media thickening[8,9]. The VS process comprises cell dysfunction and remodeling of the extracellular matrix (ECM). The two primary constituents of ECM, elastin, and collagen, undergo significant alterations in senescent vessels. Diminished elastin is caused by hydrolysis and fragmentation owing to fatigue and over-tension of elastic fibers, which also increase collagen deposition and cross-linking[10]. These pathological changes decline the systemic compliance of vessels, leading to secondary conditions.
ECM abnormalities and their roles in VS have been attractive, and the involvement of the matrix metalloproteinase 2 (MMP-2) signaling pathway has been indicated[11]. Downregulation of the angiotensin II (Ang II) inhibitor, vasorin (VASN), leads to elevation of chemokine (C‐C motif) ligand 2 (CCL2), calpain-1, milk fat globule-EGF8 (MFG-E8), and non-phagocytic nicotinamide adenine dinucleotide phosphate oxidase (NADPH oxidase) and activation of MMP-2. The MMP family, in general, degrades ECM components[12] and MMP-2 signaling leads to the metabolism of elastin and collagen, in particular. ECs and VSMCs both express MMP-2, which degrades elastic fibers and activates transforming growth factor-beta 1 (TGF-β1), leading to increased expression of connective tissue growth factor (CTGF/CCN2) through the small mother against decapentaplegic (SMAD) pathway and overproduction of Type I and III collagens[13]. The culmination of these effects is reduced elasticity and increased stiffness of the vessel walls. The MMP-2 inhibitor, a tissue inhibitor of metalloproteinase-2 (TIMP-2), influences the ECM structure[14]. In addition, accumulating evidence indicates that other proteases for example, lysosomal cysteinyl cathepsin S/K and the dipeptidyl Peptidase-4 (DPP4)/glucagon-like peptide-1(GLP-1)-adiponectin axis also contribute to vascular senescence, and MMP-2 and 9 are observed to participate in these interactions. Inhibition of these proteases shows a vasculoprotective action[15-17].
Single nucleotide polymorphisms (SNPs) are defined as allelic variations that affect over 1% of the population and include insertions, deletions, and substitutions. SNPs in promoters, exons, and 3' or 5' untranslated regions (UTRs) may alter gene expression or modify protein structure[18]. The AA or CA genotype of the nuclear factor erythroid 2-related factor 2 (NRF2) promoter, SNP-617 (rs672961), was shown to downregulate NRF2 activity and cause arterial stiffness[19]. Similarly, the A allele of 3'UTR rs978906 and C allele of non-synonymous rs9808232 cause upregulation of the Rho-associated coiled-coil containing protein kinase 2 (RaOCK2) gene, causing vascular inflammation, platelet aggregation, and endothelial dysfunction and were associated with arterial stiffness[20]. However, SNPs in the MMP-2 pathway and their relationship with vascular aging have received little attention.
Therefore, this study investigated the association between SNPs in the MMP-2 pathway and VS.
-
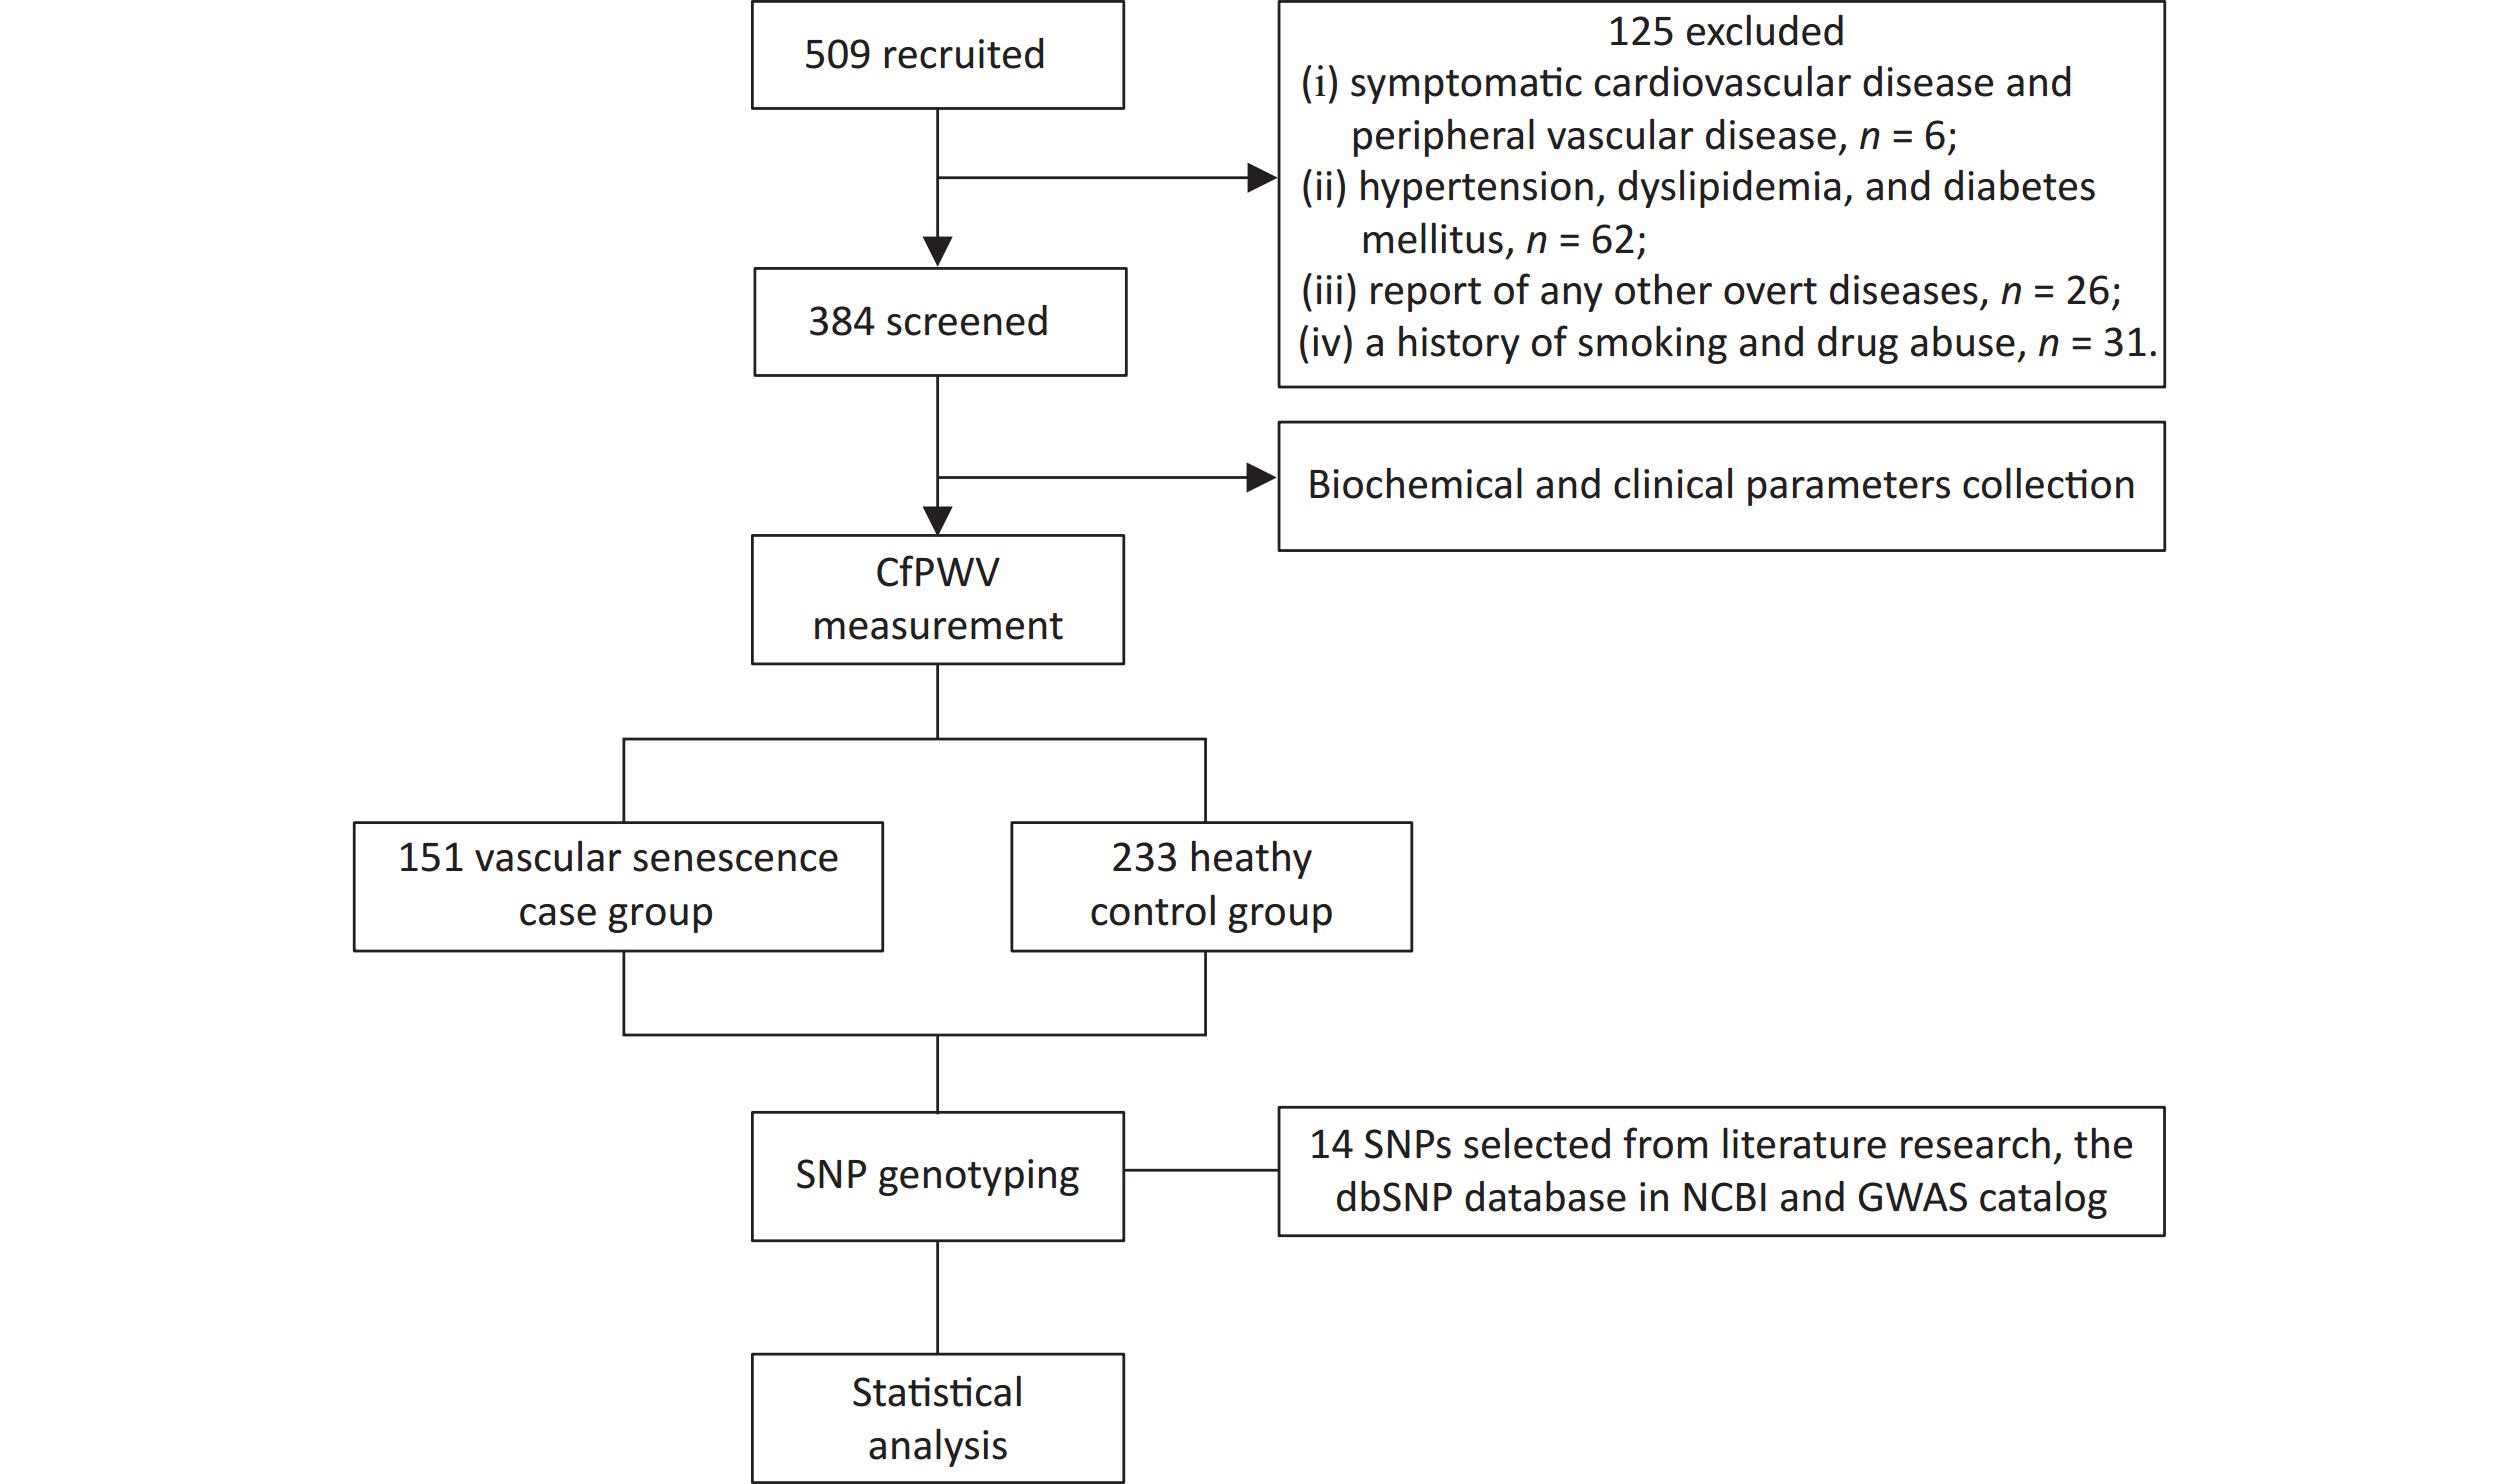
The flowchart of this study is shown in Figure 1. 509 healthy adults from the northern provinces of China, aged 18–80 years who visited the Affiliated Hospital of Qingdao University between May and November 2023 were enrolled. The exclusion criteria were as follows: (i) presence of symptomatic cardiovascular or peripheral vascular disease; (ii) hypertension, dyslipidemia, or diabetes mellitus; (iii) other overt diseases, such as malignant tumors, hemopathy, or cognitive impairment; (iv) history of smoking or drug abuse. A total of 384 participants were selected for the study. Written informed consent was obtained from all participants. This study protocol was approved by the Ethics Committees of the Affiliated Hospital of Qingdao University (No.QYFY WZLL 28117).
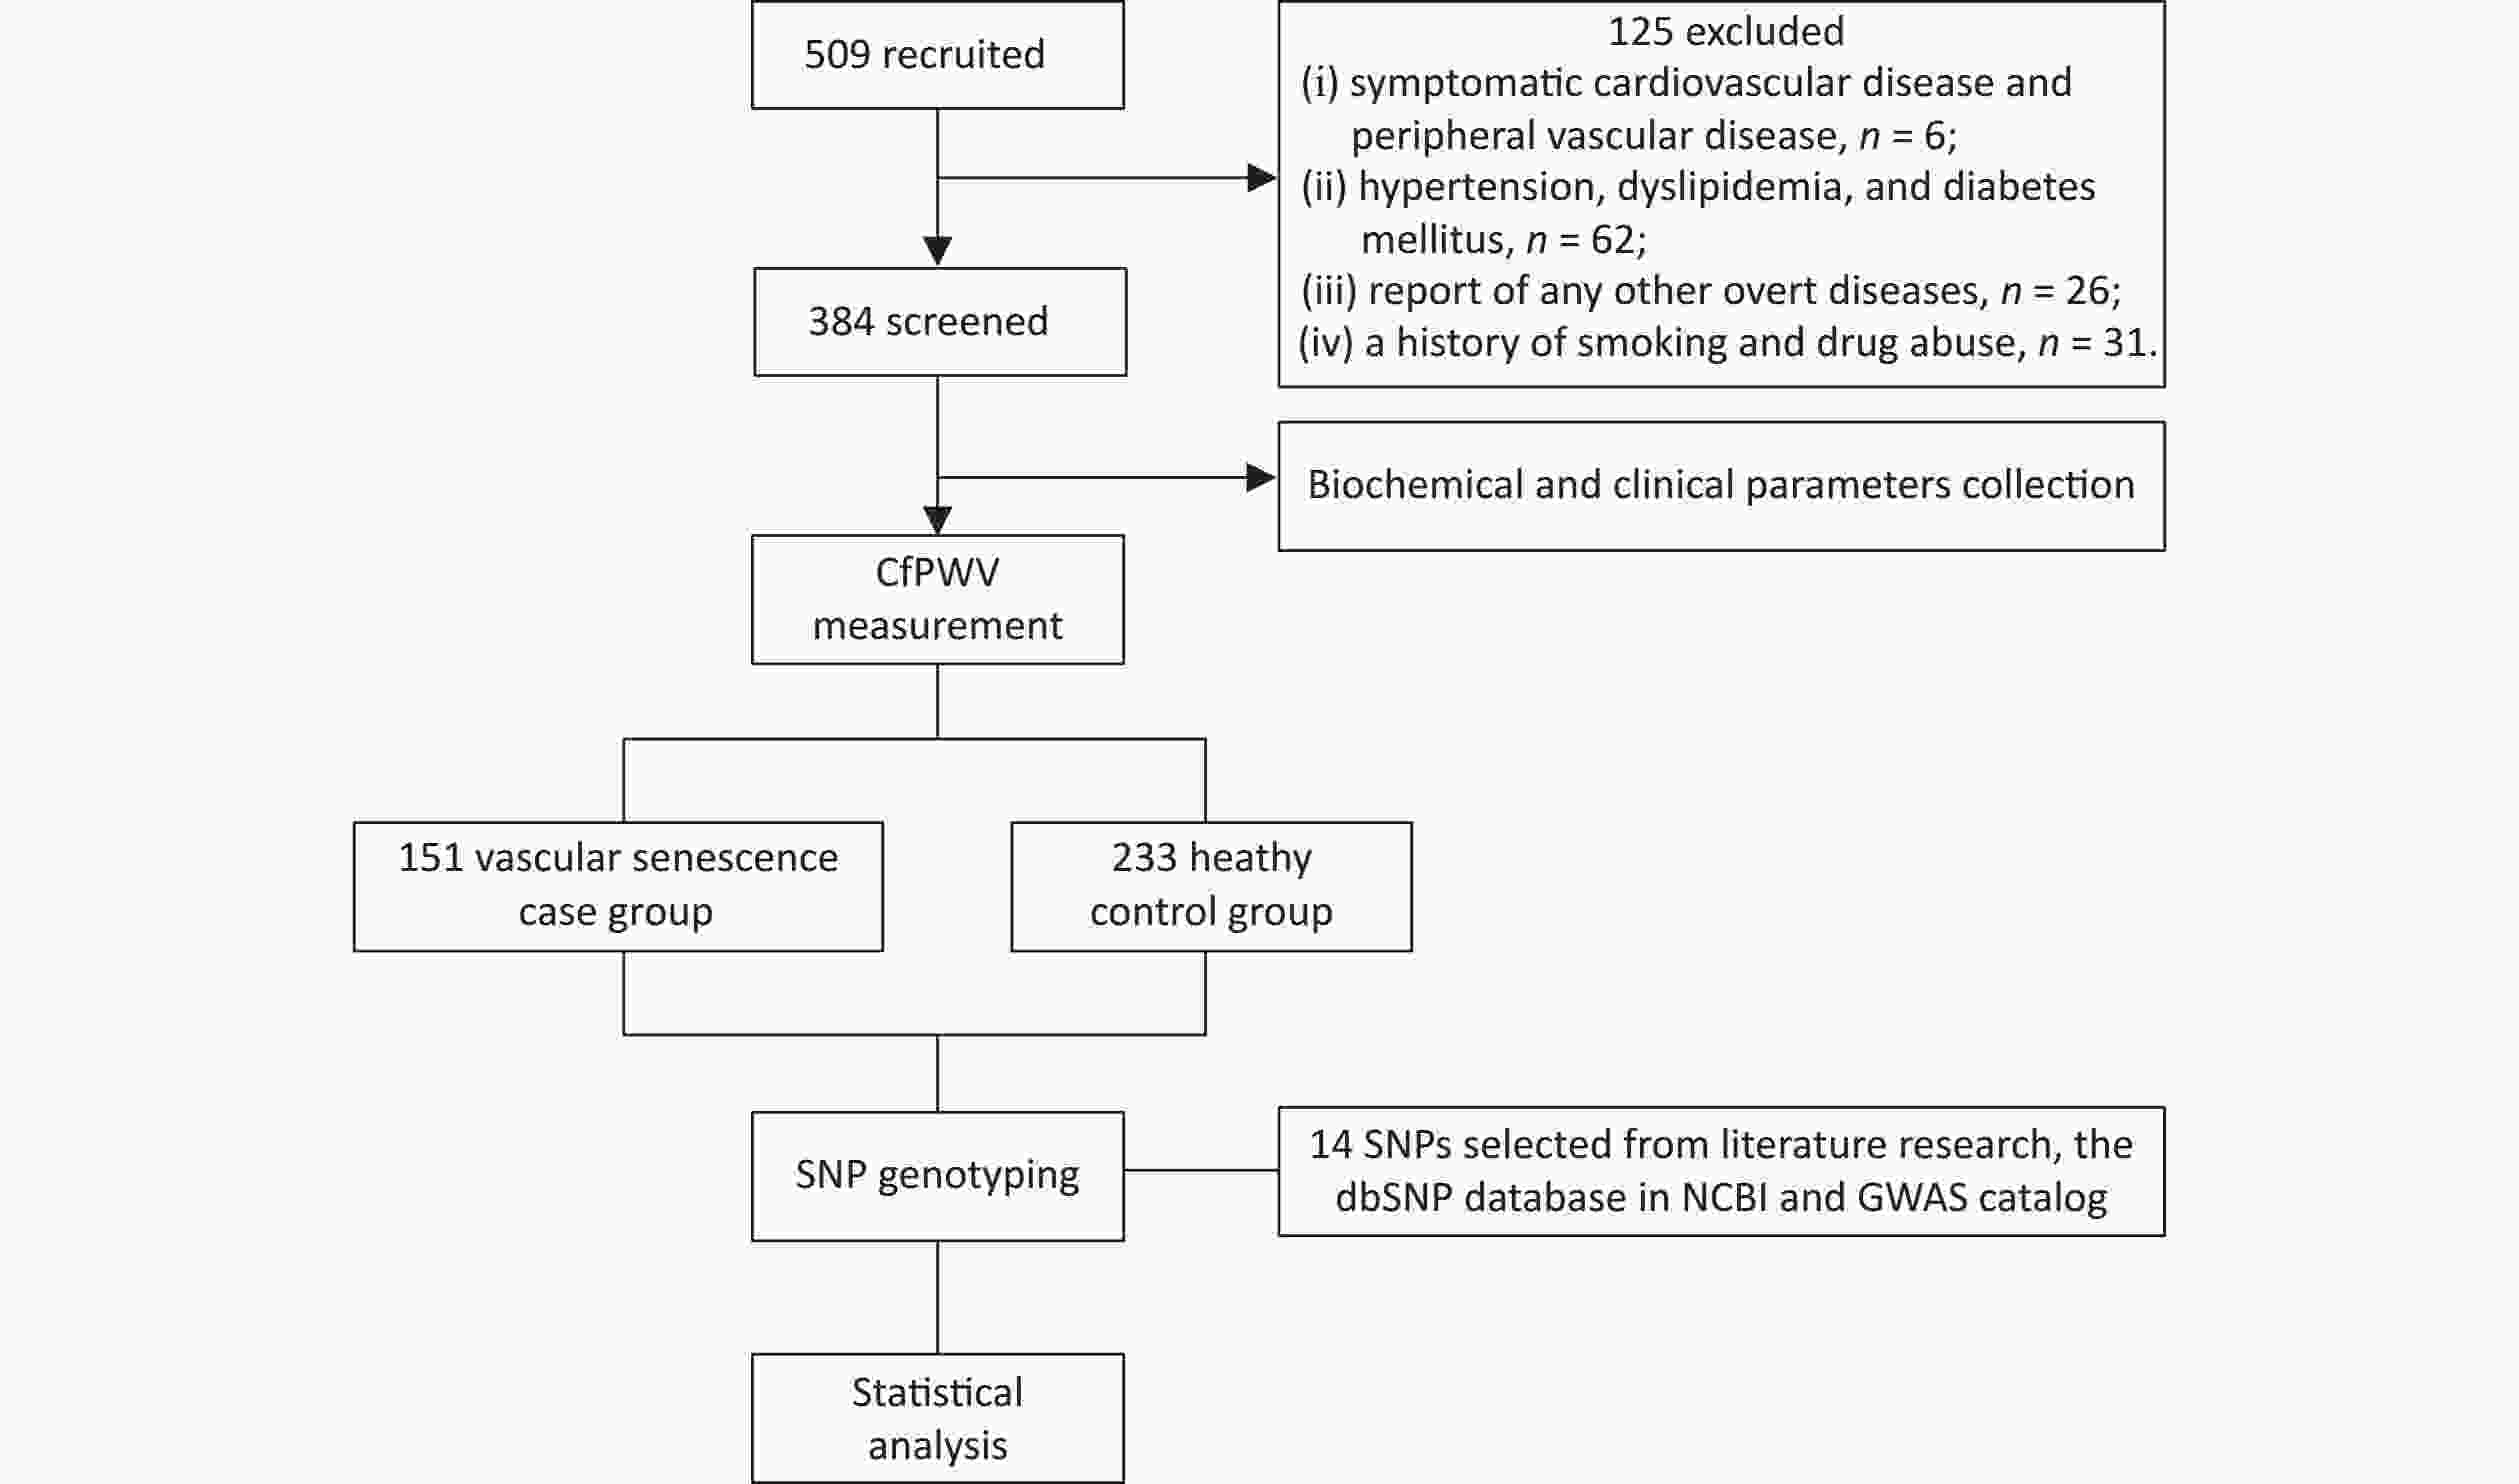
Figure 1. Flow chart of the study.
-
VS was assessed using the gold standard diagnostic, carotid-femoral pulse wave velocity (cfPWV). Blood flows with greater velocity in senescent vessels and pulse wave velocity (PWV) is recognized as universal diagnostic criteria. cfPWV represents the distance between the points of a maximal pulse of the common carotid and femoral arteries divided by pulse transit time, which was measured using a transcutaneous waveform analyzer (Complior; Artech Medical, Pantin, France)[21]. Participants were required not to do strenuous exercise on the day prior to the measurement. Measurements were operated between 8:00 am and 12:00 am, and all participants abstained from medicine, alcohol, caffeine, and food consumption for 15 hours overnight before the study. The participants rested for 3 min in the supine position before pulse waves of the common carotid and femoral arteries were recorded simultaneously with TE15241-16 arterial pressure transducers. At least 15 consecutive arterial flow waves were measured for each participant. The distance was calculated as the body surface distance between the points of a maximal pulse of the common carotid and femoral arteries multiplied by 0.8. This process was repeated bilaterally, and the mean values were used for the analysis. VS was deemed present when the measurements had two standard deviations larger than the mean PWV[22]. To minimize the influence of age and blood pressure, the mean PWV and standard deviation values referred to the normally distributed values according to the age and blood pressure categories in previous investigations[23].
-
Participants fasted for 15 h, and 10 mL of blood was collected, 5 mL into ethylenediaminetetraacetic acid (EDTA) for storage at –80 °C for DNA extraction and 5 mL into anticoagulant-free tubes for serum isolation. DNA was extracted from peripheral blood leukocytes using a kit (Tiangen Biotech, China), and purity was assessed using a NanoDrop2000.
-
In this study, we selected five crucial genes in the MMP-2 signaling pathway: VASN, CCL2, MMP-2, CCN2, and TIMP-2. Fourteen functional regions and validated SNPs were selected after reference to the Single Nucleotide Polymorphism Database in the National Center for Biotechnology Information (NCBI), GWAS Catalogs (https://www.ebi.ac.uk/gwas/), GWAS Atlas (https://atlas.ctglab.nl/), and GWAS Central (https://www.gwascentral.org/), and a comprehensive literature search in Google Scholar. We focused on SNPs proved to be associated with regulated expression or structure of the proteins in previous studies, including functional SNPs in regions of exons, promoters, and 3’UTRs of the genes, and validated SNPs in regulatory sites such as eQTL, mQTL, and pQTL. SNPs, including rs4586, rs13900, and rs1860189 in CCL2; rs14070, rs2287074, rs7201, rs243849 and rs1053605 in MMP-2; rs9493150 in CCN2; rs3810818 and rs8182173 in VASN; rs7503726, rs2277698, rs8179090, and rs8179096 in TIMP2, were selected for genotyping. Primers were designed through polyacrylamide gel electrophoresis (PAGE) purification and optimized using Assay Designer 4.0 software (Agena) based on 200 bp gDNA sequences for each SNP.
Genotyping was performed using a mass array. Briefly, DNA segments were amplified through PCR using shrimp alkaline phosphatase (SAP), a single-base extension was performed using UEP primers with resin purification, and sample application was conducted using MassARRAY Nanodispenser RS1000[24]. The quality control is demonstrated by clustergrams presenting the genotype distribution of all samples, and results were verified if the genotypic trends were consistent with that of 1000Genomes CHB&CHS. Sequences were detected by SpectroCHIP using a mass spectrometer MALDI-TOF, and the results were analyzed using TYPER4.0 software.
-
Demographic and clinical data, including sex, age, height, weight, and body mass index (BMI), were collected. Serum high-density lipoprotein (HDL), low-density lipoprotein (LDL), triglycerides (TG), total cholesterol (TC), fasting glucose (FG), creatinine (Cr), and uric acid (UA) were measured using kits (Leadman kits, Beijing, China) according to the manufacturer’s instructions, and were detected using automated biochemistry analyzer (HITACHI, LABOSPCT 008 AS, Ibarakiken, Japan). Systolic blood pressure (SBP), diastolic blood pressure (DBP), and heart rate (HR) were measured by a physician using a blood pressure monitor (Omron HBP-1300, Dalian, China). Pulse pressure (PP) was calculated as (SBP-DBP), and mean arterial pressure (MAP) was calculated as the sum of 1/3 SBP + 2/3 DBP.
-
Categorical variables such as sex and allele frequencies were presented as frequencies and group percentages and compared using the χ2 test. Continuous variables were presented as mean ± standard deviation (SD), and statistical normality was validated using the Kolmogorov-Smirnov test. Normally distributed continuous variables were analyzed using Student’s independent t-test, and non-normally distributed variables were analyzed using Wilcoxon’s two-sample rank-sum test. The Hardy–Weinberg equilibrium for SNPs was examined using χ2 analysis. Univariate logistic regression was used to evaluate the association of genotypes with VS and MDR 3.0.2 for SNP-SNP interactions. The variables (including age, BMI, SBP, and PG) showed significant differences between the VS patients and control groups and were adjusted using binary multivariate logistic regression and generalized MDR (GMDR). Bootstrap resampling analysis (1000 replications) was performed for all logistic regression models to exclude possible Type I errors. SPSS software, version 26 (SPSS Inc., Chicago, IL, USA), was used for all analyses, and a two-tailed P-value < 0.05 indicated statistical significance.
-
A total of 509 participants were identified; 125 were excluded, leaving a final dataset of 384 participants who were enrolled. The baseline characteristics are shown in Table 1. The median age was 52 (IQR, 44–58) years for VS patients, which was lower than that for the controls (54; IQR, 47.5–60 years). VS patients had higher body weight (72.11 ± 12.29), BMI (24.82 ± 2.81), SBP (121.97 ± 11.62), DBP (49.36 ± 8.60), PP (49.36 ± 8.60), MAP (89.06 ± 9.04), and FG (5.03 ± 0.50) than the controls (all P < 0.05). No significant differences were found in sex, height, HR, HDL, LDL, TG, TC, Cr, or UA between VS patients and controls. The four significant variables including age, BMI, SBP, and PG were adjusted by later binary multivariate logistic regression and GMDR analysis.
Characteristics VS patients (n = 151) Controls (n = 233) P-values Age, year 52.01 ± 9.04 54.54 ± 9.71 0.023* Sex, male 88.0 (58.3%) 113.0 (48.5%) 0.061 Weight, kg 72.11 ± 12.29 68.28 ± 10.49 0.008** Height, cm 169.97 ± 7.71 168.57 ± 7.20 0.770 BMI, kg/m2 24.82 ± 2.81 23.92 ± 2.49 0.005** HR, time/min 69.87 ± 10.15 68.08 ± 10.37 0.068 SBP, mmHg 121.97 ± 11.62 116.06 ± 10.12 0.000** DBP, mmHg 72.61 ± 8.93 68.64 ± 8.01 0.000** PP, mmHg 49.36 ± 8.60 47.43 ± 8.13 0.024* MAP, mmHg 89.06 ± 9.04 84.45 ± 7.89 0.000** HDL, mmol/L 1.48 ± 0.31 1.52 ± 0.31 0.292 LDL, mmol/L 2.72 ± 0.41 2.74 ± 0.45 0.424 TG, mmol/L 1.09 ± 0.30 1.06 ± 0.28 0.307 TC, mmol/L 5.10 ± 0.73 5.06 ± 0.81 0.925 FG, mmol/L 5.03 ± 0.50 4.92 ± 0.51 0.036* Cr, μmol/L 89.05 ± 11.81 87.72 ± 10.64 0.162 UA, μmol/L 333.30 ± 58.96 323.29 ± 67.87 0.307 Note. Data were represent as mean ± SD; VS: vascular senescence; BMI: body mass index. HR: heart rate; SBP: systolic blood pressure; DBP: diastolic blood pressure; PP: pulse pressure (SBP-DBP); MAP: mean arterial pressure; HDL: high-density lipoprotein; LDL: low-density lipoprotein; TG: triglycerides; TC: total cholesterol; FG: fasting glucose; Cr: creatinine; UA: uric acid; s: standard deviation; *P < 0.05; **P < 0.01. Table 1. Baseline demographic and biochemical characteristics of the study cohort
-
The 14 selected SNPs from 5 genes in the MMP-2 signaling pathway comprised rs4586, rs13900, and rs1860189 in CCL2; rs14070, rs2287074, rs7201, rs243849, and rs1053605 in MMP-2; rs9493150 in CCN2; rs3810818 and rs8182173 in VASN; rs7503726, rs2277698, rs8179090, and rs8179096 in TIMP2. Fourteen SNP loci were genotyped, and homogeneous genotypic and allelic frequencies were analyzed in VS patients and controls. All genotype distributions were within the Hardy–Weinberg equilibrium except for TIMP2 rs8179096. A positive association was found between VS occurrence and the four polymorphisms: CCL2 rs4586, MP2 rs14070, MMP2 rs7201, and MMP2 rs1053605. A significant association was found between VS and the T/C (P = 0.011) and T/T (P = 0.019) genotypes and with the T allele (P = 0.000) of the CCL2 rs4586 polymorphism. Carriers of the T/C genotype of MMP-2 rs14070 had a 2.17-fold increased risk of developing VS compared with those of the C/C genotype (P = 0.001), and those of the T/T genotype had a 19.375-fold increased risk (P = 0.001). Similarly, carriers of the T allele of MMP-2 rs14070 had a greater risk of developing VS than those of the C allele (P = 0.000). Carriers of the C/A (P = 0.001) and C/C (P = 0.001) genotypes of MMP-2 rs7201 demonstrated a stronger association with VS Individuals carrying the A allele of MMP-2 rs7201 had a greater risk of VS than those carrying the C allele (P = 0.000). Significant associations between VS and the T/T genotype (P = 0.016) as well as the T allele (P = 0.008) of MMP-2 rs1053605 were observed. The multivariate regression analyses before and after bootstrap correction are shown in Table 2, and the χ2 analysis is shown in Table 3.
SNPs VS patients (n = 151) Controls (n = 233) OR (95% CI) P-valuea P-valueb CCL2 rs4586, n (%) CC 64 (42.4) 84 (36.1) TC 52 (34.4) 125 (53.6) 0.546 (0.345, 0.864) 0.011* 0.019* TT 35 (23.2) 24 (10.3) 1.914 (1.037, 3.533) 0.019* 0.029* χ2 (P-value) 5.18 (0.07) MMP-2 rs14070, n (%) CC 54 (35.8) 155 (66.5) TC 70 (46.4) 74 (31.8) 2.715 (1.731, 4.259) 0.001** 0.001** TT 27 (17.9) 4 (1.7) 19.375 (6.483, 57.903) 0.001** 0.001** χ2 (P-value) 2.11 (0.35) MMP-2 rs7201, n (%) AA 58 (38.4) 153 (65.7) CA 71 (47.0) 75 (32.2) 2.497 (1.603, 3.891) 0.001** 0.001** CC 22 (14.6) 5 (2.1) 11.607 (4.198, 32.091) 0.001** 0.001** χ2 (P-value) 1.46 (0.48) MMP-2 rs1053605, n (%) CC 117 (77.5) 199 (85.4) TC 27 (17.9) 32 (13.7) 1.435 (0.819, 2.514) 0.216 0.286 TT 7 (4.6) 2 (0.9) 5.953 (1.216, 29.133) 0.016* 0.017* χ2 (P-value) 0.31 (0.85) Note. aMultivariate logistic regression analysis adjusted for age, systolic blood pressure, BMI and fasting glucose levels; bAfter bootstrap 1,000 replications; SNP: single nucleotide polymorphism; VS: vascular senescence; OR: odds ratio; CI: confidence interval; CCL2: chemokine (C‐C motif) ligand 2; MMP-2: matrix metalloproteinase 2; BMI: body mass index; *P < 0.05; **P < 0.01. Table 2. Genotype and odds ratio of SNPs associated with vascular senescence
SNPs VS patients (n = 151) Controls (n = 233) χ2 P-value CCL2 rs4586, n (%) C 180 (59.6) 293 (62.9) 37.278 < 0.001** T 122 (40.4) 173 (37.1) MMP-2 rs14070, n (%) C 178 (58.9) 357 (76.6) 51.395 < 0.001** T 124 (41.1) 55 (11.8) MMP-2 rs7201, n (%) A 187 (61.9) 381 (81.8) 37.447 < 0.001** C 115 (38.1) 85 (18.2) MMP-2 rs1053605, n (%) C 261 (86.4) 430 (92.3) 6.954 0.008** T 41 (13.6) 36 (7.7) Note. SNP: single nucleotide polymorphism; VS: vascular senescence; CCL2: chemokine (C‐C motif) ligand 2; MMP-2: matrix metalloproteinase 2; **P < 0.01. Table 3. Allele frequencies and χ2 analyses
-
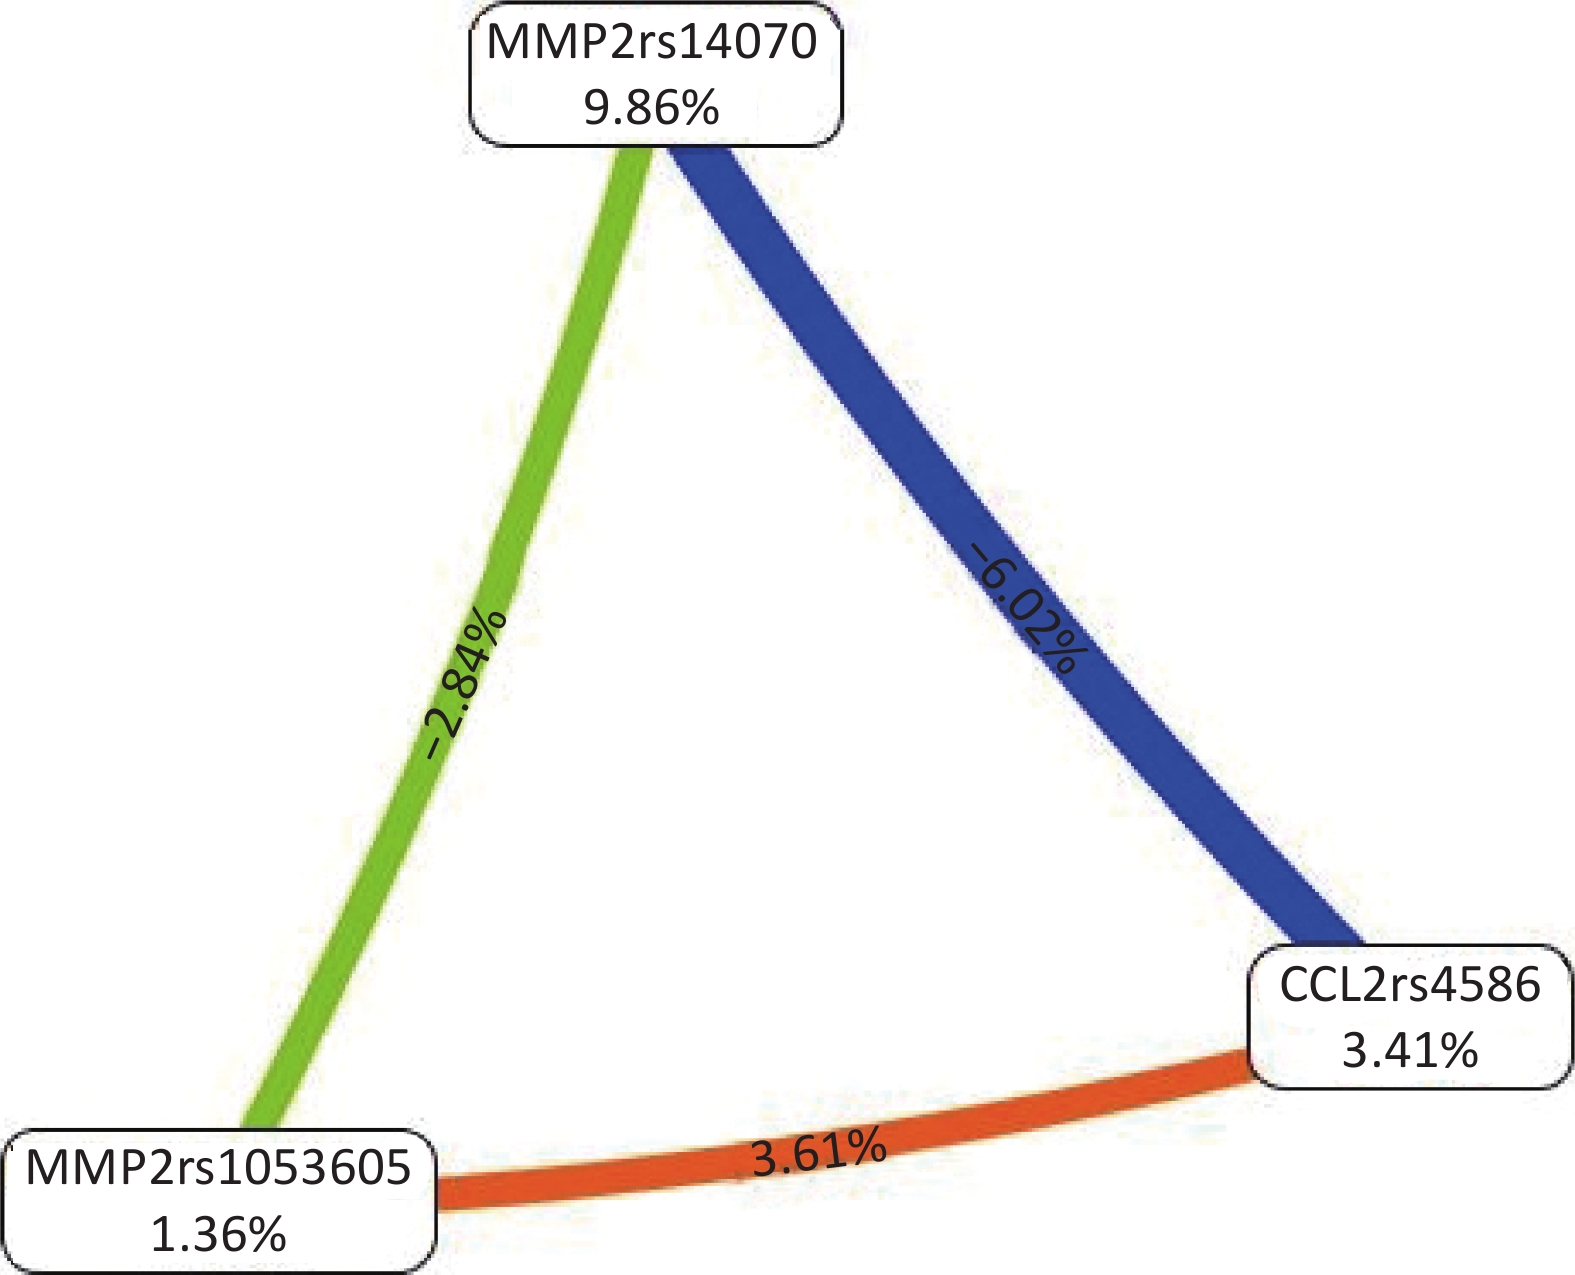
All possible combinations of polymorphisms were analyzed using MDR, and the optimal model had a balanced accuracy of 0.653 and a consistency of cross-validation of 10/10 (Table 4). The GMDR model yielded similar results (Table 5). Entropy measurements were used to construct an interaction map of the CCL2 rs4586, MMP-2 rs14070, and MMP-2 rs1053605 polymorphisms, and CCL2 rs4586 and MMP-2 rs14070 showed strong interactions, with information gain values of 3.01% (Figure 2).
Model Training-balanced accuracy Testing-balanced accuracy Cross-validation consistency MMP-2 rs14070 0.6538 0.6538 10/10 MMP-2 rs14070, MMP-2 rs1053605 0.6730 0.6565 9/10 CCL2 rs4586, MMP-2 rs14070, MMP-2 rs1053605 0.7254 0.7101 10/10 Note. MDR: multifactor dimensionality reduction; CCL2: chemokine (C‐C motif) ligand 2; MMP-2: matrix metalloproteinase 2. Table 4. MDR analysis
Model Training-balanced accuracy Testing-balanced accuracy Sign test
(P-value)Cross-validation consistency MMP-2 rs14070 0.6538 0.6537 10 (0.010) 10/10 MMP-2 rs14070, MMP-2 rs1053605 0.6730 0.6566 10 (0.010) 9/10 CCL2 rs4586, MMP-2 rs14070, MMP-2 rs1053605 0.7254 0.7089 10 (0.010) 10/10 Note. GMDR: generalized multifactor dimensionality regression; SBP: systolic blood pressure; BMI: body mass index; CCL2: chemokine (C‐C motif) ligand 2; MMP-2: matrix metalloproteinase 2. Table 5. GMDR analysis adjusted forage, SBP, BMI, and fasting blood glucose
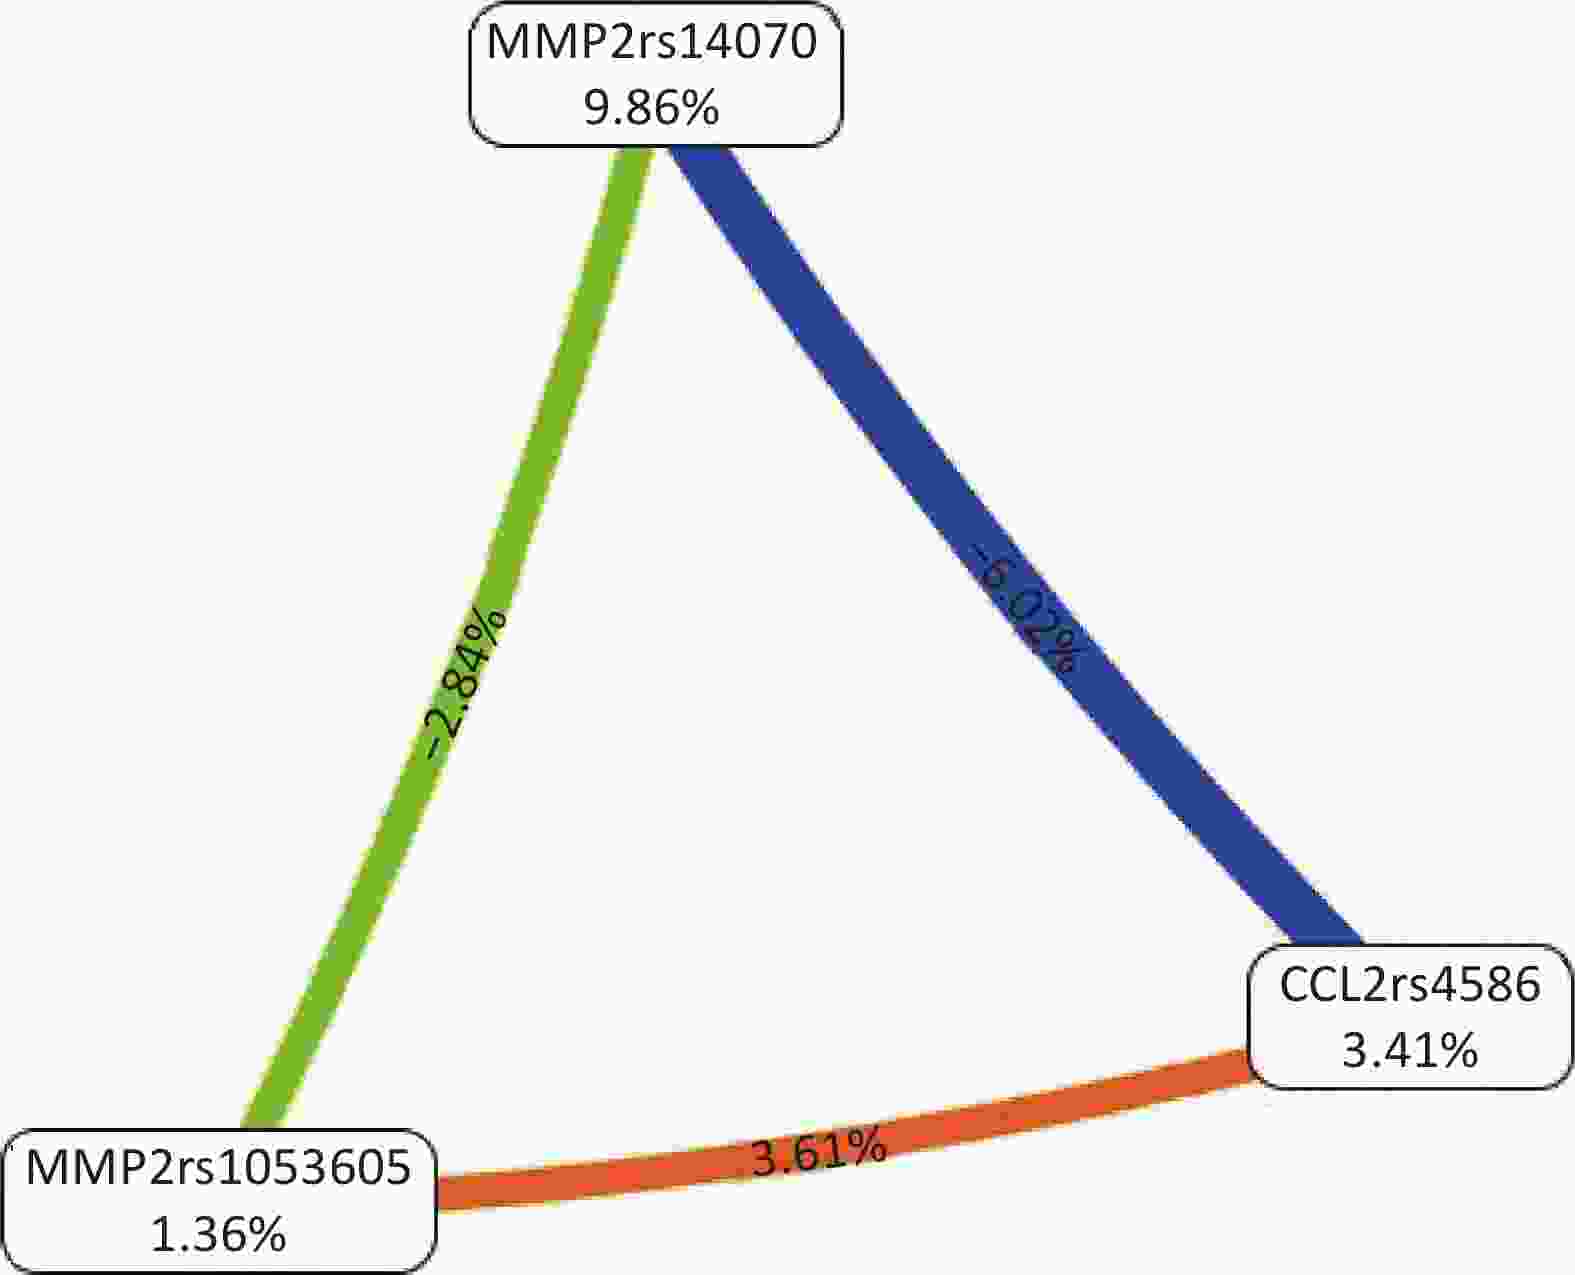
Figure 2. Interaction map for the risk of vascular senescence. Values inside nodes indicate information gain (IG) of each single nucleotide polymorphism, while values between nodes indicate IG of pairwise combinations. Orange: information gain. Green or blue: information redundancy. CCL2: chemokine (C‐C motif) ligand 2; MMP-2: matrix metalloproteinase 2.
Interactions among polymorphisms in high-risk genotypes were evaluated for CCL2 rs4586, MMP-2 rs14070, and MMP-2 rs1053605, with the strongest relationships observed for [CC+TT+CC] and [TC+TT+CC]. Low-risk genotypes were characterized by [CC+CC+CC] and [TC+CC+CC]. Likewise, for the two-locus model of MMP-2 rs14070 and MMP-2 rs1053605, the high- and low-risk genotypes were [TT+CC] and [CC+CC], respectively (Figure 3).

Figure 3. Distribution of high- and low-risk genotypes in the best three (A) and two-locus (B) models. Left bars represent the percentage of VS participants. Right bars represent the percentage of controls. Cells were at high risk if the percentage of cases/controls ≥ 1.0. VS: vascular senescence; CCL2: chemokine (C‐C motif) ligand 2; MMP-2: matrix metalloproteinase 2.
-
Population aging and the consequent diseases in the elderly have received considerable attention in mechanistic studies. VS is a significant contributor to various complications in affected organs and systems, highlighting the importance of understanding and targeting it in medical interventions. The associations of 14 polymorphisms in five genes encoding components of the MMP-2 signaling pathway with susceptibility to VS in the Northern Chinese population were analyzed in this study. Four SNPs with potential functional consequences, CCL2 rs4586, MMP2 rs14070, MMP2 rs7201, and MMP2 rs1053605, were significantly associated with this disease. MDR and GMDR showed additional significant interactions between VS and CCL2 rs4586 and MMP-2 rs14070. Thus, our study is the first to involve analyzing the associations of functional genetic variants in the MMP-2 signaling pathway with the risk of VS.
The gene encoding MMP-2 or gelatinase A[25] is on chromosome 16q12.2, spanning 47.72 kilobases (kb) and comprising 13 exons. This gene encodes three transcripts[26]. MMP-2 is crucial for ECM variations and has been implicated in biological processes, such as cell proliferation, angiogenesis as well as cell migration. Activated MMP-2 induces elastic fiber degradation[27] and enhances Type I and III collagen deposition by stimulating TGF-β1, CTGF, and the SMAD pathways[13]. Abnormally elevated MMP-2 levels have been observed in cardiovascular diseases, including myocardial fibrosis, aneurysms, aortic dissection, and arterial systolic and diastolic dysfunction[9]. Increased MMP-2 in the aortic media disrupts elastic fibers, driving the aneurysm process[28]. Crocin treatment in rats inhibits MMP-2, depresses elastin degradation, and blunts the development and rupture of thoracic aortic aneurysms[29]. Doxycycline, another potential MMP-2 inhibitor, moderates the expression and activity of MMP-2, limits ECM lesions, and slows the progression of abdominal aortic aneurysms[30,31]. These results indicate that MMP-2 has a key participation in regulating ECM remodeling and related cardiovascular disorders.
SNPs in the MMP-2 gene have previously been linked to coronary artery calcification, aneurysm, endometriosis, and malignant tumors, such as breast, gastric, and colorectal cancers. The A allele of SNP rs243866 was found to correlate with elevated serum MMP-2, suggesting a potential mechanism for the initiation and progression of calcification[32], and the T allele of rs243865 was linked to intracranial aneurysms in the UK Caucasian population[33]. However, SNPs in the genes involved in the MMP-2 signaling pathway have received relatively little attention regarding VS susceptibility. Polymorphisms, including rs14070, rs1053605, and rs7201 in the exons and 3' UTR of the MMP-2 gene were related to VS susceptibility in this study. After adjusting for the baseline parameters of age, blood pressure, BMI, and blood sugar levels, our statistical results supported this conclusion, indicating that these SNPs in the MMP-2 gene have an independent effect on VS.
Two loci examined in this study, MMP-2 rs14070 and rs1053605, are found within the exons of the MMP-2 gene. Rs14070 is a synonymous SNP situated in the exon 12 of MMP-2 (Phe552Phe) and is potential for regulating messenger RNA structure and protein folding. Wu et al. showed that the C allele of rs14070 modified the positive association between increased urinary cadmium concentrations and the risk of hypertension[34]. In contrast, another exon SNP, rs10536053, has been associated with a decreased risk of colorectal cancer[35].
Rs7201 is in the 3' UTR of the MMP-2 gene, and it can also lead to various pathological conditions through regulating the expression of MMP-2. Tsai discovered in his previous study that the A allele of rs7201 can be regulated by microRNA-520g, resulting in a decrease in MMP-2 expression and preventing endometriosis in Chinese women[36]. Moreover, Fatar et al. found an association between this variation and small vessel infarction[37]. Our result reveals an evidential relationship between the SNPs in exons and 3' UTR of the MMP-2 gene and VS morbidity. These results indicate that the aforementioned genetic variations might have a potential impact on the progression of VS by affecting the expression and structure of MMP-2, which requires further investigation into the exact mechanisms.
The CCL2 gene is located on chromosome 17q11.2 and encodes CCL2 or monocyte chemoattractant protein-1 (MCP-1). Human CCL2 comprises 76 amino acids, has a size of 13 kD, and is named after two contiguous amino-terminal cysteines[38]. CCL2 can be secreted by fibroblasts and the immune cells, endothelial cells, epithelial cells, and smooth muscle cells[39]. CCL2 alters the migration and infiltration of immune cells and modifies chemokines[40]. As an inflammatory vascular factor, CCL2 is essential in ECM modulation[13]. CCL2 increases MMP-2 expression and activity through its receptor, and MMP-2 subsequently enhances the active form of TGF-β. Similarly, TGF-β increases the activities of MCP-1 and MMP-2, forming a feed-forward loop. In addition to elastin degradation, these interactions elevate fibroblast proliferation and consequently lead to the overproduction of collagen Types I and III, which are salient features of VS[41]. Excessive CCL2 expression occurs in a wide spectrum of cardiovascular disorders, including myocardial fibrosis, atherosclerosis, hypertension, and chronic dilated cardiomyopathy[42]. Ang II infusion in mice enhances MCP1 and MMP-2 levels, promotes aneurysm progression, dissection, and rupture, and blocking the MCP-1 pathway via siRNA-mediated knockdown or genetic deletion inhibits elastin fragmentation and collagen production, thus attenuates aneurysm development[43]. These studies highlight the impact of CCL2 on the genesis of VS and the great potential of CCL2-targeted treatments.
CCL2 mutations have been implicated in various cardiovascular diseases. For instance, two SNPs of CCL2, namely G-927C and A-2578G, are associated with carotid intima-media thickness, reflecting generalized atherosclerosis, and are regarded as predictive factors of future vascular events[44]. In addition, the G allele of CCL2 −2518G/A polymorphism was linked to higher susceptibility to develop myocardial infarction compared with the A allele[45].
In this study, we found a significant relationship between CCL rs4586 and the incidence of VS, which persisted after adjusting for age, blood pressure, BMI, and fasting blood glucose levels. Thus, SNPs in the CCL2 gene have an independent effect on vascular senescence.
CCL2 rs4586 is situated in the exon of the CCL2 gene, of which the variation is responsible for multiple diseases. Variations in the rs4586 polymorphism were significantly correlated with increased CCL2 levels and conferred higher susceptibility to osteoarthritis[46]. Similarly, a previous study found an association between the CCL2 SNP rs4586 and pediatric tuberculosis[47]. The current study extended these observations by linking the same locus to VS, suggesting that this locus may cause VS through altering the molecular structure and function of CCL2.
In order to further detect the SNP-SNP interactions, multifactor dimensionality reduction (MDR) analysis is applied in our study. MDR is an innovative data reduction method for identifying multilocus genotype combinations that confer risks for various diseases. MDR is used to classify genotypes into high- and low-risk groups, shifting multilocus data into only one dimension[48]. Therefore, MDR is used to reveal complex gene-gene and gene-environment interactions in theoretical and empirical studies.
Our MDR analysis aimed at estimating the best models for different numbers of filtered SNPs in a cross-validation test, and we obtained consistent results. The overall best model comprised three SNPs: rs4586 (CCL2), rs14070 (MMP-2), and rs1053605 (MMP-2), with a testing accuracy of 70.89% and a cross-validation consistency (CVC) of 10/10. We also observed a significant interaction between rs4586 (CCL2) and rs14070 (MMP-2), indicating that these two SNPs may interact with each other to increase the risk of VS. Furthermore, we employed GMDR analysis to adjust for baseline characteristics, including age, BMI, SBP, and PG and obtained similar results. These predictions were based on the potential transcriptional and structural regulation of these loci. However, the mechanisms underlying this interaction remain unclear and require further investigation through functional studies.
In conclusion, the present study investigated 14 SNPs of five genes in the MMP-2 signaling pathway and found a significant association between VS and the SNPs CCL2 rs4586, MMP2 rs14070, MMP-2 rs7201, and MMP-2 rs1053605. In addition, we found a prominent interaction between rs4586 (CCL2) and rs14070 (MMP-2) and SNP models predicting a higher risk of VS.
This study has some limitations. First, although an association between genetic variation and VS was established, functional experiments are required to identify the underlying mechanisms. Second, the sample size was small; therefore, future studies with larger sample sizes are required to verify this relationship. Third, only 14 loci in the MMP-2 pathway were selected for genotyping; thus, further scrutiny of the SNP loci may be required to fully analyze the relationship between the MMP-2 pathway genetic variants and risk of VS. Nonetheless, this study indicates the involvement of some components of the MMP-2 pathway in the susceptibility to VS.
Association between Gene Polymorphisms and SNP-SNP Interactions of the Matrix Metalloproteinase 2 Signaling Pathway and the Risk of Vascular Senescence
doi: 10.3967/bes2024.016
Funds:
This research was supported by the Construction of Prevention and Treatment System of Geriatric Syndromes Focusing on Disability and Dementia (No. 21-1-2-2-zyyd-nsh).
- Received Date: 2023-10-09
- Accepted Date: 2024-01-19
-
Key words:
- Vascular senescence /
- Pulse wave velocity (PWV) /
- Single nucleotide polymorphism (SNP) /
- Matrix metalloproteinase 2 (MMP-2) /
- Extracellular matrix (ECM) /
- Structural degradation /
- Multifactor dimensionality reduction (MDR)
Abstract:
| Citation: | LIAO Zhen Yu, YANG Shuo, HU Song, LIU Jia, MAO Yong Jun, SUN Shu Qin. Association between Gene Polymorphisms and SNP-SNP Interactions of the Matrix Metalloproteinase 2 Signaling Pathway and the Risk of Vascular Senescence[J]. Biomedical and Environmental Sciences, 2024, 37(2): 146-156. doi: 10.3967/bes2024.016

|

 Quick Links
 DownLoad: