


-
Tuberculosis (TB), one of the top ten causes of death worldwide, is the second leading cause of mortality among infectious diseases after COVID-19. In 2021, an estimated 10.6 million new cases were registered worldwide, with an incidence rate of 134 per 100,000. Of these, 7% were children, 36% were adult women, and 57% were adult men, whereas 6.6% of the cases regarded individuals infected with HIV. China is a high-TB-burden country, with the third highest number of pulmonary TB (PTB) cases in 2021[1]. Thus, the severe global TB epidemic highlights the urgent need for better and more efficient implementation of control methods to reduce epidemic spread. Rapid and accurate diagnosis is one of the major requirements to curb the disease.
The current procedures for TB diagnosis are diverse and include culture, smear, GeneXpert MTB/RIF (Xpert), and interferon-gamma release assay (IGRA). Compared with the traditional detection of growth in bacterial cultures, which is time-consuming, and stained smears, which have low sensitivity[2,3], Xpert is rapid, sensitive, and highly accurate for diagnosing TB. However, it is expensive and impractical for widespread clinical use in developing countries. IGRA is a T-cell-based assay that measures a specific immune response to determine whether individuals are infected with Mycobacterium tuberculosis (Mtb). However, IGRA cannot distinguish between latent TB infection (LTBI) and active TB disease[4]. Furthermore, clinical situations arise where a definitive diagnosis using the available methods is not attained, and the clinician resorts to a composite reference standard (CRS) for diagnosis. Thus, the diagnosis of TB remains challenging.
TB can manifest as PTB or extrapulmonary TB (EPTB), which is more challenging to diagnose than PTB. EPTB is caused by Mtb infection in organs other than the lungs (such as the pleura, lymph nodes, abdomen, urogenital tract, skin, joints, bones, and meninges) without typical PTB symptoms and clinical manifestations[5]. Collection of samples from the infection sites can be difficult and the low bacterial content in the collected samples contributes to misdiagnosis[6]. Previous studies have found that when samples for diagnosing EPTB were obtained directly from the lesion[7,8], CRS diagnostics that included analysis of specimen pathology could lead to higher TB detection rates[8,9]. However, evidence regarding the utility of ultrasound-guided puncture samples in the diagnosis of EPTB is scant. We conducted this study to assess the value of this procedure in the diagnosis of EPTB using diverse tools.
This study used a disposable full-groove biopsy gun to collect puncture samples from lesions of patients with EPTB under ultrasound guidance. By comparing the detection performance of culture, smear, Xpert, and histopathological examination of the puncture samples, the relative value of these methods for the diagnosis of EPTB was assessed.
-
This study was conducted at the Shanghai Public Health Clinical Center from July 2017 to July 2020. Patients with suspected EPTB who met the following criteria were enrolled in the study: (1) suspected case of EPTB; (2) ability to provide detailed clinical history; and (3) ability to tolerate puncture and willingness to cooperate.
Participants were excluded if they[8]: (1) had incomplete clinical information; (2) had not completed related testing experiments; (3) had coagulation dysfunction and high risk of bleeding; or (4) were in a critical condition and could not tolerate puncture. We followed the CRS diagnostic criteria for TB[10-12] that include confirmed and suspected cases. Confirmed cases were defined as those with positive Mtb cultures from the corresponding organs or specimens. Suspected cases had one or more of the following: (1) clinical manifestation of Mtb infection in extrapulmonary organs; (2) indication of Mtb infection after imaging examination of the extrapulmonary organs; and/or (3) possibility of TB infection indicated in laboratory tests [positive tuberculin skin test (TST) and/or positive IGRA]. If none of these criteria were met, the cases were deemed non-TB. Infection by non-tuberculous mycobacteria (NTM) was defined by a positive result in the BACTEC MGIT 960 (BD, USA) liquid culture but negative in the TBAg MPT64 assay (a rapid immunochromatographic kit). In this study, the gold standard for the diagnosis of TB was a positive culture for Mtb. Confirmed TB cases were defined as a positive liquid culture and positive TBAg MPT64 assay. The pathological diagnostic criteria were typical epithelioid granuloma formation, caseous necrosis, and positive acid-fast staining.
This study was approved by the Ethics Committee of the Shanghai Public Health Clinical Center. Written informed consent was obtained from all recruited participants.
-
Lesion location and puncture sites were determined using ultrasound. Biopsy puncture was performed under ultrasound guidance. In strict accordance with aseptic requirements, the skin was disinfected by surgical towels with 75% ethyl alcohol. The surface of the probe was smeared with an appropriate amount of the coupling agent and then wrapped in sterile plastic bags. The needle was inserted after local anesthesia with 1% lidocaine. When the needle tip reached the predetermined puncture site, the trigger of the FULL-OPTY aspiration biopsy gun (model 18 G or 16 G; Italy) was pressed to obtain the tissue. After a biopsy was completed, the needle was quickly withdrawn. The specimen was placed in an appropriate sterile test tube with normal saline after observing tissue color, texture, and length. The needle direction could be changed and the sampling procedure could be repeated, if necessary, but the number of punctures did not exceed three. The specimens were immediately sent to the laboratory for analysis.
-
Before culture, the tissue strip extracted from the puncture samples was placed into a sterile test tube and the puncture needle was rinsed with physiological saline. After shaking, the supernatants were diluted with an appropriate amount of physiological saline. The samples were mixed with the treatment solution and the mixture was centrifuged (3,000 RPM, 15 min). The supernatant was discarded and the precipitation solution was used for further microbiological tests. The culture and drug sensitivity tests were performed using the BACTEC MGIT 960 Mycobacterium rapid culture method and Roche culture requirements for mycobacteria.
-
The samples were processed for auramine fluorescence staining (Baso Diagnostics Inc. Zhuhai, China)[4] and the microscopic examination was completed according to a standard operating procedure.
-
Generally, puncture tissue samples were not directly subjected to the Xpert assay; instead, the puncture needle and puncture fluid were rinsed with physiological saline. If the lesion was accompanied by necrosis and liquefaction, the pus extracted from the puncture was used. Xpert was performed according to the manufacturer’s instructions (Cepheid, USA). Untreated samples were mixed with the buffer solution at a ratio of 1:2. The mixture was incubated at room temperature for 15 min to ensure that the samples were completely dispersed. A sterile test tube was used to draw 2 mL of the sample, which was slowly added it into the GeneXpert MTB/RIF reaction box. The Xpert MTB/RIF software was used to automatically interpret the results.
-
The tissue puncture samples were fixed with 4% formalin, dehydrated, embedded in paraffin, and cut into 4-µm serial sections. After HE and acid-fast staining, the sections were examined under a microscope and classification was as follows: (1) presence of typical epithelioid granuloma formation, caseous necrosis, and diagnosis of TB, when positive for acid-fast staining; (2) when inflammatory cells infiltrate and epithelioid granulomas form, acid-fast staining shows 1–3 positive bacteria or caseous necrosis, and negative acid-fast staining is considered suspicious TB; (3) unclear conclusions such as inflammatory cell infiltration, cellulose exudation, and negative acid-fast staining cannot confirm TB diagnosis.
-
Statistical analysis was performed using SPSS version 19 and GraphPad Prism 8; differences were considered to be statistically significant at P < 0.05. The demographic and clinical characteristics of the participants were compared using an independent t-test, Mann-Whitney U test, or chi-square test, as appropriate. The sensitivity, specificity, positive predictive value (PPV), and negative predictive value (NPV) were calculated together with 95% confidence intervals (95% CI) to assess the performance of the diagnostic methods. McNemar’s chi-square (χ2) test was used to compare the diagnostic performance of the different detection methods using CRS as the reference or culture results as the golden standard , and a Kappa test was used to evaluate diagnostic concordance among the methods. These findings were compared with the diagnostic performance characteristics of smears, Xpert, and histopathology, using mycobacterial culture as the reference standard. We also compared the sensitivities and specificities of combined diagnostic tests.
-
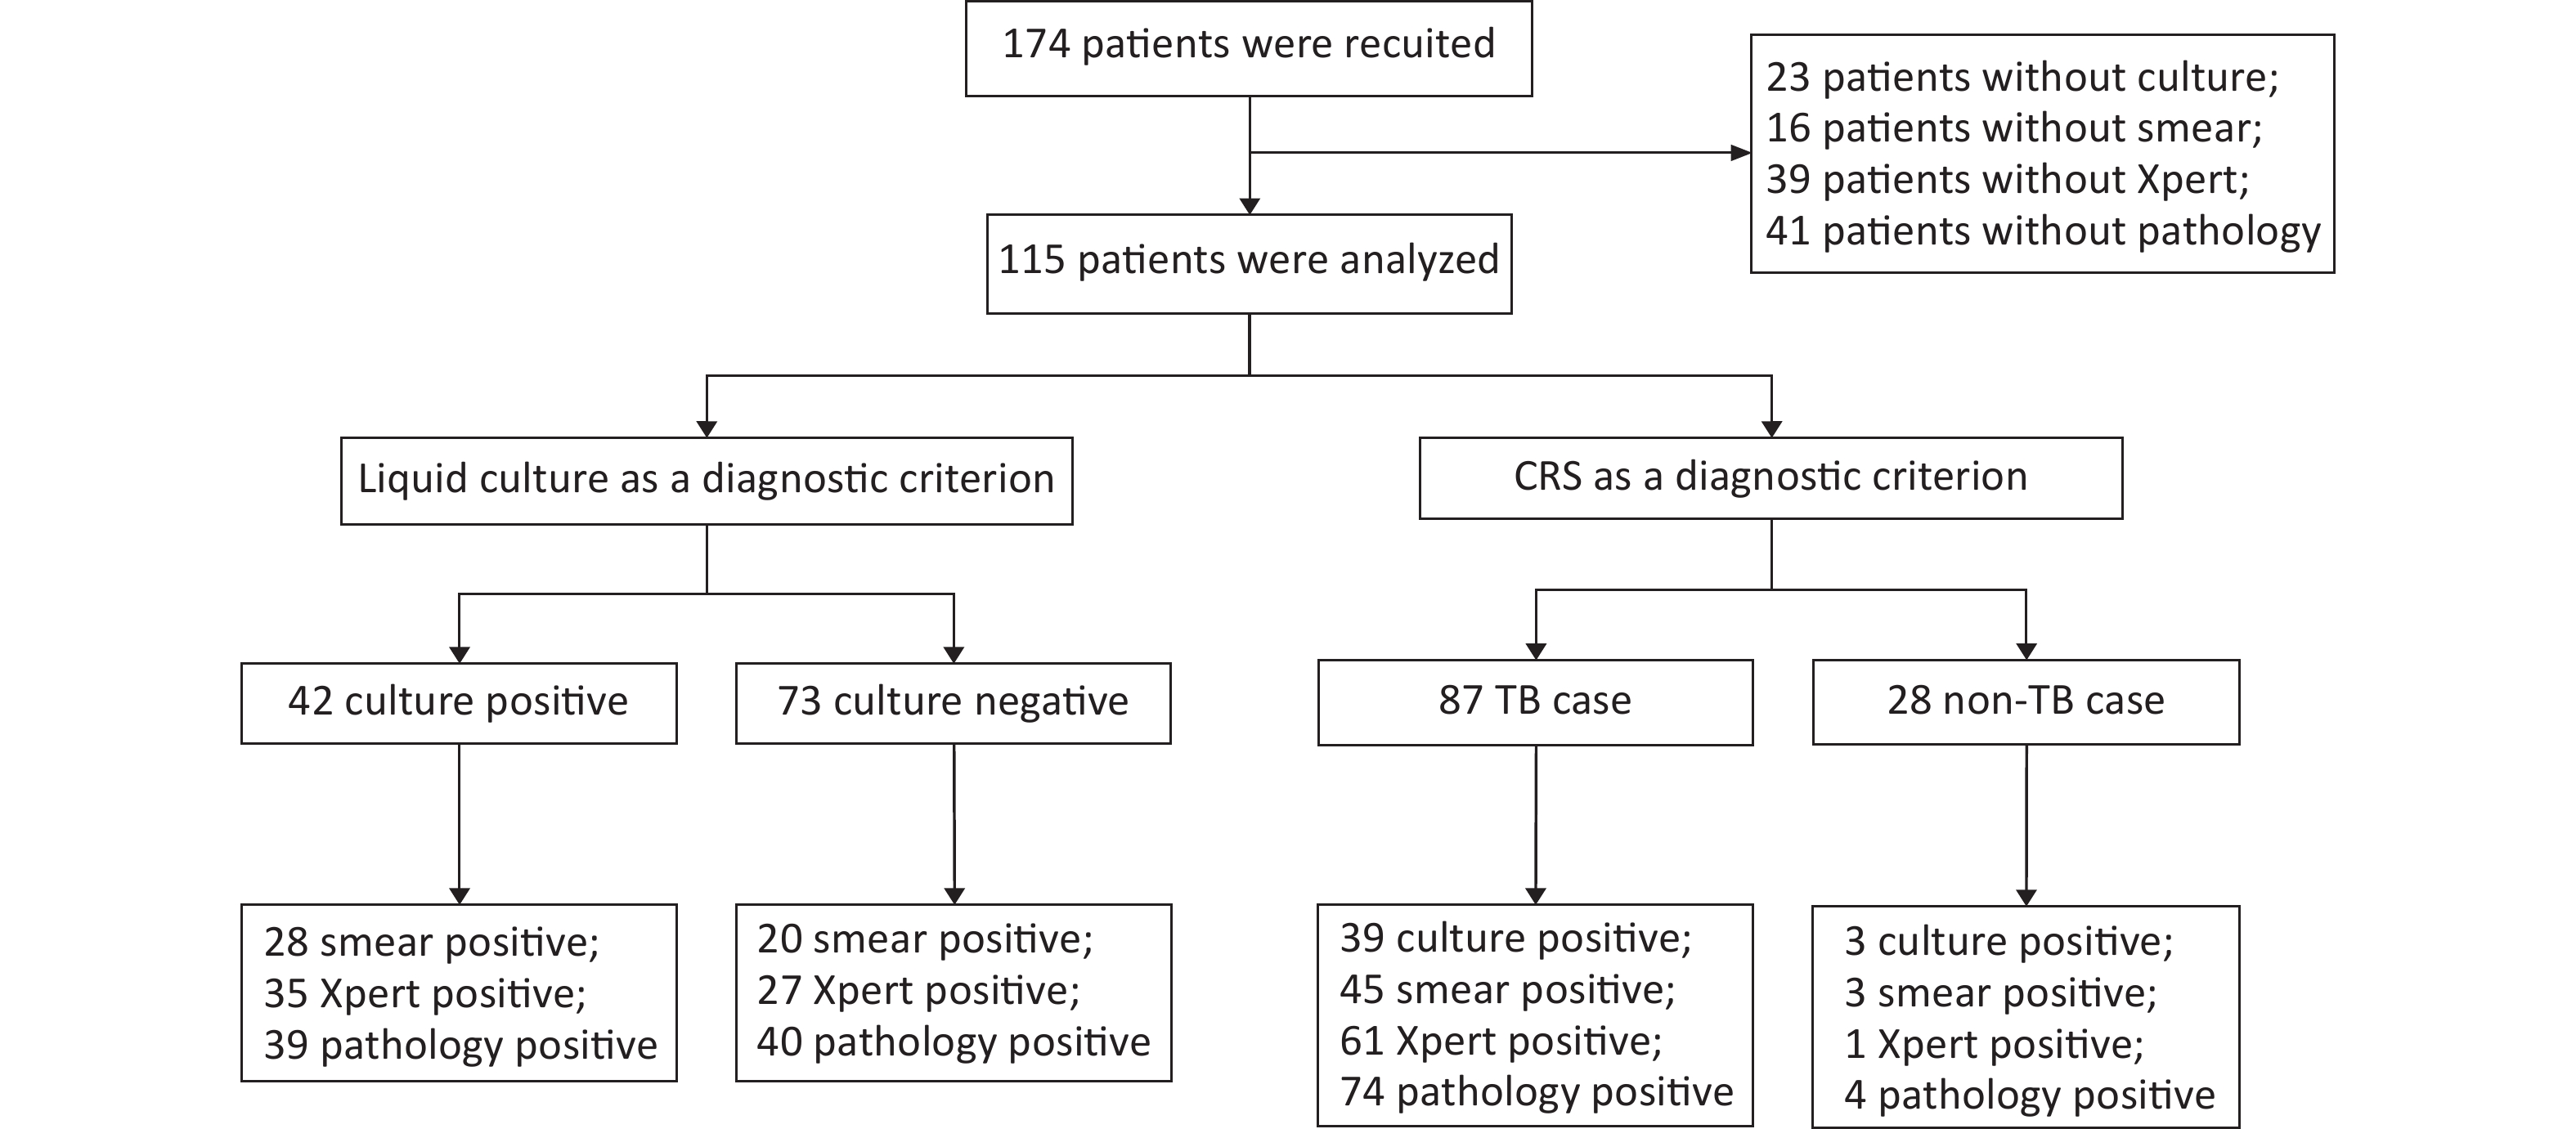
A total of 174 patients with puncture-sampled lesions under ultrasound guidance were enrolled in this study. Fifty-nine cases were excluded due to incomplete sampling, leaving 115 cases for analysis. Puncture samples from the 115 participants were tested using culture, smears, Xpert, and histopathology. Of the 115 participants, 72 (62.61%) were male and 43 (37.39%) were female, whereas 46 (40%) were HIV-positive and 69 (60%) HIV-negative (Table 1, Figure 1). Liquid culture of the 115 puncture samples revealed 42 positive cases (36.52%), of which 39 were positive for MPT64 (confirmed TB), and 73 cases (63.48%) were culture-negative. CRS led to a clinical diagnosis of TB in 87 of the 115 patients (75.65%) and of non-TB in 28 cases (24.35%; 1 case of Burkitt lymphoma, 4 cases of NTM, 2 cases of reactive hyperplasia, 1 case of epididymitis, 13 cases of lymphadenitis, 1 case of Staphylococcus aureus infection, 3 cases of lymphoma, and 3 cases of fungal infection).
Characteristics No. of total case No. of TB cases No. of case without TB P value Gender, n (%) Male 72/115 (62.61) 53/87 (60.92) 19/28 (67.86) 0.65 Female 43/115 (37.39) 34/87 (39.08) 9/28 (32.14) Age (Median [IQR]) 33 (27−44) 25 (31−43) 42 (30−55) 0.22 HIV, n (%) Positive 46/115 (40.00) 32/87 (36.78) 14/28 (50.00) 0.27 Negative 69/115 (60.00) 55/87 (63.22) 14/28 (50.00) Lymphatic diameter (mm) (Median [IQR]) 31 (21−45) 32 (22−45) 28 (18−49) 0.39 Pus volume (mL) (Median [IQR]) 0 (0−1) 0 (0−1) 0 (0−0) 0.92 Sample length (mm) (Median [IQR]) 25 (16−30) 25 (18−30) 20 (15−30) 0.14 Note. TB, tuberculosis; IQR, interquartile range; HIV, human immunodeficiency virus. Table 1. Characteristics of study participants

Figure 1. Flow chart of participant recruitment. TB, tuberculosis; CRS, composite reference standard.
-
When CRS was used as the reference standard, detection using histopathological examination had the highest sensitivity (85.06%, 95% CI: 76.10%–91.05%), followed by Xpert (70.11%, 95% CI: 59.81%–78.72%), smear (51.72%, 95% CI: 41.38%–61.93%), and culture (44.83%, 95% CI: 34.82%–55.28%), but modestly lower specificity (82.14%, 95% CI: 64.41%–92.12%) than the other methods (Table 2). McNemar’s test was used to evaluate the diagnostic performance of the four diagnostic methods using CRS as the reference standard. Culture (χ2 = 39.71, P < 0.001), smear (χ2 = 33.80, P < 0.001), and Xpert (χ2 = 21.33, P < 0.001) showed statistical differences compared with CRS, but no significant difference was reached compared with pathological examination (χ2 = 2.72, P = 0.099). Further, the diagnostic concordance between CRS and the four diagnostic methods was evaluated using a Kappa test. CRS showed modest but significant consistency with culture (Kappa = 0.221, Z = 3.261, P < 0.001), smear (Kappa = 0.279, Z = 3.828, P < 0.001), and Xpert (Kappa = 0.511, Z = 6.144, P < 0.001), as well as a higher degree of consistency with pathological evaluation (Kappa = 0.613, Z = 6.670, P < 0.001).
Method Result TB (n) Non-TB (n) Sensitivity (%) (95% CI) Specificity (%) (95% CI) PPV (%) NPV (%) Culture Positive 39 3 44.83 89.29 92.86 34.25 Negative 48 25 (34.82−55.28) (72.80−96.29) Smear Positive 45 3 51.72 89.29 93.75 37.31 Negative 42 25 (41.38−61.93) (72.80−96.29) Xpert Positive 61 1 70.11 96.43 98.39 50.94 Negative 26 27 (59.81−78.72) (82.29−99.82) Pathology Positive 74 5 85.06 82.14 93.67 63.89 Negative 13 23 (76.10−91.05) (64.41−92.12) Note. CRS, composite reference standard; EPTB, extrapulmonary tuberculosis; CI, confidence interval; PPV, positive predictive value; NPV, negative predictive value. Table 2. Contribution of different methods for detection of EPTB defined by CRS
A similar trend was observed when liquid culture was used as the standard. TB histopathological detection had superior sensitivity (92.86%, 95% CI: 80.99%–97.54%), which was higher than that of Xpert (83.33%, 95% CI: 69.40%–91.68%) and smear (66.67%, 95% CI: 51.55%–78.99%). However, the specificity of all tests was low, ranging from 45.21% to 72.60% (Table 3). Further, McNemar’s test showed significant differences between culture and both Xpert (χ2 = 10.62, P = 0.001) and pathology (χ2 = 31.84, P < 0.001) but no significant difference with smear (χ2 = 0.74, P = 0.391). Diagnostic concordance between liquid culture and the other three diagnostic methods was evaluated using a Kappa test. Culture showed statistical consistency with smear (Kappa = 0.381, Z = 4.112, P < 0.001) and Xpert (Kappa = 0.421, Z = 4.801, P < 0.001), but a lower degree of consistency with pathology (Kappa = 0.321, Z = 4.238, P < 0.001).
Method Result Culture + (n) Culture − (n) Sensitivity (%) (95% CI) Specificity (%) (95% CI) PPV (%) NPV (%) Smear Positive 28 20 66.67 72.60 58.33 79.10 Negative 14 53 (51.55−78.99) (61.44−81.51) Xpert Positive 35 27 83.33 63.01 56.45 86.79 Negative 7 46 (69.40−91.68) (51.55−73.18) Pathology Positive 39 40 92.86 45.21 49.37 91.67 Negative 3 33 (80.99−97.54) (34.31−56.58) Note. CI, confidence interval; PPV, positive predictive value; NPV, negative predictive value. Culture +, Culture positive; Cuture −, Culture negative. Table 3. Potential contribution of supplementary diagnostic tests of the CRS method to diagnosis with culture negative EPTB biopsy samples
-
To further study the utility of lesion pathology in diagnosing EPTB, the results of the histopathological assessment were combined with those from culture, smear, and Xpert. In the combined diagnostic criteria, a positive result was determined when one of the test results was positive, whereas a negative result required both test results to be negative. The sensitivity and specificity of the combined tests are presented in Table 4. The combination of pathological analysis and Xpert led to a sensitivity of 90.80% and specificity of 82.14% (Table 4). Sensitivity was highest when the specificity of the combined detection methods was equal at 82.14%. In addition, we found that the combination of the four methods led to an increase in detection sensitivity to 91.95% (Table 4).
Method Result TB (n) Non-TB (n) Sensitivity (%) (95% CI) Specificity (%) (95% CI) PPV (%) PNV (%) Culture+Pathology Positive 77 5 88.51 82.14 93.90 69.70 Negative 10 23 (80.12−93.64) (64.41−92.12) Smear+Pathology Positive 76 5 87.36 82.14 93.83 67.65 Negative 11 23 (78.76−92.79) (64.41−92.12) Xpert+Pathology Positive 79 5 90.80 82.14 94.05 74.19 Negative 8 23 (82.89−95.27) (64.41−92.12) Culture+Smear+Xpert Positive 66 4 75.86 85.71 94.29 53.33 Negative 21 24 (65.90−83.64) (68.51−94.30) Cuture+Smear+
Xpert+PathologyPositive 80 5 91.95 82.14 94.12 76.67 Negative 7 23 (84.31−96.05) (64.41−92.12) Note. TB, tuberculosis; CI, confidence interval; PPV, positive predictive value; NPV, negative predictive value. Table 4. Different detection methods combined with pathology to diagnose EPTB in puncture samples
-
Higher detection rates were observed in the samples from the neck and axilla than in those from other sites. Among all methods, histopathological assessment resulted in the highest detection rate, followed by Xpert. Notably, the detection rates from histopathological assessment of neck, chest, and axillary lesions were 81.13% (43/53), 66.67% (4/6), and 92.86% (13/14), respectively (Table 5).
Site Incidence of culture (%) Incidence of smear (%) Incidence of xpert (%) Incidence of pathology (%) Neck (n = 53) 23/53 (43.40) 25/53 (47.17) 36/53 (67.92) 43/53 (81.13) Chest (n = 6) 2/6 (33.33) 2/6 (33.33) 4/6 (66.67) 4/6 (66.67) Abdomen (n = 3) 1/3 (33.33) 2/3 (66.67) 2/3 (66.67) 3/3 (100.00) Armpit (n = 14) 7/14 (50.00) 10/14 (71.43) 11/14 (78.57) 13/14 (92.86) Joint (n = 6) 3/6 (50.00) 3/6 (50.00) 5/6 (66.67) 6/6 (100.00) Collarbone (n = 4) 2/4 (50.00) 3/4 (75.00) 2/4 (50.00) 4/4 (100.00) Table 5. Different detection methods performance in various puncture sites for the diagnosis of EPTB
-
The diagnosis of TB remains challenging, particularly in cases of EPTB, and current tests have limited accuracy. Culture and smear are the most routinely laboratory techniques for TB diagnosis. However, culture is time-consuming, requiring 2–8 weeks to obtain results, and the detection rate for EPTB after Mtb culture is only 30%–80%[13]. The smear is a convenient and inexpensive method, but detection rate is low, too, ranging between 20% and 80% and the method cannot distinguish between dead and live bacteria or between Mtb and NTM[14,15]. Xpert, a molecular method based on real-time polymerase chain reaction (RT-PCR), is rapid and accurate and can simultaneously detect Mtb and rifampicin-resistant mutations[16]. Recently, using Xpert, a sensitivity of 78.3% with specificity of 99.1% for TB were reported, and diagnostic efficiency in detecting EPTB ranged between 25% and 96.7%[17]. However, the application of Xpert in resource-poor areas is limited by the cost and availability of laboratory equipment.
Efforts to improve the accuracy of EPTB diagnosis are targeted at optimizing detection technology and obtaining high-quality specimens. The current ultrasound-guided puncture sampling method is accurate, safe, minimally invasive, and effective and has attracted wide attention from all over the world[8]. Our previous studies confirmed the consensus view that ultrasound-guided puncture sampling is satisfactory for diagnosing TB[8,18]. Contrast-enhanced ultrasound-guided biopsy of pleural TB has reported a diagnostic success rate of nearly 88.9%[19]. However, a systematic analysis of the usefulness of ultrasound-guided puncture samples in conjunction with diverse assays for the diagnosis of EPTB was lacking.
Our data showed that histopathological assessment had the highest sensitivity but modestly lower specificity than the other detection methods. As presented in Table 2, based on the CRS diagnostic criteria, pathological diagnosis had the highest sensitivity in the cohort of 87 patients with TB. Similarly, as presented in Table 3, pathological diagnosis showed the highest sensitivity in the 42 cases with positive cultures.
In this study, 64.10% (25/39) of the culture-positive patients with confirmed TB were smear-positive. Nevertheless, among the culture+/smear+ samples, the detection rate using either Xpert or histopathology was 96% (24/25). In the patients with culture+/smear- disease (35.90%; 14/39), the detection rates using Xpert and histopathology were 78.57% (11/14) and 85.71% (12/14), respectively. Thus, using liquid culture as the gold standard, histopathology contributed more than Xpert to the diagnosis of EPTB in patients with smear-negative disease. We found that detection sensitivity using Xpert was overall low (70.11%) and lower than that reported in previous studies[20-22]. This may be related to improper sample handling in this study—not sufficiently pulverized puncture samples or excessive treatment fluid, resulting in over-diluted samples, insufficient for detection of the low numbers of Mtb)[23]—or to sample collection from patients who had previously received anti-TB chemotherapy[22,24,25]. In addition, the detection rate using smears in this study was higher than that using culture. A possible reason is that positive culture results indicate the presence of live bacteria, while, in smear tests, presence both of live and dead bacteria can lead to positive results. In addition, long-term treatment with anti-TB chemotherapy may lead to a decrease in bacterial activity in some retreated patients. Thus, these factors may have led to an underestimation of culture rate.
In summary, we found that histopathological evaluation had the highest sensitivity but lowest specificity. The sensitivity and specificity of diagnosis were enhanced when histopathology was combined with other detection methods. Histopathology combined with culture led to increased sensitivity by 3.45%; with smear, by 2.4%; and with Xpert, by 5.74%. The combination of pathology with Xpert had the best performance in detecting EPTB, with a sensitivity and specificity of 90.80% and 82.14%, respectively.
Our study had several limitations. First, the number of recruited participants was small. Second, the pathologist’s experience easily influenced the outcome of the histopathological analysis[8]. Third, we did not explore the performance of diagnostic tests in patients with different disease statuses, such as those with HIV infection or those receiving anti-TB treatment. The results of the statistical analyses were not adjusted for multiple comparisons.
-
EPTB is amenable to histopathological detection, and, in combination with Xpert, histopathological analysis can improve the diagnostic efficiency of puncture biopsy. Considering that pathological examination is inexpensive and does not require advanced equipment, this method may be a useful adjunct tool for detecting EPTB in resource-limited areas.
Effectiveness of Histopathological Examination of Ultrasound-guided Puncture Biopsy Samples for Diagnosis of Extrapulmonary Tuberculosis
doi: 10.3967/bes2024.017
Funds:
The present study was funded by the grants from the National Key Research and Development Program of China [2021YFC2301503, 2022YFC2302900]; and the National Natural and Science Foundation of China [82171739, 82171815, 81873884].
- Received Date: 2023-02-23
- Accepted Date: 2023-08-24
-
Key words:
- Extrapulmonary tuberculosis /
- Diagnosis /
- Biopsy /
- Histopathological examination /
- Puncture samples
Abstract:
The authors declare that the research was conducted without any commercial or financial relationships that could be construed as a potential conflict of interest.
&These authors contributed equally to this work.
| Citation: | GU Wen Fei, SHI Xia, MA Xin, YU Jun Lei, XU Jin Chuan, QIAN Cheng Cheng, HU Zhi Dong, ZHANG Hui. Effectiveness of Histopathological Examination of Ultrasound-guided Puncture Biopsy Samples for Diagnosis of Extrapulmonary Tuberculosis[J]. Biomedical and Environmental Sciences, 2024, 37(2): 170-177. doi: 10.3967/bes2024.017

|

 Quick Links
 DownLoad: