

-
Age-related cognitive impairment (CI) is seen in older patients suffering from mild CI to severe dementia with increasing age. The 2016 Global Burden of Diseases, Injuries, and Risk Factors Study reported that approximately 40-50 million people were living with dementia[1]. In China, a systematic review and meta-analysis in 2018 estimated that about 9.5 million people in the general population aged 60 years or older have dementia[2]. The difference between dementia from mild CI is whether there is significant interference in the ability to function at work or carry out usual daily activities[3]. Consequently, many patients may not receive an intervention chance at an early and mild stage of CI. Due to its insidious onset and poor prognosis, CI is becoming a major global health challenge. Currently, most diagnoses of dementia depend on an abnormality in Magnetic Resonance Imaging (MRI) or cerebrospinal fluid findings[4-6]. Therefore, a non-invasive and rapidly acquired biomarker of CI is urgently needed.
The association between retinal nerve fiber layer (RNFL) thickness and CI were previously reported by several studies. However, overall variation in different populations indicates challenges in identifying the susceptible population[6-9]. The retina is derived from the neuroderm, with retinal and intracranial small arteries sharing an internal carotid artery as a common origin. These vessels have similar embryonic origins and anatomical features, while previous studies have demonstrated a close relationship between retinal microvascular abnormalities and cardiovascular diseases[10]. However, only a few studies have focused on retinal abnormality and CI based on the carotid and other arteries status[11,12]. Retinal vascular and neuronal parameters were associated with cortical cerebral microinfarcts, and patients with both pathologies were likely to have CI[13], which indicated the possibility of a similar mechanism for small vessel disease and retinal abnormality in the CI development. Therefore, the present study aimed to determine whether retinal vascular and RNFL metrics were associated with CI in people with different arterial status.
-
The Asymptomatic Polyvascular Abnormalities Community study (APAC) is a community-based, prospective, long-term follow-up observational investigation. The cohort in the present study was a subgroup of the Kailuan study population aged 40 years or older, consisted of 101,510 employees and retirees of the Kailuan Company in Tangshan, with the aim of investigating different diseases associated with asymptomatic polyvascular abnormalities in Chinese adults. Participants with a history of stroke, transient ischemic attack, or coronary disease were excluded from the population. The details of the study design and inclusion and exclusion criteria have been reported in our published protocols[14]. The APAC study was performed in accordance with the guidelines of the Helsinki Declaration and was approved by the Ethics Committees of the Kailuan General Hospital, Beijing Tiantan Hospital (IRB no. 2010-014-01) and Beijing Tongren Hospital. Written informed consent was obtained from all the participants[15].
Each participant underwent an interview performed at baseline by trained investigators using a standardized questionnaire comprising age, sex, educational level, ethnicity, smoking habit, alcohol drinking, history of hypertension, diabetes mellitus, dyslipidemia, and ophthalmological diseases. The definition of each index has been described in our previously published protocol and papers[14,15].
-
The intracranial, extracranial carotid, and peripheral arteries were assessed for the presence of arterial stenosis. Intracranial arterial stenosis (ICAS) was diagnosed according to peak flow velocity as per the published criteria for transcranial doppler (EME Companion, Nicolet, Madison, WI, USA). An ICAS was defined as a peak systolic flow velocity of > 140 cm/s for the middle cerebral artery, > 120 cm/s for the anterior cerebral artery, > 100 cm/s for the posterior cerebral and vertebra-basilar arteries, and > 120 cm/s for the siphon internal carotid artery[16]. A bilateral carotid duplex ultrasound was performed to identify extracranial carotid arterial stenosis (ECAS) as part of the standard diagnostic technique. Carotid stenosis (≥ 50%) was graded based on the recommendations of the Society of Radiologists in Ultrasound Consensus Conference[17]. The ankle brachial index (ABI) was calculated using a standard method (Hokanson MD6 Doppler with MD6VR Chart Recorder; Bellevue, WA, USA), with an ABI < 0.90 in either leg as a marker of peripheral arterial disease (PAD)[18].
-
Fundus photography and optical coherence tomography (OCT) were performed for each participant to measure the central retinal arteriolar equivalents (CRAE), central retinal venous equivalents (CRVE), and RNFL thickness (fundus camera Type CR6-45NM; Canon, Ōta, Tokyo, Japan for fundus photography, and iVue SD-OCT, Optovue Inc., Fremont, CA, USA for measurement of RNFL thickness). The retinal vessel diameters were measured using computer-assisted quantitative assessment software as described in our previous protocols to assess generalized retinal vascular changes[14]. The arterio-venous ratio (AVR) was calculated as CRAE/CRVE. The iVue SD-OCT used a super luminescent diode scan with a center wavelength of 840 ± 10 nm to provide high-resolution images. A 6 × 6 mm2 raster scan was centered on the optic disc and macula. We measured mean peripapillary RNFL thickness, CRAE, and AVR in one eye (right eye first, if not available, we used the left eye) from each participant for further analysis[19].
-
We used Mini-Mental State Examination (MMSE) to examine the participant’s cognitive function. The MMSE comprised 30 scores that provide information on orientation to time and place, attention, learning, calculation, language, construction, delayed recall, and memory. Higher scores indicate greater cognitive function. CI was defined as a score of < 24 or < 20 for patients with educational level of middle school or above or an elementary school level, respectively, and < 17 for an illiterate[20-23]. We separated the participants into CI or non-CI groups according to their cognitive function.
-
Statistical analyses were performed using SAS software (version 9.3; SAS Institute, Cary, NC, USA). Continuous variables expressed as median (25% quartile, 75% quartile) included comparison of age, RNFL thickness, CRAE, CRVE, and AVR using analysis of variance; Categorical variables expressed as percentages included comparison of sex, ethnicity, smoking and alcohol drinking habits, previous history of hypertension, diabetes, hyperlipidemia, glaucoma and cataract surgery, ICAS, ECAS, and PAD using the chi-squared test. Outliers of the main metrics in the APAC study were defined in our protocol[14], and missing data and outliers were eliminated during the analysis. Logistic regression was used to examine the relationship between different retinal metrics and cognitive function, grouped according to the status of the different arteries, and adjusted for relevant risk factors. The null hypothesis was rejected for P < 0.05.
-
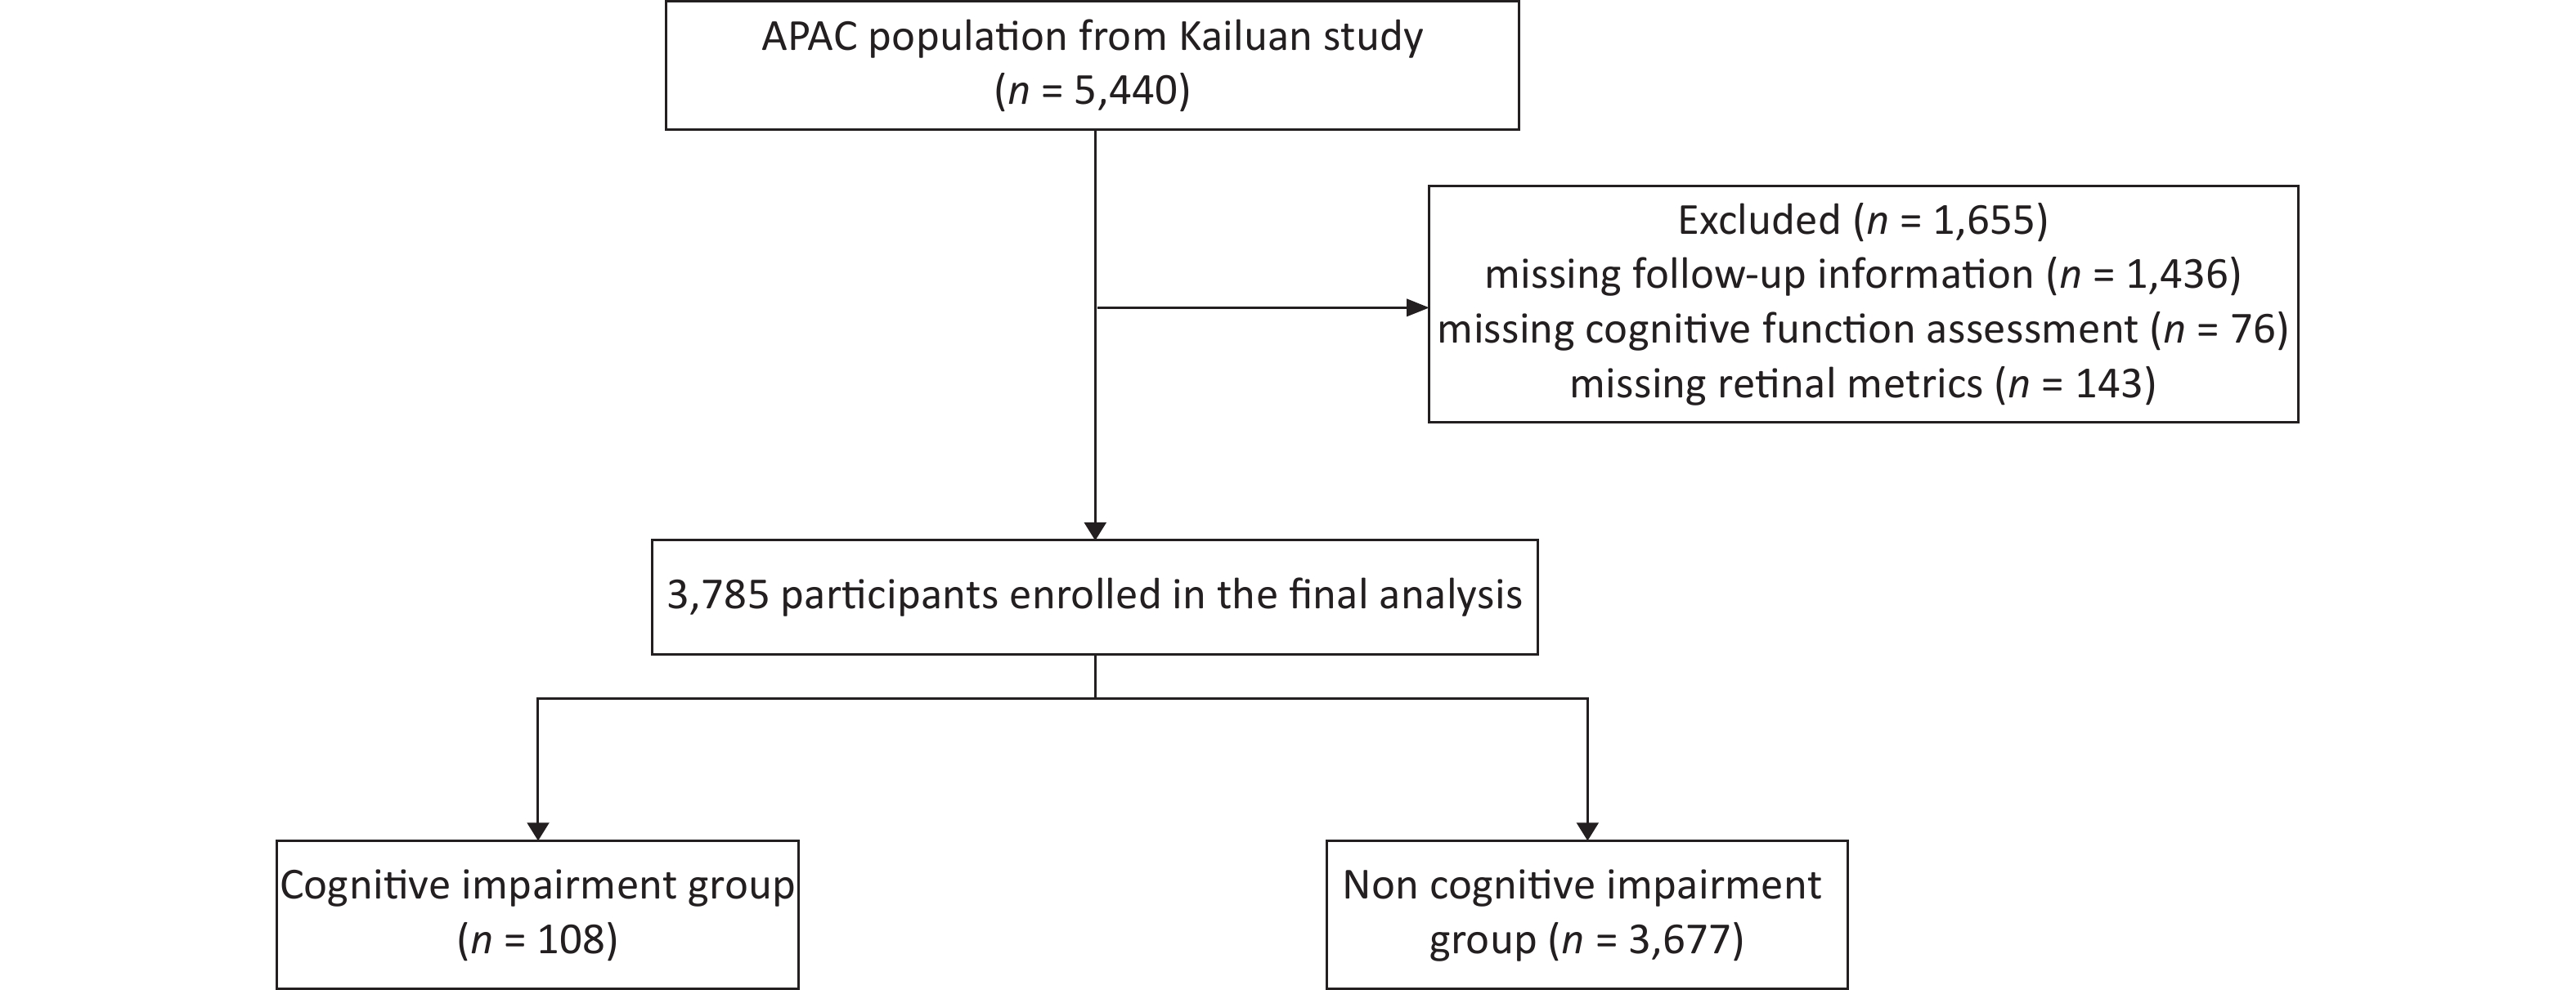
A total of 5,440 participants were recruited as baseline from 2010 to 2011. Cognitive function was assessed by the MMSE, and retinal metrics were collected by retinal photography and spectral-domain optical coherence tomography during the first follow-up period between 2012 to 2013, with 4,004 participants attending this appointment. Of these subjects, 76 and 143 did not finish the cognitive function assessment or retinal-related metrics assessment, respectively, leaving 3,785 participants in the final analysis (CI group 108, non-CI group 3,677, Figure 1).
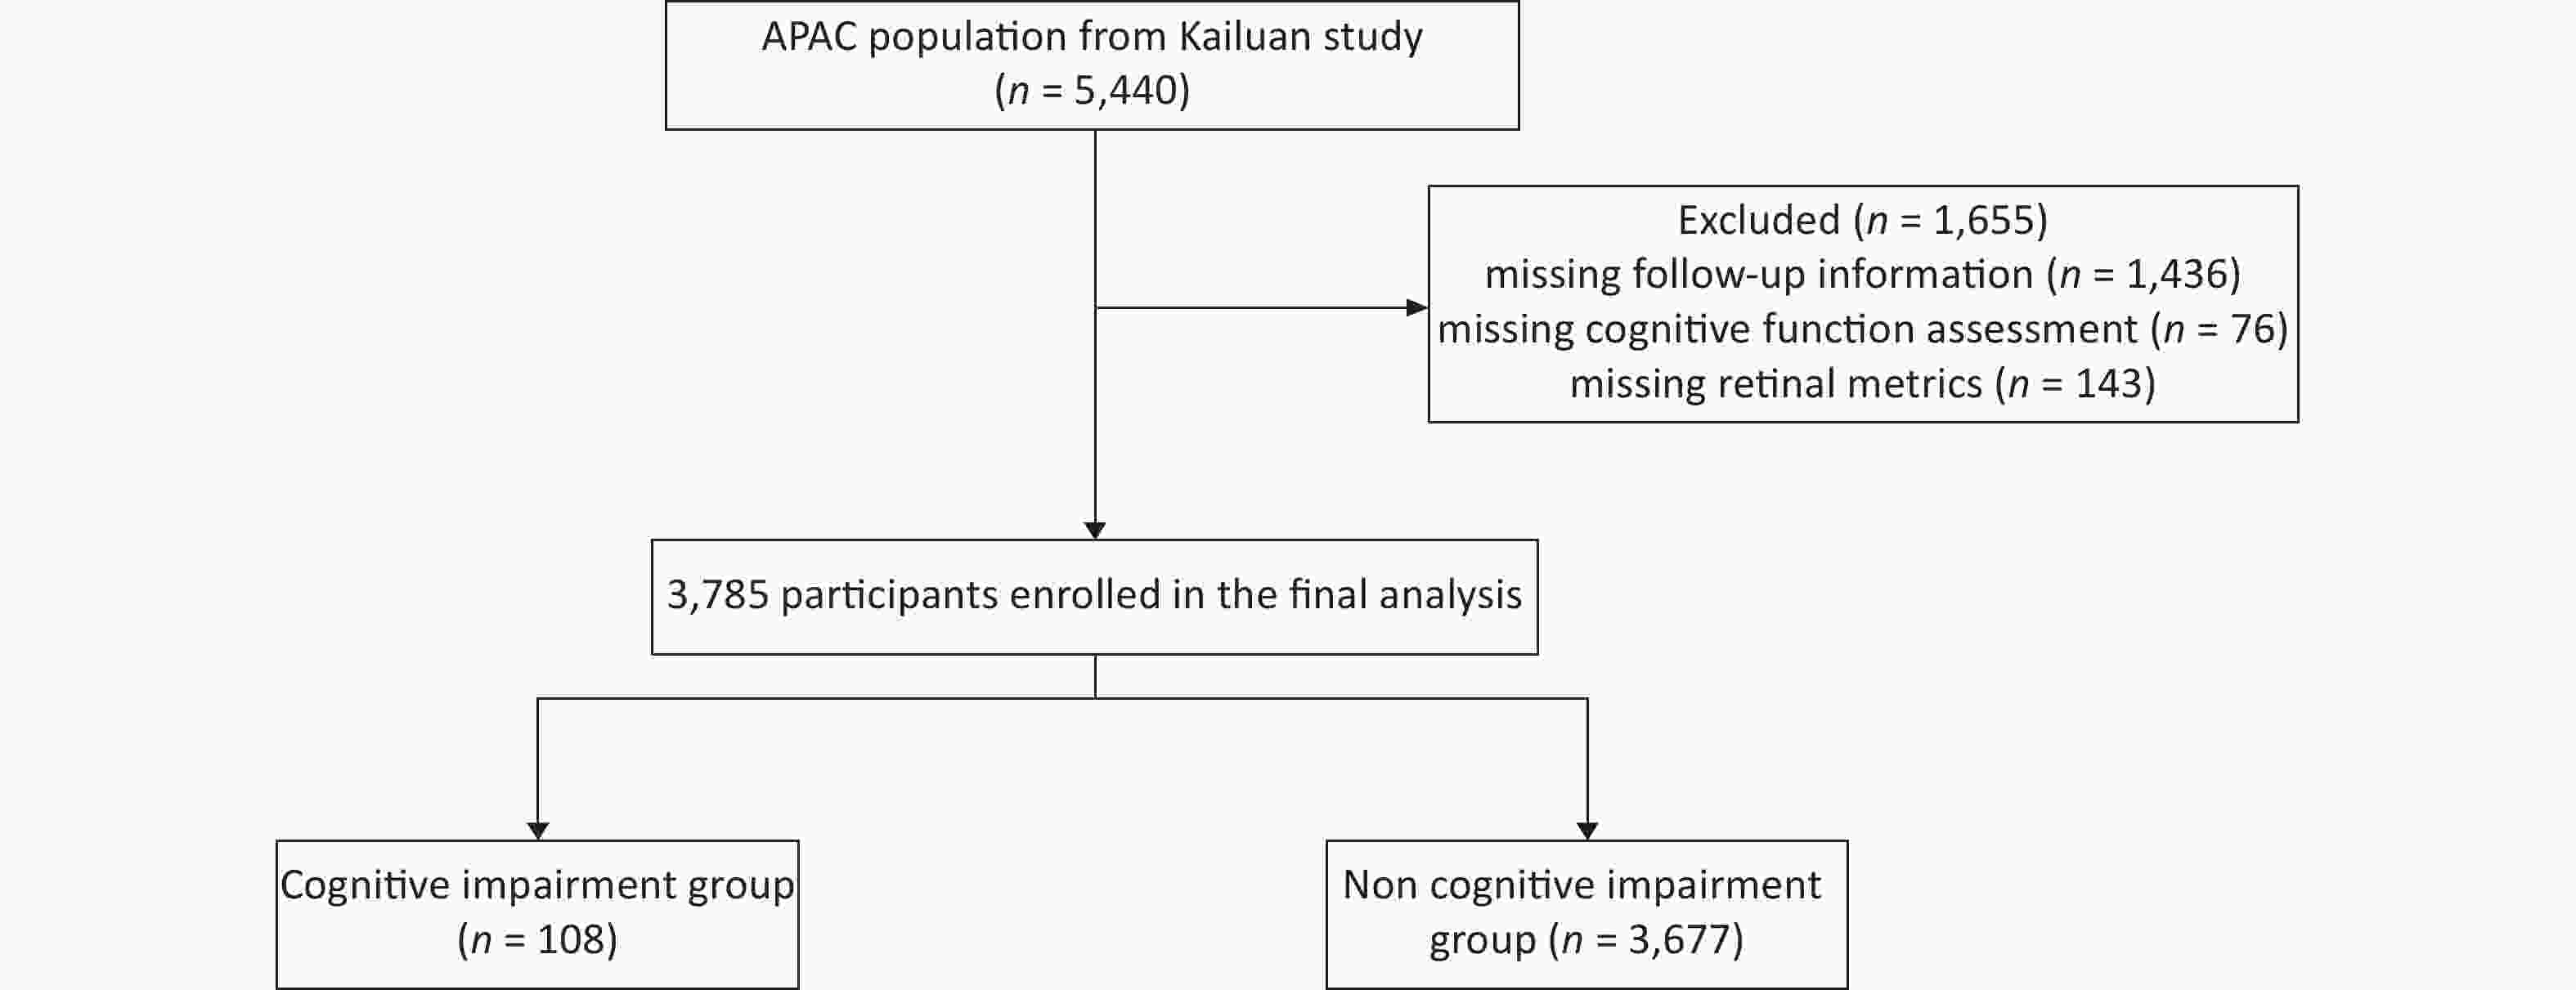
Figure 1. Flowchart of the study.
The mean age of the participants was 53.7 years, with 2,143 (56.6%) being male. The baseline characteristics of the two groups are shown in Table 1. In the CI group, the participants were older and had a lower educational level than that of the non-CI group. The percentage of glaucoma was also higher in the CI group than in the non-CI group. The other epidemiological characteristics and medical histories were not statistically different between the two groups (Table 1).
Parameters Missing (n) CI (n = 108) Non-CI (n = 3,677) P value Age (quartile), y n = 0 57.8 (51.8, 72.6) 51.4 (45.2, 59.1) < 0.001 Male (n), % n = 0 71 (65.7) 2,072 (56.4) 0.061 Han ethnic (n), % n = 0 107 (99.1) 3,628 (98.7) 0.900 Educational level (n), % n = 0 0.0074 Illiterate 5 (4.6) 46 (1.3) elementary school 11 (10.2) 297 (8.1) middle school or above 92 (85.2) 3,334 (90.7) Smoking (n), % n = 0 38 (35.2) 1,164 (31.7) 0.463 Alcohol Drinking (n), % n = 0 13 (12.0) 530 (14.4) 0.578 Past medical history (n), % Hypertension n = 0 56 (51.9) 1,677 (45.6) 0.204 Diabetes mellitus n = 0 14 (13.0) 398 (10.8) 0.436 Dyslipidemia n = 0 49 (45.4) 1,802 (49.0) 0.495 Glaucoma n = 754 4 (4.8) 31 (1.1) 0.003 Cataract surgery n = 756 2 (2.4) 62 (2.1) 0.698 Note. CI: cognitive impairment. Table 1. Basic characteristics of participants regarding the prevalence of cognitive impairment
In the second step, we analyzed the relationship between cognitive function and the different retinal metrics. Compared with the non-CI group, the CI group had significantly thinner RNFL thickness (odds ratio (OR): 0.973, 95% confidence interval (CI): 0.956–0.990). After adjustment for the relevant risk factors including age, sex, han ethnicity, educational level, smoking habit, alcohol drinking, past history of hypertension, diabetes mellitus, dyslipidemia, and glaucoma and cataract surgery, the difference is still valid (OR: 0.973, 95% CI: 0.953–0.994). The CRAE and AVR were not significantly different between the two groups after adjusting for the basic risk factors (Table 2).
Parameters Including OR 95% CI P value RNFL n = 3,332 0.973 0.956–0.990 0.002 Adjusted 0.973 0.953–0.994 0.013 CRAE n = 3,554 0.988 0.979–0.998 0.019 Adjusted 0.993 0.982–1.005 0.268 AVR n = 3,554 0.194 0.024–1.596 0.127 Adjusted 0.313 0.029–3.421 0.341 Note. Adjusted: adjusted by age, sex, han ethnicity, educational level, smoking, alcohol drinking, past history of hypertension, diabetes mellitus, dyslipidemia, glaucoma and cataract surgery. OR: Odds Ratio; RNFL: retinal nerve fiber layer; CI: confidence interval; CRAE: central retinal arteriolar equivalents; AVR: central retinal arteriolar equivalents /central retinal venous equivalents. Table 2. Adjusted odds ratios for cognitive function and different retinal metrics
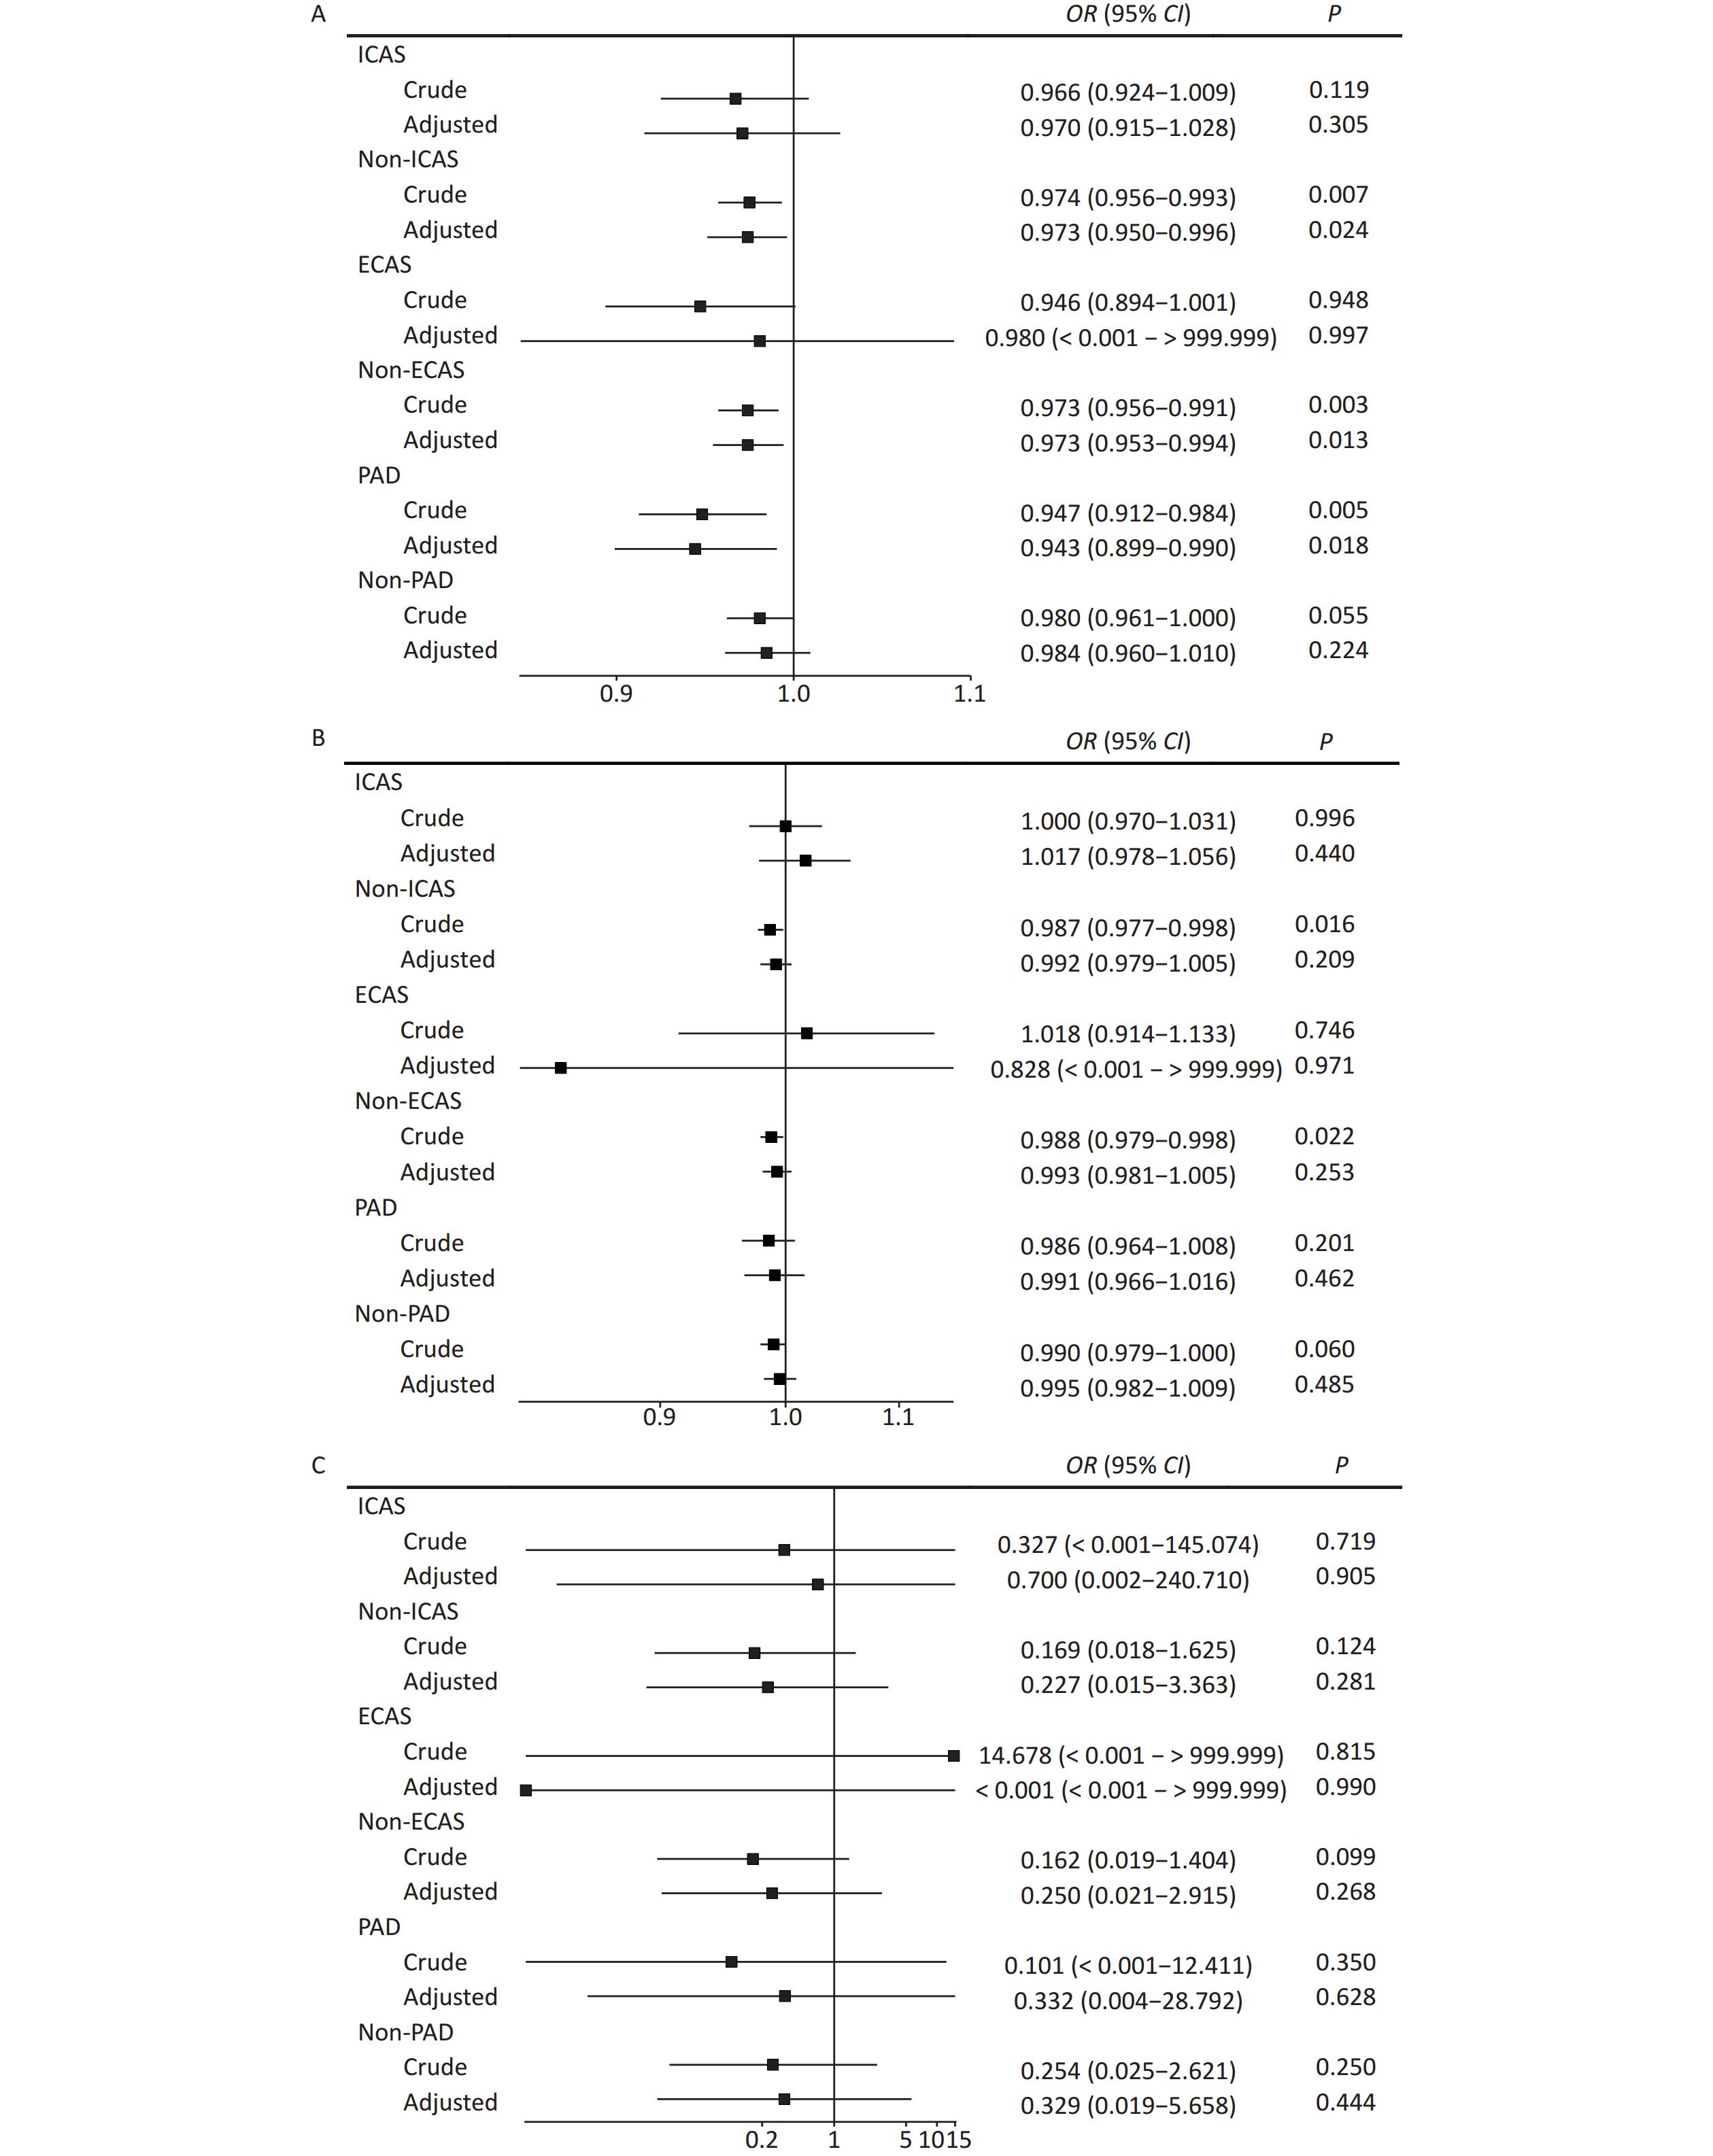
To determine whether different arterial stenoses had different effects on retinal metrics for CI, we separated the participants according to their ICAS, ECAS, and PAD status. For RNFL, we showed that RNFL was significantly thinner in CI patients than in the non-ICAS and non-ECAS subgroups, with this association remaining for RNFL and CI after adjusting for risk factors shown in Table 1 (non-ICAS group: OR: 0.974, 95% CI: 0.956–0.993 for crude, OR: 0.973, 95% confidence interval: 0.950–0.996 for adjusted; non-ECAS group: OR: 0.973, 95% CI: 0.956–0.991 for crude, OR: 0.973, 95% CI: 0.953–0.994 for adjusted). Interestingly the association also existed in the PAD subgroup (OR: 0.947, 95% CI: 0.912–0.984 for crude, and OR: 0.943, 95% CI: 0.899–0.990 for adjusted). For CRAE and AVR, no significant difference was observed after adjusting for the risk factors (Figure 2 A for RNFL, B for CRAE, C for AVR).
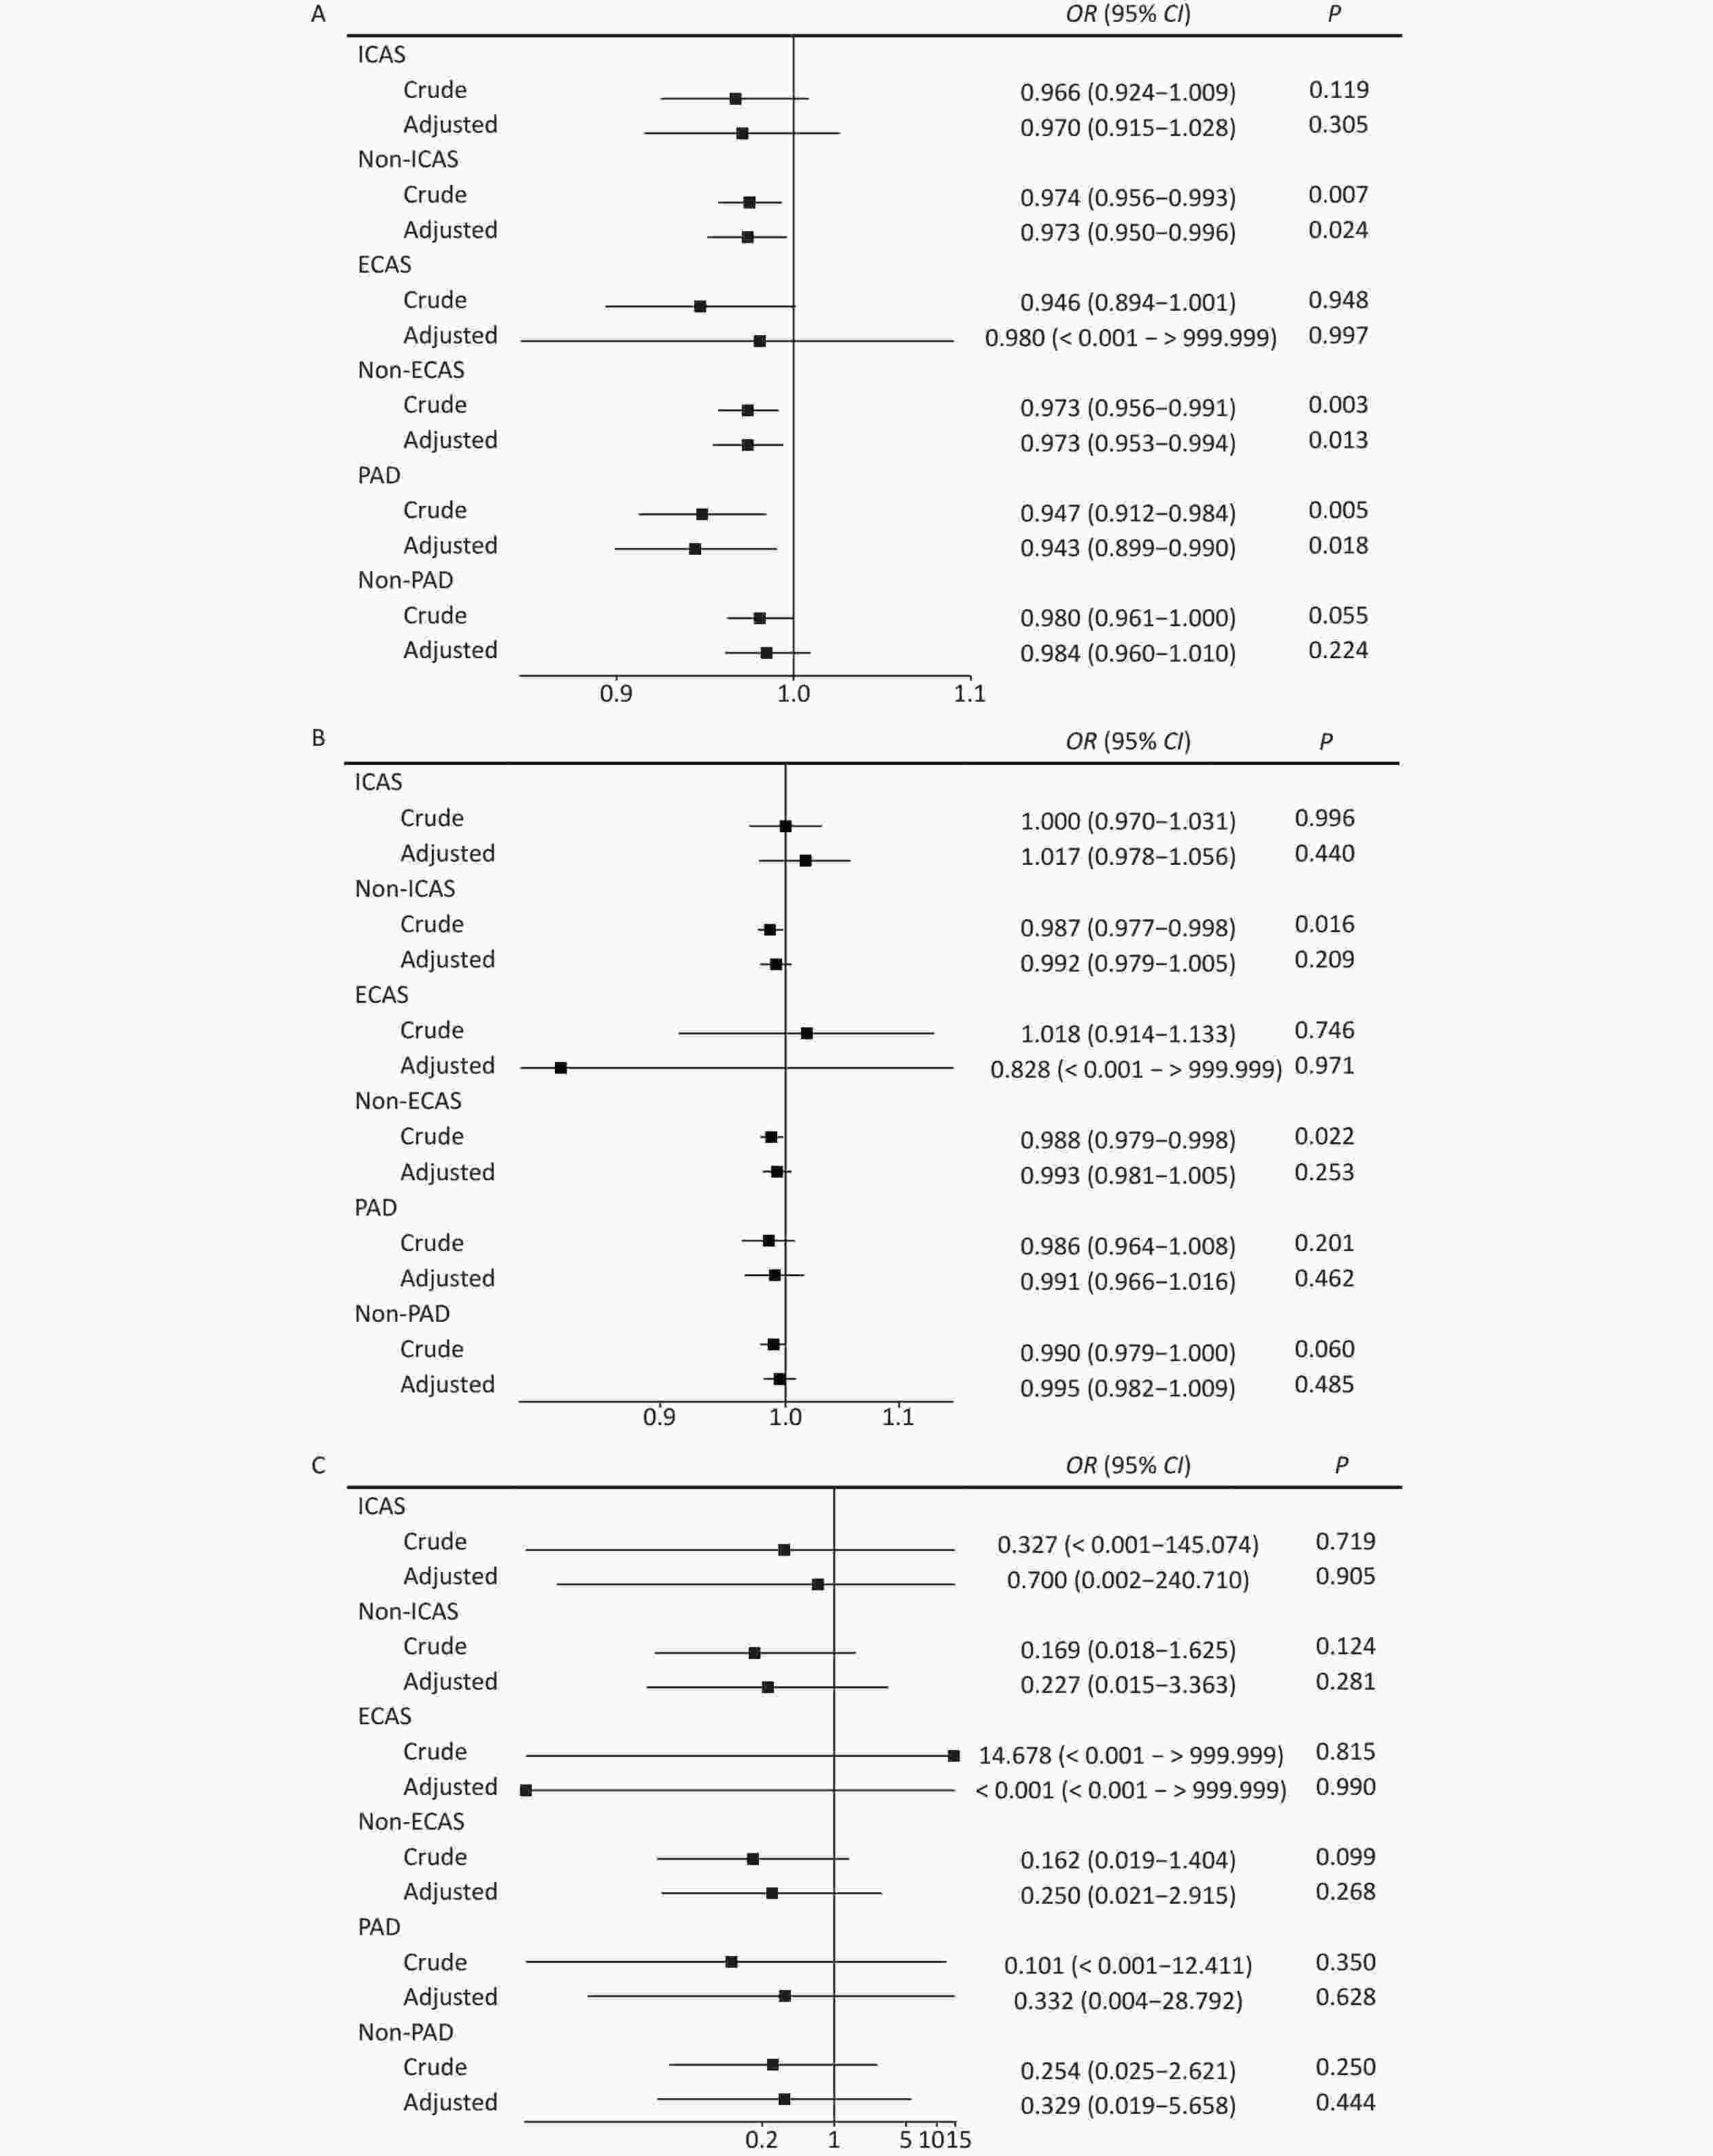
Figure 2. Subgroup analysis between cognitive impairment and retinal metrics based on polyvascular status.
-
The current study is the first to compare RNFL, CRAE, and AVR with cognitive function grouped according to polyvascular status in a community. Our data showed that patients with CI may have a thinner RNFL and narrower CRAE. This was especially apparent for RNFL in patients with non-large vessel stenosis and peripheral artery disease.
Previous studies have reported that changes in the retinal artery and RNFL correlate with many neurological disorders. For example, retinal microvascular abnormalities, such as a narrower CRAE, focal arteriolar narrowing, or RNFL defects, were associated with the occurrence of stroke[24,25], and a significant change was seen in peripapillary RNFL and the macular ganglion cell layer and inner plexiform layer in multiple sclerosis patients[26]. Patients with Parkinson’s disease (PD) may also suffer from visual symptoms, with significant thinning of the inner retinal layers[27]. A thinner RNFL has also been observed in PD and CI patients[28]. In addition, there is evidence that a thinner RNFL thickness is related to a decreased retinal vessel caliber[29]. In healthy older adults, thinner retinal structures, including macular thickness and macular ganglion cell complex, are found to be associated with smaller brain volumes, such as atrophy of the hippocampus and grey and white matter[30]. Similar to previous studies[6,7,31], we showed that CI patients had a thin RNFL and narrow CRAE. However, conflicting results also have been reported in some patients with CI. Snyder reported a selective trend of volume increase in the inner plexiform layer of the retina in Aβ+ participants[23], while Kreeke showed no difference in OCT measurements between patients with and without preclinical Alzheimer disease (AD)[32]. A systematic review and meta-analysis conducted by Ge also reported that patients with AD or mild CI had a thinner RNFL, total macular, and subfoveal choroid compared to healthy people[33]. These contradictory results indicate that further studies are required to investigate the specific pathogenesis for retinal metrics and CI changes.
The pathogenesis varies among AD, Lewy bodies-related dementia, frontotemporal dementia, and vascular dementia[34,35]. The relationship between neurovascular dysfunction and dementia was described several decades ago. In addition to dementia associated with an acute cerebrovascular disease, small vessel narrowing in the brain may also result in hypoperfusion and tissue atrophy, thereby causing dementia. The underlying molecular mechanisms include hypoxia, changes in the permeability of the blood-brain barrier, and altered neurovascular unit regulation of microcirculation integrity[36]. Prolonged vasculotoxicity and neurotoxicity may promote neurodegeneration and amyloid deposition[34,37]. The internal carotid artery (ICA) is an important large vessel that supplies blood to the brain and central nervous system. The retina receives blood from the central retinal arteriole, a small secondary branch of the ICA. A change in CRAE or vessel density observed in OCT angiography may directly reflect a small vessel abnormality. These small vessel abnormalities may develop trans-synaptic axonal retrograde lesions causing CI[38]. In recent years, researchers have shown that an OCT angiography abnormality is indeed associated with AD or preclinical AD. This indicates that a small vascular change in the retinal artery may predict the occurrence and progression of CI[39,40]. This hypothesis is consistent with our study outcome. Our community-based study of middle-aged participants without a history of stroke showed that the thickness of the RNFL is known to be strongly associated with microvasculature changes, was significantly thinner in CI participants than in non-CI participants. Most importantly, this difference existed in all the non-large vessel stenosis subgroups (non-ICAS, non-ECAS, and PAD subgroups) but not in the large vessel stenosis subgroups. We hypothesize that changes associated with a small vessel disease such as CRAE or RNFL may have occurred before the appearance of any large vessel disease or CI disease in preclinical dementia participants. Therefore, retinal screening and early intervention may avoid the development of some future neurological diseases.
Following are the potential limitations of our study. First, the participants in the APAC study were recruited from the Kailuan company in Tangshan City, which, despite its large sample size, was not fully representative of the Chinese population. Because the goal of our study was to assess the relationship between retinal metrics and cognitive function according to vascular status, regional and racial differences appeared less important for these metrics. Second, our study was of cross-sectional design, and therefore the results did not allow us to make longitudinal conclusions or explain pathogenesis based on a causal relationship between retinal metrics and cognitive function. Therefore, a long-term follow-up study is required to determine the predictive value and pathogenesis of these retinal metrics and small vessel changes on the occurrence and progression of CI. This follow-up study is currently in progress, and we look forward to the latest results of the cognitive functions in specific patient groups. Third, more accurate examinations were not available in our study. As the APAC is a community-based study, more accurate and expensive in-hospital examinations, such as brain MRI, OCT angiography, and other more specific cognition examinations, could not be performed on the participants, causing more detailed information on the brain, retinal microvascular changes, and cognitive domain to be overlooked. However, we believe that our findings showing a relationship between the retina and cognitive function may influence researchers to initiate more detailed studies.
-
Some retinal metrics vary in participants with different cognitive functions. A thin RNFL was associated with CI, especially in non ICAS, non ECAS, and PAD participants. The underlying small vessel changes in RNFL and CI require further investigation in the future.
-
The APAC study was performed in accordance with the guidelines of the Helsinki Declaration and was approved by the Ethics Committees of the Kailuan General Hospital, Beijing Tiantan Hospital (IRB no. 2010-014-01), and Beijing Tongren Hospital. Written informed consent was obtained from all the participants.
Relationship of Retinal Nerve Fiber Layer Thickness and Retinal Vessel Calibers with Cognitive Impairment in the Asymptomatic Polyvascular Abnormalities Population
doi: 10.3967/bes2024.020
Funds:
This study is supported by National Natural Science Foundation of China (No.82001239); and Beijing Hospitals Authority Innovation Studio of Young Staff Funding Support, code (NO.202112).
- Received Date: 2023-05-15
- Accepted Date: 2023-08-15
Abstract:
There is no competing interest in our study.
| Citation: | WANG Dan Dan, WANG An Xin, ZHANG Xiao Li, WEI Wen Bin, WU Shou Ling, ZHAO Xing Quan. Relationship of Retinal Nerve Fiber Layer Thickness and Retinal Vessel Calibers with Cognitive Impairment in the Asymptomatic Polyvascular Abnormalities Population[J]. Biomedical and Environmental Sciences, 2024, 37(2): 196-203. doi: 10.3967/bes2024.020

|

 Quick Links
 DownLoad: