


-
Iodine is an essential trace element for the synthesis of thyroid hormones. Iodine status is particularly important in pregnant and lactating women because iodine deficiency disorders (IDD) affect fetuses in utero and infants through breastfeeding, which may lead to impaired neurological development[1]. However, the high prevalence of thyroid dysfunction caused by excess iodine has become a problem in recent years[2]. Therefore, adequate iodine nutrition is critical for susceptible populations, including pregnant and lactating women, as well as infants, who have a higher iodine demand.
According to the 2014 monitoring data on IDD in China, the overall level of urinary iodine in the eastern region was lower than that in the central and western regions[3]. Hebei, Zhejiang, and Guangxi in eastern China were historical areas with cretinism and low iodized salt coverage rates[4]. We previously assessed the iodine nutritional status among school-age children in the three representative provinces, which showed that the overall median urinary iodine concentration (MUIC) of children aged 8−10 years was 164.60 µg/L[5]. Although a study from Guangxi Province in China demonstrated that the MUIC of lactating women was at an appropriate level[6], a recent survey from 13 provinces and municipalities in China showed that the dietary iodine intake of lactating women was much lower than the recommended levels[7]. Meanwhile, considering that the World Health Organization recommends exclusive breastfeeding for the first six months of life and continued breastfeeding for two years and beyond[8], the mother’s iodine status during the two years after giving birth has also been monitored in China. However, no studies have investigated iodine status in this population.
In developing countries, vitamin A (VA) status in lactating women is often not optimal[9]. Limited studies have found that pregnant and/or lactating women in Asia and the Middle East have a high risk of vitamin D (VD) deficiency[10]. As VA deficiency has multiple effects on the pituitary-thyroid axis, studies have indicated that concurrent VA supplementation with iodized salt could improve iodine efficacy in children with IDD and VA deficiency[11]. VD can also affect the immune system, and its deficiency is associated with Hashimoto’s thyroiditis[12]. For example, a significant association between VD deficiency and a high prevalence of thyroid autoimmunity and dysfunction was found in Korean participants with excessive iodine intake[13]. Our previous study showed that the iodine nutritional status of children and adolescents is related to VA and VD[5]. We believe that it is also necessary to analyze the relationship between iodine nutritional status and VA/VD in postpartum women.
The MUIC in adults has been shown to gradually decrease with age[14], and obese patients may be at a risk of iodine deficiency[15]. Moreover, the UIC in breastfeeding women is lower than that in non-breastfeeding women because circulating iodine is excreted in both urine and breast milk[16]. At present, no studies on the relationship between iodine nutrition and other factors [including vitamins, region, age, body mass index (BMI), and lactation] have been conducted in postpartum Chinese women. Therefore, this study aimed to investigate the iodine and thyroid-stimulating hormone (TSH) statuses of this population and analyze the related factors to provide a reference for iodine nutrition monitoring in mothers and their newborns.
-
Data were collected from the 2016–2017 National Nutrition and Health Surveillance of Children and Lactating Women, a large-scale cross-sectional survey. Three provinces in eastern China including Hebei Province in the north, Guangxi Province in the south, and Zhejiang Province on the east coast were selected. Postpartum women were sampled[17,18]. The inclusion criteria were as follows: i) breastfeeding after this delivery, ii) no chronic diseases, and iii) no thyroid disease or use of thyroid drugs. Participants were selected using a multi-stage stratified cluster randomization sampling method. The national sample size was calculated based on the rate of anemia in lactating mothers in 2013. The formula is as follows:
$$ N=\frac{u^{2} p\;(1-p)}{(r \times p)^{2}} \times {deff} $$ (1) N, number of samples; deff (design effect) = 2.0; p (anemia rate) = 9.3%; r (relative standard error) = 11%; confidence level (bilateral, CI) = 95%; u = 1.96. There were four types of areas (large cities, small cities, ordinary rural areas, and poor rural areas) in each province, and the non-response rate was 10%. The sample size was approximately 27,500 (covering 275 districts and counties). Moreover, according to the proportion (32.9%) of UIC < 100 µg/L among lactating women in Guangxi, the calculated sample size was 314[6]. A total of 100 participants from each district or county were included. Four types of areas were selected from each district and county. At least 25 mothers were randomly selected from each area. Finally, 1,500 mothers were included in the three provinces (containing five districts or counties in each province with non-high water iodine). In this study, the area types were divided into urban (including large and small cities) and rural (including ordinary and poor rural areas). Participants with missing BMI, UIC, thyroid-stimulating hormone (TSH) level, VA, or VD measurements were excluded. Participants with other missing pertinent covariates (such as age and region) were excluded. Data from 1,311 participants were included in the analysis. Written informed consent was obtained from all the participants. This study was approved by the Ethical Review Committee of the Chinese Centre for Disease Control and Prevention (No. 201614, 3 June 2016), and all documentation and procedures complied with the ethical standards of the committee.
-
Inquiry surveys, anthropometric measurements, and blood and urine sample collection were performed intensively in the community or village at the time of delivery.
Height (cm) and weight (kg) were measured directly by trained interviewers who followed standard protocols similar to the National Health and Nutrition Examination Survey (NHANES) protocol. Height and weight were measured to the nearest 0.1 cm and 0.1 kg respectively without shoes and wearing light clothing only. The BMI was calculated as kilograms divided by height in square meters (kg/m2).
Blood and urine samples were analyzed in laboratories at the provincial level. All laboratories had to pass the National Reference Laboratory examination of the Chinese Center for Disease Control and Prevention. A random spot midstream urine sample was collected in the morning between 08:30 and 12:00 (approximately 8−10 mL) from all participants. After collection, the urine samples were stored in polyethylene plastic tubes and sealed tightly to prevent evaporation. Samples should avoid contact with iodized articles during transportation and be stored at −20 °C until analysis. The UIC was measured using arsenic and cerium catalysis spectrophotometry after digestion in ammonium sulfate solution (WS/T 107.1-2016). Blood samples (6 mL) were collected from the cubital veins of the mothers and stored in gel vacuum tubes. Blood samples were centrifuged at 3,000 rpm for 10 min at room temperature as soon as possible. Serum was stored in a frozen plastic tube made of 99.9% biological-grade polypropylene. If not tested immediately, the serum samples were subsequently frozen at −80 °C until analysis. TSH levels were determined using an automated chemiluminescence immunoassay analyzer (Roche, Germany). High-performance liquid chromatography was used to determine serum VA (retinol) concentration (WS/T 553-2017). The VD [25(OH)D] levels were determined using liquid chromatography-mass spectrometry (WS/T 677-2020).
All the reference ranges of the included parameters are shown in Table 1.
Parameter Reference range Identification BMI (kg/m2)[19,20] < 18.5
18.5 to < 24
24.0 to < 28
≥ 28Underweight
Normal weight
Overweight
ObeseMUIC (μg/L)[21,22] 100−299 and proportion of < 50 was ≤ 20% Adequate iodine intake TSH (mIU/L, Roche Kit) < 0.27 Subclinical hyperthyroidism or hyperthyroidism 0.27 to < 4.20 Normal ≥ 4.20 Subclinical hypothyroidism or hypothyroidism VA (µg/mL) < 0.2
0.2 to < 0.3
≥ 0.3Deficiency
Marginal deficiency
SufficiencyVD (nmol/L) < 30
30 to < 50
≥ 50Deficiency
Insufficiency
SufficiencyNote. MUIC: median urinary iodine concentration, TSH: thyroid-stimulating hormone, BMI: body mass index, VA: vitamin A, VD: vitamin D. Table 1. Reference range of related parameters
-
Data processing and statistical analyses were performed using the IBM SPSS Statistics 23 software. The Kolmogorov–Smirnov (KS) test was used for normality testing. If the indicator was not normally distributed, it was expressed as the median and P25−P75. 95% confidence interval (CI) of UIC was also used to test whether a statistical difference existed between the relevant cut-off point (100 μg/L) and the MUIC, just as the 2018 Guidance on the Monitoring of Salt Iodization Programmes and Determination of Population Iodine Status recommended[21]. Nonparametric statistical tests were used to compare age, BMI, UIC, TSH, VA, and VD among the groups (region, area type, lactation, age, BMI, VA, and VD groups). A two-way ANOVA was performed to analyze the interaction effect. Chi-square tests were used to compare differences in categorical variables. A generalized linear model of the relationship between the UIC and possible factors (including VA and VD) was established. Potential confounders, including region, area type, parity, lactation, age (continuous), and BMI (continuous), were introduced as covariates in the adjusted models. Data were considered statistically significant at P < 0.05.
-
The participants’ characteristics are presented in Table 2. The median age and BMI of the participants were 30.04 (P25−P75: 27.15−34.23) years and 22.78 (P25−P75: 20.65−25.41) kg/m2, respectively. The median UIC, TSH, VA, and VD were 142.00 (P25−P75: 99.10−209.40) μg/L, 1.89 (P25−P75: 1.32−2.59) mIU/L, 0.44 (P25−P75: 0.36−0.53) μg/mL, and 24.04 (P25−P75: 18.20−29.00) ng/mL, respectively. The BMI in Hebei was higher than that in the other two provinces (P < 0.05). More than half of the mothers had two children, and 68.34% were still breastfeeding at that time. The MUICs of the total population and the different provinces were all within the normal range. UIC (median: 166.10, P25−P75: 116.25−228.95, μg/L) and TSH (median: 2.11, P25−P75: 1.48–2.87, mIU/L) in Hebei were the highest (P < 0.05), while 25(OH)D (median: 17.20, P25−P75: 13.70−21.82, ng/mL) levels was the lowest (P < 0.05), with an average level less than 20 ng/mL. Moreover, the UIC and retinol levels were significantly different in each province (P < 0.05).
Characteristics Hebei (n = 493) Zhejiang (n = 429) Guangxi (n = 389) Total (n = 1,311) Rural, n (%) 289 (60.45) 244 (56.88) 172 (44.22)* 714 (54.46) Parity, n (%) 1 185 (37.53) 170 (39.63) 119 (30.59) 474 (36.16) 2 293 (59.43) 247 (57.58) 239 (61.44) 779 (59.42) ≥ 3 15 (3.04) 12 (2.79) 31 (7.97) 58 (4.42) In lactation, n (%) Yes 382 (77.48) 262 (61.07) 252 (64.78) 896 (68.34) No 111 (22.52) 167 (38.93) 137 (35.22) 415 (31.66) Age (years) 30.00 (27.00–33.00) 31.07 (28.19–35.94) * 30.25 (26.99–33.84) 30.04 (27.15–34.23) BMI (kg/m2) 23.82 (21.61–26.31) * 22.29 (20.44–24.92) 22.03 (20.17–24.51) 22.78 (20.65–25.41) UIC (μg/L) 166.10 (116.30–228.60) * 123.58 (86.53–184.42) * 139.40 (90.90–205.20) * 142.00 (99.10–209.40) TSH (mIU/L) 2.11 (1.48–2.87) * 1.72 (1.21–2.34) 1.86 (1.24–2.50) 1.89 (1.32–2.59) Retinol (μg/mL) 0.43 (0.37–0.54) * 0.36 (0.30–0.45) * 0.51 (0.44–0.59) * 0.44 (0.36–0.53) 25(OH)D (ng/mL) 17.20 (13.70–21.82) * 28.26 (23.39–34.14) 26.40 (23.40–30.20) 24.04 (18.20–29.00) Note. BMI: body mass index, UIC: urinary iodine concentration, TSH: thyroid-stimulating hormone, 25(OH)D: 25-hydroxyvitamin D. *Compared to the other two provinces, P < 0.05. Data were represented as n (%) or median (P25−P75). Table 2. Characteristics of Chinese mothers from three different regions
-
As shown in Table 3, the MUICs of total mothers, mothers in lactation, and mothers not in lactation were 142.00 (95% CI: 40.74−358.97) μg/L, 139.95 (95% CI: 41.47−350.42) μg/L, and 148.69 (95% CI: 35.10−382.08) μg/L, respectively. No significant differences in UIC were found between breastfeeding and non-breastfeeding mothers. The proportion of UIC values < 50 μg/L was 5.03%. Mothers from the three provinces had no iodine deficiency. Zhejiang had the lowest UIC and highest rate of < 50 μg/L (123.58 μg/L and 6.99%, respectively), while Hebei was in the opposite. The MUIC in rural areas was higher than that in urban areas (P < 0.05). As differences in the proportions of urban and rural populations existed among the three provinces, we further analyzed whether the relationship between region and UIC was affected by area type using a two-way ANOVA model. The results showed an interaction effect between region and area type (data not shown). There was no significant difference in UIC among different age groups (P > 0.05), but the highest rate of UIC < 50 μg/L was found in the 18−< 25 years group. MUIC was highest among obese mothers (P < 0.05). There was no significant difference in the UIC among the different VA subgroups (P > 0.05); however, the UIC seemed to be lower in the VA deficiency group than that in the other two groups. In contrast, MUIC was highest in the VD deficiency group (P < 0.05).
Factors N (%) MUIC (95% CI), μg/L UIC < 50 μg/L, N (%) Region Hebei 493 (37.61) 166.10 (48.88−336.18)a, b 13 (2.64) Zhejiang 429 (32.72) 123.58 (32.41−399.95)c 30 (6.99) Guangxi 389 (29.67) 139.40 (39.48−419.55) 23 (5.91) Area type Rural 714 (54.46) 159.80 (46.54−377.42)d 23 (3.22) Urban 597 (45.54) 125.30 (34.03−342.88) 43 (7.20) Parity 1 474 (36.16) 138.95 (34.65−359.11) 30 (6.33) 2 779 (59.42) 143.54 (43.40−365.55) 33 (4.24) ≥ 3 58 (4.42) 146.75 (32.26−358.34) 3 (5.17) In lactation Yes 896 (68.34) 139.95 (41.47−350.42) 46 (5.13) No 415 (31.66) 148.69 (35.10−382.08) 20 (4.82) Age (years) 18− 129 (9.84) 142.00 (33.28−411.05) 14 (10.85) 25− 883 (67.35) 146.00 (38.32−355.14) 45 (5.10) ≥ 35 299 (22.81) 136.13 (49.69−368.02) 7 (2.34) BMI Underweight 89 (6.79) 152.14 (34.78−478.78) 6 (6.74) Normal weight 725 (55.30) 140.90 (37.56−405.25) 39 (5.38) Overweight 335 (25.55) 131.30 (44.37−355.34) 14 (4.18) Obesity 162 (12.36) 169.55 (43.22−335.92)e 7 (4.32) TSH (mIU/L) < 0.27 30 (2.29) 178.65 (75.13−303.35) 0 (0.00) 0.27−4.20 1197 (91.30) 141.16 (39.34−369.92) 65 (5.43) > 4.20 84 (6.41) 160.57 (51.44−287.15) 1 (1.19) VA Deficiency 17 (1.30) 119.34 (66.98−249.44) 0 (0.00) Marginal deficiency 129 (9.84) 140.02 (30.60−497.44) 8 (6.20) Sufficiency 1165 (88.86) 142.40 (40.88−355.12) 58 (4.98) VD Deficiency 78 (5.95) 175.10 (41.48−341.40)f 2 (2.56) Insufficiency 340 (25.93) 159.30 (42.22−329.64)g 16 (4.71) Sufficiency 893 (68.12) 133.86 (37.49−389.36) 48 (5.37) Total 1311 (100.00) 142.00(40.74−358.97) 66 (5.03) Note. MUIC: median urinary iodine concentration, BMI: body mass index, VA: vitamin A, VD: vitamin D. a: Hebei vs. Zhejiang; b: Hebei vs. Guangxi; c: Zhejiang vs. Guangxi; d: Rural vs. Urban; e: Overweight vs. Obesity; f: Deficiency vs. Sufficiency; g: Insufficiency vs. Sufficiency. Statistical significance was set at P < 0.05. Table 3. Distributions of UIC among Chinese mothers
-
Table 4 shows that the median TSH levels of the mothers were within the reference range and the overall TSH exceedance rate was only 6.41%. There were no significant differences in TSH levels among the different area types, parity, lactation, age, and VA or UIC groups (P > 0.05). The TSH level was the highest in Hebei (median: 2.11 mIU/L). In addition, we found that BMI was associated with the distribution of TSH, and overweight and obese mothers had the highest rates of subclinical hypothyroidism or hypothyroidism (P < 0.05). Moreover, TSH levels in the VD deficiency and insufficiency groups were higher than those in the sufficiency group (P < 0.05). However, no U-shaped relationship was observed between TSH levels and UIC.
Factors N Median (P25–P75), mIU/L Frequency Distribution (%) Per TSH Range, mIU/L < 0.27 0.27–< 4.20 ≥ 4.20 P Region 0.072 Hebei 493 (37.61) 2.11(1.48−2.87)a, b 13 (2.64) 437 (88.64) 43 (8.72) Zhejiang 429 (32.72) 1.72 (1.21−2.34) 11 (2.56) 397 (92.54) 21 (4.90) Guangxi 389 (29.67) 1.86 (1.24−2.50) 6 (1.54) 363 (93.32) 20 (5.14) Area type 0.053 Rural 714 (54.46) 1.89 (1.32−2.66) 18 (2.52) 640 (89.64) 56 (7.84) Urban 597(45.54) 1.89( 1.32−2.58) 12 (2.01) 557 (93.30) 28 (4.69) Parity (%) 0.612 1 474 (36.16) 1.92 (1.33−2.68) 10 (2.11) 430 (90.72) 34 (7.17) 2 779 (59.42) 1.87 (1.30−2.54) 19 (2.44) 716 (91.91) 44 (5.65) ≥ 3 58 (4.42) 1.96 (1.47−2.82) 1 (1.72) 51 (87.93) 6 (10.34) In lactation 0.449 Yes 896 (68.34) 1.88 (1.34−2.59) 23 (2.57) 819 (91.41) 54 (6.03) No 415 (31.66) 1.90 (1.29−2.66) 7 (1.69) 378 (91.08) 30 (7.23) Age (years) 0.910 18 to < 25 129 (9.84) 1.88 (1.30−2.66) 3 (2.33) 117 (90.70) 9 (6.98) 25 to < 35 883 (67.35) 1.86 (1.31−2.59) 19 (2.15) 805 (91.17) 59 (6.68) ≥ 35 299 (22.81) 1.96 (1.41−2.59) 8 (2.68) 275 (91.97) 16 (5.35) BMI 0.001 Underweight 89 (6.79) 2.07 (1.31−2.72) 0 (0.00) 88 (98.88)# 1 (1.12) Normal weight 725 (55.30) 1.86 (1.32−2.53) 16 (2.21) 672 (92.69) 37 (5.10) Overweight 335 (25.55) 1.92 (1.31−2.77) 12 (3.58) 292 (87.16) 31 (9.25)# Obesity 162 (12.36) 1.98 (1.27−2.66) 2 (1.23) 145 (89.51) 15 (9.26)# VA 0.073 Deficiency 17 (1.30) 1.57 (1.18−2.42) 1 (5.88) 16 (94.12) 0 (0.00) Marginal deficiency 129 (9.84) 1.71 (1.24−2.46) 2 (1.55) 124 (96.12) 3 (2.33) Sufficiency 1,165 (88.86) 1.91 (1.34−2.65) 27 (2.32) 1,057 (90.73) 81 (6.95) VD 0.580 Deficiency 78 (5.95) 2.14 (1.50−2.88)c 1 (1.28) 72 (92.31) 5 (6.41) Insufficiency 340 (25.93) 2.09 (1.47−2.81)d 6 (1.76) 307 (90.29) 27 (7.94) Sufficiency 893 (68.12) 1.80 (1.26−2.50) 23 (2.58) 818 (91.60) 52 (5.82) UIC (μg/L) 0.324 < 100 332 (25.32) 1.80 (1.31−2.36) 7 (2.11) 309 (93.07) 16 (4.82) 100 to < 150 366 (27.92) 1.81 (1.26−2.56) 5 (1.39) 338 (92.35) 23 (6.28) 150 to < 200 252 (19.22) 1.94 (1.44−2.73) 7 (2.78) 224 (88.89) 21 (8.33) 200 to < 250 176 (13.42) 2.04 (1.36−2.86) 7 (3.98) 154 (87.50) 15 (8.52) ≥ 250 185 (14.11) 2.05 (1.34−2.75) 4 (2.16) 172 (92.97) 9 (4.86) Total 1,311 (100.00) 1.89 (1.32−2.59) 30 (2.29) 1,197 (91.30) 84 (6.41) Note. UIC: urinary iodine concentration, TSH: thyroid−stimulating hormone, BMI: body mass index, VA: vitamin A, VD: vitamin Da: Hebei vs. Zhejiang; b: Hebei vs. Guangxi; c,: Deficiency vs. Sufficiency; d: Insufficiency vs. Sufficiency; #: group differences. Statistical significance was set at P < 0.05. Table 4. TSH concentrations and distributions among mothers in the three provinces
-
The generalized linear model analysis showed that UIC was marginally positively correlated with total VA (β = 28.713, P = 0.053), but negatively correlated with total VD (β = −0.930, P = 0.002). After adjusting for variables including region, area type, parity, lactation, age, and BMI, UIC was not correlated with total VA (β = 26.977, P = 0.095) or total VD (β = −0.032, P = 0.930). Generalized linear model analysis also indicated that UIC was not correlated with the nutritional status of VA after stratification, with or without adjustment for covariates (P > 0.05). UICs in the VD insufficient group and deficient group were higher than that in sufficient group (βinsufficiency = 15.503, P = 0.005; βdeficiency = 26.999, P = 0.008) when the covariates were not adjusted. After adjusting for covariates, the UIC was no longer associated with the VD nutritional status (P > 0.05) (Table 5).
Factors UIC β (95% CI) SE P VA-Model 1 Total 28.713 (−0.418 to 57.843) 14.863 0.053 Deficiency −21.243 (−62.504 to 20.018) 21.052 0.313 Marginal deficiency 1.949 (−13.723 to 17.621) 7.996 0.807 Sufficiency 0 VA-Model 2 Total 26.977 (−4.730 to 58.683) 16.177 0.095 Deficiency −10.681 (−51.768 to 30.407) 20.963 0.610 Marginal deficiency 4.998 (−11.104 to 21.100) 8.215 0.543 Sufficiency 0 VD-Model 1 Total −0.930 (−1.505 to −0.355) 0.294 0.002 Deficiency 26.999 (7.149 to 46.849) 10.128 0.008 Insufficiency 15.503 (4.789 to 26.216) 5.466 0.005 Sufficiency 0 VD-Model 2 Total 0.032 (−0.685 to 0.750) 0.366 0.930 Deficiency 8.392 (−13.081 to 29.864) 10.956 0.444 Insufficiency 1.747 (−10.761 to 14.255) 6.382 0.784 Sufficiency 0 Note. UIC: urinary iodine concentration, VA: vitamin A, VD: vitamin D. Model 1: unadjusted;Model 2: adjusted for region, area type, parity, lactating or not, age, and BMI. Statistical significance was set at P < 0.05. Table 5. Association between UIC and VA/VD nutritional status
The same methods listed in Table 5 were used to analyze the linear relationship between TSH and iodine, VA, and VD nutritional status. The results showed that TSH levels did not correlate with the UIC, VA, or VD concentrations (P > 0.05). The nutritional status of iodine, VA, and VD was not related to TSH with or without adjustment for confounders (P > 0.05) (data not shown).
-
We analyzed the relationship between UIC and TSH under different vitamin A/D nutritional conditions, which could further describe the interactive effects of VA or VD status and iodine status on TSH levels and abnormalities. The median TSH level in each group was within the normal range. Participants with higher UIC and VD deficiencies also had higher TSH levels, although the difference was not statistically significant. No statistically significant VD-iodine interactive effects on TSH abnormalities were observed (Figure 1B and 1D). Moreover, no interactions between VA and iodine contributed to TSH levels or abnormalities (P > 0.05) (Figure 1A and 1C).
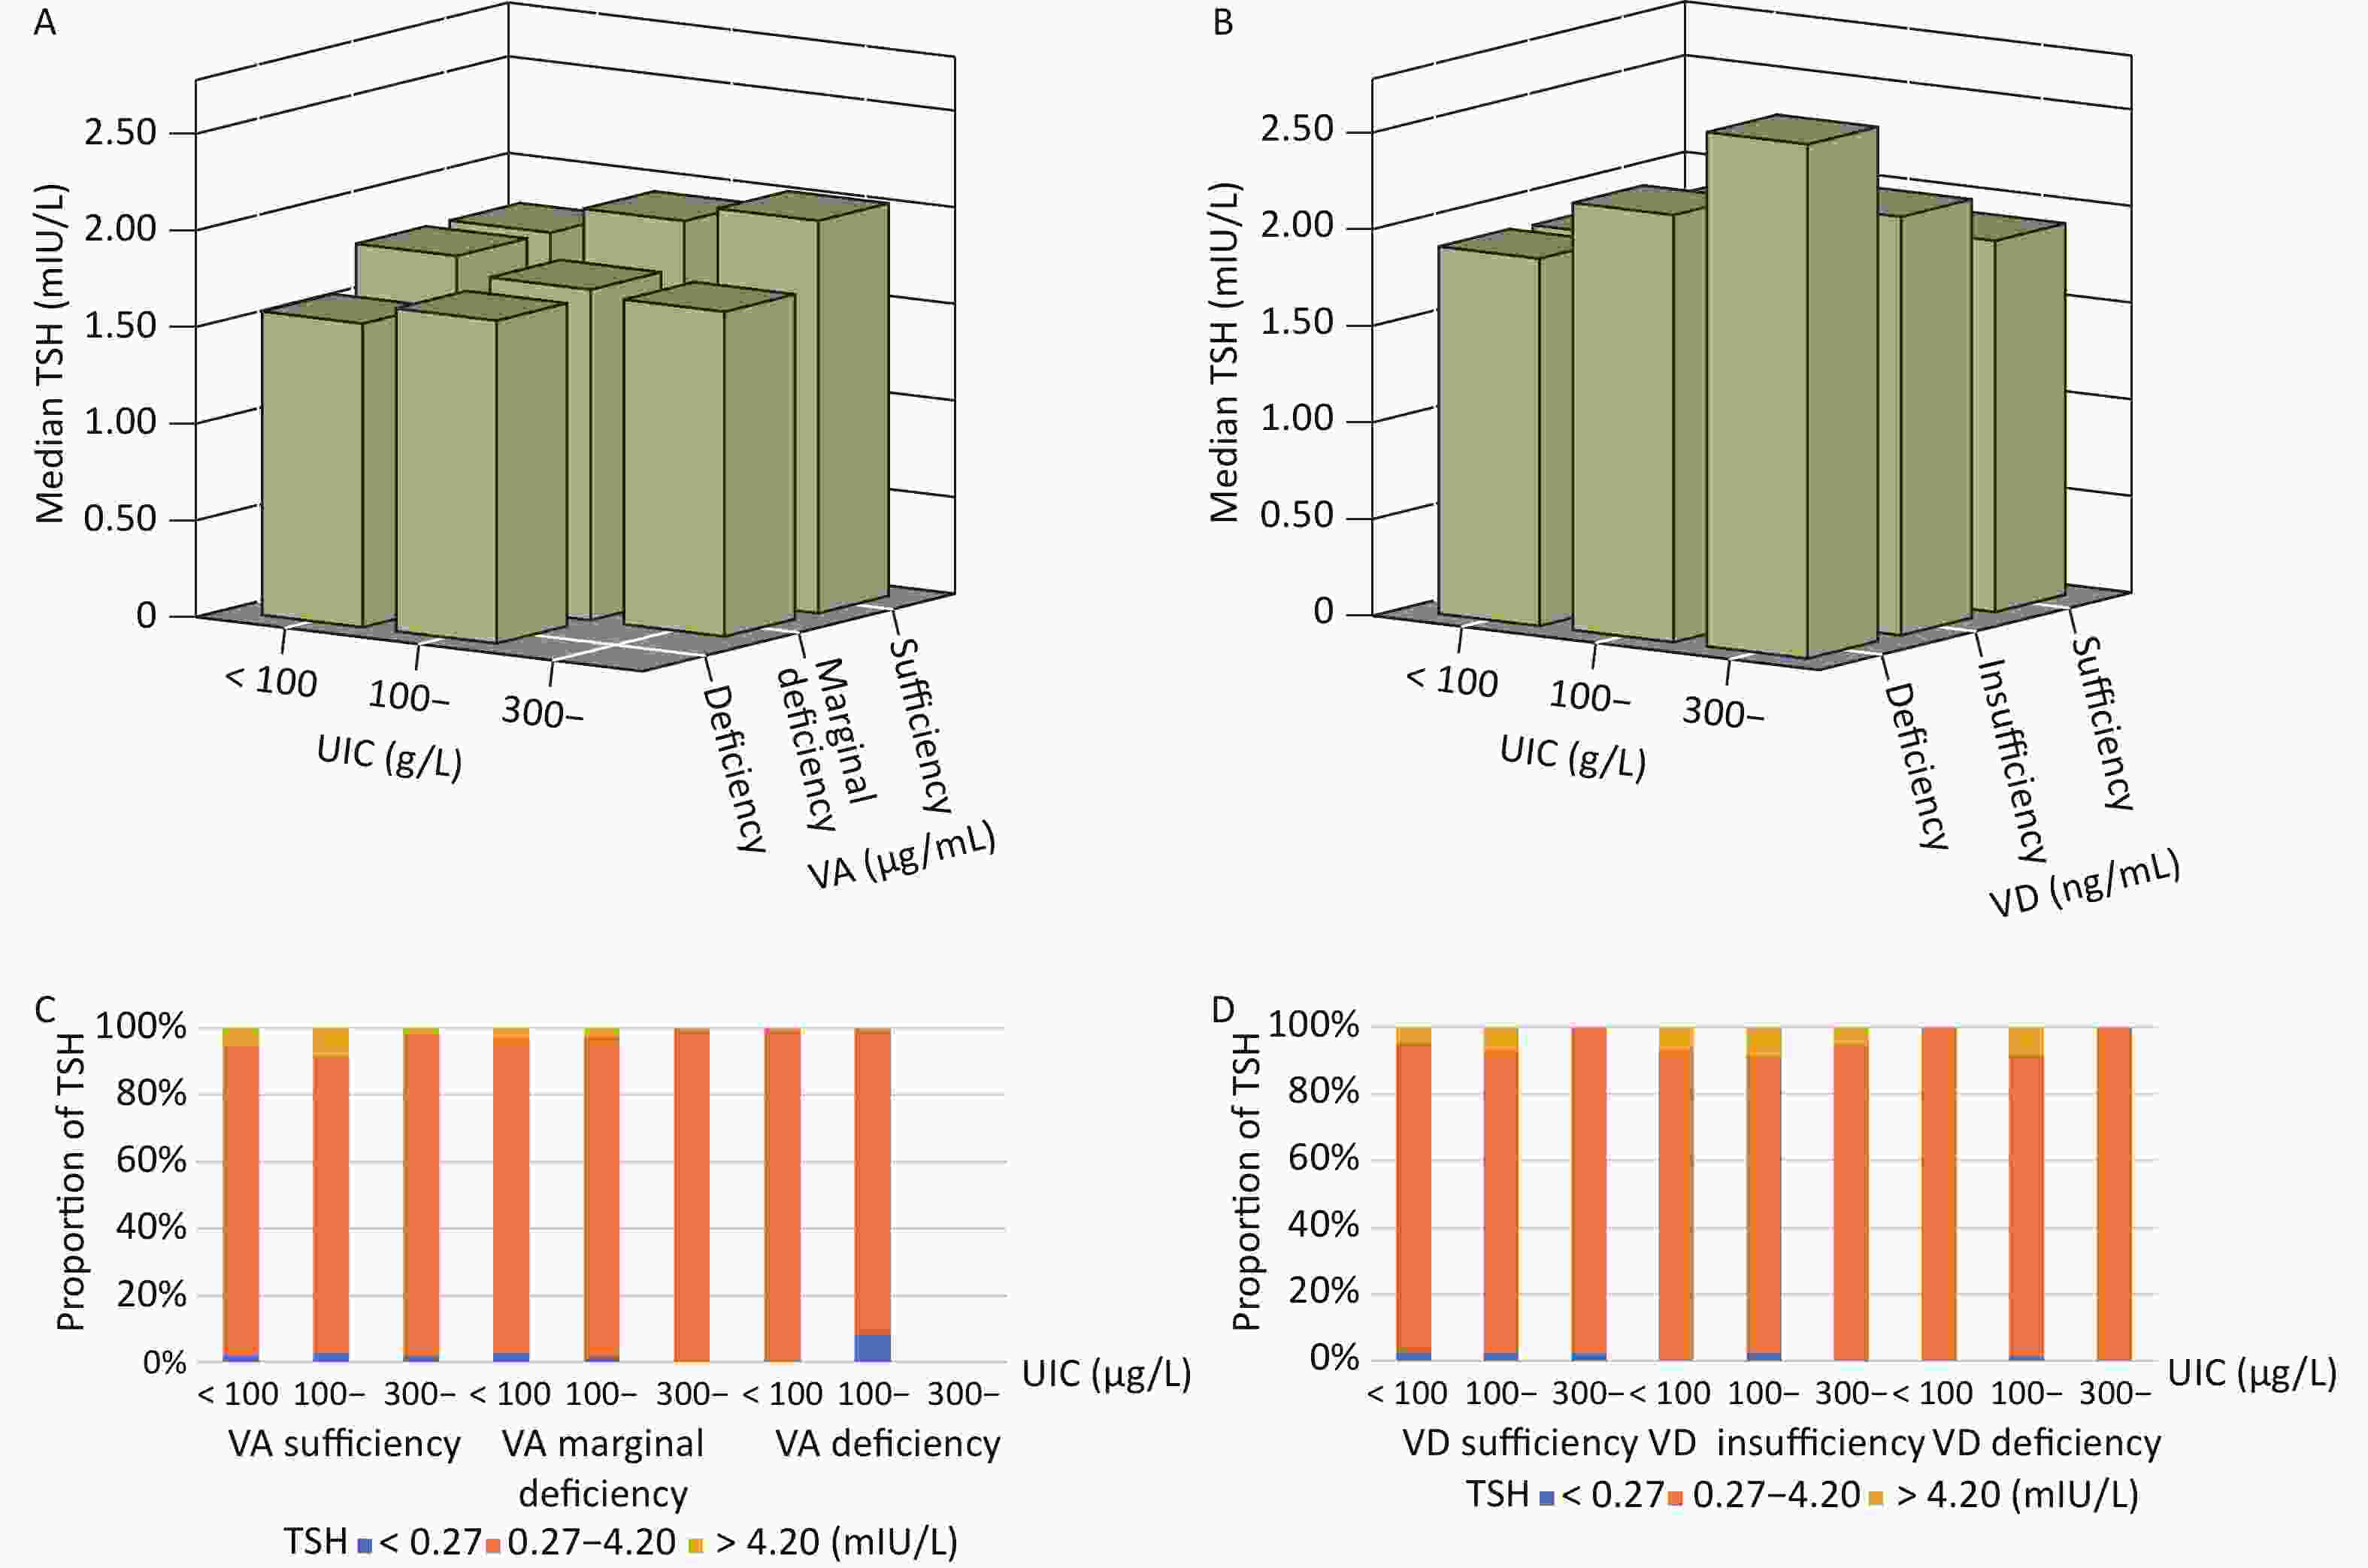
Figure 1. Concentrations and distribution of TSH in each UIC group under different VA/VD status.
-
To our knowledge, this is the first study to analyze the relationship between iodine status and VA/VD nutrition in postpartum women. This population had no iodine deficiency. However, the UIC, TSH, VA, and VD differed among the three provinces. UIC was associated with area type, BMI, and VD status, whereas TSH levels were associated with VD status and BMI. After adjustment, UIC and TSH levels did not correlate with VA or VD concentrations.
As IDD remains a global public health problem, the evaluation of the iodine nutritional status of each population remains important. 24 hours of urinary iodine excretion (24-h UIE) is considered the most reliable measurement for assessing iodine intake. However, it was difficult to obtain 24-h urine samples in our large-scale epidemiological study. Another indicator, the urinary iodine-to-creatinine ratio (UI/Cr), approximates the value of 24-h UIE and minimizes UIC variations caused by differences in urine volume and dilution. However, creatinine secretion can be affected by several factors including race, sex, and age[23]. The MUIC of spot urine samples is recommended by the UNICEF as an indicator for assessing the population’s iodine status[21] and is widely used in children[24], adults[25], pregnant[26], and lactating women[27]. Therefore, in this study, we analyzed the iodine nutritional status of mothers with MUIC.
According to the 2018 Guidance on the Monitoring of Salt Iodization Programmes and Determination of Population Iodine Status, a MUIC in the range of 100−299 μg/L identifies a population that has no iodine deficiency[21]. As the World Health Organization (WHO)/United Nations International Children’s Emergency Fund (UNICEF)/International Council for Control of Iodine Deficiency Disorders (ICCIDD) Guide for Programme Managers recommends, having no iodine deficiency requires that the proportion of the population with UIC < 50 μg/L should be not more than 20%[22]. In this study, the MUICs (P25−P75) of total mothers, breastfeeding mothers, and non-breastfeeding mothers were 142.00 µg/L, 139.95 µg/L, and 148.69 µg/L, respectively. And only 5.03% of mothers had UIC < 50 μg/L. Moreover, there was no difference in UIC between lactating and non-lactating mothers. The iodine status of lactating women was optimal and close to a study for lactating women in Guangxi, which showed appropriate MUIC (130 μg/L)[6], but much lower than that in suitable water iodine content areas in Shanxi Province (283.6 μg/L)[28]. Although these studies have shown that the iodine nutrition of lactating mothers is good, future nutritional monitoring should also focus on the thyroid function and neurological development of their offspring.
Since geographic influences on iodine status exist in pregnant and lactating women, neonates, and school-age children[29,30], and geographic locations with poor iodine status have been identified[21], we analyzed the UIC differences among the three representative provinces. The MUIC of the mothers in Zhejiang was the lowest, whereas that of the MUIC in Hebei was the highest. The result was consistent with the 2011 surveys for Zhejiang (198.00 μg/L)[31] and Hebei (216.90 μg/L)[32] populations (8-10 years old). We hypothesized that the geographical differences in iodine nutritional status might be related to the relatively low coverage of iodized salt in Zhejiang, particularly in its coastal areas[33]. In addition, the MUIC of rural mothers was higher than that of urban mothers, consistent with a previous study of participants aged between 10 and 15, 45 and 50, and 60 and 85 years from Zhejiang Province[34]. We hypothesized that dietary patterns, iodized salt intake, and health education may be major factors influencing the iodine nutritional status of rural and urban mothers. Furthermore, as young people (≥ 0 years old) were shown to have a higher UIC[34], we compared the UIC of different age groups. In this study, UIC was not statistically significant among the age groups, but we found that the younger group was more prone to having UIC < 50 μg/L. This was consistent with a study on lactating women from Taiwan, suggesting that iodine deficiency may continue to be present in pregnant women at younger ages, as they are less wealthy to consume enough iodine[35]. However, studies on the relationship between UIC and age are limited and further studies are warranted. In addition, studies have proved that iodine deficiency is associated with dyslipidemia and obesity. Iodine deficiency can accelerate lipolysis and fatty acid oxidation and increase plasma TSH levels without affecting thyroid hormone signals[36]. Our previous study on school-aged children confirmed this phenomenon[5]. However, obese mothers in this study showed higher MUIC, which was consistent with a Mexican study conducted in primary school children, which found a positive correlation between UIC and BMI, as well as the prevalence of overweight and obesity[37]. This may be related to the higher dietary iodine intake in overweight and obese populations. However, only a few discordant studies have analyzed the relationship between UIC and BMI in children, but not in breastfeeding or nonbreastfeeding mothers. In general, the tendency of UIC in different regions, ages, and BMI groups differed between school-age children and mothers, which might be related to differences in iodine demand, digestion, absorption, and metabolism between the two populations. Further studies are needed to better understand the impact of demographic characteristics on UIC.
In addition, it should be noted that the VA and VD needs increase during pregnancy and lactation to support the physiological changes, to prepare for delivery and breastfeeding, and to ensure normal fetus/baby development[38]. Generally, energy, macronutrient, and some micronutrient intake of lactating women in China can reach or exceed the recommended levels, but the intake of VD cannot meet these requirements[39]. The 2010-2013 China Health and Nutrition Survey (CHNS) reported that the average VA of lactating mothers was 1.56 ± 0.39 μmol/L (0.45 ± 0.11 μg/mL), and the prevalence of VA deficiency and marginal deficiency were 0.5% and 7.8%, respectively[40], which was close to that in our study. However, VD deficiency and insufficiency remained serious problems among mothers in our study, although it was better than the 2013 results, which showed a high prevalence of VD deficiency (25.2%) and insufficiency (45.4%) among lactating mothers[41]. To better analyze iodine status, we considered VA and VD. Unlike our previous study on children[5], mothers with sufficient VD tended to have a lower MUIC. However, after adjusting for region, area, parity, lactation, age, and BMI, no linear relationship was found between UIC and VD level or status. There was no significant association between UIC and VA. These results indicate that the existing evidence is insufficient to prove an independent correlation between VA/VD and UIC.
TSH, the most sensitive and specific marker of thyroid status[42], was measured in this study. More than 90% of the mothers were within the normal range. Hebei had the highest TSH concentration, and TSH distribution was related to BMI. VA has been shown to inhibit TSH secretion and synthesis[43]. TSH can be inversely influenced by VD, which plays an important role in the pathogenesis of thyroid autoimmunity[44]. Studies have also shown an interaction between the VA/VD and iodine deficiency in thyroid function[11,13]. We then analyzed whether TSH levels were influenced by UIC, VA, and VD status. Among postpartum women, we found that the TSH concentration was higher in the VD deficiency group, although the VA or VD nutritional status did not affect the distribution of TSH. Moreover, after adjusting for confounding factors, the association between TSH levels and VD disappeared. Inconsistent conclusions regarding the relationship between TSH levels and UIC have been reported. For example, a ‘U curve’ relationship between TSH and UIC had been reported in children[45] or an “approximately inverted” U-shaped relationship between TSH and UIC was found in another two studies from Liu, L. et al. and Meng, F. et al.[45,46]. However, no nonlinear correlation was observed between TSH levels and UIC in our study. We speculate that this may be because most mothers' TSHs levels were within the normal range. However, further studies are required to confirm this hypothesis. In addition, the VA/VD nutritional status did not affect TSH distribution in each UIC group, which warrants further verification.
In this study, we assessed the iodine nutritional status using MUIC and thyroid status using TSH in postpartum women. We further analyzed the possible effects of region, area type, age, BMI, parity, and lactation on the two indicators. VA and VD, important nutrients for health, were considered as well. We also considered the influence of confounding factors when analyzing the association between UIC (or TSH) and vitamins. However, several limitations of this study should be noted. i) The data on feeding patterns and the stage of the postpartum period were not detailed enough, which made it difficult to analyze the difference between complete breastfeeding and mixed breastfeeding mothers, as well as the influence of the postpartum period. ii) Other indicators such as free thyroxine (fT4), thyroid peroxidase antibodies (TPO-Ab), and thyroglobulin antibodies (TG-Ab) were not detected because of the limited blood samples available. iii) We did not evaluate the consistency of dietary iodine and urinary iodine due to lack of detailed dietary iodine data. Therefore, in the future, we should observe urinary and breast iodine concentrations, even 24-h UIE, in different postpartum periods and breastfeeding methods dynamically and continuously, and master the mechanisms of iodine metabolism during lactation to provide the basis for proper iodine supplementation in lactating women.
-
The iodine intake was adequate for postpartum women in the study area. However, enhanced monitoring of the iodine status using more suitable measures is warranted. Moreover, the UIC and TSH levels were notably associated with region, age, BMI, VA, and VD. These findings provide an important basis for improving iodine nutritional evaluation and surveillance in China.
Iodine Nutrition, Thyroid-stimulating Hormone, and Related Factors of Postpartum Women from three Different Areas in China: A Cross-sectional Survey
doi: 10.3967/bes2024.029
Funds:
This work was funded by the National Health Commission of People’s Republic of China Medical Reform Major Program ‘2016-2017 National Nutrition and Health Surveillance of Children and Lactating Women’, and Major Public Health Project ‘Survey and Evaluation of Iodine Nutrition and Thyroid Diseases of Chinese Population’ [131031107000160007].
- Received Date: 2023-04-20
- Accepted Date: 2023-10-11
-
Key words:
- Median urinary iodine concentration /
- Thyroid-stimulating hormone /
- Vitamin A /
- Vitamin D /
- Postpartum women
Abstract:
The authors declare that they have no conflict of interest.
| Citation: | SHAN Xiao Yun, ZOU Yan, HUANG Li Chun, JIANG Shan, ZHOU Wei Wen, QIN Qiu Lan, LIU Chang Qing, LUO Xiao Yan, LU Jia Xi, MAO De Qian, LI Min, YANG Zhen Yu, YANG Li Chen. Iodine Nutrition, Thyroid-stimulating Hormone, and Related Factors of Postpartum Women from three Different Areas in China: A Cross-sectional Survey[J]. Biomedical and Environmental Sciences, 2024, 37(3): 254-265. doi: 10.3967/bes2024.029

|

 Quick Links
 DownLoad: