

-
Chronic hepatitis B (CHB) is a severe public health problem worldwide that has resulted in a significant social burden. It is estimated that the global seropositivity rate of the hepatitis B surface antigen (HBsAg) is approximately 4.9%, and approximately 3.64 billion people are HBsAg-positive[1]. From 2013 to 2017, China had an HBsAg positivity rate of approximately 6.89%, which is comparable to that of countries with moderate hepatitis B virus (HBV) prevalence[2]. CHB infection can lead to liver cirrhosis and cancer. Primary liver cancer is the sixth most common type of cancer worldwide. However, high mortality and short survival times make it the third leading cause of cancer-related deaths, among which hepatocellular carcinoma (HCC) is the most common, accounting for approximately 75%–85%[3]. HBV is recognized as an HCC-causing virus, and approximately 54% of HCC cases worldwide are related to HBV infection; in China, this proportion is as high as 85%[4]. Therefore, active antiviral therapy is important for preventing and treating CHB, liver cirrhosis, and HCC.
Given the presence of covalently closed circular deoxyribonucleic acid (DNA), CHB cannot be completely cured. The ideal goal of CHB treatment is to achieve a functional cure; that is, after 6 months of treatment, HBsAg is continuously negative (with or without the appearance of hepatitis B surface antibody), HBV DNA cannot be detected, liver biochemical indices are normal, and liver tissue lesions are improved[5,6]. Pegylated interferon-alfa (PEG-IFN-α) and nucleoside analogs (NAs) are the current treatments for CHB, which can be given separately or together. NAs, such as Entecavir, Tenofovir Disoproxil Fumarate, and Tenofovir Alafenamide Fumarate, inhibit the virus by targeting viral reverse transcriptase; however, the probability of functional cure is between 0% and 2%[7], which is not improved compared to the annual natural disappearance rate of HBsAg in patients with CHB (0.5%–1.5%)[8]. However, PEG-IFN-α has direct antiviral effects and has a far-reaching and extensive role in immune regulation function on the host immune system. PEG-IFN-α alone or combined with NAs is an effective way to obtain a functional cure[9,10]. Strategies such as combination therapy, consolidation therapy, and prolonged therapy have been implemented[11-14]. However, we observed that a few patients experienced a plateau period with a slow decline in HBsAg during prolonged treatment (The definition of a plateau period is when serum HBsAg of patients treated with PEG-IFN-α decrease < 0.5 log10IU/mL from the last follow-up time point (at least 12 weeks)[15]. At this time, if PEG-IFN-α antiviral treatment continues, there would be no more benefits.
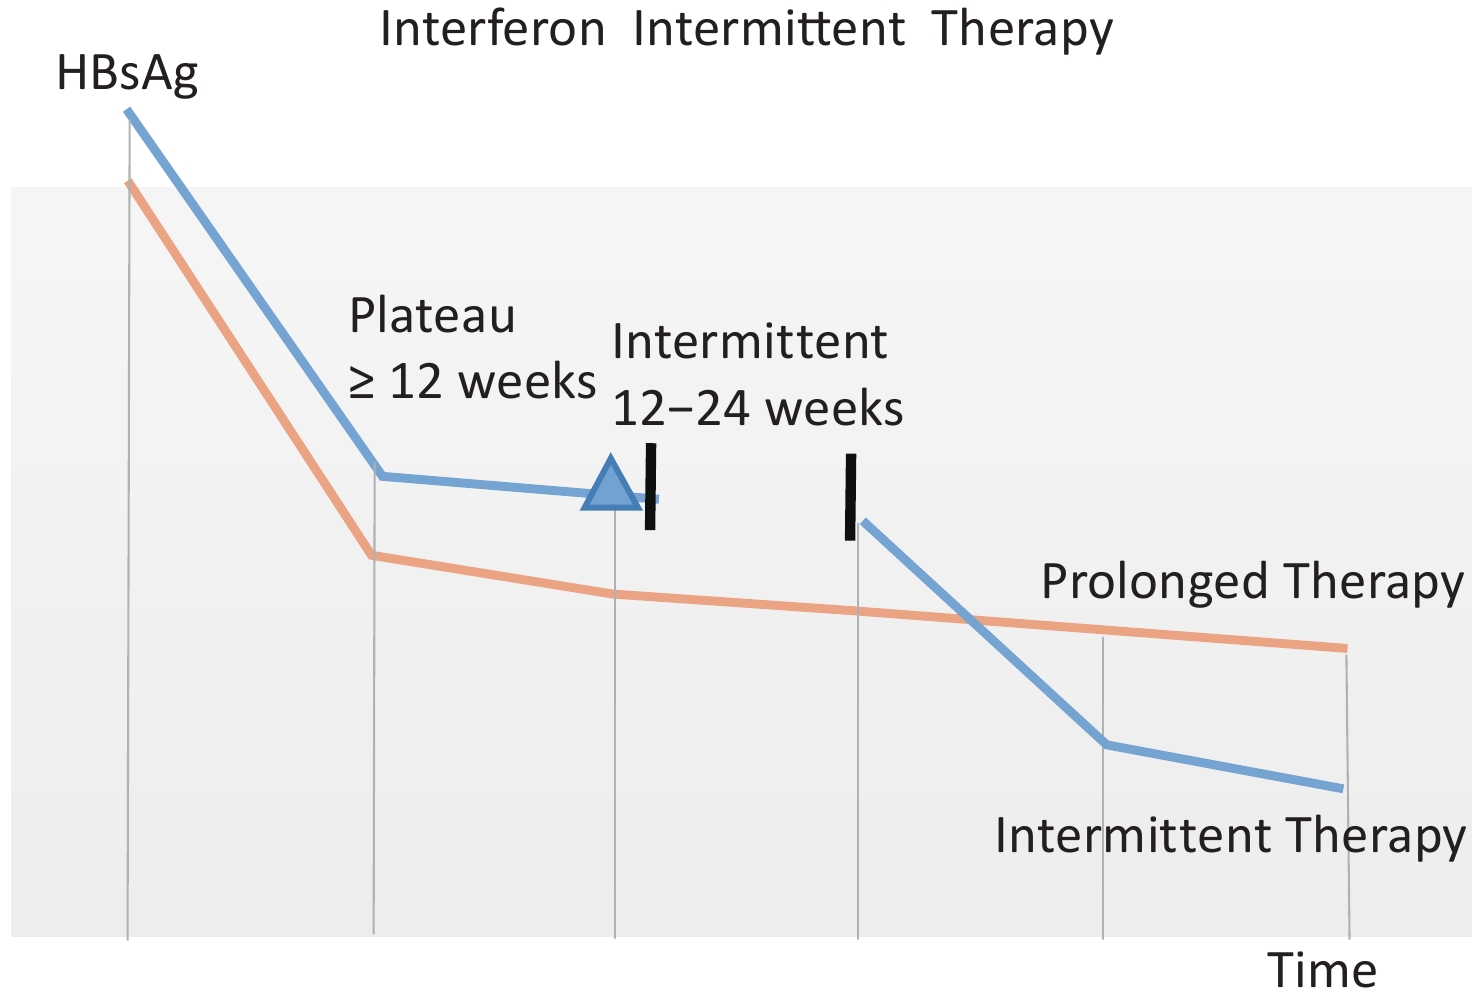
Due to the high cost and severe adverse associated with PEG-IFN-α treatment, we first proposed an intermittent treatment regimen (Figure 1), that is, after patients reach the plateau period with a slow decline in HBsAg, PEG-IFN-α will be discontinued for a period of 12–24 weeks and then re-used. We observed an HBsAg loss rate of 19.41% with an intermittent treatment regimen, indicating that intermittent treatment is beneficial for HBsAg loss[15].
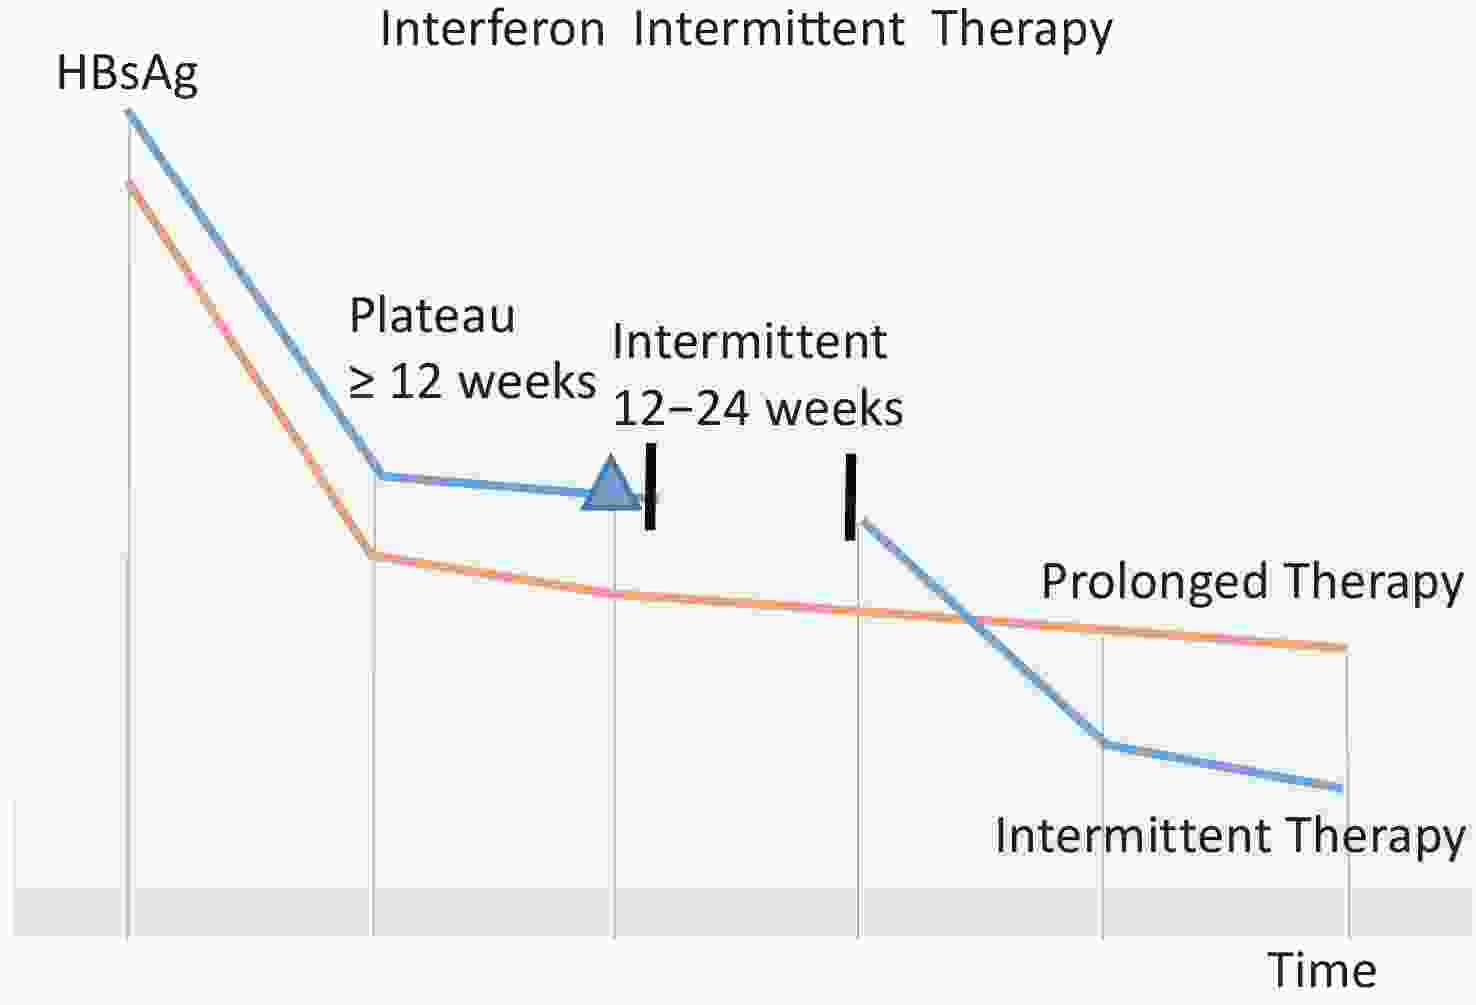
Figure 1. Schematic diagram of intermittent treatment regimen. Patients on intermittent treatment regimens are represented by the blue line, and those on prolonged treatment are represented by the orange line. As shown in the orange line, when the serum HBsAg decreases less than 0.5 log10 IU/mL from the last follow-up time point (at least 12 weeks), HBsAg do not significantly decrease during the prolonged treatment period; If PEG-IFN-α is discontinued for a period of 12–24 weeks, HBsAg will start to decline again as shown in the blue line[15]. Peripheral venous blood of enrolled patients was retained at the blue triangle point in the figure when they entered the plateau stage.
Dendritic cells (DCs), the most powerful antigen-presenting cells in the human body, link innate and adaptive immunity, and initiate an adaptive immune response. Nowadays, myeloid dendritic cells (mDCs), particularly mDC1 and mDC2, and plasmacytoid dendritic cells (pDCs) are the most studied DCs. Under normal circumstances, in vivo, most immature DCs exhibit low expression of major histocompatibility complex-II (MHC-II) molecules and costimulatory molecules, while simultaneously displaying higher levels of Fc receptors (FCR) and pathogen receptors. These immature DCs possess a strong capacity to absorb and process antigens before migrating to lymphoid organs. In contrast, mature DCs lack FCR and pathogen receptors, resulting in a loss of their ability to uptake and process antigens. However, MHC-I and MHC-II molecules, along with costimulatory molecules, are upregulated on the surface of mature DCs. During maturation, DCs migrate to the peripheral lymphoid organs, present antigens there, and increase cytokine secretion, which can effectively activate the initial T cells. When activated, pDCs rapidly produce significant amounts of type I interferons and participate in the antiviral immune response. After antigen uptake, mDCs can present the antigen peptide to CD8+ T cells and activate them by the surface antigen peptide-MHC-I molecule or present the antigen peptide to Th0 cells and activate them by surface antigen peptide-MHC-II molecule, and then induce activated Th0 cells to differentiate into Th1, Th2, Th3, and Treg[16,17].
This study aimed to evaluate whether the onset of the plateau phase of slow HBsAg decline in patients with CHB treated with intermittent interferon therapy is related to the frequency of DC subsets and the expression of the costimulatory molecules CD40, CD80, CD83, and CD86.
-
This was an analytical cross-sectional study. Outpatients with CHB at the Second Department of Hepatology, Beijing Ditan Hospital between October 2021 and October 2022 were enrolled into three groups: patients with CHB who had never undergone antiviral therapy made up the natural history group (NH group); patients with CHB who had been treated with first-line NAs comprised the NAs-treated group (NA group); patients with CHB who had received PEG-IFN-α treatment and had entered a plateau of slow HBsAg decline made up the plateau-arriving group (P group).
Once enrolled, we will collect population, epidemiological, and clinical data from patients immediately and then collect peripheral blood from patients to determine DC-related indicators. For patients in the NH group, the decision to initiate antiviral therapy, and the optimal treatment regimen (PEG-IFN-α alone, NAs alone, or their combination), is determined by their clinical indicators. For the NA group, whether to change the current treatment regimen based on the current virus control status of the patients. Patients in the P group have entered a plateau of slow HBsAg decline at this time, which means intermittent treatment regimens can be initiated. PEG-IFN-α will be suspended for 12–24 weeks and first-line antiviral drugs will be administered to maintain virus control and prevent virus reactivation during the interval. After the interval is over, PEG-IFN-α therapy will be resumed based on NAs.
This study was approved by the Ethics Committee of Beijing Ditan Hospital (Jing Di Lun Ke Zi 2018 no. 023-01) and registered as a Clinical Trial (NCT04028856). The final manuscript was reviewed and approved by all the authors with access to the study data.
-
Patient inclusion criteria were as follows: (1) Age ranges from 18 to 65 years old; (2) Sex is not limited; (3) The CHB diagnosis conforms to China’s Guidelines for Prevention and Treatment of Chronic Hepatitis B (2019)[18]; (4) NH group: patients with CHB who have never been treated with antiviral therapy before; NA group: patients with CHB who have received first-line NAs treatment ≥ 48 weeks; P group: patients with CHB who have been treated with PEG-IFN-α (with or without a combined NAs) ≥ 24 weeks and entered a plateau period with a slow decline in HBsAg (the definition of a plateau period is when serum HBsAg of patients treated with PEG-IFN-α decrease < 0.5 log10 IU/mL from the last follow-up time point (at least 12 weeks[15]); (5) Good compliance, and informed consent signing.
-
Patient exclusion criteria were as follows: (1) Patients infected with viruses other than HBV, such as hepatitis C virus, human immunodeficiency virus, hepatitis D virus, etc; (2) Patients who used corticosteroids, immunosuppressants, or hemotherapy drugs within six months before enrolling; (3) Individuals suffering from liver fibrosis or cirrhosis; (4) Patients who have liver tumors; (5) Patients with alcoholic liver disease, fatty liver disease, autoimmune liver disease, or metabolic liver disease; (6) Long-term use of drugs that cause liver damage; (7) Patients who suffer from mental illness; (8) Patients who are not considered suitable for this study by researchers.
-
Population and epidemiological data were obtained through a questionnaire survey: sex, age, diagnosis time of CHB, treatment history of CHB, any other chronic liver diseases, whether there is liver fibrosis, liver cirrhosis, or liver cancer; whether there is a history of mental illness; whether there are other chronic diseases and treatment history; and whether there is a history of taking corticosteroids, immunosuppressants, or chemotherapy drugs.
Detection of clinical indexes: HBsAg and hepatitis B e antigen (HBeAg) were detected by the Abbott microparticle chemiluminescence method (Abbott company reagent, Abbott i2000 automatic luminescence immunoanalyzer), the detection range of HBsAg level was 0.05–250.00 IU/mL, and those HBsAg levels that were greater than 250 IU/mL would be automatically diluted 500 times. HBV DNA levels were detected using fluorescence quantitative polymerase chain reaction (LightCycler 480 PCR system, Roche Reagent). The HBV DNA detection limit was 20 IU/mL. Alanine aminotransferase (ALT) and aspartate aminotransferase (AST) levels were measured using a Hitachi automatic biochemical analyzer. All the tests were performed at the Clinical Laboratory of Beijing Ditan Hospital, Capital Medical University.
Detection of DC-related indexes: Peripheral venous blood was collected in a 9 mL ethylene diamine tetraacetic acid anticoagulant tube, and peripheral blood mononuclear cells (PBMCs) were extracted within 6 h. The extracted PBMCs were evenly distributed into 2 flow tubes, and each flow tube was added with 15 μL of BV buffer, 1 μL of APC/Fire™ 750 anti-human HLA-DR antibody, 1 μL of Brilliant Violet 510™ anti-human CD11c antibody, 1.5 μL of PerCP anti-human CD123 antibody, 1 μL of Brilliant Violet 421™ anti-human CD141 (Thrombomodulin) antibody, 1 μL/antibody of FITC anti-human Lineage Cocktail (CD3, CD14, CD19, and CD56) and 1 μL of PE anti-human CD1c antibody. Flow tube 1 was supplied with 1 μL of PE/Cyanine7 anti-human CD83 antibody and 1 μL of APC anti-human CD86 antibody, and flow tube 2 was supplied with 1 μL of PE/Cyanine7 anti-human CD40 antibody and 1 μL of APC anti-human CD80 antibody. After 15 min of light-proof dyeing, 2 mL PBS was added to each tube, centrifuged at 1,200 rpm for 5 min, and the liquid was discarded before flow cytometry.
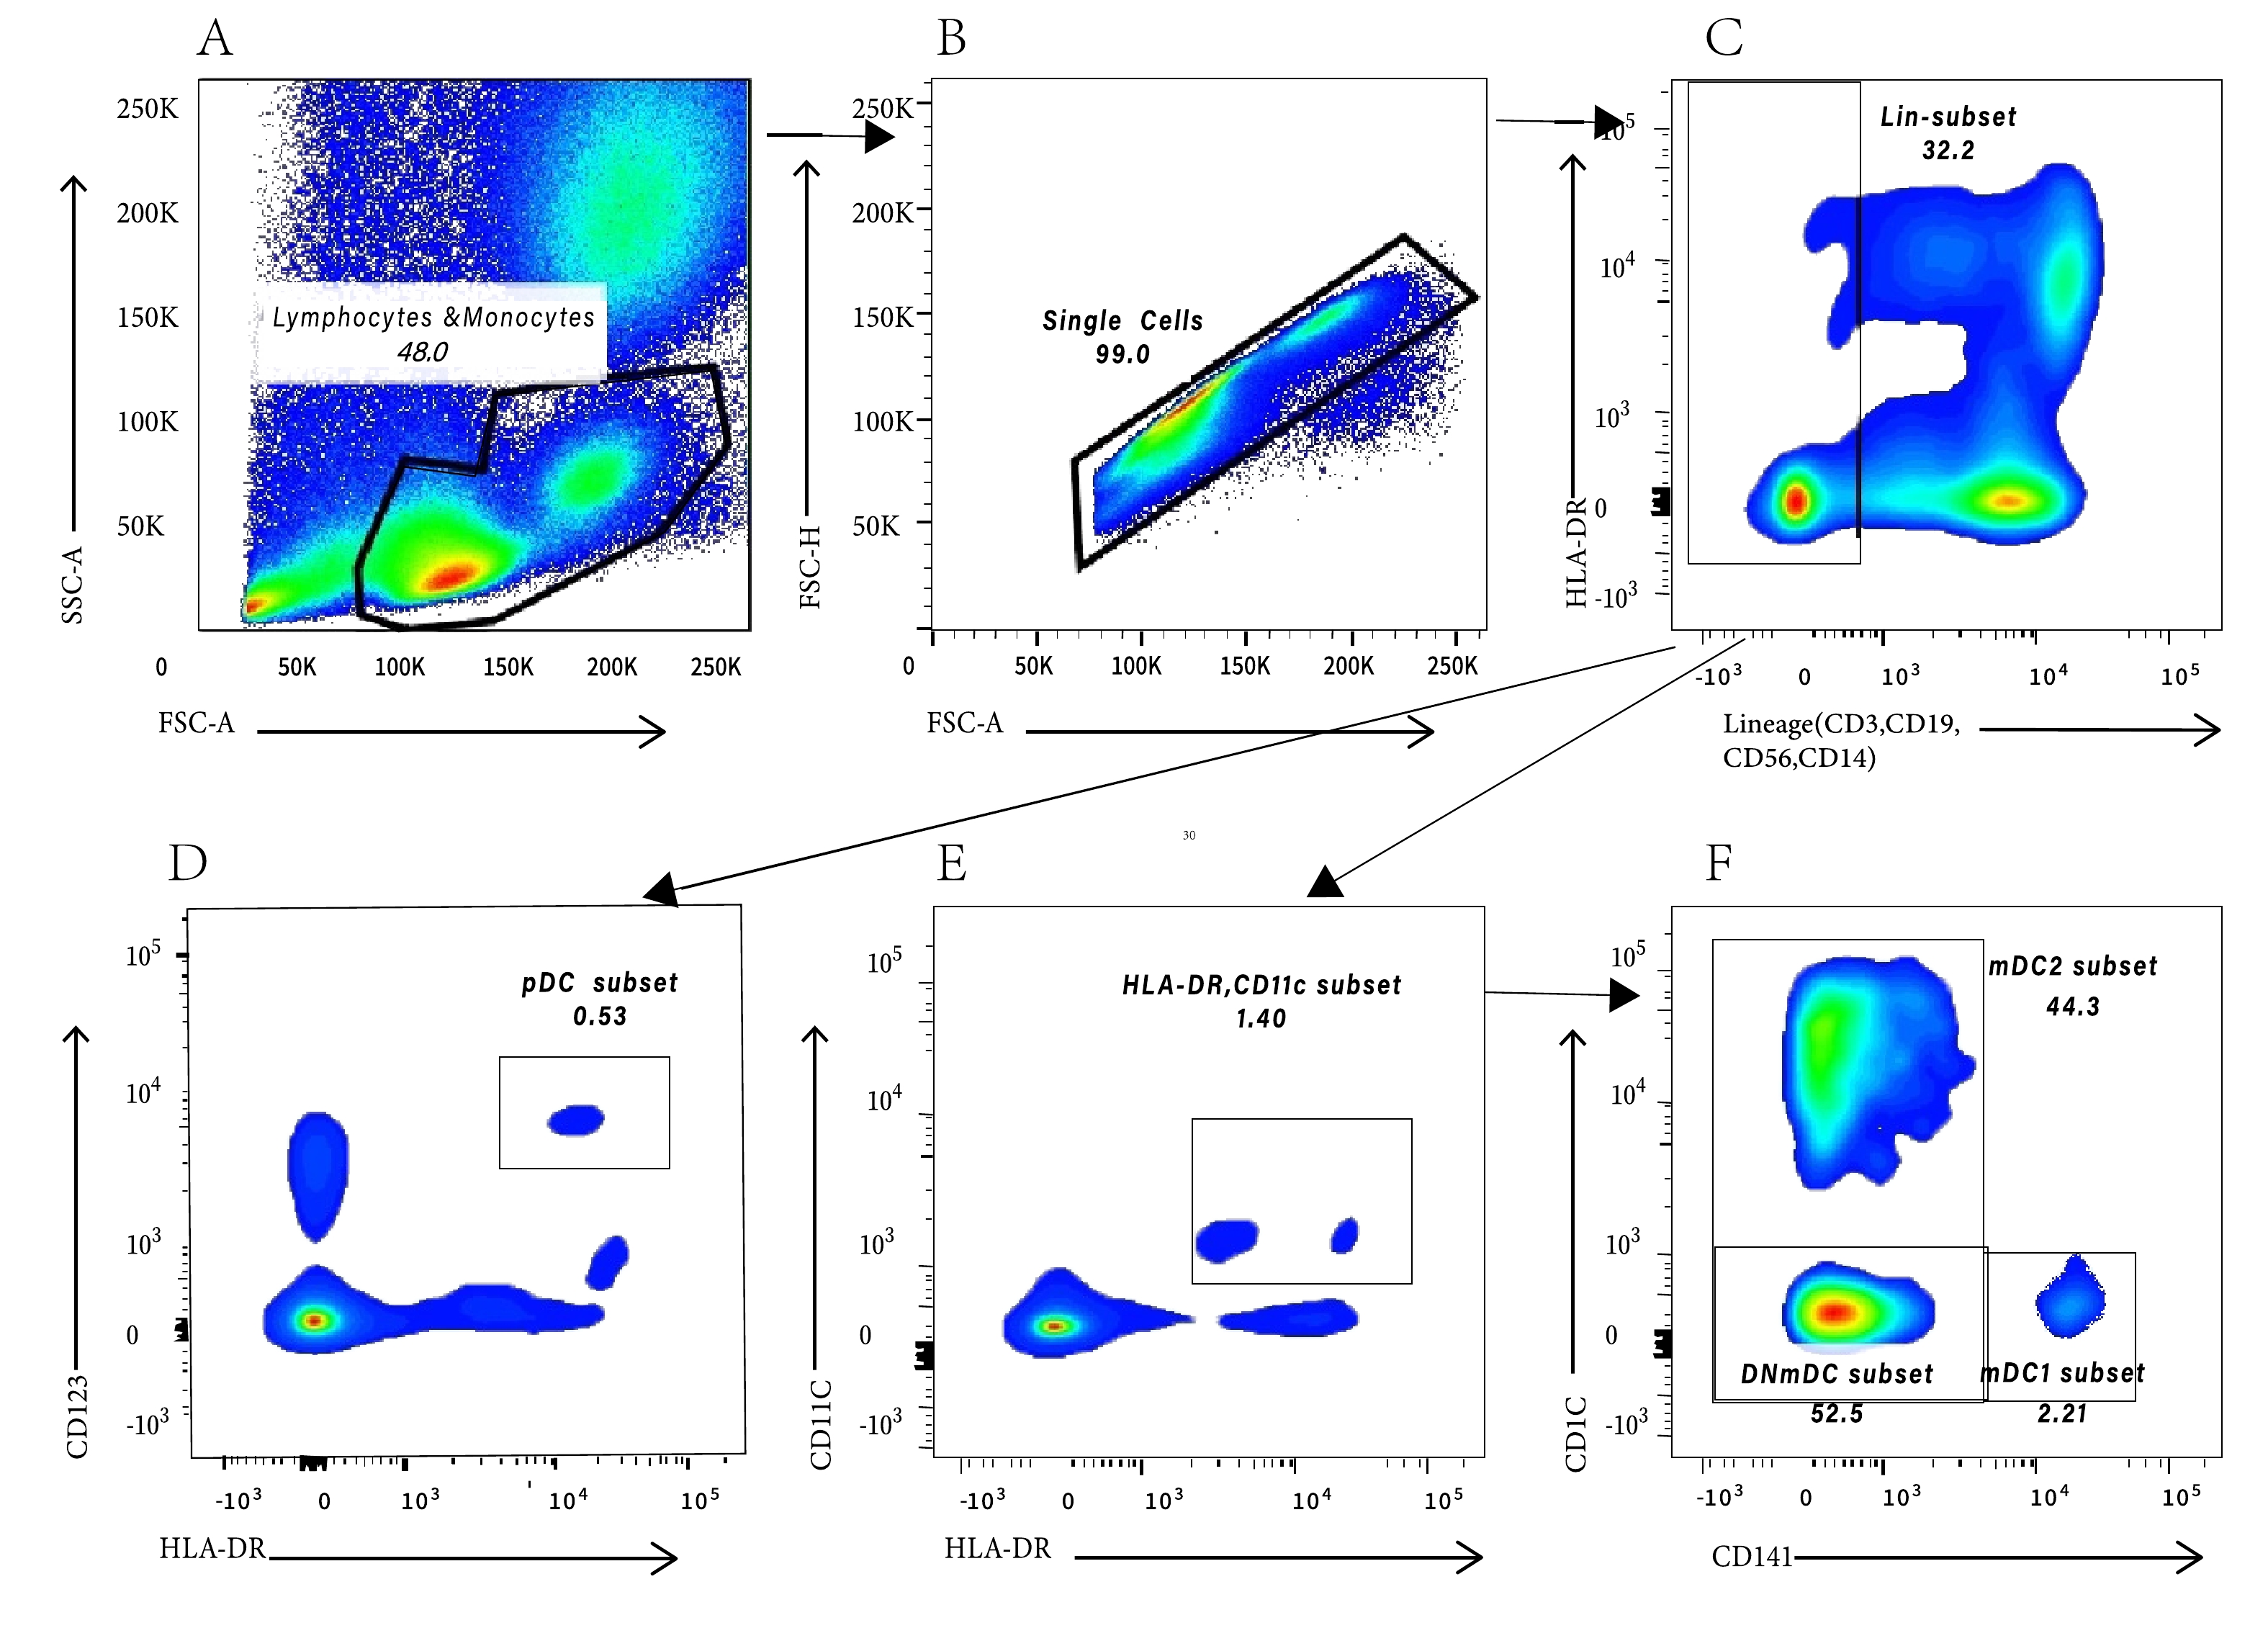
DC-related indices were detected using BD FACS Canto II 8 color flow cytometry, and the diagram was processed using FlowJo V10. The cell-delineating strategy (Figure 2) has been described by Park et al.[19]. mDC/lymphocytes and monocytes% and pDC/lymphocytes and monocytes% indicate the proportion of pDC and mDC in peripheral blood lymphocytes and monocytes, respectively, with mDC continuing to be divided into mDC1, mDC2, and CD1c/CD141 double-negative mDC (DNmDCs). Because the two panels included both pDC/lymphocyte and monocyte percentages and mDC/lymphocyte and monocyte percentages, the final data were the average of the two panels. CD40, CD80, CD86, and CD83 mean fluorescence intensities (MFI)were used to reflect the function of DCs.
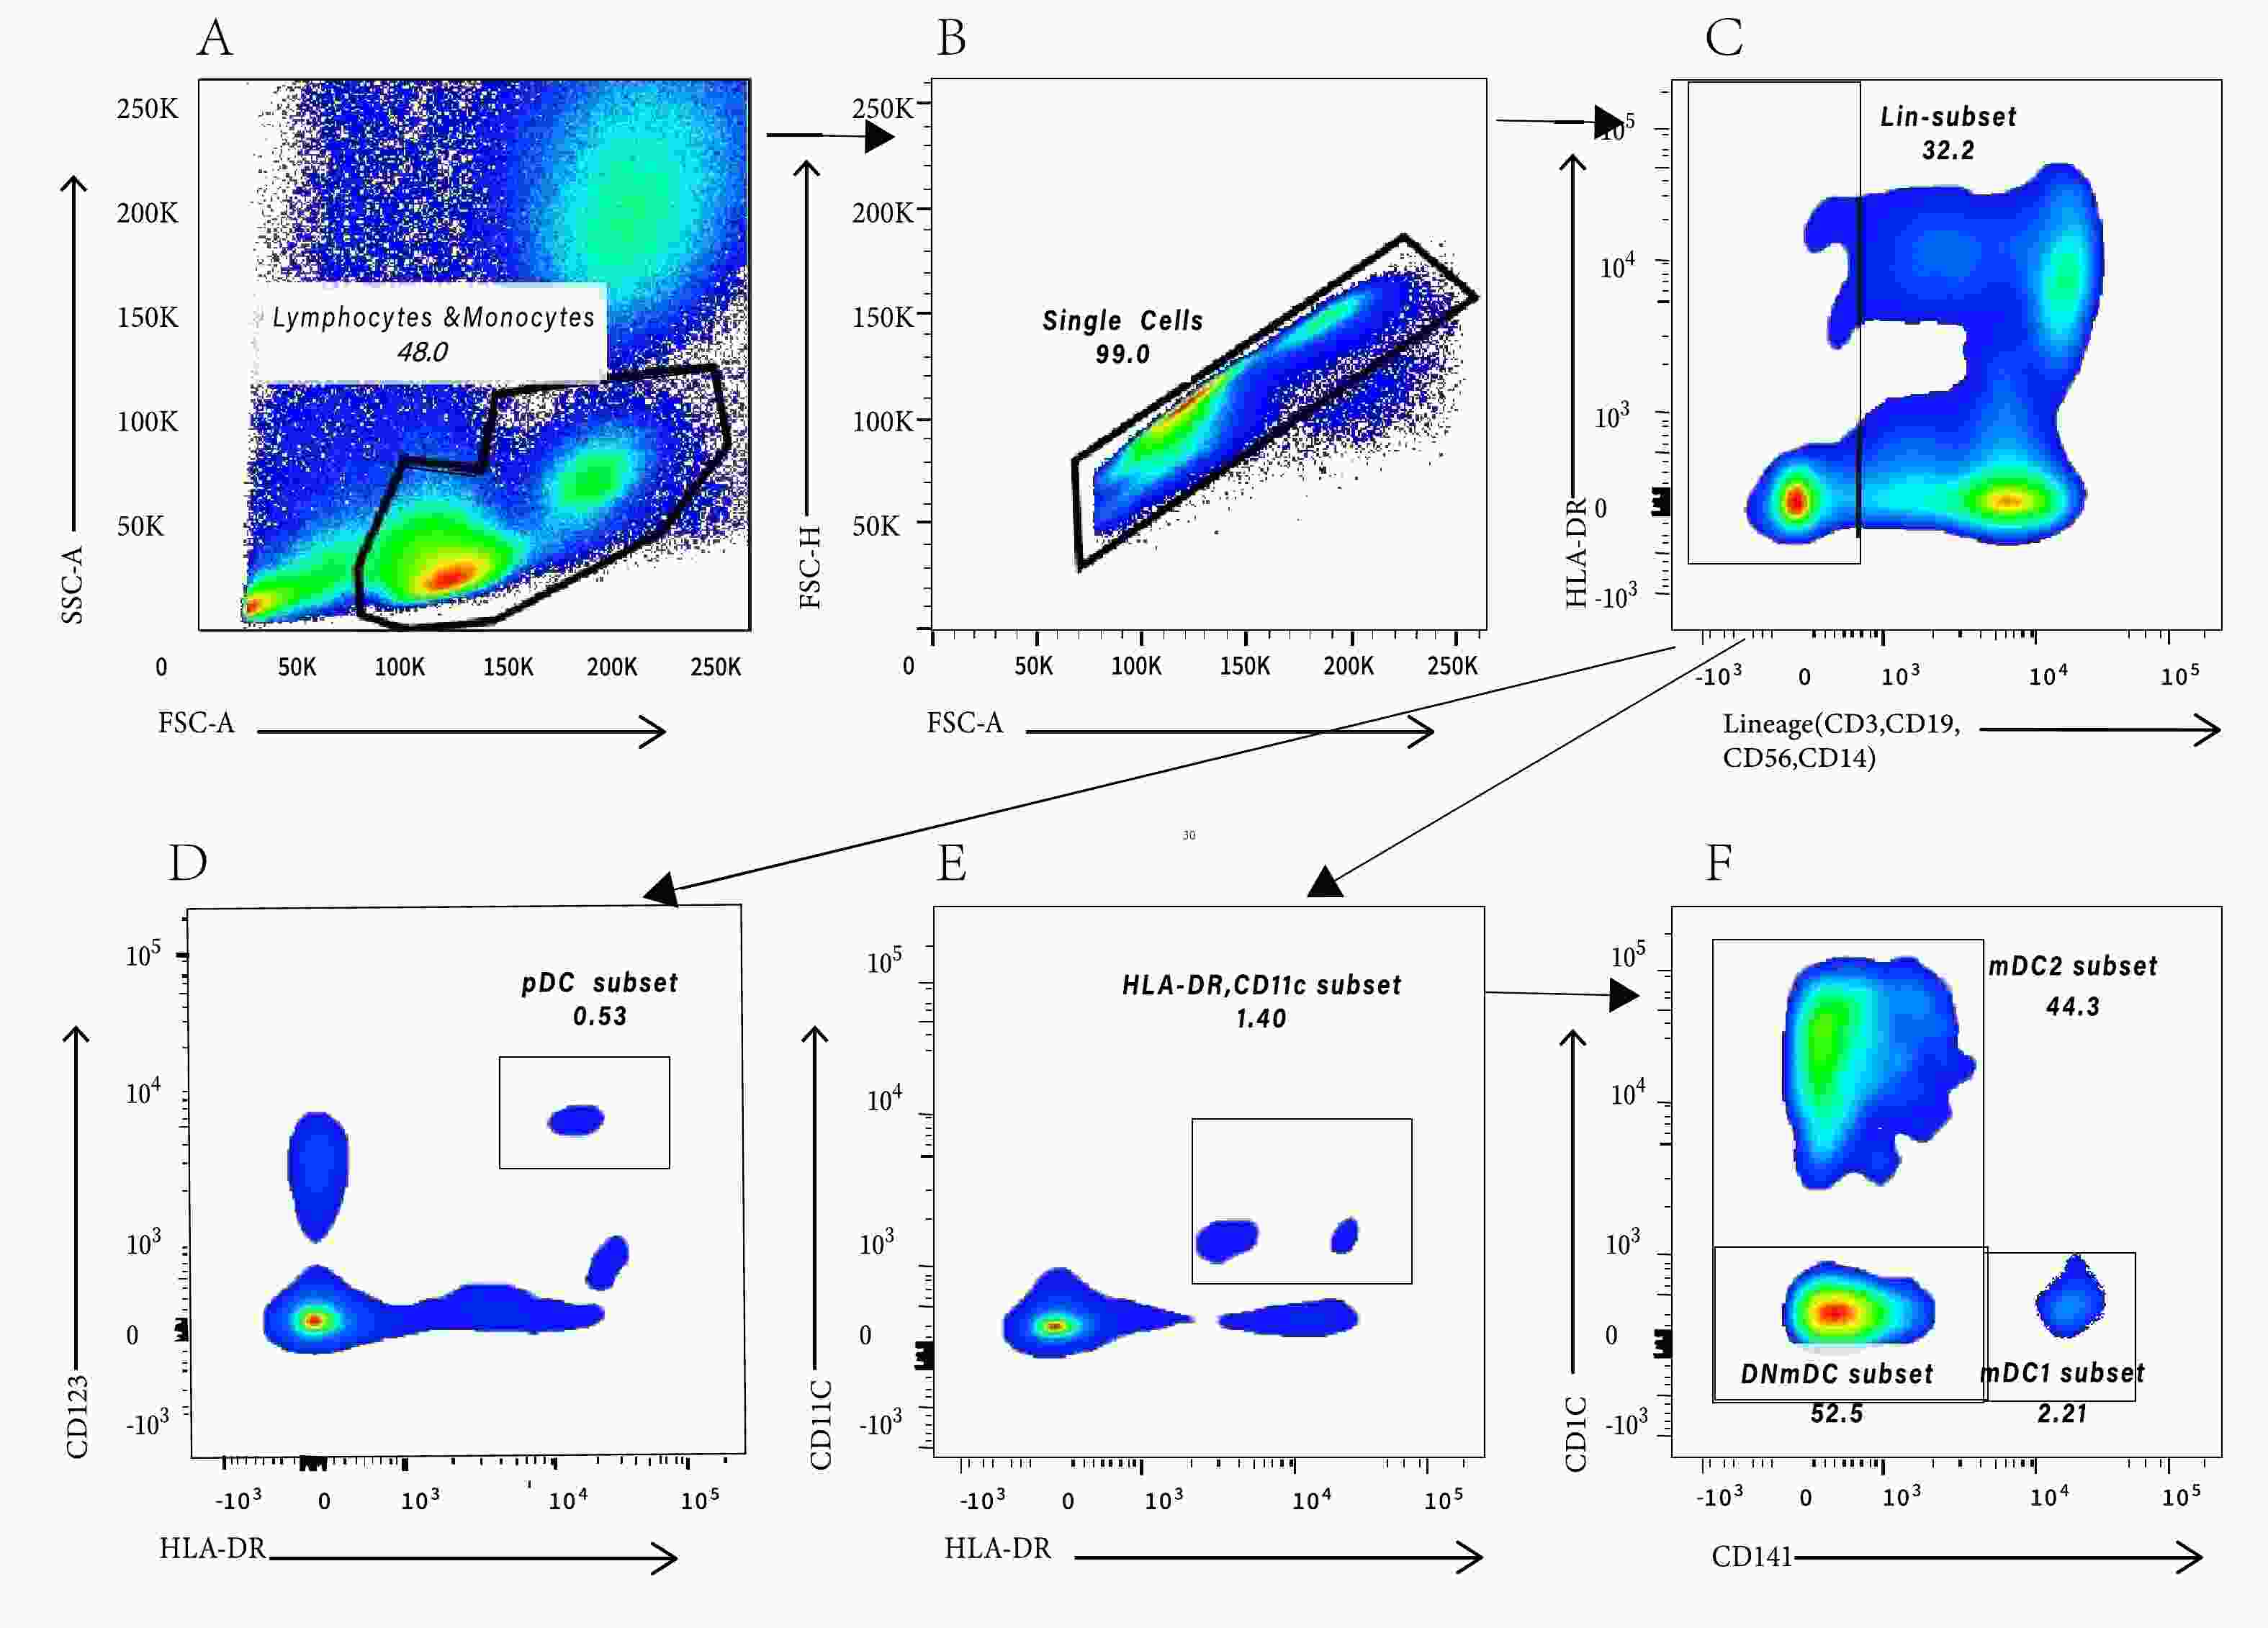
Figure 2. The gating strategy of dendritic cells. (A) Peripheral blood lymphocytes and monocytes cells were gated according to SSC-A and FSC-A; (B) Removal of adhesion and gating single cells according to FSC-A and FSC-H; (C) Gating on Lineage- cells to exclude T and B lymphocytes, natural killer cells, and monocytes. (D) pDCs were gated based on HLA-DR and CD123; (E) mDCs were gated based on HLA-DR and CD11c; (F) mDC1 were gated based on CD141, mDC2 were gated based on CD1c, and DNmDC is CD141/CD1c double negative mDC.
-
Statistical analysis was performed using the SPSS 25.0 and GraphPad Prism 8.0 softwares. Normality tests were performed on all measurement data. Data that fit the normal distribution are expressed by mean ± standard deviation (SD), while those that do not fit are represented by quartiles (M [P25, P75]). Analysis of variance (ANOVA) or the Kruskal-Wallis H test was used to compare the differences between groups according to whether the data conformed to a normal distribution and homogeneity of variance. For variables with statistical differences, P-value comparisons between the two groups were made after the Bonferroni calibration test level. Counting data were expressed as the number of cases and percentages, and the chi-square test or Fisher’s exact test was adopted. For variables with statistical differences, P-value comparisons between the two groups were made after the Bonferroni calibration test level. All tests were bilateral, and a P-value < 0.05 was statistically significant.
-
A total of 143 patients (79 males and 64 females) were enrolled in the study: 47 in the NA group (30 males and 17 females), 49 in the NH group (18 males and 31 females), and 47 in the P group (31 males and 16 females). The sex compositions of the three groups were not identical (χ2 = 10.373, P = 0.006). After pairwise comparisons, the significance level was adjusted using the Bonferroni method. There were statistically significant differences in the sex composition between the NH group and P group (adjusted P = 0.012) and between the NH group and NA group (adjusted P = 0.024). The age distribution among the three groups was not equal (H = 17.947, P < 0.001). After pairwise comparisons, the significance level was adjusted using the Bonferroni method. It was observed that the age distribution was statistically different between the NA group and the P group (adjusted P = 0.016), and between the NA group and the NH group (adjusted P < 0.001). Patients in the NA group (48.00 [34.00, 55.00]) were older than those in the P (36.00 [33.00, 44.00]) and NH (34.00 [31.25, 50.00]) groups. All three groups showed different levels of HBsAg (H = 27.327, P < 0.001) and HBeAg (H = 15.565, P < 0.001). After pairwise comparisons, the significance level was adjusted using the Bonferroni method. A significant difference exist in HBsAg levels between the NA group and the NH group (adjusted P = 0.012) and between the NH group and the P group (adjusted P < 0.001), and the HBsAg level in the NH group (3.82 [3.29, 4.49] log10 IU/mL) was higher than that in the P group (2.62 [1.17, 3.42] log10 IU/mL) and in the NA group (3.19 [2.24, 3.69] log10 IU/mL). There was a significant difference in the HBeAg levels between the NH group and P group (adjusted P < 0.001), and the HBeAg level in the NH group (73.68 [0.36, 1285.95] S/CO) was higher than that in the P group (0.385 [0.32, 4.90] S/CO). The HBV DNA levels in each group were not uniform (H = 50.752, P < 0.001). After pairwise comparisons, the significance level was adjusted using the Bonferroni method. The differences in HBV DNA levels between the NH group and P group (adjusted P < 0.001) and between the NH group and NA group (adjusted P < 0.001) were significant. The HBV DNA levels in the NH group (5.07 [2.48, 8.23] log10 IU/mL) were higher than those in the P (1.00 [0.04, 1.00] log10 IU/mL) and NA groups (1.00 [0.04, 1.90] log10 IU/mL). The ALT levels of the patients in the three groups differed (H = 12.403, P = 0.002). According to the significance level corrected using the Bonferroni method, there was a significant difference in the ALT levels between the NA group and the NH group (adjusted P = 0.002). The ALT levels of patients in the NH group (40.05 [25.70, 80.25] U/L) were higher than those in the NA group (26.40 [20.00, 36.85] U/L). The AST levels among the patients in the three groups were not identical (H = 11.477, P = 0.003). According to the significance levels corrected by the Bonferroni method, there were significant differences in ALT levels between the NA group and NH group (adjusted P = 0.012) and between the NA group and P group (adjusted P = 0.009). The AST levels of patients in the NA group (23.00 [19.30, 29.00] U/L) were significantly lower than those in the NH (34.35 [18.55, 49.95] U/L) and P groups (31.40 [22.60, 39.50] U/L) (Table 1).
Variables NA group
(n = 47)NH group
(n = 49)P group
(n = 47)Three groups
χ2/HP NA vs. NH
χ2/H/FAdj P NA vs. P
χ2/H/FAdj P NH vs. P
χ2/H/FAdj P Sex (male/female) 30/17 18/31 31/16 10.373 0.006 7.045 0.024 0.047 1.000 8.198 0.012 Age (years) 48.00
(34.00, 55.00)34.00
(31.25, 50.00)36.00
(33.00, 44.00)17.947 < 0.001 −35.056 < 0.001 −23.660 0.016 −11.396 0.529 HBsAg (log10 IU/mL) 3.19
(2.24, 3.69)3.82
(3.29, 4.49)2.62
(1.17, 3.42)27.327 < 0.001 24.082 0.012 −17.631 0.104 41.713 < 0.001 HBeAg (S/CO) 0.96
(0.41, 42.55)73.68
(0.36, 1285.95)0.385
(0.32, 4.90)15.565 < 0.001 13.089 0.329 −18.696 0.073 31.785 < 0.001 HBV DNA (log10 IU/mL) 1.00
(0.04, 1.90)5.07
(2.48, 8.23)1.00
(0.04, 1.00)50.752 < 0.001 47.263 < 0.001 −1.562 1.000 48.825 < 0.001 ALT (U/L) 26.40
(20.00, 36.85)40.05
(25.70, 80.25)34.00
(25.60, 49.80)12.403 0.002 27.413 0.002 18.160 0.056 9.253 0.720 AST (U/L) 23.00
(19.30, 29.00)34.35
(18.55, 49.95)31.40
(22.60, 39.50)11.477 0.003 22.981 0.012 22.942 0.009 0.039 1.000 Note. NA Group, long-term oral nucleoside analogues treatment group; NH Group, natural history group; P group, plateau arriving group; HBsAg, hepatitis B surface antigen; HBeAg, hepatitis B e antigen; HBV DNA, hepatitis B virus deoxyribonucleic acid; ALT, alanine aminotransferase; AST, aspartate aminotransferase. Quantitative informationare represented by quartiles (M[P25, P75]); Data in parentheses indicate 95% confidence intervals. Table 1. Comparison of clinical characteristics of patients among three groups
The clinical characteristics of the enrolled patients, such as sex, age, HBsAg, HBeAg, HBV DNA, ALT, and AST levels, did not match among the three groups, which could have affected the significance of the results. There were significant differences in the sex composition among the three groups. The NH group had a higher proportion of females, which may be due to the higher treatment rate for males with CHB. The age of patients in the NA group was significantly higher than that of patients in the NH group. This is because NA antiviral therapy is not typically recommended for patients with CHB until they are over 30 years of age. Additionally, the age of the patients in the P group was significantly lower than that in the NA group. This is caused by adverse reactions to interferon treatment and contraindications such as liver cirrhosis. Due to the antiviral effect of the NAs and the PEG-IFN-α, the HBsAg and HBV DNA levels in the NA group and the P group were significantly lower than those in the NH group, and the HBeAg level in the P group was significantly lower than that in the NH group. Owing to antiviral treatment, the ALT and AST levels were significantly lower in the NA group than in the NH group. There was no significant difference in the ALT and AST levels between the P and NH groups, which may be due to the short-term increase in ALT and AST levels due to liver cell damage caused by immune function activation during interferon treatment.
-
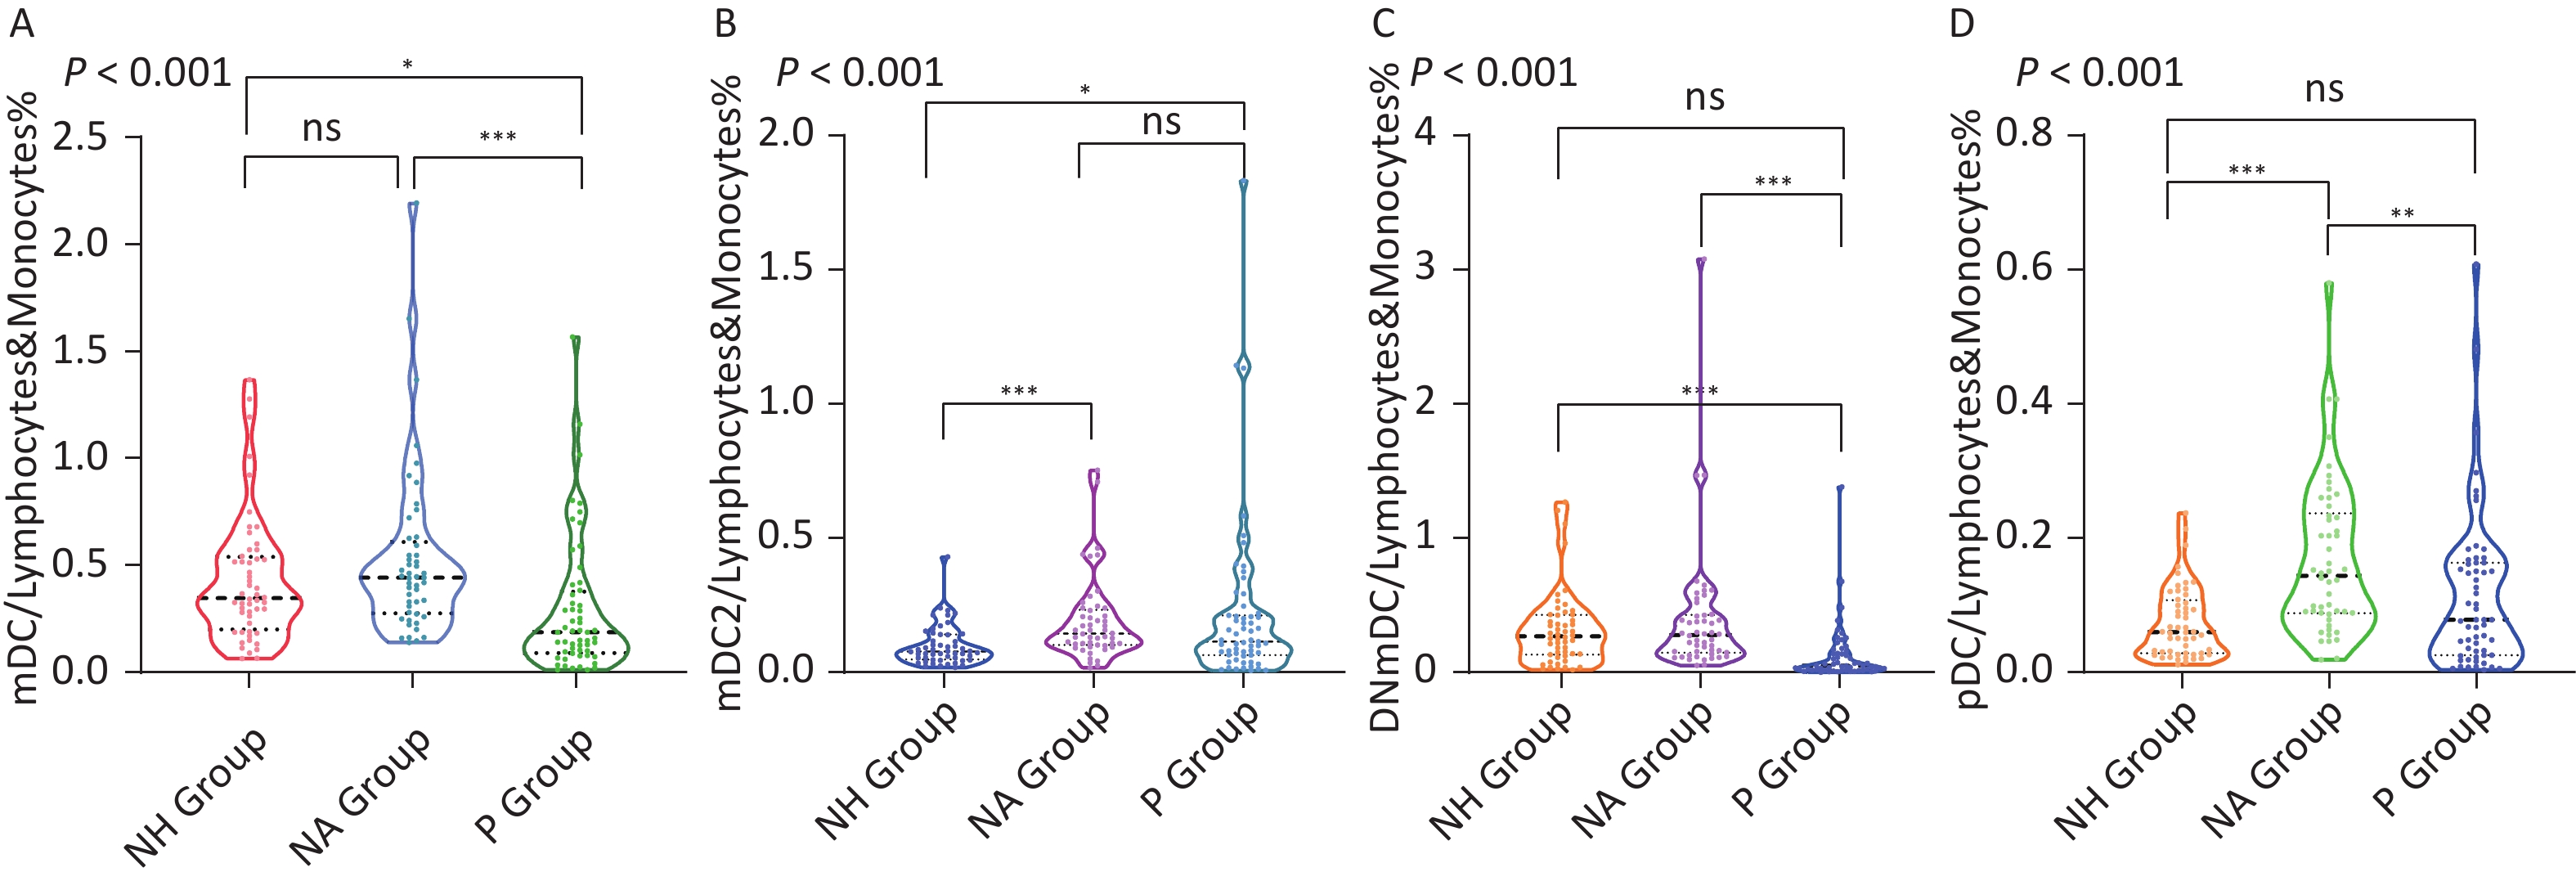
mDC/lymphocytes and monocytes (%) were not the same among the three groups (P < 0.001). After comparing the significance level corrected by the Bonferroni method, it was observed that mDC/lymphocytes and monocytes (%) in the P group (0.143% [0.083%, 0.253%]) were significantly lower than those in the NH group (0.350% [0.210%, 0.529%]) and the NA group (0.447% [0.310%, 0.633%]) , adjusted P all < 0.001. Continuing to divide mDC into mDC1, mDC2, and DNmDCs and conducting statistical analyses among the three groups, it was discovered that there were no statistical differences in mDC1/lymphocytes and monocytes (%) among the three groups (P = 0.902), while mDC2/lymphocytes and monocytes (%) and DNmDC/lymphocytes and monocytes (%) differed among the three groups, P all < 0.001. Comparison of the significance level corrected by the Bonferroni method showed that mDC2/lymphocytes and monocytes (%) in the NA group (0.145% [0.102%, 0.240%]) were significantly higher than those in the NH group (0.079% [0.050%, 0.142%]) (adjusted P < 0.001) and P group (0.089% [0.053%, 0.165%]) (adjusted P = 0.002). DNmDC/lymphocytes and monocytes (%) in the P group (0.041% [0.024%, 0.069%]) were significantly lower than those in the NH group (0.270% [0.135%, 0.407%]) and the NA group (0.273% [0.150%, 0.443%]) (adjusted P all < 0.001). pDCs/lymphocytes and monocytes (%) of the three groups were not the same. After the comparison of the significant level corrected by the Bonferroni method, it was discovered that the pDC/lymphocytes and monocytes (%) of the NA group (0.147% [0.088%, 0.233%]) was significantly higher than that of the NH group (0.060% [0.028%, 0.106%]) (adjusted P < 0.001) and the P group (0.074% [0.034%, 0.147%]) (adjusted P = 0.001) (Figure 3, Table 2).
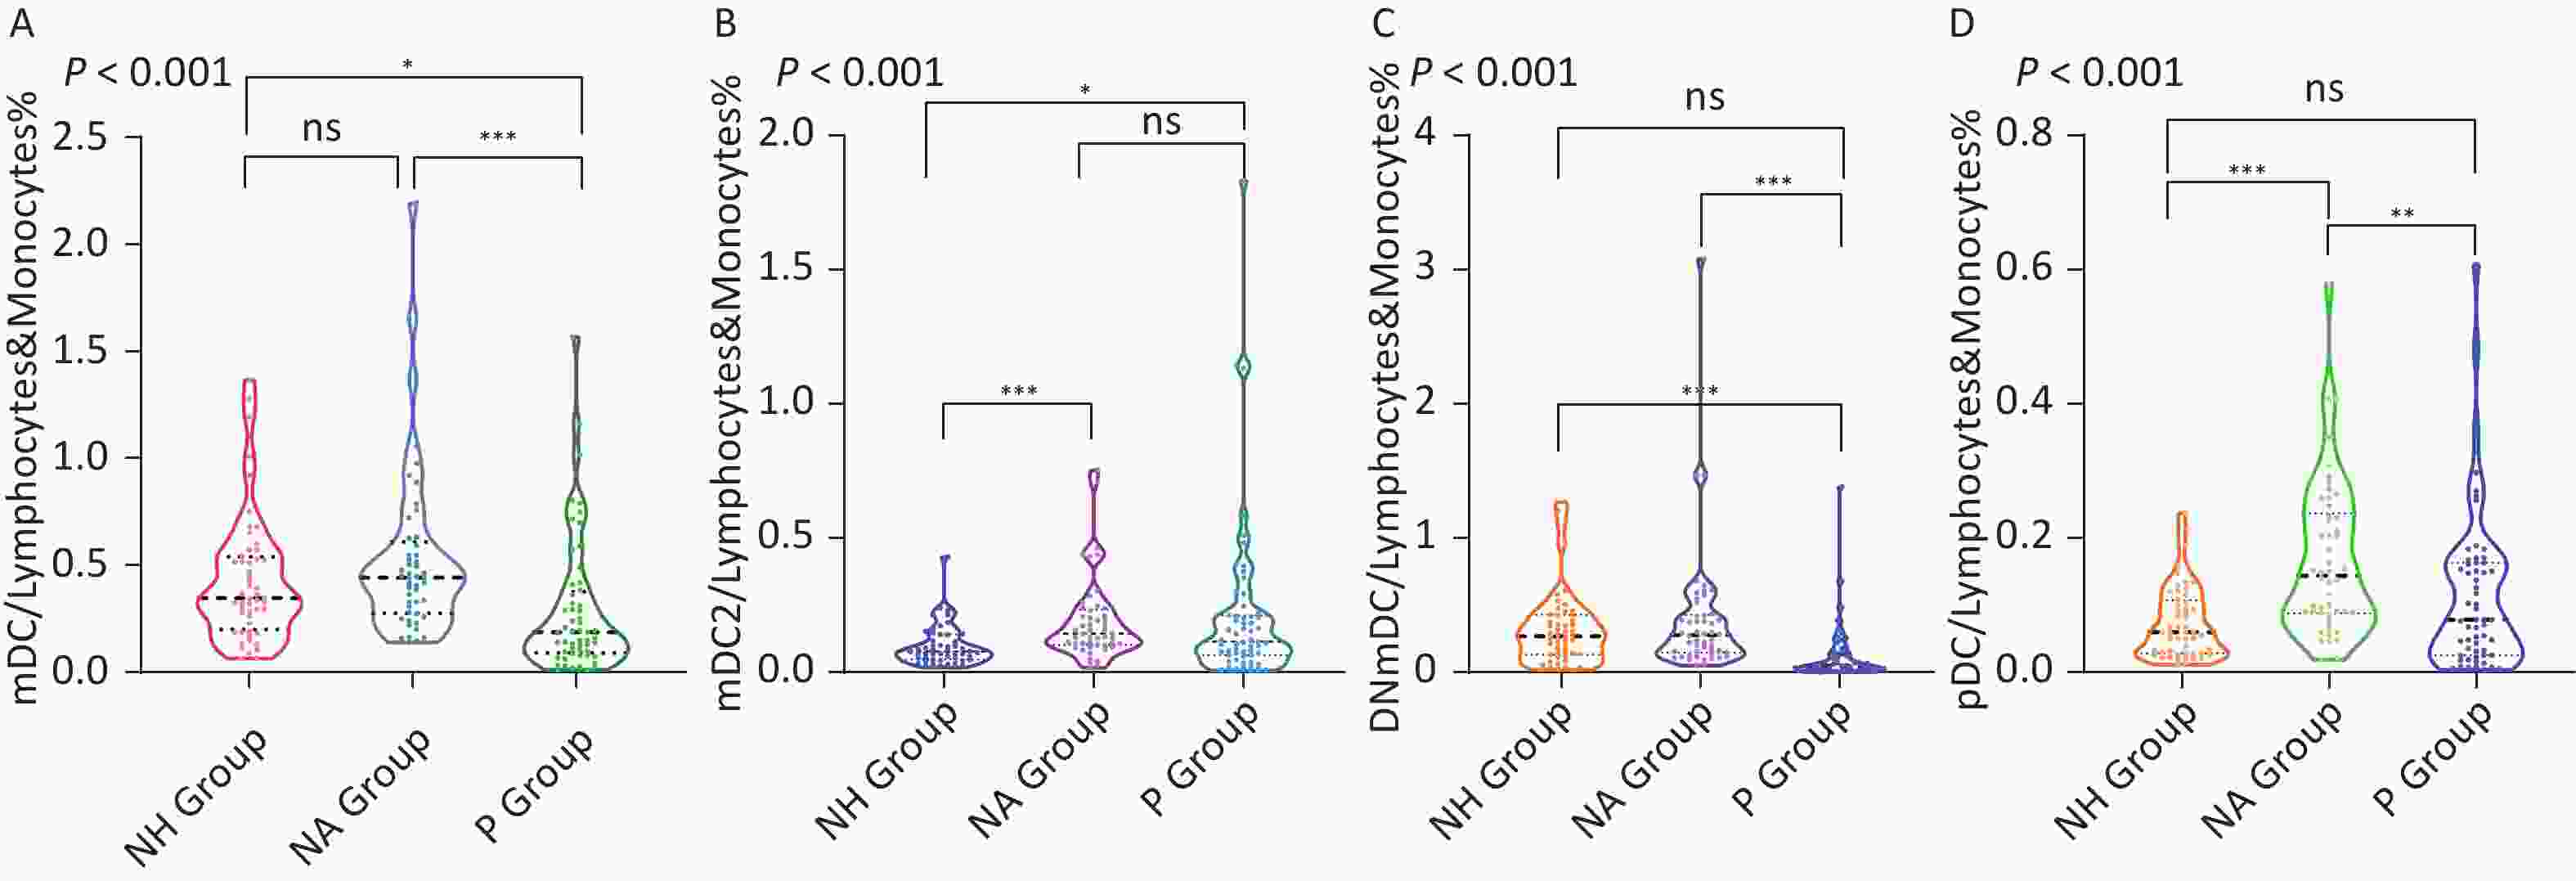
Figure 3. Comparison of the frequency of dendritic cell subsets.
Variables NA group NH group P group Three groups NA vs. NH NA vs. P NH vs. P P Adj P Adj P Adj P mDC/lymphocytes and monocytes (%) 0.447
(0.310, 0.633)0.350
(0.210, 0.529)0.143
(0.083, 0.253)< 0.001 0.303 < 0.001 < 0.001 mDC CD86 MFI 2810.0
(2424.0, 3678.0)3448.0
(2218.5, 4495.0)2634.0
(2136.0, 3469.0)0.036 0.459 0.775 0.030 mDC CD83 MFI 182.0
(143.0, 228.0)175.0
(136.0, 226.0)242.0
(175.0, 318.0)0.002 1.000 0.014 0.003 mDC CD80 MFI 451.0
(323.0, 631.5)407.0
(310.0, 479.5)498.0
(333.3, 709.5)0.051 − − − mDC CD40 MFI 321.5
(241.0, 444.5)351.0
(234.5, 517.5)301.5
(207.8, 575.5)0.737 − − − mDC1/lymphocytes and monocytes (%) 0.003140
(0.001737, 0.007097)0.002730
(0.001880, 0.005773)0.002900
(0.001913, 0.004725)0.902 − − − mDC1 CD86 MFI 1131.5
(855.0, 1517.8)1220.5
(934.5, 1594.0)1576.0
(1174.8, 2020.0)0.007 0.615 0.005 0.166 mDC1 CD83 MFI 257.0
(126.5, 393.0)260.5
(172.3, 375.0)222.0
(108.8, 335.5)0.465 − − − mDC1 CD80 MFI 670.5
(512.5, 1049.0)553.0
(391.0, 754.0)485.5
(274.3, 706.8)0.004 0.041 0.004 1.000 mDC1 CD40 MFI 1421.0
(745.0, 1813.0)624.0
(396.0, 1026.5)546.0
(377.0, 1122.5)< 0.001 < 0.001 < 0.001 1.000 mDC2/lymphocytes and monocytes (%) 0.145
(0.102, 0.240)0.079
(0.050, 0.142)0.089
(0.053, 0.165)< 0.001 < 0.001 0.002 1.000 mDC2 CD86 MFI 2544.0
(2119.0, 2894.0)2123.0
(1868.5, 2631.5)2826.0
(2476.0, 3686.0)< 0.001 0.061 0.050 < 0.001 mDC2 CD83 MFI 406.0
(271.0, 522.0)316.0
(224.0, 474.0)255.0
(192.0, 352.0)0.022 0.528 0.017 0.451 mDC2 CD80 MFI 882.5
(588.0, 1232.0)616.0
(489.5, 826.5)511.0
(391.5, 831.8)< 0.001 0.006 < 0.001 0.958 mDC2 CD40 MFI 389.0
(257.8, 685.8)443.0
(302.0, 861.0)290.0
(193.0, 613.8)0.017 0.877 0.239 0.014 DNmDC/lymphocytes and monocytes (%) 0.273
(0.150, 0.443)0.270
(0.135, 0.407)0.041
(0.024, 0.069)< 0.001 1.000 < 0.001 < 0.001 DNmDC CD86 MFI 3299.0
(2534.0, 4371.0)4316.0
(2957.5, 5169.0)1832.0
(1484.0, 2793.0)< 0.001 0.125 < 0.001 < 0.001 DNmDC CD83 MFI 126.0
(90.0, 160.0)138.0
(108.0, 167.0)215.0
(155.0, 301.0)< 0.001 0.748 < 0.001 < 0.001 DNmDC CD80 MFI 336.0
(244.5, 434.5)318.0
(268.0, 388.0)397.0
(277.8, 543.3)0.032 1.000 0.114 0.045 DNmDC CD40 MFI 307.0
(230.5, 379.3)344.0
(246.0, 467.0)322.0
(258.8, 588.0)0.092 − − − pDC/lymphocytes and monocytes (%) 0.147
(0.088, 0.233)0.060
(0.028, 0.106)0.074
(0.034, 0.147)< 0.001 < 0.001 0.001 0.617 pDC CD86 MFI 619.0
(475.0, 945.0)862.0
(611.0, 1128.5)995 .0
(659.3, 1279.0)0.002 0.060 0.001 0.634 pDC CD83 MFI 224.0
(157.0, 355.0)289.0
(193.0, 378.5)269.5
(192.3, 387.3)0.184 − − − pDC CD80 MFI 447.0
(345.5, 683.5)493 .0
(364.5, 644.0)413.0
(278.0, 595.0)0.198 − − − pDC CD40 MFI 368.0
(236.8, 576.8)401.0
(227.0, 786.0)350.0
(211.8, 605.8)0.678 − − − Note. NA group, long-term oral nucleoside analogues treatment group; NH group, natural history group; P group, plateau arriving group; mDC, myeloid dendritic cell; pDC, plasmacytoid dendritic cell; DNmDC, CD1c/CD141 double negative myeloid dendritic cell; MFI, mean fluorescence intensity; Data in parentheses indicate 95% confidence intervals. Table 2. Comparison of the proportion of dendritic cells in peripheral blood lymphocytes and monocytes and dendritic cells’ surface costimulatory molecules CD86, CD83, CD80, and CD40 mean fluorescence intensity
-
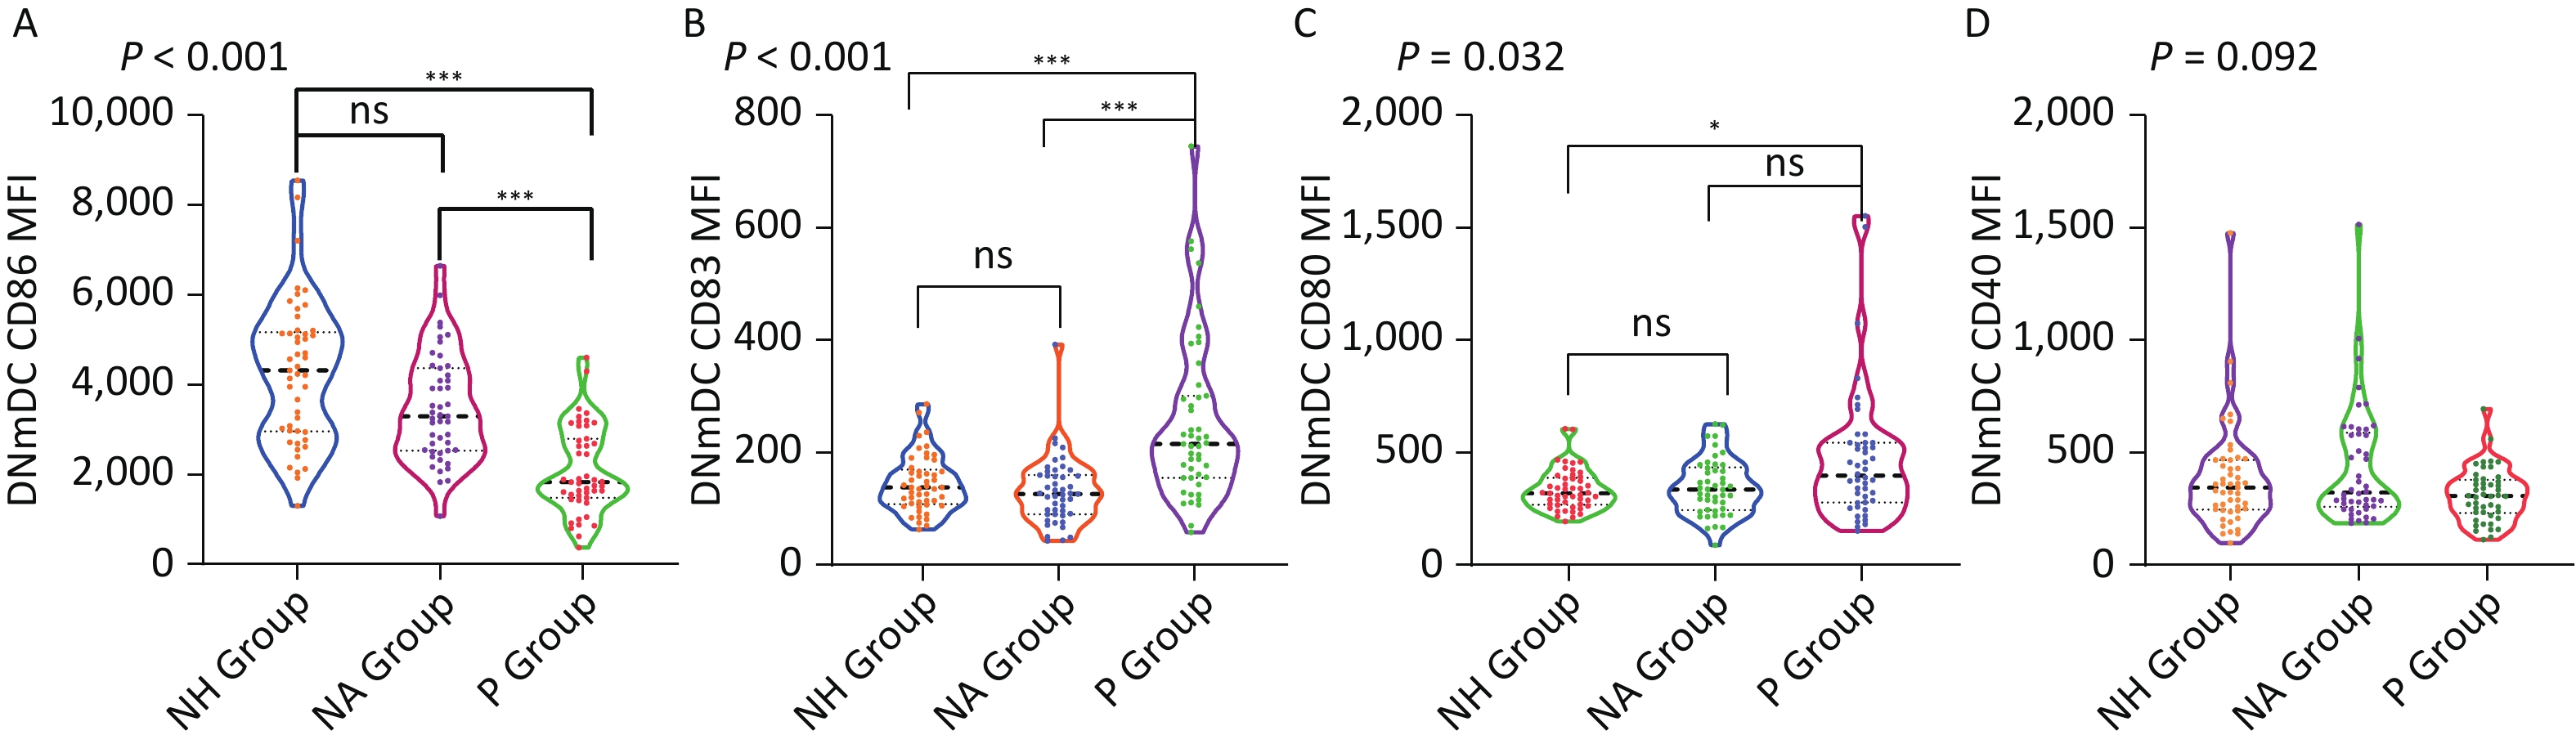
The mDC CD86 MFI was not the same among the three groups (P = 0.036). After comparing the significance levels corrected using the Bonferroni method, the P group (2634.0 [2136.0, 3469.0]) had a significantly lower mDC CD86 MFI than the NH group (3448.0 [2218.5, 4495.0]), P = 0.030 after adjustment (Table 2). The mDC1 CD86 MFI was not the same among the three groups (P = 0.007). A comparison of the significance levels corrected using the Bonferroni method revealed that the mDC1 CD86 MFI in the P group (1576.0 [1174.8, 2020.0]) was significantly higher than that in the NA group (1,131.5 [855.0, 1517.8]) (adjusted P = 0.005) (Table 2). The three groups had significantly different mDC2 CD86 MFI (P < 0.001). The mDC2 CD86 MFI was significantly higher in the P group (2826.0 [2476.0, 3686.0]) than in the NH group (2123.0 [1868.5, 2631.5]) (adjusted P < 0.001) (Table 2). The three groups had different DNmDC CD86 MFI values (P < 0.001). After comparing the significance levels corrected by the Bonferroni method, DNmDC CD86 MFI in the P group (1832.0 [1484.0, 2793.0]) was observed to be significantly lower than that in the NH (4316.0 [2957.5, 5169.0]) and NA groups (3299.0 [2534.0, 4371.0]), and P were both < 0.001 after adjustment (Figure 4 and Table 2). The pDC CD86 MFI in the three groups was not the same (P = 0.002). After comparing the significance level corrected using the Bonferroni method, it was observed that the P group (995.0 [659.3, 1279.0]) had a significantly lower pDC CD86 MFI than the NA group (619.0 [475.0, 945.0]), P = 0.001 after adjustment (Table 2).
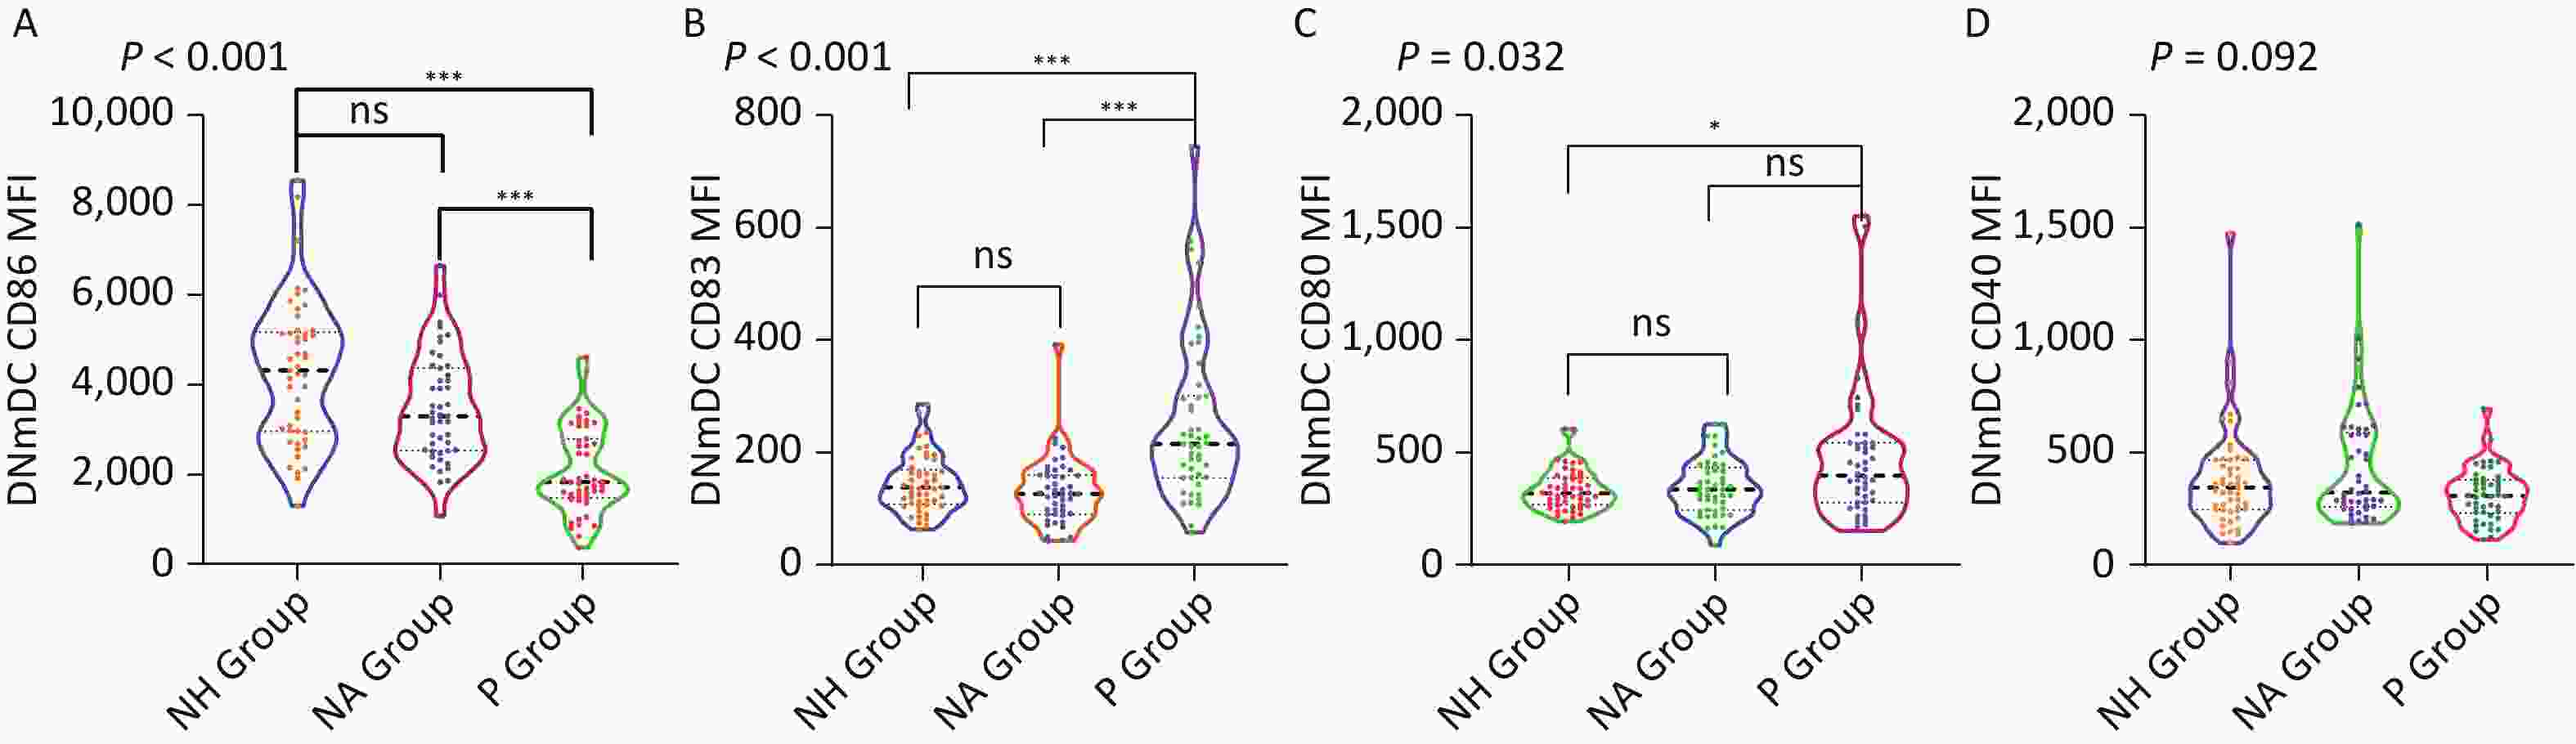
Figure 4. Comparison of the mean fluorescence intensity of surface costimulatory of CD1c/CD141 double negative myeloid dendritic cell subset.
The mDC CD83 MFI was not uniform across the three groups (P = 0.002). After comparing the significance levels corrected using the Bonferroni method, it was observed that the P group (242.0 [175.0, 318.0]) had a significantly higher mDC CD83 MFI than the NH group (175.0 [136.0, 226.0]) (adjusted P = 0.003) and NA group (182.0 [143.0, 228.0]) (adjusted P = 0.014) (Table 2). There were no significant differences in mDC1 CD83 MFI among the three groups (P = 0.465) (Table 2). The mDC2 CD83 MFI differed among the three groups (P = 0.022). After comparing the significance levels corrected using the Bonferroni method, the mDC2 CD83 MFI in the P group (255.0 [192.0, 352.0]) was significantly lower than that in the NA group (406.0 [271.0, 522.0]), P = 0.017 after adjustment (Table 2). The DNmDC CD83 MFI was not the same among the three groups (P < 0.001). After comparing the significance levels corrected by the Bonferroni method, it was observed that the DNmDC CD83 MFI level in the P group (215.0 [155.0, 301.0]) was significantly higher than that in the NH (138.0 [108.0, 167.0]) and NA groups (126.0 [90.0, 160.0]), and the adjusted P both < 0.001 (Figure 4 and Table 2). There was no significant difference in pDC CD83 MFI among the three groups (P = 0.184) (Table 2).
There were no significant differences in mDC CD80 MFI among the three groups (P = 0.051). mDC1 CD80 MFI was not consistent among the three groups (P = 0.004). After comparing the significance levels corrected by the Bonferroni method, the mDC1 CD80 MFI level in the NA group (670.5 [512.5, 1049.0]) was significantly higher than that in the NH group (553.0 [391.0, 754.0]) (adjusted P = 0.041) and the P group (485.5 [274.3, 706.8]) (adjusted P = 0.004) (Table 2). The mDC2 CD80 MFI was not the same among the three groups (P < 0.001). After comparing the significance levels corrected using the Bonferroni method, the mDC2 CD80 MFI level in the NA group (882.5 [588.0, 1232.0]) was significantly higher than that in the NH group (616.0 [489.5, 826.5]) (adjusted P = 0.006) and the P group (511.0 [391.5, 831.75]) (adjusted P < 0.001) (Table 2). The DNmDC CD80 MFI was not the same in all three groups (P = 0.032). After comparing the significance levels corrected using the Bonferroni method, the DNmDC CD80 MFI level in the P group (397.0 [277.8, 543.]) was significantly higher than that in the NH group (318 [268, 388]) (adjusted P = 0.045) (Figure 4 and Table 2). There were no significant differences in pDC CD80 MFI among the three groups (P = 0.198) (Table 2).
There were no significant differences in mDC CD40 MFI (P = 0.737) among the three groups. The mDC1 CD40 MFI was not the same among the three groups (P < 0.001). After comparing the significance levels corrected by the Bonferroni method, the mDC1 CD40 MFI level in the NA group (1421 [745, 1813]) was significantly higher than that in the NH group (624.0 [396.0, 1026.5]) (adjusted P < 0.001) and P group (546.0 [377.0, 1122.5]) (adjusted P < 0.001) (Table 2). The mDC2 CD40 MFI was not the same among the three groups (P = 0.017). After comparing the significance levels corrected using the Bonferroni method, it was observed that the P group (290.0 [193.0,613.8]) had a significantly lower mDC2 CD40 MFI than the NH group (443.0 [302.0, 861.0]) (adjusted P = 0.014) (Table 2). There were no significant differences in the DNmDC CD40 MFI (P = 0.092) and pDC CD40 MFI (P = 0.678) among the three groups (Figure 4 and Table 2).
-
Peg-IFN-α alone or in combination with NAs has become the first choice for patients with CHB to pursue functional cure goals. Choi HSJ and colleagues conducted a retrospective study that revealed that the incidence of HBsAg loss after 5 years and 10 years was 14% and 32%, respectively[7], in HBeAg-positive patients with CHB who were treated with PEG-IFN-α. According to Lee IC and colleagues, there was a 5-year and 10-year incidence rate of HBsAg loss of 9.4% and 14.2%, respectively, in a retrospective study of HBeAg-negative patients with CHB who were treated with PEG-IFN-α for 48 weeks[20]. In summary, it has been proven that PEG-IFN-α, either alone or in combination with NAs, can improve the loss rate of HBsAg in patients with CHB. However, this is insufficient to meet the World Health Organization’s 2030 goal of eliminating CHB. Hepatology experts have explored various treatment strategies to improve the rate of HBsAg loss in patients with CHB. Currently, PEG-IFN-α combined with NAs treatment strategy[14], consolidation treatment strategy[13], and prolonged treatment strategy have been proposed. Prolonged treatment refers to a prolonged PEG-IFN-α treatment period based on a standard 48 weeks of PEG-IFN-α-based treatment. According to our previous study, PEG-IFN-α treatment for HBeAg negative patients with CHB had a loss rate of HBsAg of only 3.7% after 48 weeks of treatment, but increased to 11.1% and 14.8% after 96 weeks and 120 weeks of treatment[11], respectively. However, in long-term clinical practice, it has been observed that once the decline in HBsAg levels reaches a plateau during the treatment process, continuing to extend the treatment will not result in any greater benefit. Clinical experience suggests that we can discontinue PEG-IFN-α for 3–6 months and then reintroduce it to seek a functional cure by restoring the body’s immune function, as stated in a previous case report by our team[21]. Therefore, we proposed an intermittent treatment scheme for the first time. Using this scheme, we observed a loss rate of 19.41% for HBsAg[15], which indicates that intermittent treatment is helpful in further improving the clinical cure rate for interferon-based treatment of CHB.
Intermittent therapy has been observed to be clinically effective. However, what is the potential mechanism underlying its effectiveness? IFN has an antiviral effect and can regulate the immune function of the body; therefore, is there a correlation between the arrival of the plateau period of slow HBsAg decline and changes in the body’s immune function? What dynamic changes in immune function occur during intermittent treatment? Therefore, these issues need to be addressed urgently. DCs are intermediaries between innate and adaptive immunity. The role of initiators of adaptive immune responses is crucial for anti-HBV immunity. Therefore, this study uses DCs as the research object. By comparing the proportion of mDC (which can be divided into mDC1, mDC2, and DNmDCs) and pDC in peripheral blood lymphocytes and monocytes, and the MFI of the costimulatory molecules CD86, CD83, CD40, and CD80, factors strongly related to the arrival of the plateau period were identified. Statistical analysis revealed that the P group had a significantly lower percentage of mDCs/lymphocytes and monocytes than the NH and NA groups. To determine which mDC subsets differed among the three groups, statistical analyses were conducted on mDC1/lymphocytes and monocytes (%), mDC2/lymphocytes and monocytes (%), and DNmDC/lymphocytes and monocytes (%). As expected, mDC1 in the peripheral blood of the three groups was uncommon, and there were no significant differences between the groups. Although the mDC2 in the NA group was significantly higher than that in the P and NH groups, there was no significant difference between the P and NH groups. Therefore, the mDC2 frequency was not considered to play a significant role in the arrival of the plateau period. The DNmDC/lymphocytes and monocytes (%) of the P group were significantly lower than those of the NH and NA groups, and the adjusted P values were both < 0.001. Therefore, we believe that the decrease in DNmDCs is related to the arrival of the plateau period.
Our previous research design recognized only mDC1 and mDC2, specifically CD141 and CD1c, as they are the most studied mDCs. What is this group of Lin-HLA-DR+CD11C+CD141-CD1c-mDC? We observed in the literature that there is a new mDC subgroup, which is CD16+mDC. Based on evidence, DNmDCs are likely to be CD16+DC. In 2002, MacDonald KP and others first identified five different DCs in human peripheral blood. Among them, besides the most studied pDC, mDC1, and mDC2, another 2 subsets of DCs, namely CD34+DC and CD16+DC, were identified[22]. There were no other cell populations among Lin-HLA-DR+ PBMCs. CD16+ DC was recognized as Lin-HLA-DR+CD11C+CD141-CD1c-CD16+mDC, similar to DNmDCs (Lin-HLA-DR+CD11C+CD141-CD1c-). Second, research has shown that CD16+DC accounts for the majority of mDC in peripheral blood (approximately 65%–75%)[23]. The data in Table 2 indicate that DNmDCs were more prevalent than mDC1 and mDC2 in all three patient groups. Third, CD16+DC has been proven to express high levels of myeloid DC surface markers such as CD11C and CD86[24]. According to the gating strategy (Figure 2), DNmDCs expressed CD11C. As shown in Table 2, DNmDCs expressed higher CD86 levels than pDC, similar to mDC1 and mDC2. Therefore, DNmDC was most likely CD16+DC. CD16+DC is known to be pro-inflammatory. It is a potent inducer of antigen-specific T-cell responses and can effectively activate both initial CD4+ helper T-cells and CD8+ cytotoxic T-cells. CD16+DCs can produce large amounts of pro-inflammatory cytokine tumor necrosis factor (TNF)-a under the stimulation of lipopolysaccharides, which plays an important role in inducing and amplifying inflammation[25,26]. The autocrine TNF-a of CD16+DC has a powerful regulatory effect, which can promote the massive interleukin (IL)-23 secretion and induce Th0 to Th17 differentiation[27,28]. CD16+DC are the main producers of IL-12 in the early stages after infection and then induce Th0 differentiation into Th1 through IL-12[29]. IL-12 produced by CD16+DC can effectively enhance the secretion of IFN-γ in NK cells and thus greatly enhance its natural killing activity[30,31]. NK cells strongly enhance the secretion of IL-12 and reduce immunosuppressive IL-10 release by CD16+DC[31]. Neutrophils, NK cells, and CD16+DC can co-locate in inflammatory tissues and interact with each other to promote IL-12 and IFN-γ secretion[32].
By comparing the MFI of costimulatory molecules on the surface of DNmDC (possibly CD16+mDC), we observed that the CD86 MFI of DNmDC in the P group was significantly lower than that in the NH and NA groups, and the adjusted P-values were both < 0.001. The CD83 MFI in the P group was significantly higher than that in the NH and NA groups, and the adjusted P-values were both < 0.001. CD86 is a marker of DC cell maturation, indicating that the maturity of DNmDC (which may be CD16+mDC) decreased in the P group. CD83 is a marker of the early maturation of DC; however, it is not yet known how it activates T cells, unlike CD86[33]. However, studies have observed that forced CD83 transmembrane expression can block the degradation of MHC II and CD86 driven by IL-10 in DC[34]. According to our previous study, the group without HBsAg disappearance had a significantly higher level of IL-10 than the group with HBsAg disappearance 24 weeks after IFN treatment[35]. Therefore, we speculated that the increase in IL-10 in the plateau group drove the degradation of MHC II and CD86 while forcing CD83 expression, which eventually led to a significant decrease in CD86 and a significant increase in CD83 in group P.
This study had certain limitations. First, all three groups had small sample sizes (less than 100), which may have led to deviations in the results. Secondly, this study is a cross-sectional study, which cannot study the changes of DCs and their function at various time points during PEG-IFN-α treatment; Thirdly, the clinical characteristics of the enrolled patients, including sex, age, HBsAg, HBeAg, HBV DNA, ALT, and AST, were not identical among the three groups, which may influence the significance of the results. Finally, there was no specific staining for CD16+DC in the previous experimental design, which led us to hypothesize that DNmDC was CD16+mDC.
-
In summary, our study has shown that PEG-IFN-α treatment significantly reduced the proportion of CD141 and CD1c double-negative mDC subsets (DNmDC) and their CD86 MFI in peripheral lymphocytes and monocytes of patients with CHB. Reduced DN mDC and impaired maturation may be associated with the onset of the plateau phase during intermittent interferon therapy in patients with CHB.
Relationship between Phenotypic Changes of Dendritic Cell Subsets and the Onset of Plateau Phase during Intermittent Interferon Therapy in Patients with CHB
doi: 10.3967/bes2024.033
Funds:
The study was supported by the National Key Research and Development Program [2022YFC2603500, 2022YFC2603505]; Capital Clinical Diagnostic Techniques and Translational Application Projects (Z211100002921059); Capital’s Funds for Health Improvement and Research [2022-1-2172]; Beijing Hospitals Authority Clinical Medicine Development of Special Funding Support [XMLX 202127]; National Science and Technology Major Project of China [2017ZX10203202-003].
- Received Date: 2023-07-06
- Accepted Date: 2023-12-14
-
Key words:
- CHB /
- Dendritic Cells /
- Intermittent Interferon Therapy /
- Plateau Phase
Abstract:
The authors declare that this study was conducted in the absence of any commercial or financial relationships that could be construed as potential conflicts of interest.
&These authors contributed equally to this work.
| Citation: | YANG Liu, WANG Shi Yu, JIANG Ting Ting, DENG Wen, CHANG Min, WU Shu Ling, CAO Wei Hua, LU Yao, SHEN Ge, LIU Ru Yu, GAO Yuan Jiao, XU Meng Jiao, HU Lei Ping, ZHANG Lu, XIE Yao, LI Ming Hui. Relationship between Phenotypic Changes of Dendritic Cell Subsets and the Onset of Plateau Phase during Intermittent Interferon Therapy in Patients with CHB[J]. Biomedical and Environmental Sciences, 2024, 37(3): 303-314. doi: 10.3967/bes2024.033

|

 Quick Links
 DownLoad: