


 DownLoad:


-
Osteoporosis is a systemic disease characterized by reduced bone mass and changes in the bone microstructure. The main manifestations of osteoporosis include low bone mass and degenerative changes in the bone tissue. The disease leads to increased bone fragility and fracture risk. According to the World Health Organization in 2017, osteoporosis and reduced bone mass affected approximately 200 million people worldwide[1,2]. This number is projected to double by 2040[3]. Once osteoporosis causes fractures, it markedly increases disability rates in patients, requiring long-term bed rest and potentially leading to death. This causes substantial effects on patients and their families and places a heavy economic burden on nations, making it a global public health concern[4]. Therefore, it is crucial to realize early prevention of osteoporosis, which largely depends on identifying its associated risk factors.
Metabolic syndrome (MS) is a complex disorder involving various metabolic abnormalities. The development of MS is based on insulin resistance, and MS presents as central obesity, impaired glucose tolerance, dyslipidemia, and hypertension. With population aging and dietary changes, MS has become increasingly common and is now a shared public health issue worldwide[5]. Research has found a close association between MS and various diseases, possibly related to chronic inflammation, lipotoxicity, insulin resistance, and alterations in gut microbiota[6-11]. Currently, there are five criteria for diagnosing MS, and meeting any three or more criteria is considered diagnostic of MS.
In clinical practice, it is common to encounter patients with both MS and osteoporosis. Some studies have shown a close relationship between MS and osteoporosis in the elderly population[12], whereas others have disputed this association[13]. because of the limited number of studies and small sample sizes, whether MS leads to the occurrence and progression of osteoporosis and the possible underlying mechanisms require further investigation. To explore these questions, we conducted an in-depth study using a health examination database of 139,470 participants from various provinces and municipalities in China. The association between the number of individuals meeting different MS diagnostic criteria and the presence of osteoporosis was analyzed, with the aim to preliminarily investigate the potential mechanisms through which MS may affect osteoporosis.
Bone mineral density (BMD) refers to the density of bone per unit volume. It is considered the gold standard indicator of skeletal metabolic status and is often used to assess changes in bone mass. Although peripheral dual-energy X-ray absorptiometry (DEXA) is not the gold standard for evaluating osteoporosis, it is a cost-effective and convenient method for large-scale population screening, and its results can reflect trends in BMD changes[14,15]. Furthermore, although health examinations have certain limitations as opportunistic screening, they have become increasingly popular in China, and annual examination data indicate cohorts, enabling trend analysis. Therefore, it is of practical significance to use health examinations for disease screening and early warning of diseases. This study also aimed to explore the association between MS and osteoporosis through analysis of health examination results in a large population, with the goal to provide insights and directions for early prevention of osteoporosis.
-
The study protocol was approved by the Chinese People’s Liberation Army General hospital ethics committee and complied with the principles of the Declaration of Helsinki and its contemporary amendments. The patients/participants provided their written informed consent to participate in this study.
-
This observational cross-sectional study included participants who underwent health examinations at a local hospital from September 2014 to March 2022. Exclusion criteria were individuals aged < 18 years; those with lower limb disabilities affecting daily activities; those taking lipid-lowering medications that may influence lipid results; those with a history of definite malignancies[16]; those taking long-term corticosteroids, proton pump inhibitors, hormone deprivation therapy, or selective serotonin reuptake inhibitors; and those with chronic kidney dysfunction or primary parathyroid disease that may cause secondary osteoporosis.
The follow-up cohort included participants who met the aforementioned inclusion and exclusion criteria and those who underwent health examinations at least twice, with a time interval of > 1 year between the two examinations. The baseline data were derived from the first health examination. The self-matched analysis was performed on individuals in the follow-up cohort who had a follow-up duration of ≥ 5 years and unchanged MS grouping.
-
Our survey included demographic information; smoking and alcohol consumption habits; history of noteworthy diseases, e.g, diabetes, hypertension, and dyslipidemia; use of lipid-lowering medications; height; weight; waist circumference; and blood pressure. Smoking was defined as smoking ≥ 10 cigarettes per day consecutively for > 1 year[17]. Alcohol consumption was categorized as moderate drinking (no alcohol consumption or alcohol intake not exceeding 25 g for adult men and 15 g for adult women per day) or heavy drinking (average daily alcohol intake exceeding 25 g for men and 15 g for women)[18]. Blood pressure was measured according to the 2005 Chinese Guidelines for the Management of Hypertension.
-
Fasting venous blood samples were collected to measure total cholesterol (TC), triglycerides (TG), high-density lipoprotein cholesterol (HDL-C), low-density lipoprotein cholesterol (LDL-C), fasting blood glucose (FBG), uric acid (UA), glycated hemoglobin A1c (HbA1c), high-sensitivity C-reactive protein (hs-CRP), creatinine (Scr), blood urea nitrogen (BUN), uric acid (Ua), serum-free calcium (Ca2+), phosphorus (P), intact parathyroid hormone (iPTH), and serum 25-hydroxyvitamin D3 (VD3). Homocysteine (Hcy) was measured using the enzymatic cycling method[19].
-
The average BMD, T-score, and Z-score were measured at the 1/3 distal radius of the dominant hand using the Korean OsteoSys EXA-3000 DEXA machine (SFDA Machine [Import] No. 2009 3312468). According to the 2022 Guidelines for the Diagnosis and Treatment of Primary Osteoporosis, postmenopausal women and men aged ≥ 50 years with a T-score ≤ –2.5 standard deviations (SDs) were suspected to have osteoporosis, whereas premenopausal women and men aged < 50 years with a Z-score ≤ –2.0 SDs were also suspected to have osteoporosis[20]. Those who did not meet the criteria for suspected osteoporosis were allocated to the non-osteoporosis group (control group).
-
According to the 2016 Chinese Guideline for the Management of Dyslipidemia in Adults[21] MS was diagnosed based on the following five criteria: (1) central or abdominal obesity, with waist circumferences ≥ 90 cm for men and ≥ 85 cm for women; (2) high blood glucose level, with a FBG level ≥ 6.10 mmol/L and 2-hour postprandial blood glucose level ≥ 7.80 mmol/L and/or a confirmed diagnosis of diabetes under treatment; (3) high blood pressure, with blood pressure ≥ 130/85 mmHg or a confirmed diagnosis of hypertension under treatment; (4) fasting TG level ≥ 1.7 mmol/L; and (5) fasting HDL-C level < 1.0 mmol/L.
Participants who did not meet any of these MS criteria were classified as the 0 MS criteria group; those meeting any one criterion were classified as the 1 MS criterion group; those meeting any two criteria were classified as the 2 MS criteria group, and those meeting ≥ 3 criteria were classified as the ≥ 3 MS criteria group (MS group).
-
Participants with multiple health examination results formed the follow-up cohort. With the first examination as the baseline, the intervals between two examinations for the same participant were ≥ 365 days and < 730 days for the 1-year follow-up, ≥ 730 days and < 1,085 days for the 2-year follow-up, and so on, with an interval of ≥ 5 years defined as the ≥ 5-year follow-up. When a participant was lost to follow-up during the follow-up period, the follow-up was considered as terminated. The participants of the follow-up cohort accept the medication of anti-osteoporosis during the intervals between two examinations.
-
Survey data were coded and quantified before inputting them into the computer for statistical analysis using Stata 11.0 software (StataCorp). Normality testing was conducted using the Kolmogorov–Smirnov method. Quantitative data are presented as mean ± SD, and categorical data are presented as percentage. The chi-square test, trend test, t-test, one-way analysis of variance, and Bonferroni test were used to perform pairwise comparisons. For univariate and multivariate logistic regression analyses, differences with a P-value < 0.05 were considered statistically significant.
-
A total of 139,470 participants were included in this study, with 81,368 males (58.34%) and 58,102 females (41.66%). Participants’ mean age was 45.66 ± 10.72 years. Among them, 80,170 were included in the follow-up cohort, with 2,660 meeting the criteria for the self-matched analysis. The flowchart of participant selection is presented in Figure 1.
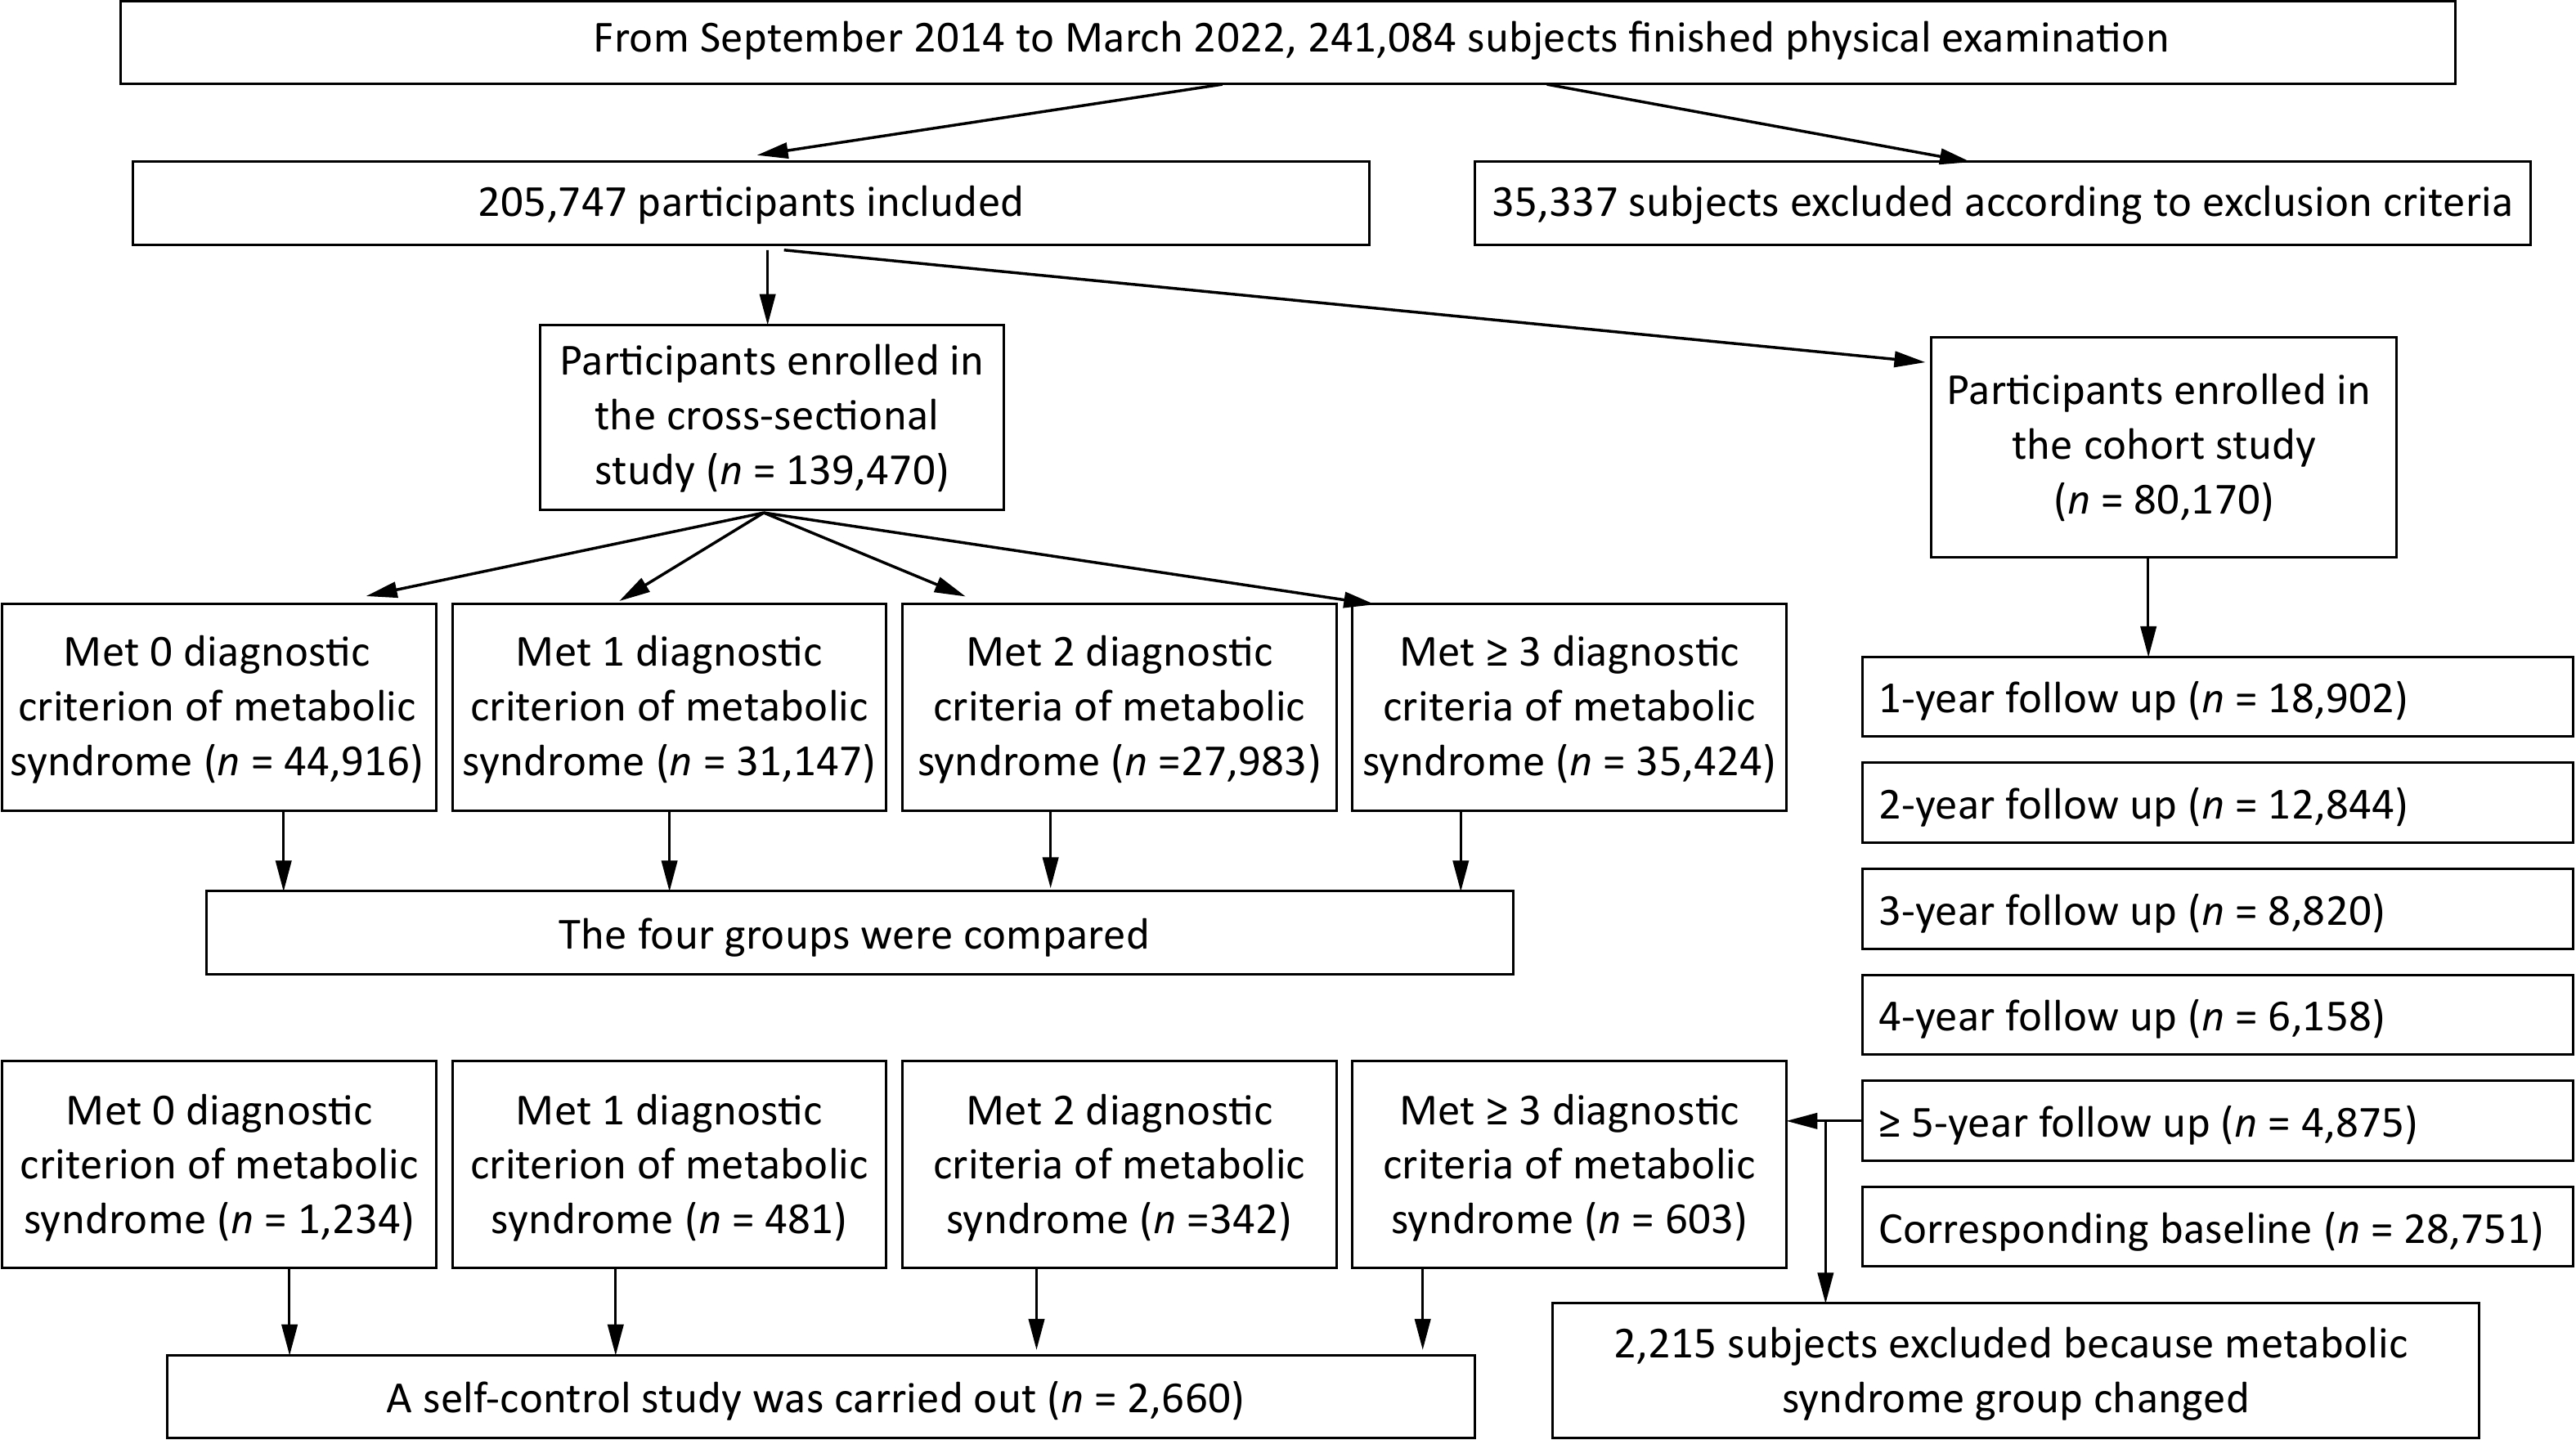
Figure 1. Flow chart of the study population.
-
In total, 21,494 participants (15.41%) were included in the suspected osteoporosis group, with a mean BMD of 0.364 ± 0.071 g/cm2. The control group comprised 117,976 participants (84.59%) with a mean BMD of 0.499 ± 0.079 g/cm2. Table 1 compares health examination-related results between the two groups. Compared with the control group, the suspected osteoporosis group had a higher proportion of males (χ2 = 27.28, P < 0.001), older patients (t = 68.38, P < 0.001), and higher rates of smokers (χ2 = 215.36, P < 0.001) and heavy drinkers (χ2 = 215.36, P < 0.001). In addition, the suspected osteoporosis group exhibited significantly higher levels of metabolic-related indicators such as body mass index (BMI), waist circumference, FBG, HbA1c, blood pressure, LDL-C, and Hcy compared with the control group (P < 0.01). The inflammatory marker hs-CRP was also significantly elevated in the suspected osteoporosis group compared with the control group (P < 0.01), whereas no statistically significant difference was observed in body weight and HDL-C level between the two groups.
Characteristics Control group (n = 117,976) Suspected osteoporosis (n = 21,494) Statistics BMD (g/cm2) 0.499 ± 0.079 0.364 ± 0.071 t = 236.89, P < 0.001 Body mass (kg) 69.75 ± 13.32 69.72 ± 14.06 t = 0.38, P = 0.702 BMI (kg/m2) 24.59 ± 3.59 24.83 ± 3.79 t = 8.54, P < 0.001 Waist (cm) 85.54 ± 10.95 87.69 ± 11.18 t = 26.42, P < 0.001 FBG (mmol/L) 5.67 ± 1.29 5.89 ± 1.53 t = 23.34, P < 0.001 HbA1c (%) 5.79 ± 0.78 5.98 ± 0.92 t = 31.18, P < 0.001 Systolic blood pressure (mmHg) 119.97 ± 15.84 124.19 ± 16.97 t = 35.53, P < 0.001 Diastolic blood pressure (mmHg) 80.10 ± 11.74 81.95 ± 11.81 t = 21.27, P < 0.001 TC (mmol/L) 4.69 ± 0.89 4.83 ± 0.94 t = 20.69, P < 0.001 TG (mmol/L) 1.62 ± 1.31 1.71 ± 1.30 t = 9.56, P < 0.001 LDL-C (mmol/L) 2.98 ± 0.79 3.09 ± 0.83 t = 19.13, P < 0.001 Sex χ2 = 27.28, P < 0.001 Female 49,495 (41.95) 8,607 (40.04) Male 68,481 (58.05) 12,887 (59.96) Age (year) 44.48 ± 10.21 50.19 ± 12.26 t = 68.38, P < 0.001 Smoking status χ2 = 215.36, P < 0.001 No smoking 86,892 (73.65) 14,875 (69.21) Smoking 31,084 (26.35) 6,619 (30.79) Drinking status χ2 = 66.36, P < 0.001 Limited drinking 83,487 (70.77) 14,994 (69.76) Excessive drinking 34,489 (29.23) 6,500 (30.24) Hcy (μmol/L) 12.63 ± 7.13 13.32 ± 7.15 t = 12.82, P < 0.001 hs-CRP (mg/dL) 0.163 ± 0.479 0.203 ± 0.558 t = 10.63, P < 0.001 Scr (μmol/L) 69.66 ± 15.02 68.70 ± 16.08 t = 8.55, P < 0.001 BUN (mmol/L) 4.89 ± 1.23 5.02 ± 1.29 t = 14.84, P < 0.001 Ca2+ (mmol/L) 2.336 ± 0.085 2.342 ± 0.086 t = 8.66, P < 0.001 P (mmol/L) 1.167 ± 0.149 1.181 ± 0.151 t = 12.06, P < 0.001 iPTH (ng/L) 45.95 ± 16.35 48.13 ± 29.39 t = 4.55, P < 0.001 Ua (μmol/L) 329.85 ± 90.97 328.02 ± 87.96 t = 2.73, P = 0.006 VD3 (ng/mL) 17.27 ± 7.35 17.73 ± 7.57 t = 2.53, P = 0.012 HDL-C (mmol/L) 1.32 ± 0.34 1.32 ± 0.35 t = 1.36, P = 0.174 Note. MS: metabolic syndrome; BMI:body mass index; BMD: bone mineral density; TC: Total cholesterol; TG: Triglyceride; HDL-C: high density lipoprotein cholesterol; LDL-C: low density lipoprotein cholesterol; FBG: fasting blood glucose; UA: blood uric acid; HbA1c: hemoglobin A1c; hs-CRP: high sensitivity C-reactive protein; Scr: serum creatinine; BUN: urea nitrogen; Hcy: blood homocysteine; iPTH: intact Parathyroid Hormone. Table 1. Comparison of data between groups according to bone mineral density screening results (n =139,470)
-
In total, 44,916 participants were included in the 0 MS criteria group, 31,147 in the 1 MS criterion group, 27,983 in the 2 MS criteria group, and 35,424 in the ≥ 3 MS criteria group. Table 2 presents a comparison of the baseline data for the four MS groups. All indicators, except for iPTH, exhibited statistically significant differences among the groups (P < 0.001). As the number of MS diagnostic criteria increased from the 0 MS criteria group to the MS group, there was a gradual increase in the proportion of males, smoking rate, heavy drinking rate, age, body weight, and BMD (P < 0.001). The inflammatory marker hs-CRP level showed a gradual increase, whereas the HDL-C level demonstrated a gradual decrease with increasing MS criteria (P < 0.001). Additionally, with an increase in the number of MS criteria, the proportion of suspected osteoporosis cases significantly increased (P < 0.001).
Characteristics Met none diagnostic
criterion of MS
(n = 44,916)Met one diagnostic
criterion of MS
(n = 31,147)Met two diagnostic
criteria of MS
(n = 27,983)Met ≥ 3 diagnostic
criteria of MS
(n = 35,424)Statistics Sex χ2 = 24,000, P < 0.001 Female 30,746 (68.45) 13,426 (43.11) 7,947 (28.40) 5,983 (16.89) Male 14,170 (31.55) 17,721 (56.89) 20,036 (71.60) 29,441 (83.11) Smoking status χ2 = 11,000, P < 0.001 No smoking 38,613 (85.97) 23,506 (75.47) 18,937 (67.67) 20,711 (58.47) Smoking 6,303 (14.03) 7,641 (24.53) 9,046 (32.33) 14,713 (41.53) Drinking status χ2 = 16,000, P < 0.001 Limited drinking 39,522 (87.99) 23,082 (74.11) 17,482 (62.47) 18,395 (51.93) Excessive drinking 5,394 (12.01) 8,065 (25.89) 10,501 (37.53) 17,029 (48.07) BMD screening Relatively normal BMD 39,747 (88.49) 26,528 (85.17) 22,977 (82.11) 28,724 (81.09) χ2 = 998.15, P < 0.001 Suspected osteoporosis 5,169 (11.51) 4,619 (114.83) 5,006 (17.89) 6,700 (18.91) Age (year) 40.66 ± 10.57 46.79 ± 10.46* 48.61 ± 9.94*# 48.68 ± 9.35*# F = 5,627.83, P < 0.001 BMI (kg/m2) 21.70 ± 2.44 24.22 ± 2.79 26.09 ± 2.94*# 27.56 ± 3.03*#@ F = 32,582.08, P < 0.001 Body mass (kg) 59.37 ± 8.78 68.07 ± 10.79* 74.72 ± 11.38*# 80.46 ± 11.63*#@ F = 29,015.81, P < 0.001 Waist (cm) 75.81 ± 7.03 84.70 ± 8.08* 90.91 ± 8.04*# 95.67 ± 7.82*#@ F = 49,176.86, P < 0.001 Systolic blood pressure (mmHg) 108.06 ± 9.64 120.29 ± 13.61* 126.76 ± 14.73*# 132.01 ± 14.43*#@ F = 25,315.30, P < 0.001 Diastolic blood pressure (mmHg) 70.99 ± 7.06 80.00 ± 9.86* 84.74 ± 10.52*# 89.21 ± 10.19*#@ F = 28,008.72, P < 0.001 BMD (g/cm2) 0.462 ± 0.086 0.478 ± 0.095* 0.486 ± 0.095*# 0.495 ± 0.090*#@ F = 977.61, P < 0.001 TC (mmol/L) 4.48 ± 0.80 4.73 ± 0.88* 4.82 ± 0.92*# 4.89 ± 0.98*#@ F = 1,672.26, P < 0.001 TG (mmol/L) 0.91 ± 0.32 1.29 ± 0.61* 1.73 ± 1.02*# 2.77 ± 1.83*#@ F = 20,815.34, P < 0.001 LDL-C (mmol/L) 2.77 ± 0.73 3.08 ± 0.77* 3.08 ± 0.86*# 3.17 ± 0.80*#@ F = 1,899.98, P < 0.001 HDL-C (mmol/L) 1.54 ± 0.32 1.37 ± 0.31* 1.24 ± 0.28*# 1.06 ± 0.25*#@ F = 18,679.94, P < 0.001 FBG (mmol/L) 5.13 ± 0.36 5.44 ± 0.80* 5.76 ± 1.22*# 6.62 ± 1.95*#@ F = 10,756.11, P < 0.001 HbA1c (%) 5.51 ± 0.31 5.69 ± 0.55* 5.86 ± 0.78*# 6.31 ± 1.14*#@ F = 8,157.45, P < 0.001 Hcy (μmol/L) 11.17 ± 6.30 12.69 ± 7.09* 13.55 ± 7.44*# 13.9 ± 87.49*#@ F = 1,162.34, P < 0.001 hs-CRP (mg/dL) 0.108 ± 0.348 0.164 ± 0.553* 0.193 ± 0.527*# 0.228 ± 0.545*#@ F = 399.77, P < 0.001 Cr (μmol/L) 64.53 ± 13.39 69.62 ± 15.33* 72.27 ± 14.95*# 73.57 ± 15.62*#@ F = 2,937.67, P < 0.001 Bun (mmol/L) 4.57 ± 1.16 4.91 ± 1.24* 5.08 ± 1.22*# 5.19 ± 1.26*#@ F = 1,973.15, P < 0.001 Ua (μmol/L) 281.25 ± 73.17 321.57 ± 81.81* 352.61 ± 84.60*# 379.68 ± 89.37*#@ F = 10508.23, P < 0.001 Ca2+ (mmol/L) 2.326 ± 0.084 2.336 ± 0.085* 2.342 ± 0.086*# 2.349 ± 0.085*#@ F = 561.73, P < 0.001 K+ (mmol/L) 4.227 ± 0.293 4.252 ± 0.302* 4.252 ± 0.304* 4.236 ± 0.306*#@ F = 60.39, P < 0.001 P (mmol/L) 1.186 ± 0.145 1.162 ± 0.149* 1.159 ± 0.151* 1.162 ± 0.152* F = 287.46, P < 0.001 iPTH (ng/L) 46.53 ± 25.06
(n = 2,832)45.96 ± 17.32
(n = 2,425)46.19 ± 16.70
(n = 2,533)46.56 ± 16.84
(n = 3,410)F = 0.60, P = 0.6133 VD3 (ng/mL) 16.61 ± 7.29
(n = 2,832)17.53 ± 7.85*
(n = 2,425)17.65 ± 7.35*
(n = 2,533)17.62 ± 7.11*
(n = 3,410)F = 13.02, P < 0.001 Note. MS: metabolic syndrome; BMI: body mass index; BMD: bone mineral density; TC: Total cholesterol; TG: Triglyceride; HDL-C: high density lipoprotein cholesterol; LDL-C: low density lipoprotein cholesterol; FBG: fasting blood glucose; UA: blood uric acid; HbA1c: hemoglobin A1c; hs-CRP: high sensitivity C-reactive protein; Cr: serum creatinine; Bun: urea nitrogen; Hcy: blood homocysteine; iPTH: intact Parathyroid Hormone. *compared with met 0 diagnostic criteria of MS, P < 0.05; #compared with Met one diagnostic criteria of MS, P < 0.05; @compared with Met two diagnostic criteria of MS, P < 0.05. Table 2. Comparison of basic data among groups according to diagnostic criteria of MS (n = 139,470)
In the follow-up cohort, there were 28,751 participants at baseline, 18,902 at 1-year follow-up, 12,844 at the 2-year follow-up, 8,820 at the 3-year follow-up, 6,158 at the 4-year follow-up, and 4,875 at the ≥ 5-year follow-up. The trend test revealed that the proportion of suspected osteoporosis cases increased gradually among the MS groups at baseline and each follow-up period (P < 0.05). Moreover, the MS group consistently exhibited the highest incidence of suspected osteoporosis. However, when considering the longitudinal aspect of the follow-up time, there was no significant increase in the proportion of suspected osteoporosis cases among the different MS groups (P > 0.05), as shown in Table 3.
Items Met none diagnostic
criterion of MSMet one diagnostic
criterion of MSMet two diagnostic
criteria of MSMet ≥ 3 diagnostic criteria
of MS (MS group)Statistics Control group Suspected osteoporosis Control group Suspected osteoporosis Control group Suspected
osteoporosisControl
groupSuspected osteoporosis χ2 and
P valueBaseline
(n = 28,571)9,725 (88.76) 1,232 (11.24) 5,602 (86.00) 912 (14.00) 4,427
(84.26)827 (15.74) 4,858
(83.10)988 (16.90)* 123.76,
P < 0.0011-year
(n = 18,902)6,347 (89.34) 757 (10.66) 3,873 (86.07) 627 (13.93) 2,939
(84.65)533 (15.35) 3,210
(83.90)616 (16.10)* 82.63,
P < 0.0012-year
(n = 12,844)3,893 (89.17) 473 (10.83) 2,656 (86.04) 431 (13.96) 2,122
(84.74)382 (15.26) 2,405
(83.30)482 (16.70)* 57.27,
P < 0.0013-Year
(n = 8,820)2,695 (90.65) 278 (9.35) 1,845 (86.26) 294 (13.74) 1,433
(84.99)253 (15.01) 1,710
(84.57)312 (15.43)* 52.89,
P < 0.0014-Year
(n = 6,158)1,725 (88.87) 216 (11.13) 1,280 (86.49) 200 (13.51) 1,057
(85.04)186 (14.96) 1,244
(83.27)250 (16.73)* 23.91,
P < 0.001≥ 5-Year
(n = 4,875)1,281 (87.74) 179 (12.26) 1,046 (87.46) 150 (12.54) 914
(84.08)173 (15.92) 948
(83.75)184 (16.25)* 13.79,
P = 0.003χ2 = 0.24, P = 0.6263 χ2 = 1.35, P = 0.2454 χ2 = 0.21, P = 0.6487 χ2 = 0.57, P = 0.4519 Note. MS: metabolic syndrome; *the highest incidence among the four groups. Table 3. Comparison of follow-up data among groups according to diagnostic criteria of MS
-
Logistic regression analysis was performed with suspected osteoporosis as the dependent variable and the results of MS grouping as the independent variable. All odds ratios (ORs) for the 1, 2, and ≥ 3 MS criteria groups were > 1, indicating that for each additional MS diagnostic criterion, the likelihood of developing suspected osteoporosis increased by an average of 1.21 times (Z = 30.86, P < 0.001, 95% confidence interval: 1.200–1.230). After adjusting for age, sex, smoking, alcohol consumption, and other factors, the ORs for the 2 and ≥ 3 MS criteria groups remained > 1, indicating that MS grouping is an independent risk factor for the development of suspected osteoporosis (Table 4).
Items OR Z P 95% CI MS group (Unadjusted) Met none diagnostic criterion of MS 1.000 Met one diagnostic criterion of MS 1.338 13.42 0.000 1.283-1.397 Met two diagnostic criteria of MS 1.294 24.01 0.000 1.267-1.322 Met ≥ 3 diagnostic criteria of MS (MS group) 1.215 29.11 0.000 1.199-1.231 MS group (Adjusted) Met none diagnostic criterion of MS 1.000 Met one diagnostic criterion of MS 1.025 1.07 0.284 0.979-1.073 Met two diagnostic criteria of MS 1.099 7.65 0.000 1.073-1.127 Met ≥ 3 diagnostic criteria of MS (MS group) 1.090 10.39 0.000 1.073-1.108 Note. MS: metabolic syndrome; Adjusted factors: Age (years), Sex (female = 0, male = 1), Smoking status (no smoking = 0, smoking = 1), Drinking status (limited drinking = 0, excessive drinking = 1) Table 4. Results of logistics regression analysis
-
In the follow-up cohort, we compared baseline and follow-up examination results of participants who completed health examinations at least 5 years later (median 1,925 days, minimum 1,825 days, maximum 3,195 days). Only individuals whose MS grouping remained unchanged during the 5-year follow-up were included in the self-matched analysis. A total of 2,660 participants were included, with 1,191 females (44.77%) and 1,469 males (55.23%). Table 5 presents relevant data and comparison results. After an average increase in age of 5.47 years, indicators related to MS, such as BMI, body weight, waist circumference, blood pressure, FBG and HbA1c, increased significantly compared to baseline (P < 0.01). Furthermore, Scr, BUN, and Ua also showed significant increases (P < 0.01), whereas BMD exhibited a significant decrease (P < 0.01). However, there were no significant changes in TC, TG, LDL-C, HDL-C, FBG, and hs-CRP levels.
Items Baseline (n = 2,660) ≥ 5 year follow-up (n = 2,660) Mean change Statistics BMD screening χ2 = 0.23, P = 0.634 Relatively normal BMD 2,297 (86.35) 2,285 (85.90) −12 Suspected osteoporosis 363 (13.65) 375 (14.10) +12 Age (year) 42.63 ± 9.77 48.09 ± 9.86* +5.47 t = 20.31, P < 0.001 BMI (kg/m2) 23.58 ± 3.68 24.18 ± 3.71 +0.59 t = 5.89, P < 0.001 Body mass (kg) 67.23 ± 13.83 68.04 ± 13.78 +0.804 t = 2.21, P = 0.034 Waist (cm) 82.78 ± 11.87 84.33 ± 11.48* +1.55 t = 4.84, P < 0.001 BMD (g/cm2) 0.482 ± 0.087 0.473 ± 0.087 −0.008 t = 3.49, P < 0.001 Systolic blood pressure (mmHg) 115.12 ± 15.62 118.09 ± 15.43 +2.97 t = 6.99, P < 0.001 Diastolic blood pressure (mmHg) 76.73 ± 11.92 79.28 ± 11.57 +2.55 t = 7.91, P < 0.001 TC (mmol/L) 4.64 ± 0.87 4.61 ± 0.84 −0.03 t = 1.38, P =0.167 TG (mmol/L) 1.46 ± 1.19 1.48 ± 1.19 +0.019 t = 0.58, P = 0.559 LDL-C (mmol/L) 2.90 ± 0.78 2.90 ± 0.77 −0.004 t = 0.21, P = 0.828 HDL-C (mmol/L) 1.39 ± 0.38 1.39 ± 0.39 +0.002 t = 0.17, P = 0.869 FBG (mmol/L) 5.53 ± 1.18 5.63 ± 1.27 +0.103 t = 3.06, P = 0.002 HbA1c (%) 5.70 ± 0.68 5.84 ± 0.75 +0.14 t = 6.99, P < 0.001 Hcy (μmol/L) 12.14 ± 7.00 11.84 ± 5.90 −0.30 t = 1.59, P = 0.110 hs-CRP (mg/dL) 0.149 ± 0.478 0.135 ± 0.441 −0.013 t = 0.99, P = 0.319 Cr (μmol/L) 69.11 ± 14.32 70.46 ± 16.31 +1.36 t = 3.22, P < 0.001 Bun (mmol/L) 4.59 ± 1.13 4.89 ± 1.24 +0.30 t = 8.26, P < 0.001 Ua (μmol/L) 313.73 ± 88.12 322.52 ± 88.65 +8.78 t = 3.62, P < 0.001 Ca2+ (mmol/L) 2.328 ± 0.083 2.330 ± 0.083 +0.002 t = 0.84, P = 0.403 K+ (mmol/L) 4.204 ± 0.290 4.297 ± 0.300 +0.092 t = 10.97, P < 0.001 P (mmol/L) 1.166 ± 0.139 1.160 ± 0.147 −0.005 t = 1.21, P = 0.225 iPTH (ng/L) 46.27 ± 15.73 45.09 ± 15.56 −1.19 t = 0.65, P = 0.515 VD3 (ng/mL) 15.46 ± 6.56 18.32 ± 8.06 +2.86 t = 3.20, P = 0.002 Note. BMI: body mass index; BMD: bone mineral density; TC: total cholesterol; TG: Triglyceride; HDL-C: high density lipoprotein cholesterol; LDL-C: low density lipoprotein cholesterol; FBG: fasting blood glucose; UA: blood uric acid; HbA1c: hemoglobin A1c; hs-CRP: high sensitivity C-reactive protein; Cr: serum creatinine; Bun: urea nitrogen; Hcy: blood homocysteine; iPTH: intact parathyroid hormone. Table 5. Comparison of clinical data before and after at least 5 years follow-up after (n = 2,660)
In the self-matched analysis, the proportion of suspected osteoporosis cases gradually increased with the number of MS diagnostic criteria at baseline and at least 5 years later (P < 0.05). In the 0 MS criteria group (n = 1,234), one case (0.08%) progressed to suspected osteoporosis. In the 1 MS criterion group (n = 481), one case (0.21%) progressed to suspected osteoporosis. In the 2 MS criteria group (n = 342), three cases (0.87%) progressed to suspected osteoporosis. In the MS group (n = 603), seven cases (1.15%) progressed to suspected osteoporosis. These findings indicate that the proportion of individuals developing suspected osteoporosis in the MS group was significantly higher than that in the 0 MS criteria group (1.15% versus 0.08%, χ2 = 10.76, P = 0.001).
The self-matched comparison of BMD values in the 0 MS criteria group showed no significant difference (t = 1.62, P = 0.106), suggesting that a 5-year increase in age in individuals without any MS criteria has little effect on BMD. Nevertheless, in the other three groups (1, 2, and ≥ 3 MS criteria), there was a significant decrease in BMD values (P < 0.05), indicating a more pronounced decrease in BMD in individuals with MS features as they age (Table 6).
Items Baseline (n = 2,660) ≥ 5 year follow-up (n = 2,660) Before and after comparison of BMD Relatively normal BMD Suspected osteoporosis Total BMD Relatively normal BMD Suspected osteoporosis Total BMD Met none diagnostic criterion of MS 1,088 (88.17) 146 (11.83) 1,234 0.459 ± 0.084 1,087 (88.09) 147 (11.91) 1,234 0.453 ± 0.083 t = 1.62, P = 0.106 Met one diagnostic criterion of MS 417 (86.69) 64 (13.31) 481 0.496 ± 0.092* 416 (86.49) 65 (13.51) 481 0.484 ± 0.095* t = 1.98, P = 0.048 Met two diagnostic criteria of MS 283 (82.75) 59 (17.25) 342 0.498 ± 0.080* 280 (81.87) 62 (18.13) 342 0.485 ± 0.086* t = 2.05, P = 0.041 Met ≥ 3 diagnostic criteria of MS (MS group) 509 (84.41) 94 (15.59) 603 0.509 ± 0.078*# 502 (83.25) 101 (16.75) 603 0.497 ± 0.083*# t = 2.48, P = 0.013 Statistics χ2 = 9.20, P = 0.027 F = 61.38,
P < 0.001χ2 = 13.09, P = 0.004 F = 45.45,
P < 0.001Note. MS: metabolic syndrome; BMD: bone mineral density. *Compared with met 0 diagnostic criterion of M, P < 0.05; #Compared with Met one diagnostic criterion of MS, P < 0.05. Table 6. The self-control study of BMD according to the standard of metabolic syndrome
-
Osteoporosis is a typical age-related disease, and its harm is undeniable[22-24]. With the increasing aging population, the prevalence of osteoporosis will continue to increase. Simultaneously, as the living standards of residents improve, the incidence of MS in the population, particularly among middle-aged and elderly individuals, is increasing. MS, centered around obesity, is a combination of various cardiovascular risk factors, involving multiple abnormalities in blood lipids, blood glucose, and blood pressure. As the world’s population ages, MS and osteoporosis are more likely to coexist in the same patient[25], which can affect quality of life and medical resources. Earlier studies suggested that MS has certain effects on osteoporosis[26,27]. Small-sample studies of women in eastern China suggested that MS is an independent risk factor for osteoporosis[28]. However, recent meta-analyses have found that MS may be a protective factor against osteoporosis[29]. Some studies even suggested that there is no correlation between the two[13]. Thus, the relationship between MS and osteoporosis is likely to be more complicated, and different conclusions may be drawn based on different populations and diagnostic criteria.
The observational cross-sectional study showed that in the suspected osteoporosis group, there was a higher proportion of males, older patients, and higher rates of alcohol consumption and smokers than in the control group. Besides, the metabolic indicators, including values of BMI, waist circumference, FBG, HbA1c, blood pressure, LDL-C, and Hcy in that group, were significantly higher than those in the control group. These findings suggest that osteoporosis may involve the abnormality of multiple metabolic indicators, and these factors may also be risk factors for osteoporosis. The proportion of suspected osteoporosis in the MS group was significantly increased compared with that in the 0 MS criteria group. Even after adjusting for age, sex, smoking, and alcohol consumption, the ORs of the 2 MS criteria group and MS group remained > 1. These results not only indicate an association between MS and suspected osteoporosis but also show a more significant correlation as the number of MS diagnostic criteria increases.
Previous studies have demonstrated that aging is an independent risk factor for osteoporosis. However, according to the results of the present study, as the follow-up time increased, the proportion of suspected osteoporosis did not show a gradual increase in each MS group. This suggests that in the follow-up cohort of individuals with an average age of 45.34 ± 10.47 years, aging alone had little effect on suspected osteoporosis within our follow-up time range. However, during the successive follow-ups, the proportion of suspected osteoporosis showed a gradual increase among the MS groups. This indicates that the effect of risk factors related to MS on the occurrence of suspected osteoporosis outweighs the effect of aging alone.
Previous research has suggested that weight gain may increase bone density, serving as a protective factor against osteoporosis[30,31]. Improper weight loss can lead to osteoporosis and even fractures[32,33]. However, some individuals who gain weight are often obese, and obesity is frequently accompanied by a chronic inflammatory status and other metabolic abnormalities. The relationship between obesity and osteoporosis remains unclear[34,35]. The current study found significant differences in weight and BMD among the different MS groups, showing a gradual increase with the number of MS diagnostic criteria. This was also accompanied by a significant increase in the proportion of suspected osteoporosis cases. In a further self-matched analysis of 2,660 individuals with consistent MS grouping over 5 years, weight, BMI, and waist circumference increased, while BMD decreased over time. The proportion of suspected osteoporosis showed a gradual increase with the number of MS diagnostic criteria at baseline and after 5 years of follow-up. This seems to contradict previous research on the relationship between weight and osteoporosis. However, these results suggest that even if weight gain may promote increased bone density, individuals with MS, especially those with abdominal obesity, are more prone to osteoporosis. The proportion of individuals who transitioned from normal BMD to suspected osteoporosis was higher in the MS group than in the 0 MS criteria group. There was no significant difference in BMD before and after self-matched analysis in the 0 MS criteria group, whereas the other three MS groups showed a significant decrease in BMD. This further suggests that the effect of age alone on BMD is not significant within a median follow-up period of 1,925 days (5.27 years) in the absence of risk factors related to MS. However, once combined with MS-related risk factors, BMD significantly decreased with increasing age. Although the effect of weight may have led to a higher baseline BMD in the MS group than in the 0 MS criteria group, the presence of MS-related risk factors makes the MS group more likely to progress to suspected osteoporosis with age.
On the basis of the aforementioned results, we believed that MS is a significant risk factor for osteoporosis, and it is worthy of attention and further research. There are several possible mechanisms of the association between the two. First, insulin resistance is a recognized pathogenesis of MS[36,37]. Inflammatory factors related to insulin resistance promote osteoclast differentiation, enhance bone resorption capability, and inhibit osteoblast formation, disrupting the balance between bone resorption and formation, leading to decreased bone mass[38]. Although this study did not directly assess insulin resistance, based on various MS-related indicators, the severity of insulin resistance should increase from the group that met none of the MS criteria to those that met 1, 2, and multiple MS criteria. Second, abnormal blood lipid levels may affect the progression of osteoporosis. Previous research indicated that HDL-C can prevent osteoblast apoptosis caused by oxidative lipids, and a high HDL-C level is more likely to maintain the integrity of osteoblast lysosomes. These findings suggest that a high HDL-C level has a protective effect on osteoblasts, thus increasing bone density and reducing fracture risk[39]. Moreover, increased LDL-C levels inhibit osteoblast activity and enhance osteoclast activity, leading to osteoporosis. A high LDL-C level can cause a decrease in the mechanical properties and trabecular structure parameters of bone tissue, leading to trabecular bone loss and substantially reduced skeletal mechanical strength[40]. Indeed, this study found that as the number of MS diagnostic criteria increased from 0 to 1, 2, and multiple MS criteria, the HDL-C level decreased while the LDL-C level increased. Therefore, it is hypothesized that decreased HDL-C and increased LDL-C levels in the MS population may be among the factors influencing the occurrence and development of osteoporosis. Third, a chronic inflammatory state may be involved in the occurrence and development of osteoporosis. Previous studies have found that levels of inflammatory factors in patients with osteoporosis are elevated, with CRP and interleukin-6 being the most common. Besides, the hs-CRP level has a negative correlation with bone density[41,42]. This study also found a gradual increase in hs-CRP levels from the group that met none of the MS criteria to those that met 1, 2, and multiple MS criteria. Fourth, some scholars noticed that elevated blood pressure is closely related to osteoporosis[39]. This study also found that both diastolic and systolic blood pressures in the suspected osteoporosis group were higher than those in the control group. Finally, similar lifestyle factors may play a role in MS. Patients with MS often engage in sedentary behavior and insufficient exercise, both of which are inducing factors for osteoporosis[43-45]. Moreover, factors such as sun exposure time, dietary habits, and the use of dietary supplements need to be considered. In the present study, the levels of Ca2+, P, and VD3 in the suspected osteoporosis group were significantly higher than those in the control group. The iPTH level exhibited no statistically significant difference among the different MS groups, whereas the changes in Ca2+, P, and VD3 levels among the different MS groups were very complex. On the one hand, these changes may be related to compensatory changes caused by osteoporosis; on the other hand, the influence of other lifestyle factors and drugs cannot be ruled out.
-
Although this study was conducted at a single center and did not use the stratified random sampling method commonly used in disease screening, the sample size was large and the participants were highly representative of different regions of China. In addition, there were repeated follow-up results. Nevertheless, this paper demonstrated the same issue from multiple research methods and different perspectives. Therefore, the clues or trends based on these findings are worthy of attention or further research. This study also did not adopt the gold standard for diagnosing osteoporosis (a method that is complex and impractical for health examinations) and did not exclude those who were already diagnosed with diabetes or hypertension and receiving medication. Whether antidiabetic or antihypertensive medications affect bone density requires further research for confirmation. Moreover, because of the complexity of lifestyle factors, this study also failed to rule out the influence of factors such as exercise, diet, and sun exposure time.
-
This study found that MS may be associated with osteoporosis, and the effect of risk factors related to MS on osteoporosis may outweigh the effect of age alone. The specific mechanism of the association between the two requires further research.
-
The authors declared that we have no conflicts of interest to this manuscript.
Figure 1.
Flow chart of the study population.
MS: metabolic syndrome.

 Quick Links
 DownLoad: