


-
Climate change is a pressing global environmental issue[1]. The gradual rise in global surface temperature is the most immediate and direct among its public health impacts. Influenza, the leading cause of human respiratory viral infections, remains a substantial public health concern owing to its considerable disease burden, particularly in high-risk groups. Mounting epidemiological evidence has linked influenza to extreme heat and cold weather[2–4]. Multiple studies have identified a U-shaped relationship between extreme temperatures (both high and low) and the risk of influenza infection[4,5]. Moreover, a recent nationwide study in Japan indicated that most of the temperature-related influenza burden (27.25%) was attributable to low temperatures[6]. The remaining 72.75% of the influenza burden not attributable to ambient temperature was reported to be influenced by various driving factors, including absolute humidity, socioeconomic determinants, and human mobility patterns[6]. These findings suggest that climate change may increase heat-related excess morbidity while concomitantly reducing cold-related morbidity. However, the temperature-related excess morbidity from influenza projections under various climate change scenarios has not been comprehensively examined. The extent to which a decrease in cold-related morbidity counteracts an increase in heat-related morbidity requires further investigation. In this study, we projected the future impact of climate change on temperature-attributable influenza morbidity using daily surveillance data from a Japanese city from 2014 to 2019.
We projected the impact of climate change on health using a modeling framework detailed in the existing methodological literature[7]. These projections are based on well-defined assumptions and apply sophisticated statistical methods tailored for time-series analyses in environmental epidemiology. First, we conducted a time-series analysis to assess the relationship between observed temperature data and influenza incidence in Kawasaki City, Japan. Additionally, we acquired historical (1971–2005) and projected (2006–2099) average daily temperature time series according to climate change scenarios for the three representative concentration pathways (RCPs) using four general circulation models (GCMs). Second, we computed historical and future projections of excess influenza morbidity attributable to temperature under each RCP using the estimated temperature–morbidity association curve.
This study was conducted in Kawasaki City, Northeastern Kanagawa Prefecture, near Tokyo, Japan. The city has a temperate climate with distinct seasonal patterns, including hot, humid summers and cold, dry winters. Since March 2014, all medical facilities in the city, including private hospitals and clinics, have been mandated to report the number of patients with influenza daily using rapid diagnostic test kits. Daily total number of patients with influenza between March 2014 and December 2019 was obtained from the Kawasaki City Infectious Disease Surveillance System (https://kidss.city.kawasaki.jp/en/home). The Kawasaki City Infectious Disease Surveillance System offers the significant advantage of daily data availability, enabling time-series analysis with high temporal resolution and facilitating the early detection of epidemic spread. In contrast, the National Epidemiological Surveillance of Infectious Diseases currently used in Japan is limited to weekly reporting[6]. Meteorological data, including daily mean temperature (°C), relative humidity (%), wind speed (m/s), total rainfall (mm), and sunshine duration (h), were collected from the Japan Meteorological Agency Weather Station in Central Kawasaki City (https://www.jma.go.jp/jma/indexe.html). Hourly concentrations of fine particulate matter (PM2.5, μg/m³) were acquired from the Atmospheric Environmental Regional Observation System managed by the Ministry of the Environment (https://soramame.env.go.jp/), with daily averages calculated from hourly values.
We obtained the projected daily mean temperatures from the Intersectoral Impact Model Intercomparison Project (ISIMIP2b) simulation round based on four GCMs (IPSL-CM5A-LR, GFDL-ESM2M, HadGEM2-ES, and MIROC5) provided by the Phase 5 Coupled Model Intercomparison Project. The ISIMIP2b database includes a time series of modeled daily near-surface air temperatures for historical climate simulations (1971–2005) and future simulation periods (2006–2099) and is downscaled to a spatial resolution of 0.5° × 0.5°. For each GCM, we used historical runs for 1971–2005 and three different greenhouse gas emission scenario runs (RCP2.6: mild emission scenario, RCP4.5: stabilization scenario, and RCP8.5: extreme emission scenario) for 2006–2099. The modeled temperature series was recalibrated using the observed data, which minimized the discrepancies between the observed and simulated historical temperature distributions while preserving the forecasted trends (Figure S1).
We applied a standard time-series quasi-Poisson regression in combination with a distributed lag nonlinear model to derive estimates of baseline temperature–morbidity associations. Nonlinear and lagged effects were modeled using a cross-basis function with a natural cubic B-spline for mean temperature, with knots at the 25th, 50th, and 75th percentiles. Lagged effects for up to 14 days were assessed using a natural cubic B-spline with three internal knots on a logarithmic scale. Seasonal and long-term trends were controlled using seven degrees of freedom (df) per year. Other confounders included a 14-day moving average for relative humidity (modeled with a natural cubic B-spline with 3 df), day of the week, public holidays, and autoregressive terms for logged daily counts at lags of 1 and 2 days.
We projected excess temperature morbidity using a daily temperature and morbidity time-series model, assuming the absence of adaptation and population alterations[7,8]. The minimum morbidity temperature (MMT) was defined as the temperature corresponding to the lowest cumulative relative risk of influenza incidence, evaluated between the 1st and 99th percentiles of the temperature distribution. The total number of patients with influenza attributable to non-optimal temperatures was calculated by adding the daily contributions across the study period. The total attributable fraction was defined as the ratio of the attributable infections to the total number of patients with influenza. Factors associated with low and high temperatures were analyzed by aggregating days with temperatures below or above the MMT. First, excess morbidity was estimated using various combinations of GCM and RCP. Subsequently, the attributable fractions were calculated as GCM-ensemble averages based on the decade and RCP, with the respective total number of patients with influenza as the denominator. By producing 1,000 samples, Monte Carlo simulations were used to derive 95% empirical confidence intervals (eCIs) and quantify uncertainties in the exposure–lag–response relationship and climate projections across the GCMs. These methods have been previously described[7,8].
For sensitivity analysis, modeling selections were tested by controlling for different df values for time trends (5 df per year), varying the knot positions in the cross-basis function from the 25th, 50th, and 75th percentiles to the 10th, 75th, and 90th percentiles, choosing different lags (7 and 21 days), and including different confounders (a 14-day moving average of wind speed, total rainfall, sunshine duration, and PM2.5 modeled with a natural cubic spline with 3 df). All statistical analyses were conducted using R 3.5.2 (R Core Team, R Foundation for Statistical Computing, Vienna, Austria), specifically using the “dlnm” package. Ethical approval was not required because all data collected were secondary, contained no personal information, and were not transferable.
Between March 2014 and December 2019, 163,120 patients with influenza were reported in Kawasaki City (Table S1). The daily mean temperatures ranged from 0.7 to 31.6°C. The number of patients with influenza was negatively correlated with the mean temperature (ρ = –0.82) (Table S2). Figure 1 depicts the historical temperature trends (1971–2005) and projected future temperatures (2006–2099) in Kawasaki City under RCP2.6, RCP4.5, and RCP8.5. A steep increase in the projected temperature was consistently observed across this century under RCP8.5, whereas only a slight increase was assumed for RCP2.6 and RCP4.5 after the middle of this century. By the end of the 21st century, the average temperature will rise by 1.8, 2.3, and 5.0 °C under RCP2.6, RCP4.5, and RCP8.5, respectively. Figures S2 and S3 illustrate the baseline overall cumulative exposure–response relationship between mean temperature and influenza incidence across lags of 0–14 days in Kawasaki City. The association follows a reverse J-shaped curve, with the MMT identified at the 82nd percentile of the mean temperature (24.7 °C). The projected trends in heat- and cold-related excess morbidities associated with influenza in Kawasaki City are shown in Figure S4 and Table S3.
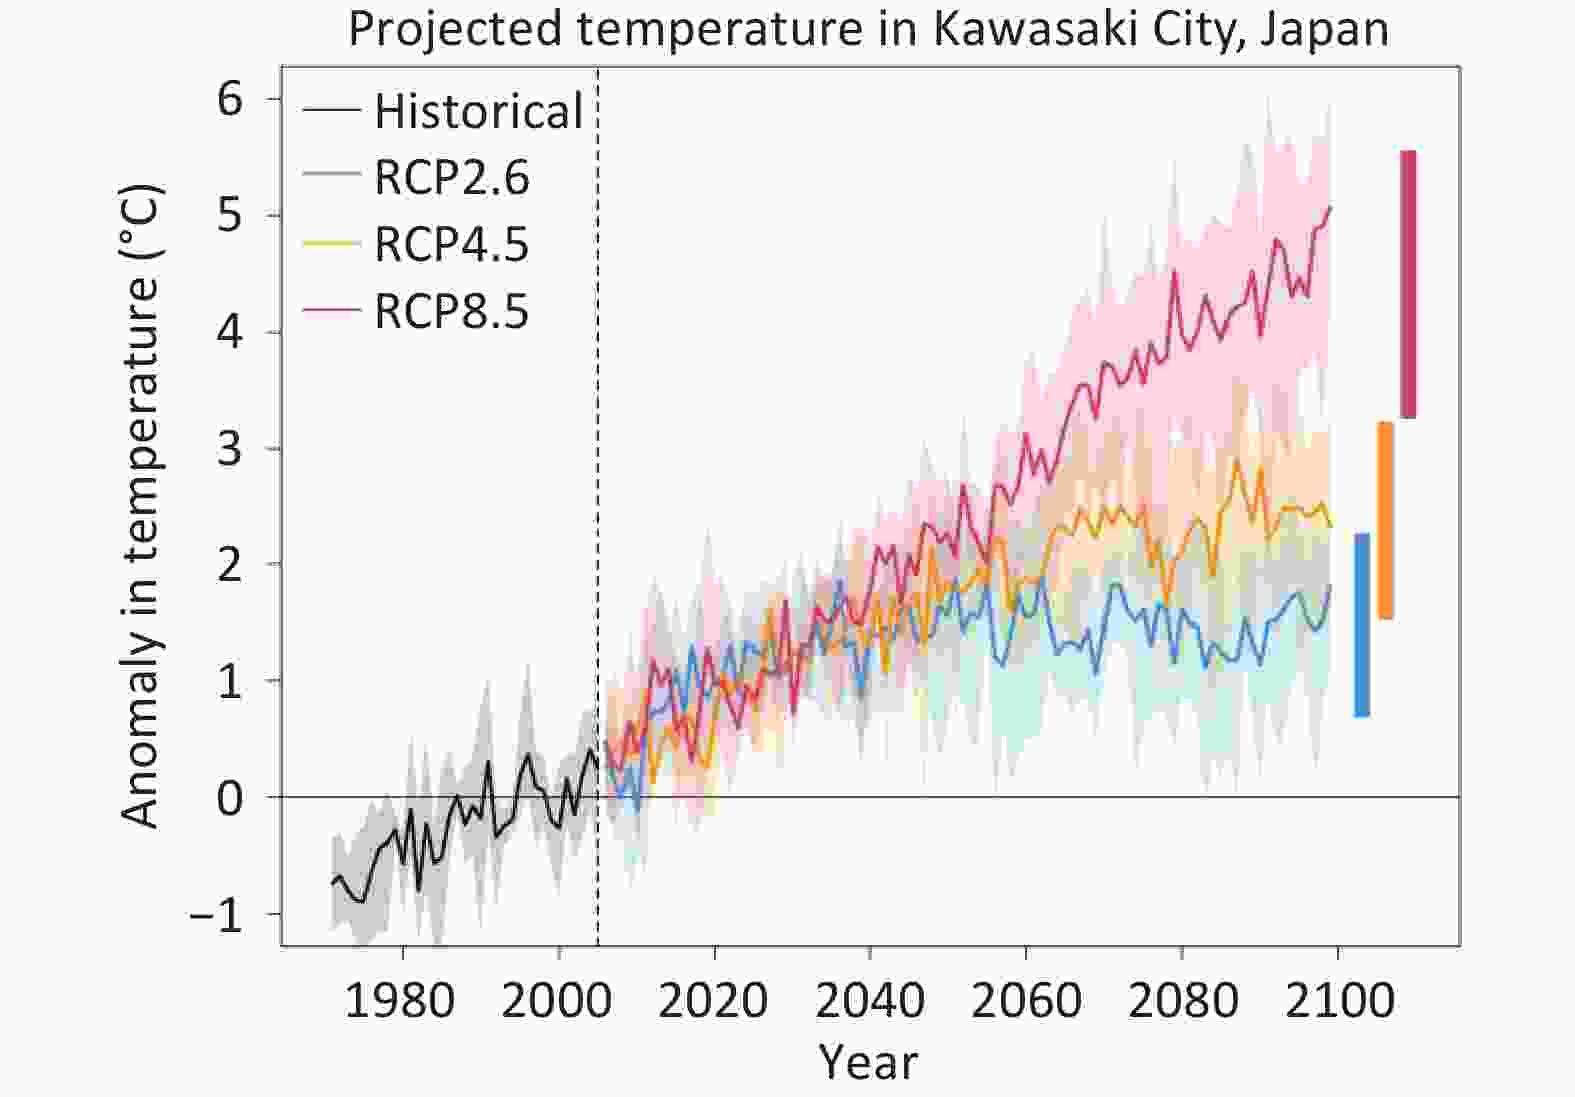
Figure 1. Temporal trends in projected temperature in Kawasaki City, Japan. Solid lines represent annual mean temperatures calculated across four GCM-specific modeled series—PSL-CM5A-LR, MIROC5, HadGEM2-ES, and GFDL-ESM2M. These are shown as increases in the annual mean temperature compared to the historical average (black line, 1971–2005). The projected average temperatures for 2006–2099 are illustrated under RCP2.6 (blue), RCP4.5 (orange), and RCP8.5 (red) scenarios. The shaded area reflects the interannual variability, showing the range of possible temperatures for each year. The two horizontal bars denote the average annual maximum and minimum temperatures across the modeled series. Abbreviations: GCM, general circulation model; RCP, representative concentration pathway
The findings indicated a consistent decrease in cold-related excess morbidity and a slight increase in heat-related excess morbidity across the RCP scenarios. These trends were most evident under RCP8.5, whereas RCP4.5 and RCP2.6 exhibited shallower slopes over the 21st century. Under RCP8.5, cold-related excess morbidity declined from 75.22% (95% eCI: 46.70–87.91) in 2010–2019 to 69.57% (95% eCI: 36.49–84.58) in 2090–2099. Conversely, under RCP2.6, the reduction is less marked, decreasing from 75.66% (42.51–88.16) in 2010–2019 to 74.64% (95% eCI: 45.66–87.54) in 2090–2099. Temporal changes in influenza-related excess morbidity in Kawasaki City modeled under the three RCP scenarios are represented in Figure 2 and Table S3. The net difference in excess morbidity relative to 2010–2019 gradually diminished by the end of the 21st century, with reductions in temperature-related excess morbidity due to influenza ranging from −1.00% (95% eCI: −3.30 to 0.04) under RCP2.6 to −5.50% (95% eCI: −11.48 to −1.72) under RCP8.5 during the period 2090–2099. The sensitivity analysis revealed that varying the model choice had little effect on the estimates (Table S4).
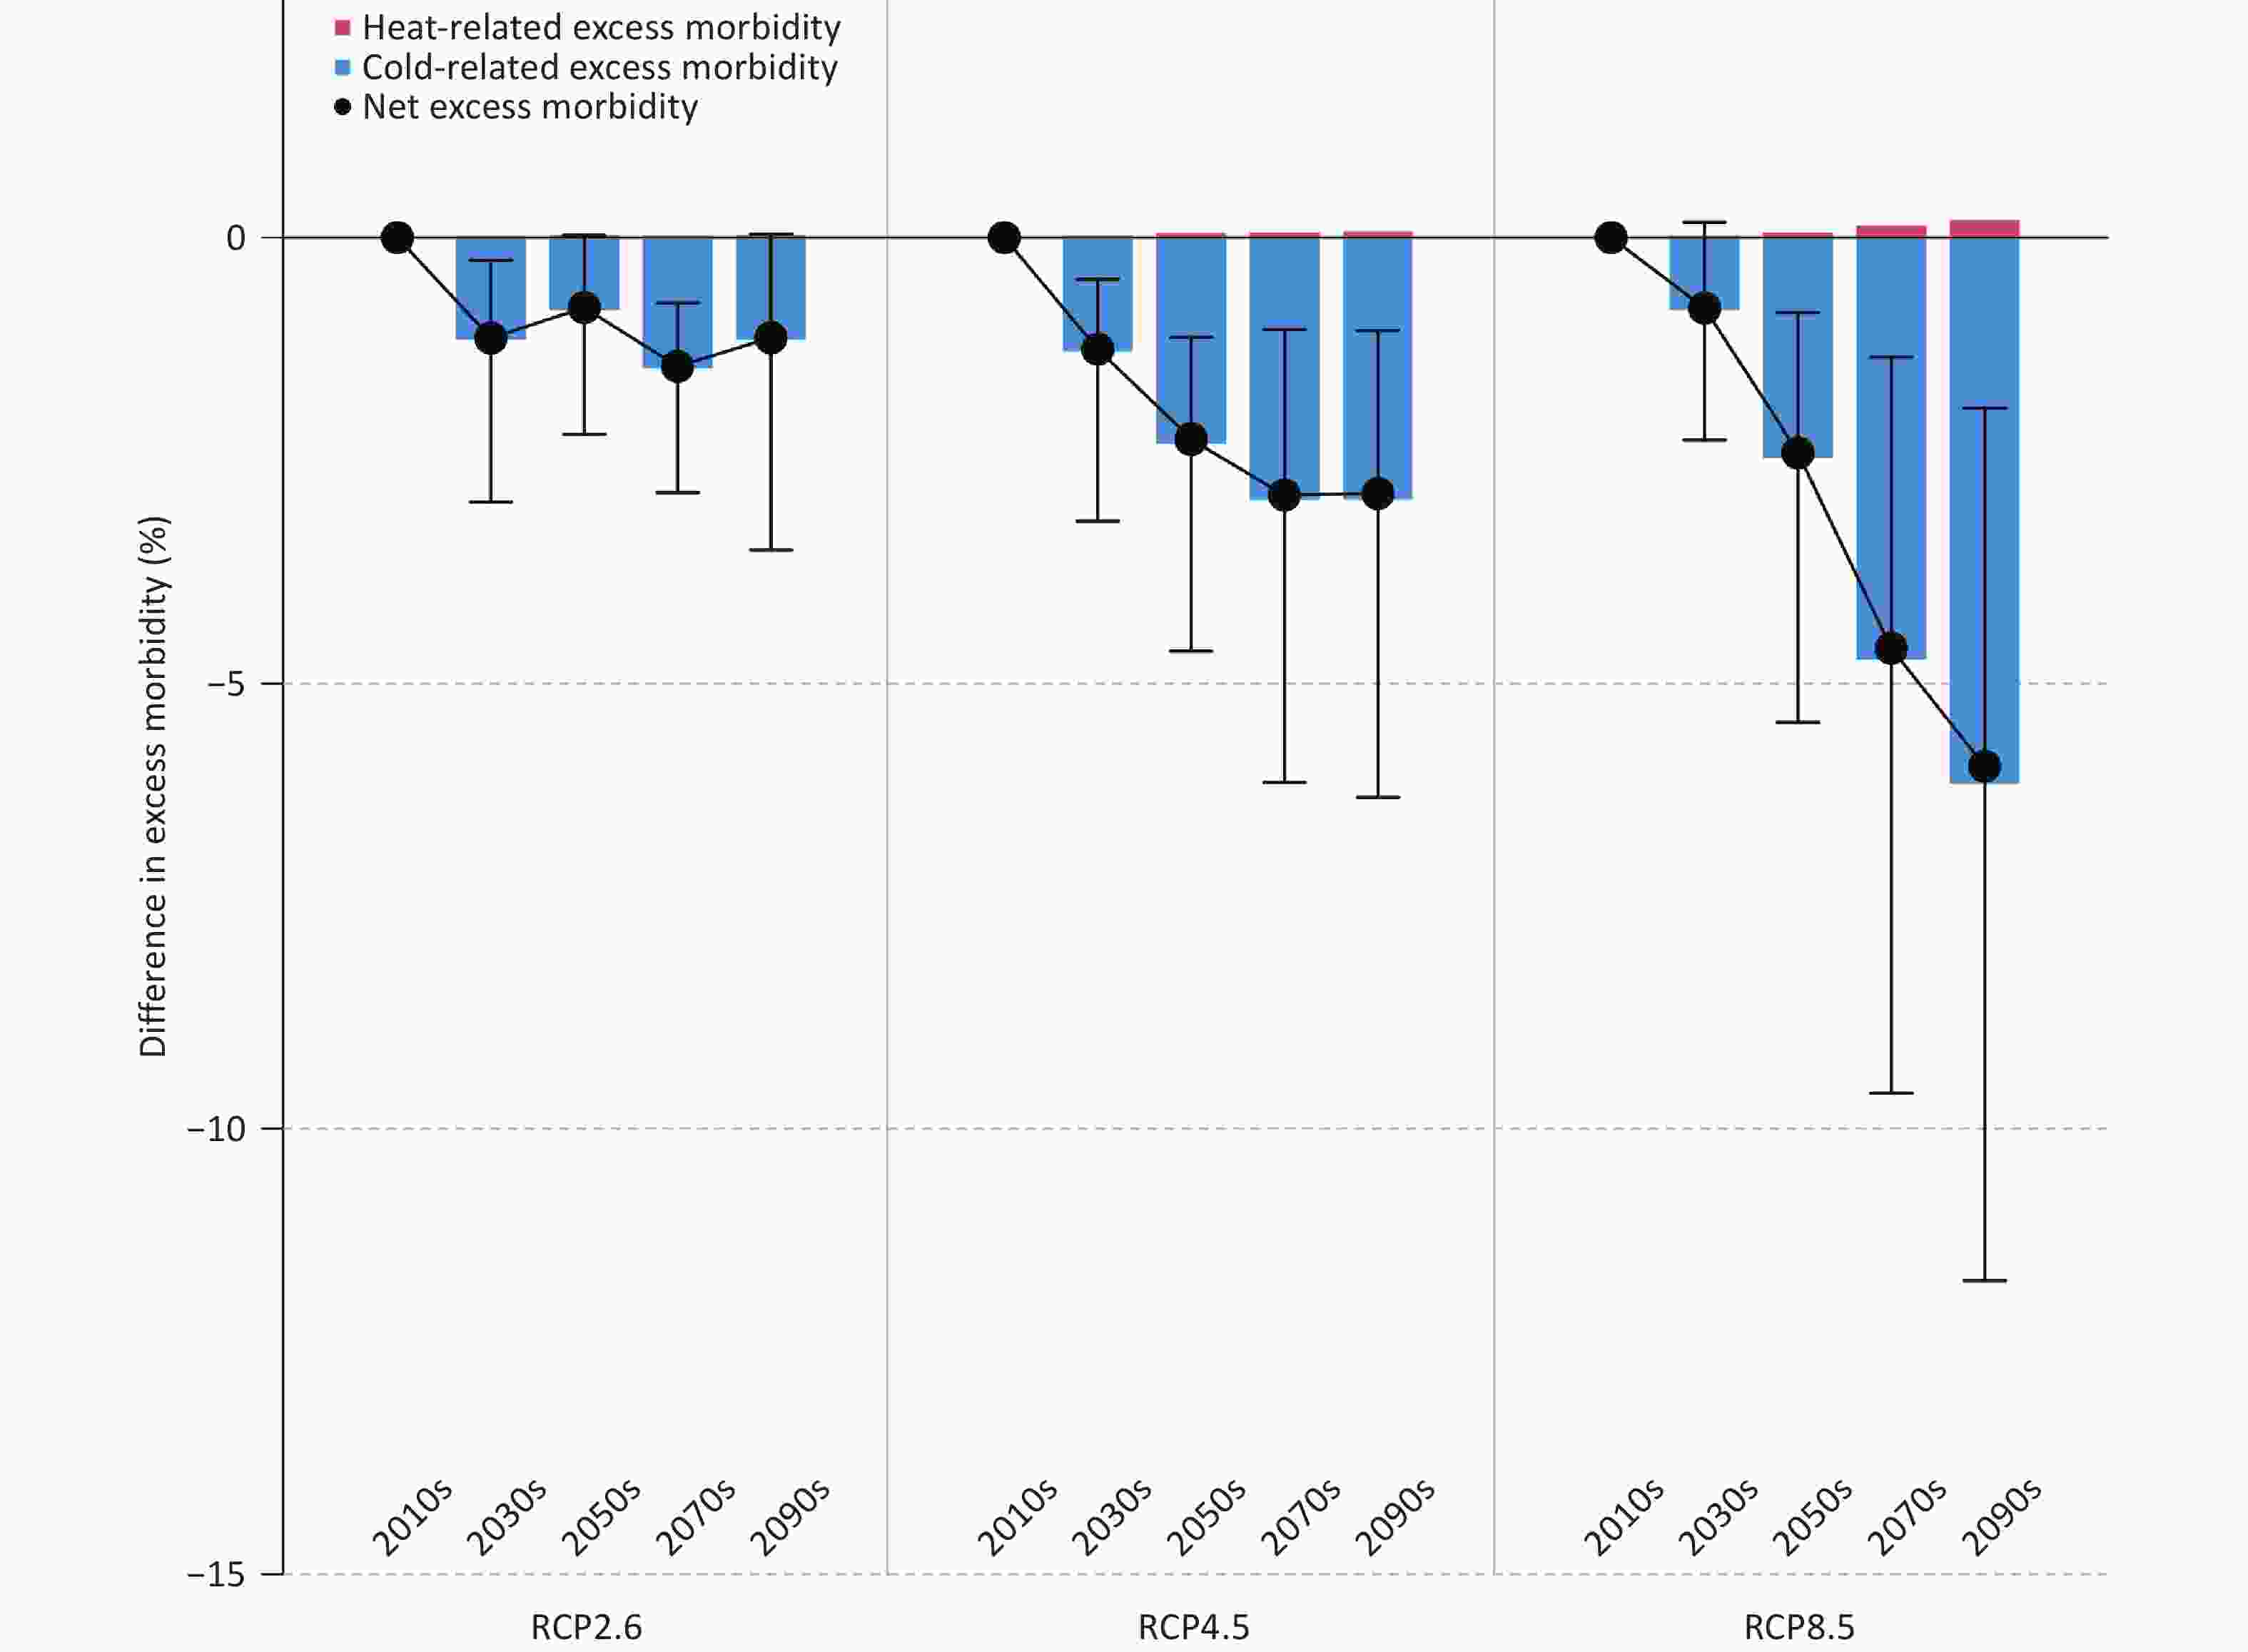
Figure 2. Temporal change in excess morbidity due to seasonal influenza in Kawasaki City, Japan. The graph illustrates the decadal difference in excess morbidity due to seasonal influenza, compared to the 2010–2019 baseline, under three climate change scenarios: RCP2.6, RCP4.5, and RCP8.5. Results are expressed as GCM-ensemble means, incorporating PSL-CM5A-LR, MIROC5, HadGEM2-ES, and GFDL-ESM2M. Black vertical lines represent 95% empirical confidence intervals for the net differences.
In this study, we estimated the future projections of temperature-related excess morbidity due to influenza in Kawasaki City under different climate change scenarios using recently developed study designs and advanced statistical methods. Our models indicated a net decrease in temperature-related excess morbidity associated with influenza under higher emissions scenarios. To the best of our knowledge, this study is among the first to explore the potential effects of temperature change on influenza under different climate change scenarios, providing valuable insights into the interplay between climate variability and infectious disease dynamics.
The findings indicate that climate change may lead to a net reduction in temperature-related influenza infections in Japan. We observed a steep reduction in cold-related excess morbidity under higher emission scenarios of global warming and a small increase in heat-related excess morbidity. Extremely low temperatures prolong the viral shedding period in hosts, reduce the secretory functions of the respiratory mucosa, impair immune defenses, and increase the risk of infection. Comparable studies have been conducted on other diseases, such as hand, foot, and mouth disease and infectious gastroenteritis[9,10], underlining the necessity and critical importance of quantitative risk evaluations of excess morbidity associated with global warming. Although the physiological mechanisms linking temperature and influenza have not been fully elucidated, these findings highlight the need to further investigate region- and country-specific projections of temperature-related influenza morbidity.
This study has certain limitations. First, although the temperature-influenza projections under future warming scenarios allowed us to isolate climate change influences, they did not account for critical factors, such as demographic changes and adaptation. This study aimed to quantify the effects of future climate change on influenza epidemics. Consequently, fluctuations in factors such as sex, age, and treatment-seeking behavior were not included in the analysis, indicating that the estimated future effects could be over- or underestimated. Thus, the results should be interpreted as potential effects under hypothetical scenarios guided by certain strict assumptions. Future studies should integrate sociodemographic changes using shared socioeconomic pathways in alignment with RCPs. Second, the projections of temperature-related excess morbidity are characterized by marked uncertainty, particularly for the net impact. Third, the geographical scope of the study was confined to Kawasaki City, and data from other cities were excluded. Fourth, the lack of individual-level exposure data necessitated using prefectural-level data, which may have introduced a measurement bias. Fifth, this study did not consider the pathological information speCIfic to different influenza types. Future studies integrating such data could provide deeper insights into the pathophysiology and treatment response of each type. Finally, the findings may be subject to bias as the analysis did not adjust for immunity levels or the likelihood of influenza transmission among susceptible individuals.
The results of this study offer valuable insights for refining the estimates of climate change-related influenza epidemics in future public health policies. This study projects the greatest decrease in net excess influenza morbidity under high-emission scenarios. Most of the excess morbidity was attributed to low temperatures, with heat contributing to only a minor fraction. The reductions in temperature-related net excess morbidity are projected to be substantial under high greenhouse gas emission scenarios. These results are critical for the formulation of influenza-specific public health strategies and contribute to the ongoing international dialogue on the health impacts of climate change.
In conclusion, our study indicates that Kawasaki City is projected to experience a substantial net reduction in influenza cases under higher emissions scenarios. These findings will aid in building a repository of knowledge on the broad effects of climate change on influenza in specific regions of Japan. Nevertheless, substantial knowledge gaps persist regarding the role of these factors in various diseases across different regions. Future research should focus on developing long-term influenza projections that account for demographic changes and adaptive measures over time.
Future Projections of Temperature-related Excess Morbidity Due to Influenza Under Climate Change Scenarios: A Case Study in a Temperate Japanese City
doi: 10.3967/bes2025.034
- Received Date: 2024-12-08
- Accepted Date: 2025-02-20
The authors have no competing interests to declare.
Ethical approval was not required because all data collected were secondary, contained no personal information, and were not transferable.
| Citation: | Keita Wagatsuma. Future Projections of Temperature-related Excess Morbidity Due to Influenza Under Climate Change Scenarios: A Case Study in a Temperate Japanese City[J]. Biomedical and Environmental Sciences. doi: 10.3967/bes2025.034

|

 Quick Links
 DownLoad:
