
-
Chronic obstructive pulmonary disease (COPD) is one of the most prevalent respiratory diseases and is the third leading cause of mortality globally[1]. In 2019 alone, more than 15 million new patients with COPD were reported, resulting in more than 3 million deaths worldwide. Moreover, the burden of COPD has continued to escalate, with the disease ranking as the sixth leading cause of disability-adjusted life years (DALYs) lost in 2019, a significant jump from its eleventh position in 1990[1]. Therefore, COPD remains a major global health challenge with profound implications for healthcare systems, economic productivity, and quality of life.
Geographical disparities in COPD burden are striking. The disease burden of COPD has changed in many regions; for example, over the past three decades, the disease burden of COPD has steadily increased in sub-Saharan Africa. The age-standardized incidence and mortality rates of COPD have increased by 9% and 22% in the United States, respectively, and the incidence has decreased but remained high in South Asian countries such as India[2-4]. The Asia-Pacific region has witnessed a substantial increase in the prevalence and burden of COPD, with East Asia and the Pacific accounting for approximately one-third of the global patients with COPD in 2019 [5]. In the same year, the Asia-Pacific region reported more than 5.8 million new patients with COPD and nearly 69.4 million living patients. However, research on COPD incidence, prevalence, and trends in this region remains limited compared with studies conducted in Europe and North America[6-7].
Numerous studies in European and American countries, including Spain, Norway, and Mexico, have examined the factors influencing COPD burden[8-10]. Tobacco smoking is widely recognized as one of the leading causes of COPD. Other risk factors, such as air pollution, exposure to biofuel smoke, occupational dust, physical inactivity, and genetic factors, contribute to COPD[11]. Previous studies have shown that smoking and ambient particulate matter pollution are still considered the two most significant risk factors[12-13]. COPD prevalence and mortality rates are higher in males than in females, and similar to other respiratory diseases, the risk of COPD increases with age, particularly in individuals aged over 40 years old [14-16]. Therefore, age and sex are important factors influencing COPD. Unlike Europe and North America, the Asia-Pacific region faces unique challenges, including rising smoking prevalence, rapid population aging, and heightened exposure to environmental pollution[17], all of which are likely to exacerbate the COPD burden in the coming decades. Despite these pressing issues, systematic long-term studies addressing the COPD burden in this region remain scarce.
Evolving risk factors for COPD, including shifting smoking patterns, escalating air pollution, and demographic aging, are likely to reshape incidence rates and disease burden in Asia-Pacific countries. The accurate estimation and prediction of these trends by changing risk factors are crucial for efficiently allocating medical resources and formulating evidence-based public health policies. However, previous studies in the Asia-Pacific region have primarily focused on estimating the prevalence and mortality rates in selected countries or regions, with limited comparative assessments across nations[18-19]. In addition, few studies have predicted the future COPD incidence rates in the Asia-Pacific region. To address these gaps, this study leveraged data from the 2019 Global Burden of Disease (GBD) study to 1) explore temporal trends in COPD incidence, prevalence, mortality, and DALYs in selected Asia-Pacific countries and regions from 1990 to 2019 and 2) forecast future trends up to 2034 to demonstrate geographical variations.
-
The estimated incidence, prevalence, mortality, and DALYs of COPD from 1990 to 2019 were obtained from the GBD 2019[20], which was developed and maintained by the Institute for Health Metrics and Evaluation. The GBD 2019 database contains information on the incidence, prevalence, mortality, and DALYs of COPD by year, age group, and sex in 204 countries and territories[21]. A detailed description of the methods used to derive the disease burden and analyze each of the measures in GBD 2019 is provided in the Supplementary Materials and previous publications[2,22]. We defined the Asia-Pacific region by combining Jamrozik and Musk’s definition (the WHO “Western Pacific” plus Thailand and Taiwan, China)[23] and the World Bank definition of the East Asia and the Pacific region. Our definition includes 36 countries and territories. Considering data availability in the GBD, our analysis covers 90% of countries and territories in East Asia and the Pacific and countries and territories covered by current research literature on respiratory diseases in the Asia-Pacific region[24]. The World Bank classifies economies into four income groups according to gross national income (GNI): high, upper-middle, lower-middle, and low. We classified countries and territories in the Asia-Pacific region into three categories—high-income, upper-middle income, and low- to middle-income—based on data characteristics and World Bank classifications (Supplementary Table S1).
-
COPD was defined according to the International Classification of Diseases, 10th Revision code J44, which includes chronic bronchitis, emphysema, and other forms of COPD[2,25]. The input data for GBD are diverse and may be extracted from censuses, household surveys, civil registration and vital statistics, disease registries, health service use, air pollution monitors, satellite imaging, disease notifications, and other sources. Among the data collected from these various sources, individuals with COPD were diagnosed and categorized according to the severity criteria outlined by the Global Initiative for Chronic Obstructive Lung Disease guidelines, which define COPD as forced expiratory volume in one second / forced vital capacity < 70%[2,26]. The data used in this study were obtained from the Global Health Data Exchange Query tool. The data included information on annual incident cases, prevalent cases, deaths, age-standardized incidence, prevalence, mortality rate, DALYs, and age-standardized DALY rates, along with 95% uncertainty intervals (UIs) categorized by sex and age groups, covering the period from 1990 to 2019.
-
We obtained age-standardized incidence, prevalence, mortality, and DALY rates per 100,000 people for COPD using the GBD World Population Age Standard from GBD 2019. DALYs were calculated as the sum of years of life lived with a disability and years of life lost. We estimated the 95% uncertainty interval (UI) for all rates. Hotspot maps were used to illustrate the temporal trends and differences between countries or territories in the age-standardized incidence and mortality rates of COPD in Asia-Pacific countries and territories from 1990 to 2019. In addition, we compared the changes in age-standardized rates and total numbers by age group and sex in terms of the incidence, prevalence, mortality, and disease burden in 1990, 2010, and 2019.
-
We used joinpoint regression[27], which involves fitting a series of joined straight lines to the natural logarithm of the incidence, to identify and quantify significant changes in COPD incidence from 1990 to 2019. The analysis started with the minimum number of joinpoints (i.e., zero joinpoints, representing a straight line) and model tests fit with a maximum of three joinpoints, as recommended by the program. The significance tests were performed using the Monte Carlo Method. Once the join points were determined, the estimated annual percent change (APC) was computed for each identified trend. The formula for calculating this indicator is $ {\mathrm{A}\mathrm{P}\mathrm{C}}_{\mathrm{i}}=100\times \left[\mathrm{E}\mathrm{x}\mathrm{p}\left({\mathrm{\beta }}_{\mathrm{i}}-1\right)\right] $, and the $ {\mathrm{\beta }}_{\mathrm{i}} $ in the formula represents the slope of the period[28]. We calculated the average APC (AAPC) assuming there was only one segment (i.e., no joint point) for the full range of our study periods[29]. A positive APC or AAPC indicates an increasing trend, whereas a negative APC or AAPC indicates a decreasing trend.
-
To predict the Asia-Pacific COPD incidence, the age–period–cohort model was extended and extrapolated to 2034. The age–period–cohort model has been widely applied in predicting disease incidence rates predictions[30]. According to the work of Moller et al.[31], we extended the typical age–period–cohort model, which can be expressed as $ {R}_{ap}=({A}_{a}+D\times p+{P}_{p}+{C}_{c} $) [32] where $ {R}_{ap} $represents the incidence rate in age groups a and p, $ {A}_{a} $represents the age component for age Group a, D represents the drift parameter, $ {P}_{p} $ represents the nonlinear period component of period p, and $ {C}_{c} $ represents the nonlinear cohort component of the cohort. The predictions for each country are based on the last several observation periods, as determined by the goodness-of-fit test (5% level). In addition, we used the trend in the past 10 years as the drift component if the rates displayed a significant curvature in the prediction base to make the predictions more dynamic. An empirical evaluation showed that all these modifications resulted in better predictions of incidence rates in the Nordic countries[30]. We then obtained the projected population of the country from the United Nations World Population Prospects 2019 Revision and multiplied the projected age-specific incidence rates to estimate COPD incidence counts [33]. In addition, we used linear regression models to predict the incidence rates of COPD over the next 15 years based on the most recent trend segment identified by the joinpoint regression analysis to assess the accuracy of the age–period–cohort model.
We used the Joinpoint Regression Program version 4.9.0.1 (Statistical Research and Applications Branch, National Cancer Institute) to perform the joinpoint regression, and all other analyses were conducted using R version 4.4.0 (R Foundation for Statistical Computing, Vienna, Austria).
-
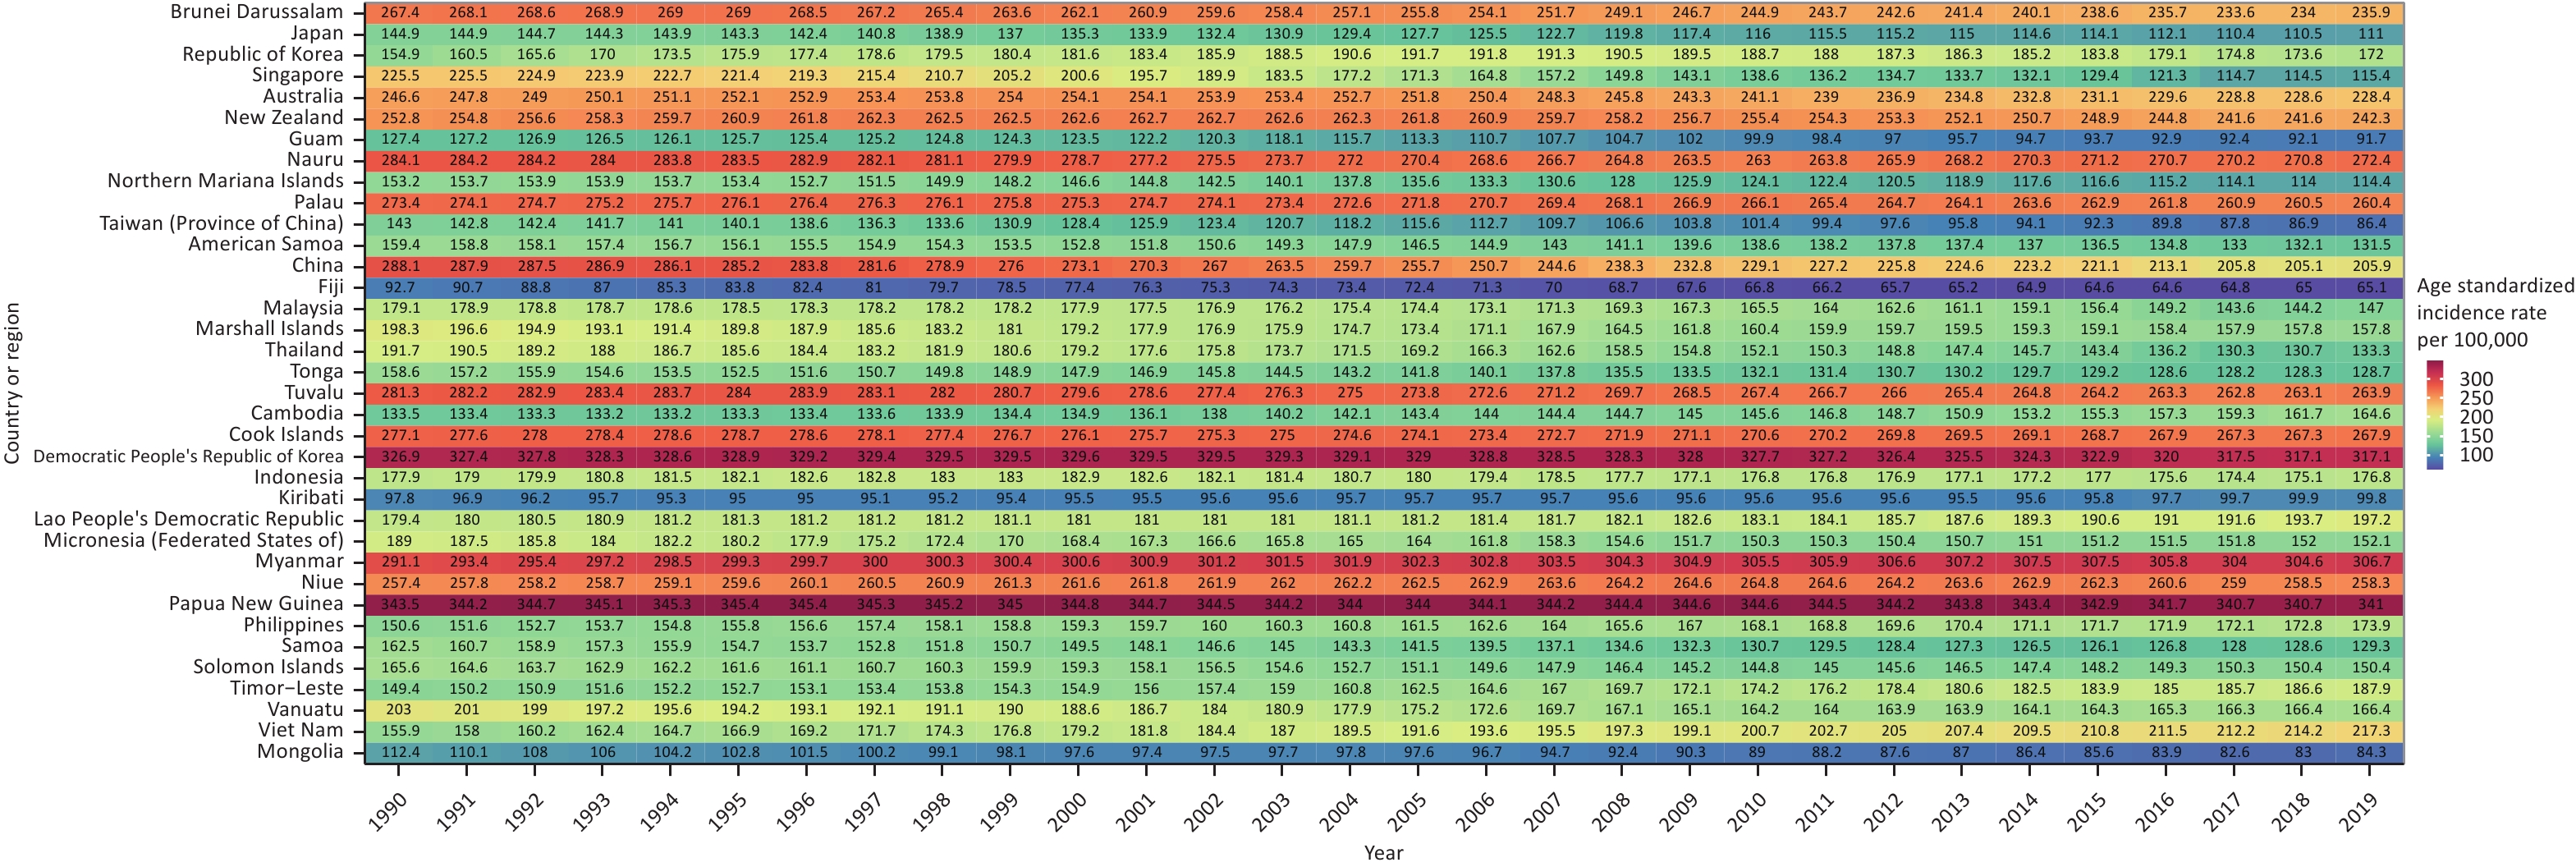
In 2019, the number of new patients with COPD in the Asia-Pacific region was over 5.8 million, with approximately 69.4 million living patients, resulting in more than 1.3 million deaths. Table 1 provides the age-standardized incidence, prevalence, mortality, and DALY rates of COPD per 100,000 people in selected Asia-Pacific countries and territories in 2019, along with the percentage change from 1990 to 2019. In 2019, Papua New Guinea, the Democratic People’s Republic of Korea, and Myanmar recorded the highest incidence, prevalence, mortality, and disease burden of COPD in the Asia-Pacific region. As shown in Table 1, the incidence, prevalence, mortality, and DALY rates decreased in most countries and territories between 1990 and 2019. The reductions in mortality and DALY rates were more pronounced than in incidence and prevalence. The temporal trends in the age-standardized incidence rates of COPD in Asia-Pacific countries and territories between 1990 and 2019 are shown in Figure 1. Among the 36 selected countries and territories, the incidence rate of COPD in 1990 was classified into three categories: > 200 per 100,000 in 14 countries and territories, between 100 and 200 in 20 countries, and < 100 in two countries. We identified "hotspot regions" as those with a rate > 200 per 100,000 and observed that the Democratic People’s Republic of Korea and Papua New Guinea had the highest incidence rates (> 300). Moreover, while the incidence rates remained stable or decreased slightly in most regions, there were notable upward trends in several countries and territories, including the Republic of Korea, Cambodia, the Lao People’s Democratic Republic, the Philippines, Timor-Leste, and Vietnam. Supplementary Figure S1 shows the trends in COPD mortality from 1990 to 2019, revealing a significant decline in COPD mortality rates throughout the Asia-Pacific region over the past 30 years.
Variables Mortality Prevalence Incidence DALYs 2019 age− standardized rate
(95% UI)Percentage
change
between
1990 and 2019 (%)2019 age−
standardized rate
(95% UI)Percentage
change
between
1990 and 2019 (%)2019 age−
standardized rate
(95% UI)Percentage
change
between
1990 and 2019 (%)2019 age−
standardized rate
(95% UI)Percentage
change
between
1990 and 2019 (%)High income Brunei Darussalam 48.94
(40.92 to 56.00)−46.60 2,937.75
(2,771.01 to 3,106.41)−15.29 235.85
(225.79 to 246.13)−11.80 842.76
(746.26 to 941.78)−45.55 Japan 7.41
(0.00 to
9.80)−40.45 1,354.19
(1,226.48 to 1,487.23)−27.85 111.00
(101.11 to 121.25)−23.41 203.73
(173.74 to 239.48)−35.32 Republic of Korea 13.22
(10.76 to 15.14)−45.40 2,027.25
(1,921.51 to 2,140.83)10.88 171.98
(165.50 to 178.22)11.02 313.85
(275.17 to 351.29)−34.61 Singapore 9.00
(7.40 to 12.14)−80.98 1,499.90
(1,407.53 to 1,598.61)−47.28 115.43
(108.96 to 121.96)−48.81 247.36
(216.72 to 288.26)−73.77 Australia 19.83
(16.65 to 22.71)−33.49 3,157.32
(2,989.94 to 3,336.45)−10.48 228.43
(218.05 to 239.59)−7.39 497.14
(440.36 to 552.95)−30.97 New Zealand 24.50
(20.99 to 27.30)−25.17 3,384.32
(3,116.83 to 3,667.15)−7.85 242.33
(222.92 to 261.57)−4.14 591.70
(528.47 to 646.77)−25.05 Guam 20.37
(16.51 to 25.12)−54.56 1,010.01
(951.01 to 1,073.97)−22.98 91.75
(86.61 to 97.39)−28.00 464.07
(392.37 to 554.91)−44.71 Nauru 71.68
(55.12 to 87.51)−31.78 3,076.73
(2,924.96 to 3,237.96)−4.04 272.35
(260.37 to 285.15)−4.15 1,645.03
(1,301.58 to 1,972.11)−30.66 Northern Mariana Islands 38.27
(32.91 to 45.94)−39.28 1,167.64
(1,096.76 to 1,238.30)−27.42 114.37
(107.79 to 120.75)−25.33 756.09
(658.31 to 887.87)−41.04 Palau 71.02
(57.14 to 85.59)−28.40 3,186.06
(3,040.65 to 3,344.03)−4.58 260.37
(249.34 to 271.86)−4.77 1,500.37
(1,252.82 to 1,786.40)−27.70 Taiwan, China 20.76
(16.34 to 26.60)−28.03% 1,058.63
(987.66 to 1,135.60)−42.27 86.36
(82.40 to 90.69)−39.62 365.02
(306.01 to 448.92)−37.18 Upper middle income American Samoa 42.76
(36.06 to 52.78)−38.98 1,374.16
(1,299.67 to 1,454.45)−17.58 131.47
(124.78 to 138.57)−17.52 877.46
(751.85 to 1,060.51)−36.93 China 65.20
(55.51 to 80.09)−70.08 2,404.42
(2,195.92 to 2,636.26)−27.16 205.89
(188.42 to 223.62)−28.53 1,102.77
(962.93 to 1,309.04)−69.47 Fiji 27.43
(21.39 to 35.01)−38.80 668.54
(622.11 to 713.73)−28.41 65.09
(60.98 to 69.26)−29.76 552.51
(438.47 to 693.81)−39.80 Malaysia 28.95
(22.77 to 38.16)−38.44 2,057.23
(1,944.50 to 2,190.39)−5.24 147.01
(139.01 to 155.57)−17.93 670.26
(566.05 to 815.43)−33.50 Marshall Islands 71.88
(53.25 to 95.10)−29.42 1,581.61
(1,494.24 to 1,673.66)−18.94 157.85
(149.55 to 166.68)−20.40 1,512.16
(1,150.78 to 1,968.36)−31.71 Thailand 19.81
(14.91 to 25.97)−63.48 1,968.61
(1,860.19 to 2,079.10)−26.74 133.32
(126.39 to 140.77)−30.45 524.57
(434.18 to 631.80)−57.91 Tonga 39.53
(31.70 to 47.37)−29.41 1,200.72
(1,126.43 to 1,273.35)−19.03 128.76
(121.96 to 136.13)−18.84 787.18
(646.18 to 944.42)−29.26 Tuvalu 61.12
(47.84 to 78.62)−43.78 2,891.40
(2,732.05 to 3,064.48)−4.42 263.91
(251.78 to 276.68)−18.70 1,409.90
(1,140.87 to 1,772.07)−44.70 Low to middle income Cambodia 39.11
(30.32 to 45.87)−15.78 2,214.56
(2,082.68 to 2,347.71)25.50 164.57
(155.18 to 173.80)23.24 851.30
(706.68 to 979.32)−14.99 Cook Islands 24.37
(19.71 to 29.48)−53.60 3,349.02
(3,187.98 to 3,501.30)−1.95 267.87
(256.43 to 279.33)−3.32 713.48
(616.57 to 808.43)−43.26 Democratic People’s
Republic of Korea105.20
(84.45 to 127.52)−35.03 3,718.48
(3,588.38 to 3,834.48)−8.75 317.05
(308.48 to 323.96)−3.00 2,030.87
(1,665.44 to 2,365.85)−32.38 Indonesia 45.71
(38.22 to 52.10)−18.35 2,359.15
(2,179.16 to 2,567.13)−0.59 176.77
(160.10 to 193.29)−0.66 998.15
(852.71 to 1,123.25)−17.57 Kiribati 56.63
(43.73 to 69.54)−19.69 1,019.36
(959.19 to 1,084.76)−0.23 99.82
(94.26 to 106.11)2.07 1,198.66
(938.91 to 1,474.32)−24.96 Lao People’s
Democratic Republic52.14
(43.28 to 67.38)−32.39 2,741.77
(2,568.28 to 2,911.16)18.69 197.18
(185.96 to 209.10)9.89 1,203.81
(1,004.05 to 1,444.92)−32.42 Micronesia (Federated States of) 74.93
(58.30 to 94.93)−32.47 1,575.61
(1,485.85 to 1,669.59)−16.54 152.08
(143.58 to 160.90)−19.54 1,587.04
(1,200.21 to 2,006.78)−35.04 Myanmar 85.41
(63.37 to 98.38)−27.14 3,963.73
(3,825.41 to 4,096.67)12.41 306.74
(297.37 to 315.22)5.37 1,784.39
(1,428.38 to 2,039.82)−28.10 Niue 43.01
(33.30 to 53.31)−35.74 3,191.08
(3,032.23 to 3,371.92)0.95 258.28
(247.11 to 271.28)0.35 1,068.38
(878.18 to 1,272.92)−32.09 Papua New Guinea 145.04
(107.89 to 184.16)−9.17 3,110.77
(3,012.90 to 3,197.40)−0.30 341.01
(334.14 to 346.83)−0.73 2,902.74
(2,264.54 to 3,716.00)−11.30 Philippines 33.91
(27.86 to 43.05)−32.40 2,369.23
(2,198.59 to 2,555.03)15.56 173.94
(157.61 to 189.51)15.51 892.96
(766.35 to 1,039.35)−15.64 Samoa 57.97
(46.98 to 73.34)−37.63 1,287.61
(1,203.19 to 1,375.80)−25.78 129.28
(121.15 to 137.41)−20.45 1,160.08
(942.91 to 1,436.97)−39.18 Solomon Islands 102.97
(81.53 to 123.17)−9.61 1,478.48
(1,386.41 to 1,575.48)−10.38 150.37
(142.29 to 159.75)−9.18 2,178.62
(1,719.53 to 2,655.79)−14.18 Timor−Leste 56.39
(43.06 to 71.96)−7.75 2,492.41
(2,344.77 to 2,649.63)31.12 187.89
(177.33 to 199.98)27.76 1175.44
(941.14 to 1450.17)−8.24 Vanuatu 83.26
(63.19 to 107.90)−25.90 1,627.39
(1,520.08 to 1,741.72)−17.83 166.40
(155.45 to 178.01)−18.03 1,735.44
(1,326.72 to 2,253.60)−25.80 Viet Nam 37.84
(14.36 to 47.18)−27.42 2,880.70
(2,743.59 to 3,024.59)40.65 217.34
(207.68 to 227.25)39.43 826.07
(451.52 to 990.91)−19.15 Mongolia 19.63
(15.99 to 24.69)−45.96 1,266.20
(1,179.48 to 1,354.73)−22.85 84.27
(79.30 to 89.75)−25.04 411.34
(339.17 to 516.69)−46.57 Note. DALY, means disability−adjusted life years; UI, means uncertainty interval. Table 1. Age-standardized mortality, prevalence, incidence, and DALY rates of chronic obstructive pulmonary disease (COPD) per 100,000 in selected Asia-Pacific countries and territories in 2019 and variation trends in 1990–2019
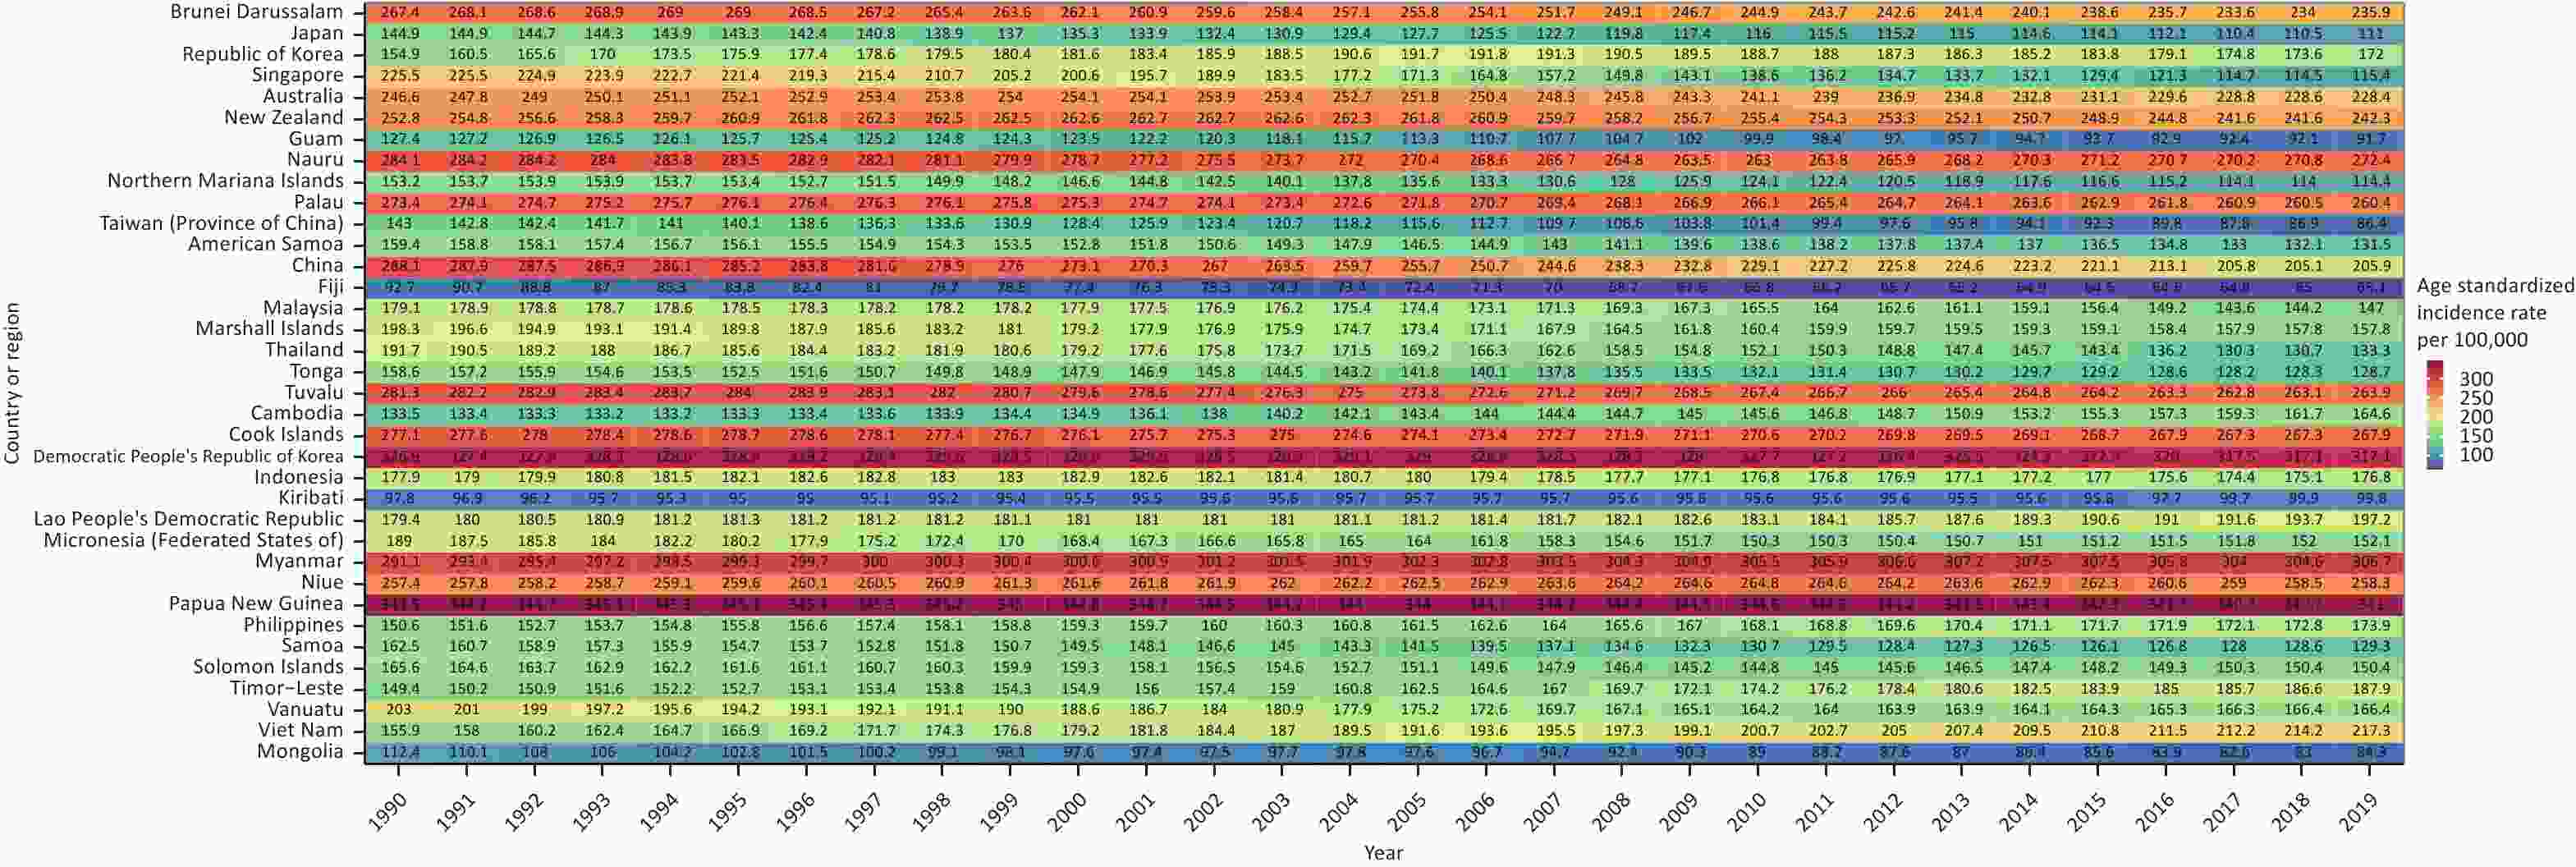
Figure 1. Heatmap showing change trends in age-standardized incidence rates of COPD between 1990 and 2019 in all 36 selected countries and territories.
Table 2 provides the results of the joinpoint regression analysis of COPD incidence rates. The AAPC exhibited considerable variation, ranging from −2.4% [95% confidence interval (CI) −2.6 to −2.2] for Singapore to 1.1% (95% CI: 1.1 to 1.2) for Vietnam. The incidence rate in each selected country or territory was provided for two or three consecutive periods. Most countries and territories had a decreasing trend in the COPD incidence rate between 1990 and 2019. Several countries or territories experienced a rapid decline in the early 2010s, such as Taiwan, China (APC = −2.2% [95% CI: −2.3 to −2.2] from 1997 to 2017), and Singapore (APC = −3.6% [95% CI: −4.0 to −3.2] from 1999 to 2010). The declining trends in mortality over the past 30 years were similar to those in incidence. The findings of the joinpoint regression analysis of COPD mortality rates in the 36 selected Asia-Pacific countries and territories are provided in Supplementary Table S2.
Country or region The whole period Period 1 Period 2 Period 3 Period AAPC Period APC Period APC Period APC High income Brunei Darussalam (A) 1990−2019 −0.4 (−0.5, −0.4) 1990−1996 0.1 (−0.0, 0.3) 1996−2017 −0.7 (−0.7, −0.6) 2017−2019 0.1 (−0.8, 1.0) Japan (A) 1990−2019 −1.0 (−1.1, −0.9) 1990−1997 −0.3 (−0.6, −0.1) 1997−2010 −1.5 (−1.6, −1.4) 2010−2019 −0.7 (−0.9, −0.5) Republic of Korea (A) 1990−2019 0.4 (0.2, 0.5) 1990−1994 2.8 (2.0, 3.7) 1994−2007 0.8 (0.7, 1.0) 2007−2019 −0.9 (−1.1, −0.7) Singapore (A) 1990−2019 −2.4 (−2.6, −2.2) 1990−1999 −0.9 (−1.4, −0.5) 1999−2010 −3.6 (−4.0, −3.2) 2010−2019 −2.3 (−2.8, −1.9) Australia (A) 1990−2019 −0.3 (−0.3, −0.2) 1990−2003 0.2 (0.2, 0.3) 2003−2016 −0.8 (−0.9, −0.8) 2016−2019 −0.1 (−0.6, 0.3) New Zealand (A) 1990−2019 −0.2 (−0.2, −0.1) 1990−1996 0.6 (0.4, 0.8) 1996−2006 −0.0 (−0.1, 0.1) 2006−2019 −0.6 (−0.7, −0.6) Guam (A) 1990−2019 −1.1 (−1.2, −1.1) 1990−2001 −0.3 (−0.4, −0.3) 2001−2012 −2.2 (−2.3, −2.2) 2012−2019 −0.7 (−0.9, −0.6) Nauru (A) 1990−2019 −0.1 (−0.2, −0.1) 1990−1998 −0.1 (−0.2, −0.0) 1998−2009 −0.6 (−0.7, −0.5) 2009−2019 0.4 (0.3, 0.4) Northern Mariana Islands (A) 1990−2019 −1.0 (−1.1, −1.0) 1990−1998 −0.2 (−0.4, −0.1) 1998−2014 −1.7 (−1.7, −1.6) 2014−2019 −0.5 (−0.8, −0.3) Palau (A) 1990−2019 −0.2 (−0.2, −0.2) 1990−1999 0.1 (0.1, 0.2) 1999−2011 −0.3 (−0.4, −0.3) 2011−2019 −0.3 (−0.3, −0.2) Taiwan, China (A) 1990−2019 −1.7 (−1.9, −1.6) 1990−1997 −0.7 (−0.9, −0.4) 1997−2017 −2.2 (−2.3, −2.2) 2017−2019 −0.7 (−2.3, 1.0) Upper middle income American Samoa (A) 1990−2019 −0.6 (−0.7, −0.6) 1990−2001 −0.4 (−0.5, −0.3) 2001−2009 −1.0 (−1.2, −0.9) 2009−2019 −0.6 (−0.7, −0.5) China (B) 1990−2019 −1.2 (−1.3, −1.1) 1990−1999 −0.5 (−0.7, −0.2) 1999−2019 −1.6 (−1.7, −1.5) Fiji (A) 1990−2019 −1.2 (−1.3, −1.2) 1990−1996 −2.0 (−2.1, −1.8) 1996−2012 −1.4 (−1.5, −1.4) 2012−2019 −0.1 (−0.2, 0.0) Malaysia (A) 1990−2019 −0.8 (−1.0, −0.6) 1990−2004 −0.1 (−0.3, 0.0) 2004−2013 −1.0 (−1.4, −0.7) 2013−2019 −2.0 (−2.5, −1.4) Marshall Islands (A) 1990−2019 −0.8 (−0.9, −0.7) 1990−2006 −0.9 (−1.0, −0.9) 2006−2009 −1.9 (−2.9, −0.9) 2009−2019 −0.2 (−0.3, −0.2) Thailand (B) 1990−2019 −1.3 (−1.4, −1.2) 1990−2003 −0.7 (−0.9, −0.5) 2003−2019 −1.8 (−2.0, −1.7) Tonga (A) 1990−2019 −0.7 (−0.8, −0.7) 1990−2004 −0.7 (−0.7, −0.6) 2004−2010 −1.4 (−1.6, −1.3) 2010−2019 −0.3 (−0.4, −0.3) Tuvalu (A) 1990−2019 −0.2 (−0.3, −0.2) 1990−1996 0.2 (0.1, 0.2) 1996−2012 −0.4 (−0.4, −0.4) 2012−2019 −0.1 (−0.2, −0.1) Low to middle income Cambodia (A) 1990−2019 0.7 (0.6, 0.8) 1990−1997 −0.0 (−0.3, 0.2) 1997−2012 0.7 (0.7, 0.8) 2012−2019 1.4 (1.1, 1.6) Cook Islands (A) 1990−2019 −0.1 (−0.1, −0.1) 1990−1995 0.1 (0.1, 0.2) 1995−2017 −0.2 (−0.2, −0.2) 2017−2019 0.1 (−0.2, 0.3) Democratic People’s
Republic of Korea (A)1990−2019 −0.1 (−0.1, −0.1) 1990−2000 0.1 (0.0, 0.1) 2000−2012 −0.1 (−0.1, −0.0) 2012−2019 −0.5 (−0.6, −0.4) Indonesia (A) 1990−2019 −0.1 (−0.1, −0.0) 1990−1999 0.3 (0.2, 0.4) 1999−2009 −0.4 (−0.5, −0.3) 2009−2019 −0.1 (−0.2, −0.0) Kiribati (A) 1990−2019 0.1 (0.0, 0.2) 1990−1994 −0.6 (−1.0, −0.3) 1994−2014 0.0 (−0.0, 0.1) 2014−2019 1.0 (0.7, 1.2) Lao People’s
Democratic Republic (B)1990−2019 0.3 (0.3, 0.3) 1990−2009 0.0 (0.0, 0.1) 2009−2019 0.7 (0.7, 0.8) Micronesia
(Federated States of) (A)1990−2019 −0.7 (−0.9, −0.6) 1990−2006 −1.0 (−1.1, −0.9) 2006−2010 −1.7 (−2.6, −0.8) 2010−2019 0.2 (0.0, 0.3) Myanmar (A) 1990−2019 0.2 (0.1, 0.2) 1990−1993 0.8 (0.4, 1.1) 1993−2014 0.1 (0.1, 0.2) 2014−2019 −0.1 (−0.3, 0.0) Niue (B) 1990−2019 0.0 (−0.0, 0.0) 1990−2011 0.1 (0.1, 0.1) 2011−2019 −0.3 (−0.4, −0.3) Papua New Guinea (A) 1990−2019 −0.0 (−0.1, −0.0) 1990−1994 0.1 (0.0, 0.2) 1994−2013 −0.0 (−0.0, −0.0) 2013−2019 −0.2 (−0.2, −0.1) Philippines (A) 1990−2019 0.5 (0.4, 0.5) 1990−2006 0.4 (0.4, 0.5) 2006−2011 0.7 (0.4, 1.1) 2011−2019 0.3 (0.2, 0.4) Samoa (A) 1990−2019 −0.8 (−0.8, −0.7) 1990−2002 −0.8 (−0.9, −0.7) 2002−2013 −1.4 (−1.5, −1.3) 2013−2019 0.4 (0.2, 0.6) Solomon Islands (A) 1990−2019 −0.3 (−0.3, −0.3) 1990−2001 −0.4 (−0.4, −0.3) 2001−2009 −1.1 (−1.2, −1.1) 2009−2019 0.4 (0.4, 0.5) Timor−Leste (A) 1990−2019 0.8 (0.8, 0.8) 1990−2002 0.4 (0.4, 0.4) 2002−2014 1.3 (1.3, 1.3) 2014−2019 0.5 (0.4, 0.6) Vanuatu (A) 1990−2019 −0.7 (−0.7, −0.6) 1990−2001 −0.7 (−0.8, −0.7) 2001−2010 −1.5(−1.6, −1.4) 2010−2019 0.3 (0.2, 0.3) Viet Nam (A) 1990−2019 1.1 (1.1, 1.2) 1990−2004 1.4 (1.4, 1.4) 2004−2014 1.0 (0.9, 1.0) 2014−2019 0.7 (0.6, 0.8) Mongolia (A) 1990−2019 −1.1 (−1.3, −0.9) 1990−1998 −1.6 (−2.0, −1.2) 1998−2004 −0.2 (−0.9, 0.6) 2004−2019 −1.2 (−1.3, −1.0) Note. AAPC, average annual percent of change; APC, estimated annual percentage of change. Table 2. Joinpoint analysis for COPD incidence rates in 36 selected countries and territories between 1990 and 2019
Table 3 provides the data on the incidence, prevalence, mortality, and DALY rates of COPD per 100,000 people in 1990, 2010, and 2019, stratified by sex and age groups. The findings revealed that the rates of COPD increased with age in both sexes, as evidenced by the higher incidence, prevalence, mortality, and DALY rates in the older age groups. Furthermore, men consistently exhibited higher rates of COPD, including higher incidence, prevalence, mortality, and DALY rates than females across almost all age groups and years. Figure 2 provides additional insights into sex differences in COPD, depicting the ratios of COPD incidence, prevalence, mortality, and DALYs in males and females. The data indicates that from 1990 to 2019, the ratios remained relatively stable or slightly decreased in the younger age groups (0–14 years and 15–49 years) while showing a notable increase in the older age groups (50–69 years and ≥ 70 years). This suggests a rising disparity between males and females in terms of the COPD burden in older age groups.
Variables 1990 2010 2019 n Rate (95% CI) n Rate (95% CI) n Rate (95% CI) Male 0−14 years Mortality 1,062 0.38
(0.35−0.40)183 0.08
(0.07−0.09)116 0.05
(0.04−0.06)Prevalence 357,227 126.85
(126.43−127.26)278,563 121.15
(120.70−121.60)245,315 107.97
(107.54−108.40)Incidence 49,047 17.42
(17.26−17.57)36,993 16.09
(15.92−16.25)32,931 14.49
(14.34−14.65)DALYs lost 122,759 43.59
(43.35−43.83)42,764 18.60
(18.42−18.78)34,304 15.10
(14.94−15.26)15−49 years Mortality 25,375 4.86
(4.80−4.92)17,077 2.67
(2.63−2.71)12581 2.06
(2.02−2.09)Prevalence 4,909,584 940.26
(939.43−941.09)5,856,842 916.85
(916.11−917.59)4,924,542 804.75
(804.04−805.46)Incidence 392,645 75.20
(74.96−75.43)468,930 73.41
(73.20−73.62)400,279 65.41
(65.21−65.61)DALYs lost 1,697,346 325.07
(324.58−325.56)1,364,595 213.62
(213.26−213.98)1,071,591 175.21
(174.48−175.45)50−69 years Mortality 234,825 191.42
(190.65−192.20)156,334 76.48
(76.10−76.86)150748 55.32
(55.04−55.60)Prevalence 8,524,878 6,949.23
(6,944.73−6,953.73)12,038,537 5,889.17
(5,885.94−5,892.39)13,992,699 5,134.56
(5,134.94−5,137.18)Incidence 731,172 596.03
(594.67−597.39)1,055,326 516.26
(515.28−517.24)1,271,274 466.49
(465.68−467.30)DALYs lost 7,237,025 5,899.41
(5,895.24−5,903.58)5,363,027 2,623.55
(2,621.36−2,625.75)5,354,628 1,964.86
(1,963.21−1,966.51)≥ 70 years Mortality 470,507 1772.03
(1767.01−1777.04)596,613 1044.49
(1,041.85−1,047.12)615,245 794.44
(792.46−796.41)Prevalence 5,482,902 20649.75
(20634.36−20665.15)11,704,404 20,490.82
(20,480.35−20,501.29)14,644,663 189,009.95
(18,901.23−18,918.68)Incidence 481,163 1812.16
(1807.09−1817.23)967,802 1694.33
(1690.98−1697.67)1,266,158 1634.93
(1632.10−1637.75)DALYs lost 7,285,030 27436.94
(27419.97−27453.92)9,002,252 15760.18
(15750.73−15769.63)9,182,238 11,856.59
(11,849.39−11,863.79)Female 0−14 years Mortality 896 0.34
(0.32−0.36)195 0.10
(0.08−0.11)131 0.06
(0.05−0.08)Prevalence 343,031 130.70
(130.26−131.14)265,404 129.27
(128.78−129.76)248,016 122.14
(121.66−122.62)Incidence 46,548 17.74
(17.57−17.90)34,872 16.99
(16.81−17.16)33,328 16.41
(16.24−16.59)DALYs lost 116,466 44.38
(44.12−44.63)48,563 23.65
(23.44−23.86)41,031 20.21
(20.01−20.40)15−49 years Mortality 18,350 3.65
(3.60−3.71)9,529 1.54
(1.50−1.57)6,459 1.10
(1.07−1.13)Prevalence 4,635,599 923.28
(922.44−924.12)5,569,515 897.18
(896.44−897.92)4,944,981 842.40
(841.66−843.14)Incidence 356,547 71.01
(70.78−71.25)387,357 62.40
(62.20−62.59)334,332 56.95
(56.76−57.15)DALYs lost 1,450,759 288.95
(288.48−289.42)1119805 180.39
(180.05−180.72)880,701 150.03
(149.72−150.34)50−69 years Mortality 151,760 125.55
(124.92−126.18)78,879 38.72
(38.45−38.99)71,466 25.81
(25.62−26.00)Prevalence 8,026,063 6,639.78
(6,635.34−6,644.22)10,344,795 5,077.90
(5,074.89−5,080.92)13,021,934 4,703.64
(4,701.15−4,706.13)Incidence 648,834 536.77
(535.46−538.07)844,597 414.58
(413.70−415.47)1,127,005 407.08
(406.33−407.83)DALYs lost 5,029,776 4,161.02
(4,157.46−4,164.58)3,324,327 1631.80
(1630.06−1633.54)3,364,302 1,215.22
(1,213.93−1,216.51)≥70 years Mortality 508,067 1,398.69
(1,394.87−1,402.51)478,319 663.67
(661.80−665.54)468,585 479.42
(478.06−480.79)Prevalence 7,230,968 19,906.65
(19,893.66−19,919.63)12,670,108 17,579.85
(17,571.06−17,588.64)17,399,113 17,801.59
(1,7794.01−17,809.17)Incidence 570,545 1,570.69
(1,566.65−1,574.74)1,006,505 1,396.53
(1,393.82−1,399.24)1,384,561 1,416.59
(1,414.25−1,418.93)DALYs lost 7,595,794 20,911.11
(20,897.78−20,924.23)7,143,260 9,911.32
(9,904.42−9,918.22)7,219,380 73,86.38
(7,381.19−7,391.56)Note. CI. Confidence interval; DALY. disability−adjusted life years; Rate measures deaths/total patients/new patients/DALYs per 100,000 population. Table 3. Incidence, prevalence, mortality, and DALY cases and rates of COPD among males and females in selected Asia−Pacific regions in 1990, 2010, and 2019
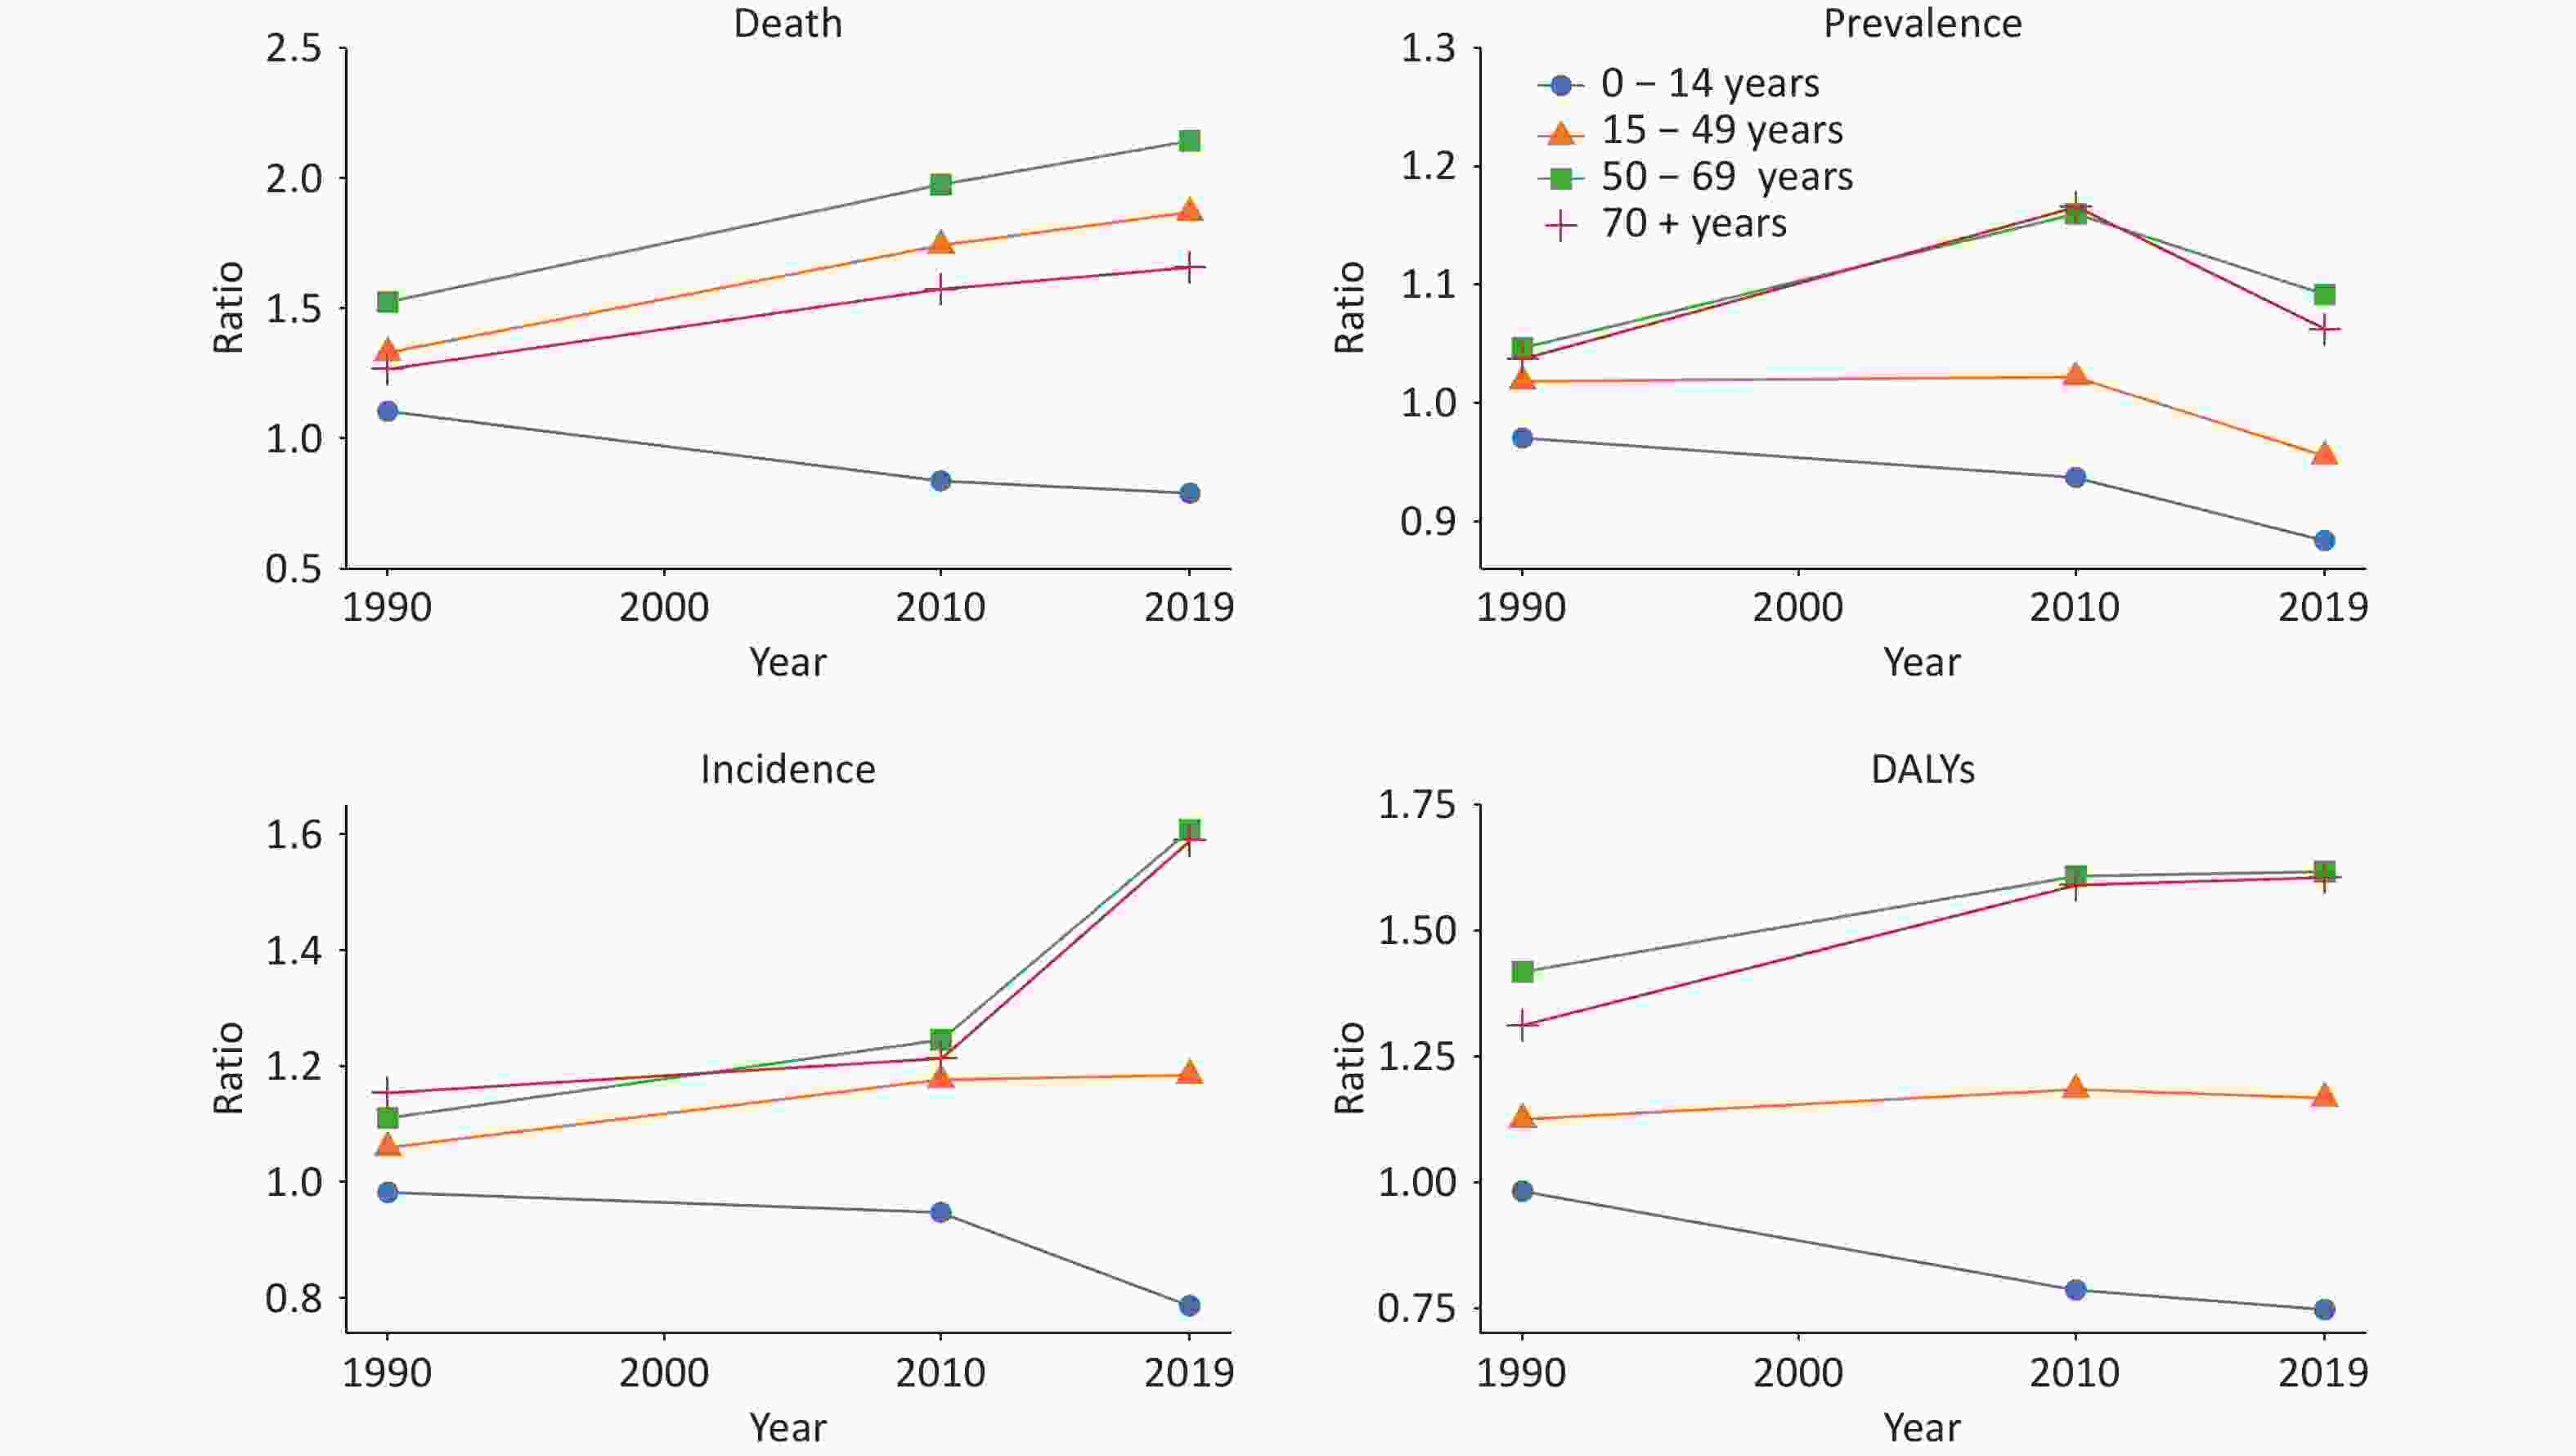
Figure 2. Ratio analysis of COPD mortality, prevalence, incidence, and DALY rates in males compared to females from 1990 to 2019.
-
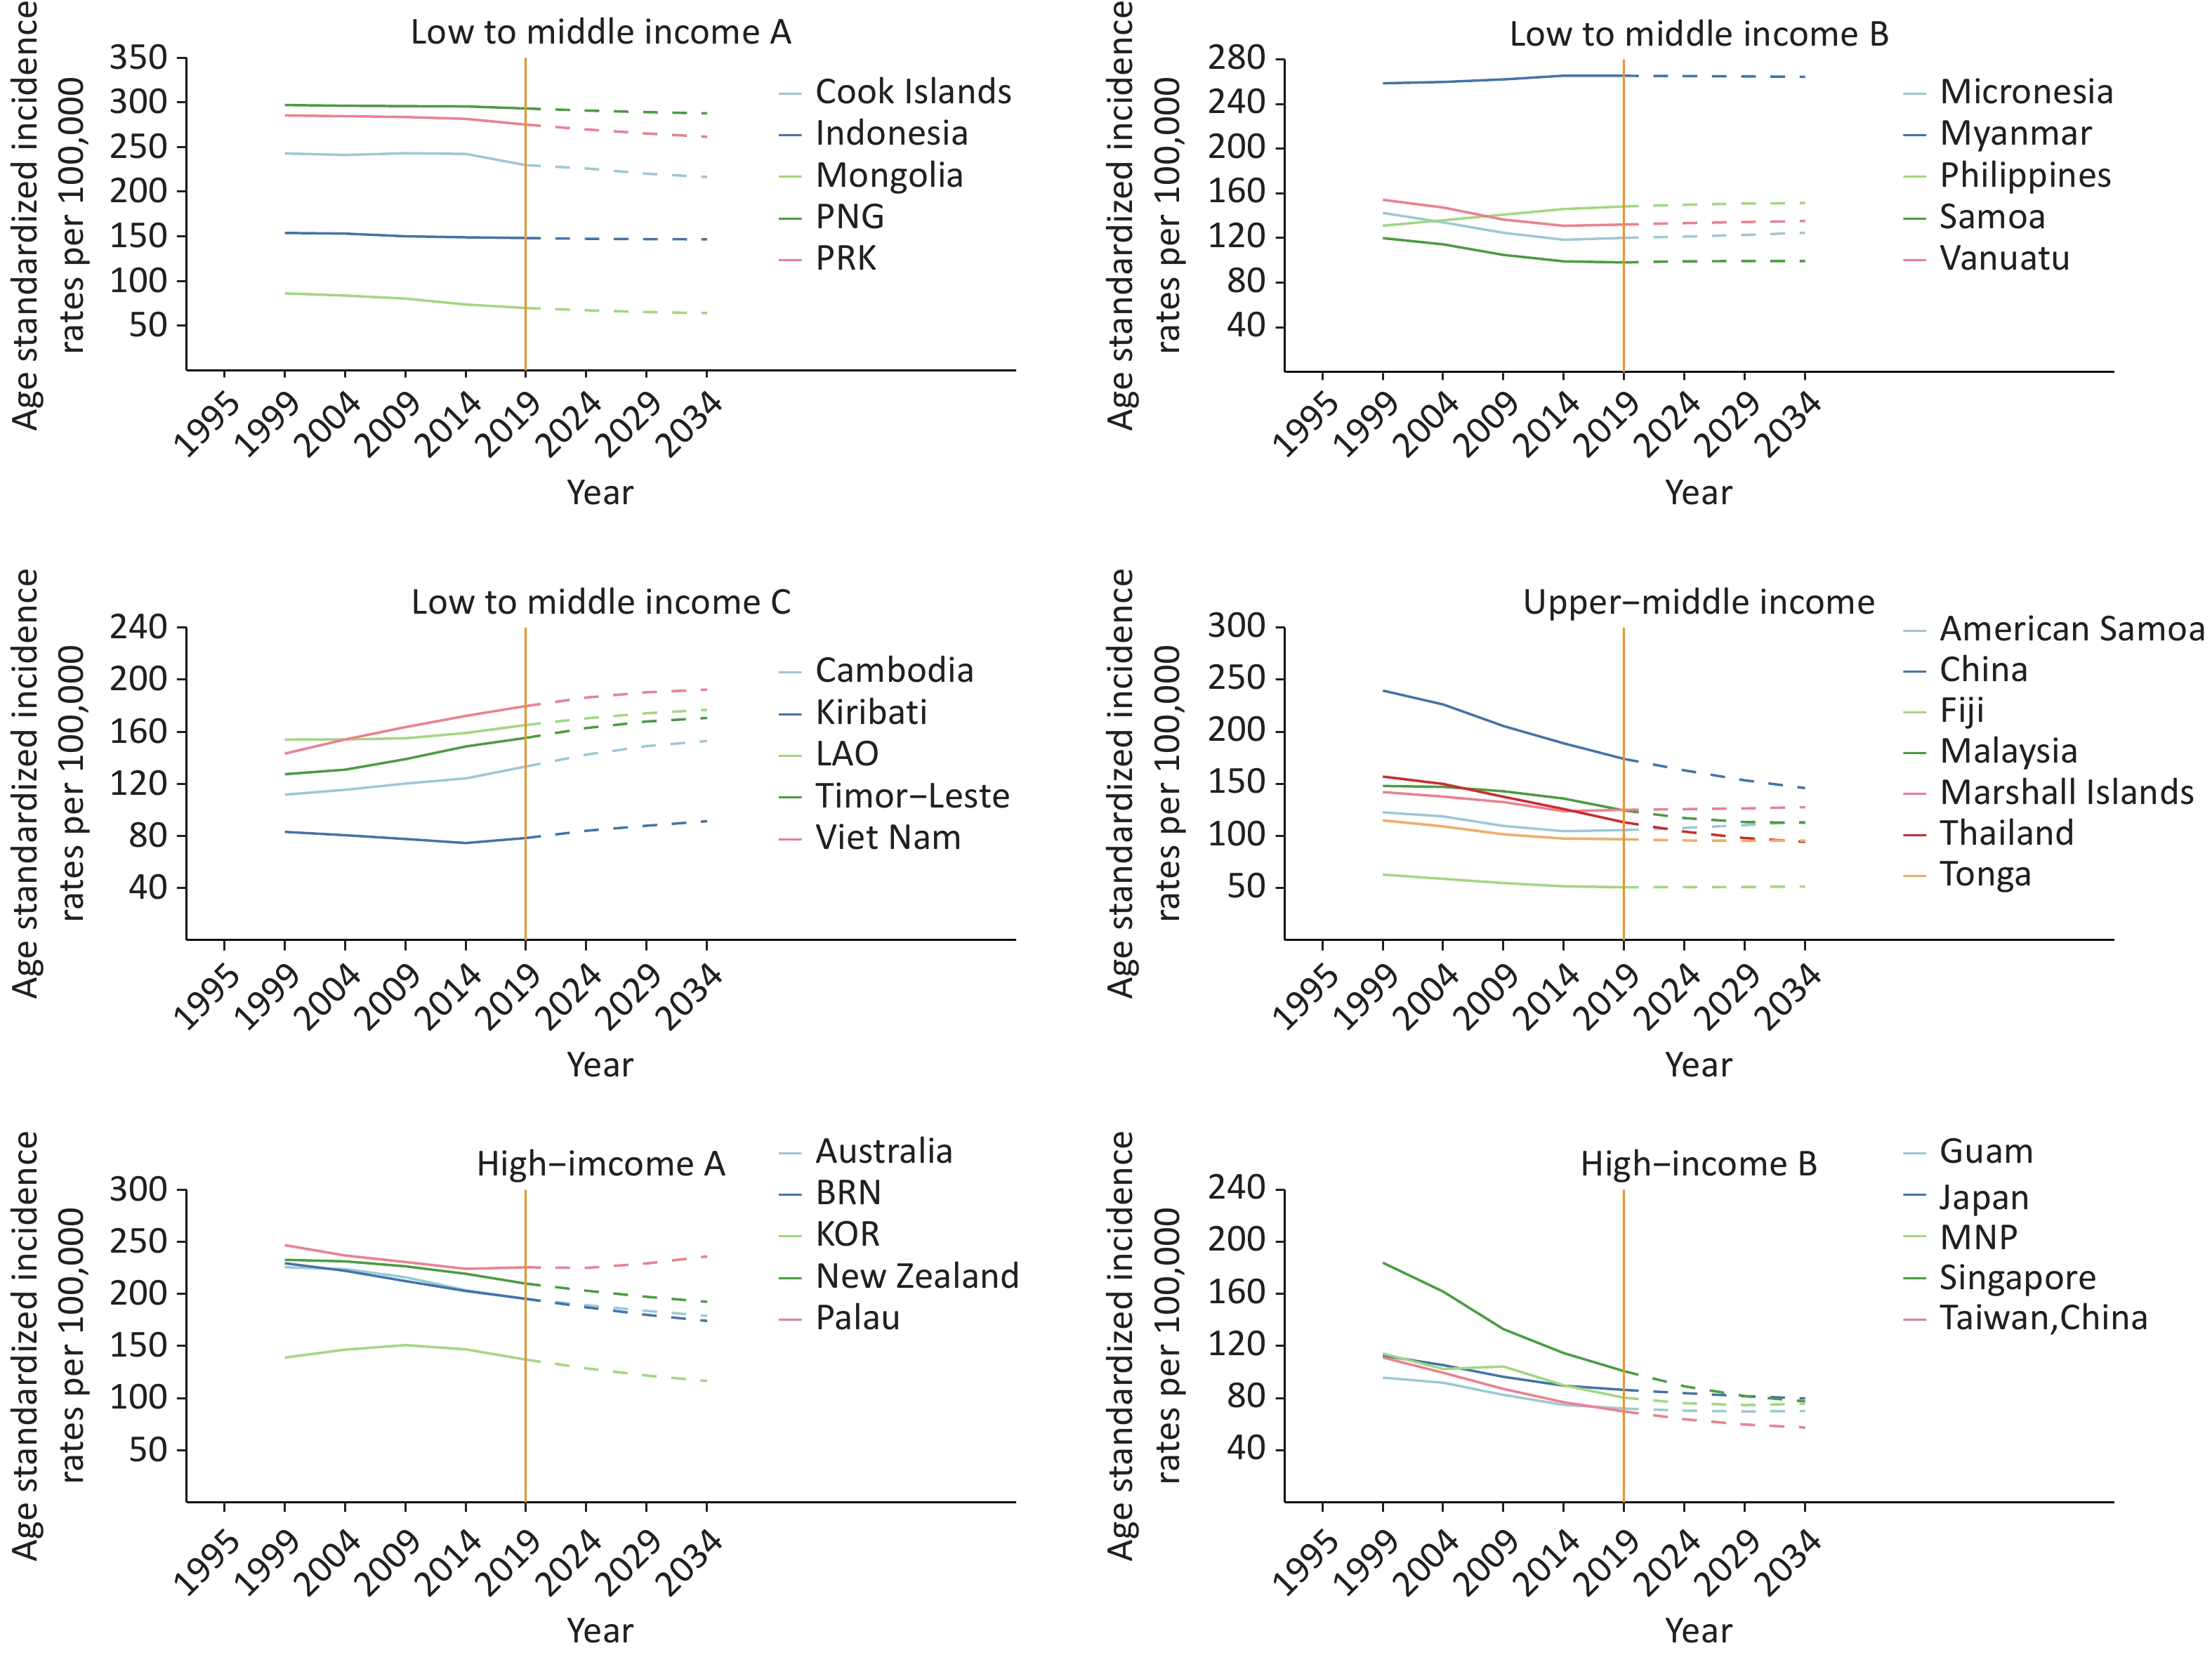
Figure 3 shows the observed and predicted incidence trends of COPD. The predicted incidence will remain stable or decrease gradually in most Asia-Pacific countries and territories. The projected incidence in most Asia-Pacific countries and territories is expected to remain stable or decrease gradually. Based on the GNI, the selected countries and territories were categorized into three groups. In the high-income group, Palau is projected to experience an increase in COPD incidence from 225.6 per 100,000 in 2019 to 236.1 per 100,000 in 2034, while other countries and territories in this group are anticipated to show a decline or remain stable. The incidence rates in most regions of the upper-middle-income group are expected to decrease slightly to below 200 per 100,000 by 2034. A few countries and territories in the low-to-middle-income group are projected to have lower COPD incidence rates or maintain their current levels by 2034. However, the other countries and territories in this group exhibit different trends. Cambodia, Kiribati, the Lao People’s Democratic Republic, Timor-Leste, and Vietnam are expected to show rising trends, particularly in Southeastern Asia. Considering the Lao People’s Democratic Republic and Vietnam as examples, the projected incidence rates are anticipated to significantly increase from 165.3 per 100,000 in 2019 to 177 per 100,000 in 2034 and 179.9 per 100,000 in 2019 to 192.5 per 100,000 in 2034, respectively. The findings of the linear regression analysis and prediction of COPD incidence rates in the selected Asia-Pacific countries and territories from 1990 to 2034 are shown in Supplementary Figure S2. They are similar to the age–period–cohort prediction model results.
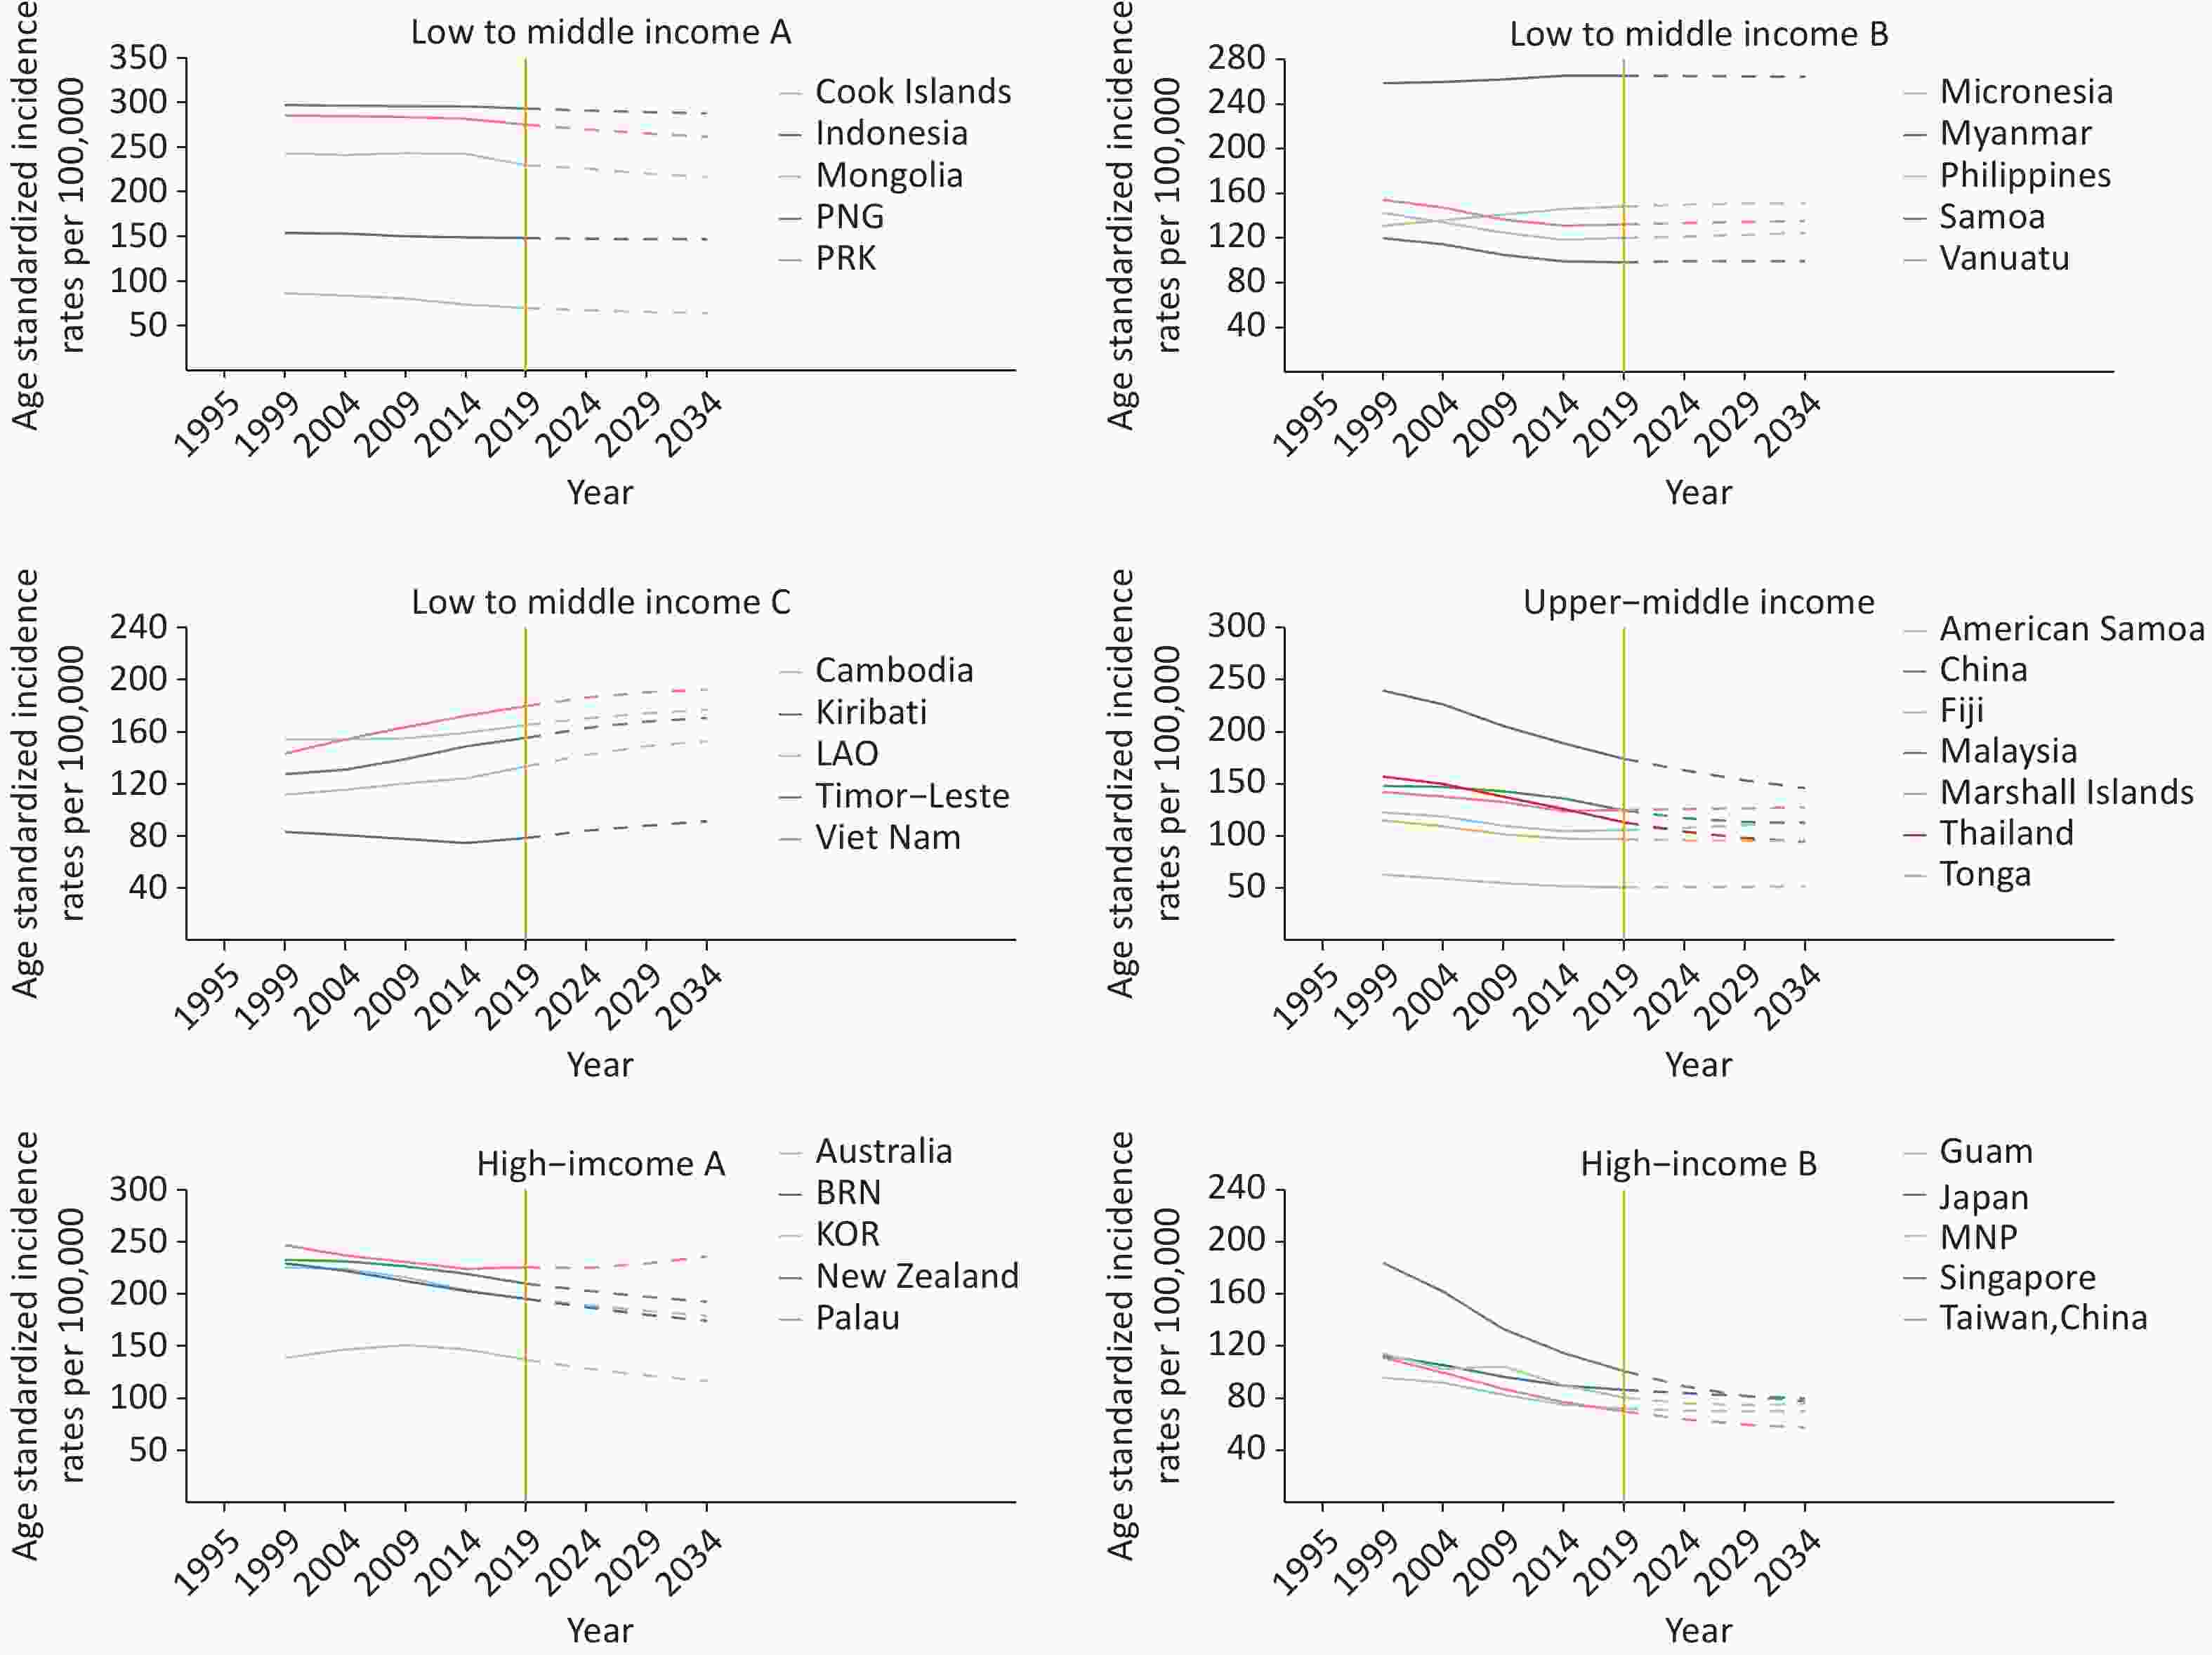
Figure 3. Trends in observed (solid lines) and predicted (dashed lines) COPD incidence rates in selected Asia-Pacific countries and territories, 1995–2034. PNG, Papua New Guinea; PRK, Democratic People’s Republic of Korea; Micronesia, Micronesia (Federated States of); LAO., Lao People’s Democratic Republic, BRN, Brunei Darussalam; KOR, Republic of Korea; and MNP, Northern Mariana Islands.
-
To the best of our knowledge, our study is the first systematic analysis of the observed trends in COPD incidence, prevalence, mortality, and DALY rates and a prediction of future trends in COPD incidence rates until 2034 in the Asia-Pacific region. Several key conclusions can be drawn from these findings. First, a consistent downward trend in COPD incidence, prevalence, mortality, and DALY rates was identified in the Asia-Pacific region from 1990 to 2019. This decline in incidence rates is projected to persist in most countries and territories for the next 15 years (2020–2034). Second, by analyzing historical changes in COPD incidence rates, we observed a period of rapid decline in the late 1990s, particularly in certain Eastern and Southeastern Asian countries and territories. Additionally, our comparison of incidence rates by age and sex revealed that older males are at a higher risk of developing COPD, and the disparity in incidence rates between the sexes continues to widen.
We discovered that COPD mortality and DALY rates in all Asia-Pacific areas have been decreasing, including traditionally high mortality and disease-burden areas such as China and Papua New Guinea. Mortality due to COPD is closely associated with its cardiovascular complications[34]. The decline in the mortality and disease burden of COPD is mainly due to improvements in treatment techniques and progress in the prevention of acute exacerbations and cardiovascular complications[34], which significantly improve the survival and quality of life of patients. However, COPD remains a significant threat to human health, and its disease burden cannot be underestimated. COPD continues to be one of the leading causes of mortality worldwide, largely due to its high prevalence[35]. According to the results of our study, the prevalence and incidence of COPD in most countries and territories showed a decline between 1990 and 2019. Nevertheless, the decline in prevalence and incidence was significantly slower than that in mortality and disease burden. The downward trends in prevalence and incidence may be the result of the fact that tobacco control and public health education campaigns have had certain positive impacts, such as reducing the frequency of tobacco consumption and increasing the quality of tobacco choices; however, the effect of existing measures on a large number of smokers is still limited[36]. In addition, air quality trends over the past two decades may have exerted similar influences. Overall, the exposure to air pollutants and the disease burden attributable to household air pollution have declined, particularly in China, potentially contributing to a decrease in the prevalence and incidence of COPD. However, Southeast Asia has the highest disease burden associated with household air pollution[37-38].
Our study explored the temporal trends in COPD incidence rates from 1990 to 2019 in the Asia-Pacific region. We observed that the incidence rates in almost all countries and regions either showed a slow decline or remained stable from 1990 to 2019. The COPD incidence rates in certain countries and territories, such as China, Taiwan (Province of China), and Singapore, decreased rapidly from the end of the 1990s to the 2010s. One possible explanation for this decline in COPD incidence is the implementation of tobacco control measures to reduce smoking prevalence. For example, China began recognizing the need for a national tobacco control coordinating body in the late 20th century. Subsequently, the Chinese Association on Tobacco Control was established, and the first tobacco control law was introduced[39]. Similarly, the Singaporean government implemented a national anti-smoking program in 1986, and Singapore remains one of the strictest countries in terms of tobacco consumption to this day[40]. Tobacco taxation is considered an effective method for tobacco control; however, it is not the only measure. Government agencies’ management and regulation through laws and regulations are essential for reducing tobacco consumption. This phenomenon may be related to a temporal or ecological association between the implementation of tobacco control measures and the rapid decline in COPD incidence observed in certain countries and territories in the Asia-Pacific region.
Previous studies have reported that the incidence, prevalence, mortality, and disease burden of COPD increase with age. Various factors, including the intrinsic characteristics of the disease and the cumulative impact of earlier exposure during younger years, shape this trend. Moreover, COPD has consistently been observed to be more prevalent in males than in females[17]. This sex disparity can be primarily attributed to several key factors. First, in the Asia-Pacific region, the proportion of males who smoke is significantly higher than that of females[41-42], which largely explains the differences in COPD prevalence across most age groups. In addition, compared to males, females are more likely to develop airflow restrictions and are more susceptible to indoor biomass fuel exposure because of their traditional role in household chores [43]. This provides evidence for sex differences in COPD vulnerability at younger ages. Over the past three decades, disparities between males and females in terms of COPD indicators and age groups have continued to widen. This suggests that while the effects of structural differences among traditional smokers persist, smoking among young females in the workforce is increasing, particularly in high-income countries[44]. As a result, the gaps in COPD incidence, prevalence, mortality, and disease burden between males and females may decrease.
According to our predictions, the incidence of COPD is expected to stabilize or gradually decrease in most countries and territories in the Asia-Pacific region between 2020 and 2034. This trend may be attributed to the reduction in tobacco consumption and air pollution in certain countries and territories, which have positively impacted the decline in COPD incidence. China, being one of the largest tobacco consumers in Asia and accounting for more than one-third of smokers worldwide[45], serves as an example. With the introduction of the “Air Pollution Prevention and Control Action Plan”[46] and “Tobacco Control: International Experience and China’s Strategy,” [47] along with a series of tobacco control and environmental protection policies implemented since then, air quality in China has improved since 2013, and there has been a decrease in male cigarette use, while female cigarette use has remained low[45]. However, certain countries and territories, particularly in Southeast Asia, may still experience higher COPD rates by 2034, which could be attributed to the persistently high air pollution levels and increasing smoking rates in that region. To address tobacco consumption and air pollution in Southeastern Asia[48], we recommend adopting successful tobacco control strategies from countries like Singapore and implementing stricter tobacco management and pollution prevention measures, such as tobacco taxation, tobacco advertising bans, and promoting clean energy use.
-
The strengths of this study include the systematic analysis of COPD trends in the Asia-Pacific region from 1990 to 2019, encompassing the incidence, prevalence, mortality, and disease burden, as well as projections for the next 15 years, thus providing valuable insights for public health policy decisions. However, certain limitations of our study should be noted before interpreting the results. First, underreporting and misdiagnosis influenced by the adjustment of diagnostic criteria and methods may have caused bias in the registration of the incidence, prevalence, mortality, and DALY rates, especially in less-developed countries and territories. Although the GBD has used many adjusted methods to reduce such bias, a few of these methods still led to an underestimation of COPD. Second, the data from the GBD 2019 did not count or disaggregate the incidence, prevalence, mortality, and DALY rates of COPD in urban and rural areas. Owing to the significant urban-rural differences in economic level, population structure, and medical conditions in countries and territories in the Asia-Pacific region, it is likely that the epidemiology and disease burden of COPD may show different trends in urban and rural areas. Due to data limitations, this study could not capture urban-rural differences in incidence, prevalence, and disease burden in this region. In addition, due to data limitations, the impact of micro factors, such as disease history, lifestyle, and occupational status, on the incidence of COPD was not fully discussed in this study, and it is hoped that future research could explore these associations in greater detail. Finally, our prediction model assumed that current and past trends in COPD incidence rates would continue without change, which means that future incidence rates would be less affected by possible developments in prevention and diagnosis. A well-designed mathematical model that includes these possible advanced influencing factors is required for future studies.
-
In summary, COPD incidence, prevalence, mortality, and disease burden in Asia-Pacific declined over 30 years, and most countries, except for a few, are expected to continue decreasing through 2034. However, the incidence of COPD is likely to increase in a few Southeast Asian countries and territories in the future, which may pose health risks.
Urgent efforts and approaches are needed for tobacco control, air pollution prevention, and public education, particularly in countries with a predicted increase in COPD incidence. Diversified measures and policies, including taxation, regulations, publicity, education, and medical coverage, are recommended for better tobacco control and environmental protection. In addition, medical resources, including medical devices and drugs related to COPD diagnosis, treatment, and health management, should be allocated as much as possible to Southeast Asia, where the incidence rates of COPD may show upward trends in the future, to prevent the health risks caused by COPD and its complications.
Disease burden and trends of COPD in the Asia-Pacific region (1990–2019) and predictions to 2034
doi: 10.3967/bes2025.040
- Received Date: 2024-05-24
- Accepted Date: 2025-02-25
-
Key words:
- : COPD /
- Asia-Pacific /
- incidence /
- disease burden /
- trends /
- prediction
Abstract:
All authors declare no conflict of interest.
Not applicable. Neither the study participants nor the public were involved in designing, planning, conducting, reporting or disseminating our research.
| Citation: | Jing Ma, Hong Mi. Disease burden and trends of COPD in the Asia-Pacific region (1990–2019) and predictions to 2034[J]. Biomedical and Environmental Sciences. doi: 10.3967/bes2025.040

|

 Quick Links
 DownLoad: